The Federal Tax System for the 2017 Tax Year
The 115th Congress has passed legislation that substantially changes the U.S. federal tax system (H.R. 1). This report describes the federal tax structure, provides some statistics on the tax system as a whole, as of 2017.
Historically, the largest component of the federal tax system, in terms of revenue generated, has been the individual income tax. In fiscal year (FY) 2016, $1.5 trillion, or 47% of the federal government’s revenue, was collected from the individual income tax. The corporate income tax generated another $300 billion in revenue in FY2016, or 9% of total revenue. Social insurance or payroll taxes generated $1.1 trillion, or 34% of revenue in FY2016. Revenues in 2016 were 17.8% of GDP, slightly above the post-World War II average of 17.3%.
The federal individual income tax is levied on an individual’s taxable income, which is adjusted gross income (AGI) less deductions and exemptions. Tax rates based on filing status (e.g., married filing jointly, head of household, or single individual) determine the level of tax liability. Tax rates in the United States are generally progressive, such that higher levels of income are typically taxed at higher rates. Once tentative tax liability is calculated, tax credits can be used to reduce tax liability. Tax deductions and tax credits are tools available to policymakers to increase or decrease the after-tax price of undertaking specific activities. Individuals with high levels of exemptions, deductions, and credits relative to income may be required to file under the alternative minimum tax (AMT).
Corporate taxable income is also subject to varying rates, where those with higher levels of income pay higher levels of taxes. Social Security and Medicare tax rates are, respectively, 12.4% and 2.9% of earnings. In 2017, Social Security taxes are levied on the first $127,200 of wages. Medicare taxes are assessed against all wage income. Federal excise taxes are levied on specific goods, such as transportation fuels, alcohol, and tobacco.
Looking at the tax system as a whole, several observations can be made. Notably, the composition of revenues has changed over time. Corporate income tax revenues have become a smaller share of overall tax revenues over time, while social insurance revenues have trended upwards as a share of total revenues. Social insurance revenues are a sizable component of the overall federal tax system. Most taxpayers pay more in payroll taxes than income taxes. Many taxpayers pay social insurance taxes but do not pay individual income taxes, having incomes below the amount that would generate a positive income tax liability. From an international perspective, the U.S. federal tax system tends to collect less in federal revenues as a percentage of GDP than other OECD countries.
This report reflects the tax system as in effect in 2017. H.R. 1, the 2017 tax revision, as passed in both the House and Senate, substantially modifies the federal tax system. The purpose of this report is to review the federal tax system in 2017. Any changes to the federal tax system enacted in the 115th Congress will be explored in subsequent reports and other CRS products.
The Federal Tax System for the 2017 Tax Year
Jump to Main Text of Report
Contents
- The Federal Income Tax System
- The Individual Income Tax
- Gross Income and Adjustments
- Exemptions and Deductions
- Tax Rates
- Net Investment Income
- Tax Credits
- Alternative Minimum Tax
- The Corporate Income Tax
- Corporate Income Earned Abroad
- Social Insurance and Retirement Payroll Taxes
- Estate and Gift Taxes
- Excise Taxes
- Tax Statistics
- Taxes as a Share of the Economy
- Composition of Tax Revenue
- The Distribution of the Tax Burden
- International Comparisons
- Concluding Remarks
Figures
- Figure 1. Tax Returns Claiming Standard and Itemized Deductions, 1990-2015
- Figure 2. Tax Returns Claiming Standard and Itemized Deductions, 1990-2015
- Figure 3. Tax Returns and AGI by Statutory Tax Rate
- Figure 4. Visualization of the U.S. Individual Income Tax System
- Figure 5. C Corporation Shares of Net Income and Business Returns
- Figure 6. Federal Revenue as a Percentage of GDP
- Figure 7. Composition of Federal Revenue
- Figure 8. Shares of Before-Tax Income and Federal Taxes
- Figure 9. Federal Income and Payroll Taxes, 2016
- Figure 10. Government Revenue as a Percentage of GDP
Tables
- Table 1. Personal Exemption and Standard Deduction, 2017
- Table 2. Statutory Marginal Tax Rates, 2017
- Table 3. Corporate Tax Rate Schedule
- Table 4. U.S. Fiscal Position Compared to Other Industrialized Nations, 2017
- Table A-1. Individual Income Tax Expenditures, 2016
- Table A-2. Corporate Tax Expenditures, 2016
Summary
The 115th Congress has passed legislation that substantially changes the U.S. federal tax system (H.R. 1). This report describes the federal tax structure, provides some statistics on the tax system as a whole, as of 2017.
Historically, the largest component of the federal tax system, in terms of revenue generated, has been the individual income tax. In fiscal year (FY) 2016, $1.5 trillion, or 47% of the federal government's revenue, was collected from the individual income tax. The corporate income tax generated another $300 billion in revenue in FY2016, or 9% of total revenue. Social insurance or payroll taxes generated $1.1 trillion, or 34% of revenue in FY2016. Revenues in 2016 were 17.8% of GDP, slightly above the post-World War II average of 17.3%.
The federal individual income tax is levied on an individual's taxable income, which is adjusted gross income (AGI) less deductions and exemptions. Tax rates based on filing status (e.g., married filing jointly, head of household, or single individual) determine the level of tax liability. Tax rates in the United States are generally progressive, such that higher levels of income are typically taxed at higher rates. Once tentative tax liability is calculated, tax credits can be used to reduce tax liability. Tax deductions and tax credits are tools available to policymakers to increase or decrease the after-tax price of undertaking specific activities. Individuals with high levels of exemptions, deductions, and credits relative to income may be required to file under the alternative minimum tax (AMT).
Corporate taxable income is also subject to varying rates, where those with higher levels of income pay higher levels of taxes. Social Security and Medicare tax rates are, respectively, 12.4% and 2.9% of earnings. In 2017, Social Security taxes are levied on the first $127,200 of wages. Medicare taxes are assessed against all wage income. Federal excise taxes are levied on specific goods, such as transportation fuels, alcohol, and tobacco.
Looking at the tax system as a whole, several observations can be made. Notably, the composition of revenues has changed over time. Corporate income tax revenues have become a smaller share of overall tax revenues over time, while social insurance revenues have trended upwards as a share of total revenues. Social insurance revenues are a sizable component of the overall federal tax system. Most taxpayers pay more in payroll taxes than income taxes. Many taxpayers pay social insurance taxes but do not pay individual income taxes, having incomes below the amount that would generate a positive income tax liability. From an international perspective, the U.S. federal tax system tends to collect less in federal revenues as a percentage of GDP than other OECD countries.
This report reflects the tax system as in effect in 2017. H.R. 1, the 2017 tax revision, as passed in both the House and Senate, substantially modifies the federal tax system. The purpose of this report is to review the federal tax system in 2017. Any changes to the federal tax system enacted in the 115th Congress will be explored in subsequent reports and other CRS products.
The 115th Congress has passed legislation that substantially changes the U.S. federal tax system (H.R. 1). This legislation builds on the September 27, 2017, "Unified Framework for Fixing our Broken Tax Code."1 This framework was intended to guide the tax writing committees' development of tax legislation.
The issue of tax reform is not new in the 115th Congress. The tax code has long been criticized for being overly complicated, unfair, and inefficient. Early in 2005, for example, President George W. Bush announced the establishment of a bipartisan panel to provide options to make the tax code "simpler, fairer, and more pro-growth."2 Tax reform was also considered in the context of deficit reduction in 2010. President Barack Obama created the National Commission on Fiscal Responsibility and Reform in 2010 to address the deficit and national debt. In December 2010, the Fiscal Commission released its final report, "A Moment of Truth," which included base-broadening, rate-reducing, revenue-raising tax reform as part of a broader fiscal reform package. During the 112th and 113th Congress, then-Chairman of the Ways and Means Committee, Dave Camp, released a series of tax reform discussion drafts, which ultimately became the Tax Reform Act of 2014. This proposal, which was intended to "fix America's broken tax code by lowering tax rates and making the code simpler and fairer for families and job creators" in a revenue-neutral manner was later introduced as H.R. 1.3 No further legislative action was taken.
The purpose of this report is to provide an overview of the federal tax system, including the individual income tax, corporate income tax, payroll taxes, estate and gift taxes, and federal excise taxes, as in effect through 2017.
The Federal Income Tax System
The federal income tax system has several components. The largest component, in terms of revenue generated, is the individual income tax. In fiscal year (FY) 2016, $1.5 trillion, or 47% of the federal government's revenue, came from the individual income tax.4 The corporate income tax generated another $300 billion in revenue in FY2016, or 9% of total revenue. Social insurance or payroll taxes generated $1.1 trillion, or 34% of revenue in FY2016. The remainder of federal revenue was collected through excise taxes (3%) or other sources (6%).5
The Individual Income Tax6
The individual income tax is the largest source of revenue in the federal income tax system. Most of the income reported on individual income tax returns is wages and salaries (68% in 2014).7 However, a large portion of business income in the United States is also taxed in the individual income tax system. Pass-through businesses, including sole proprietorships, partnerships, S corporations, and limited liability companies, generally pass business income through to the business's owners, where that income is then taxed under the individual income tax system.8
Gross Income and Adjustments
To levy an income tax, income must first be defined. As a benchmark, economists often turn to the Haig-Simons comprehensive income definitions which can differ from the measure of income used in computing a taxpayer's taxes. Under the Haig-Simons definition, taxable resources are defined as changes in a taxpayer's ability to consume during the tax year.9 Using this definition of income, an employer's contributions toward employee health insurance would be counted toward the employee's income. This income, however, is not included in the employee's taxable income under current tax law.
In practice, the individual income tax is based on gross income individuals accrue from a variety of sources. Included in the individual income tax base are wages, salaries, tips, taxable interest and dividend income, business and farm income, realized net capital gains, income from rents, royalties, trusts, estates, partnerships, taxable pension and annuity income, and alimony received.
Gross income, for tax purposes, excludes certain items which may deviate from the Haig-Simmons definition of income. For example, employer-provided health insurance, pension contributions, and certain other employee benefits are excluded from income subject to tax.10 Employer contributions to Social Security are also excluded from wages. Amounts received under life insurance contracts are excluded from income. Another exclusion from income is the interest received on certain state and local bonds.
There are special rules for income earned as capital gains or dividends.11 Capital gains (or losses) are realized when assets are sold.12 The tax base excludes unrealized capital gains.13 There are reduced tax rates for certain capital gains and dividends (discussed below in the "Tax Rates" section).14 As with ordinary income, there may be exclusions. For example, certain capital gains on sales of primary residences are excluded from income.
|
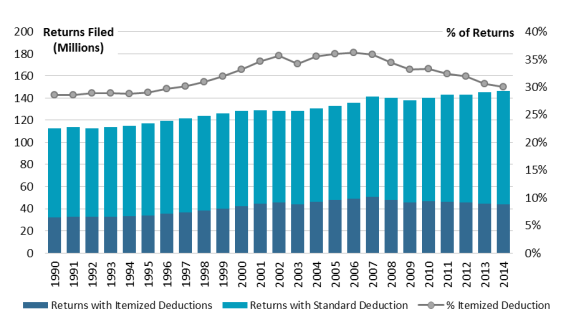
Taxpayers Claiming the Standard Deduction: Trends over Time In 2015, there were 148.4 million individual income tax returns filed claiming either the standard or itemized deduction (see Figure 1). In that same year, deductions were itemized on 44.6 million returns, with the rest of the returns filed using the standard deduction. Given these figures, 30% of taxpayers itemized deductions in 2015. The share of taxpayers itemizing deductions has declined in recent years. Between 2001 and 2008, the share of taxpayers itemizing deductions was closer to 35%. The share of taxpayers itemizing deductions in 2015 is closer to the share that itemized in the early to mid-1990s, when the itemization rate was below 30%.
|
Income from operating a business through a proprietorship, partnership, or small business corporation that elects to be treated similarly to a partnership (Subchapter S corporation), or through rental property is also subject to the individual income tax.15 This income is the net of gross receipts reduced by such deductible costs as payments to labor, depreciation, costs of goods acquired for resale and other inputs, interest, and taxes.
A taxpayer's adjusted gross income (AGI), the basic measure of income under the federal income tax, is determined by subtracting "above the line" deductions from gross income.16 Above-the-line deductions are available to taxpayers regardless of whether they itemize deductions, or claim the standard deduction.17 Above-the-line deductions may include contributions to qualified retirement plans by self-employed individuals, contributions to individual retirement accounts (IRAs), moving expenses, interest paid on student loans and higher education expenses, contributions to health savings accounts, and alimony payments.
Exemptions and Deductions
Tax liability depends on the filing status of the taxpayer. There are four main filing categories: married filing jointly, married filing separately, head of household, and single individual. The computation of taxpayers' tax liability depends on their filing status, as discussed further below. The amounts of the personal exemption and standard deduction also depend on filing status.
Taxpayers have a choice between claiming the standard deduction or claiming the sum of their itemized deductions. The standard deduction amount depends on filing status. The 2017 standard deduction for single filers is $6,350, while the standard deduction for married taxpayers filing jointly is twice that amount, or $12,700 (see Table 1). There is an additional standard deduction for the elderly (taxpayers age 65 and older) and the blind.18 The standard deduction amount is indexed for inflation.
After AGI is computed, personal exemptions and deductions are subtracted, further reducing the tax base. Exemptions are allowed for the taxpayer, the taxpayer's spouse, and each of the taxpayer's dependents. In 2017, the exemption amount per person is $4,050 (Table 1). The exemption amount is indexed for inflation.19 The personal exemption is phased out for higher-income taxpayers. In 2017, the personal exemption phaseout (PEP) begins when a taxpayer's AGI exceeds $261,500 (for those filing as singles), $287,650 (for those filing as head of household), or $313,800 (for married individuals filing jointly). These threshold amounts are adjusted for inflation. The personal exemption phaseout reduces a taxpayer's personal exemption by 2% for each $2,500 in AGI above the phaseout threshold for married filers filing jointly ($1,250 for single filers).20
|
Amount |
||
|
Personal Exemption |
$4,050 |
|
|
Standard Deductiona |
||
|
Single or Married Filing Separately |
$6,350 |
|
|
Head of Household |
$9,350 |
|
|
Married Filing Jointly |
$12,700 |
|
Taxpayers also have the option of itemizing deductions. Deductions that can be itemized include deductions for state and local taxes (income taxes, sales taxes, and personal property taxes, sometimes referred to as SALT),21 the mortgage interest deduction,22 the deduction for charitable contributions,23 and the deduction for real property taxes.24 Some deductions can only be itemized and claimed in excess of a floor. For example, medical expenses can be deducted to the extent they exceed 10% of AGI. Casualty and theft losses can also be deducted in excess of 10% of AGI. Other miscellaneous expenses can be deducted in excess of 2% of AGI.25
Itemized deductions are subject to limitation above certain income thresholds (this limitation is known as the Pease limitation).26 This limitation reduces the amount of itemized deductions that can be claimed by 3% of the amount of certain thresholds. In 2017 these thresholds are AGI above $261,500 for single filers, $287,650 for head of household filers, $313,800 for married taxpayers filing jointly, and $156,900 for married taxpayers filing separately. These threshold amounts are adjusted for inflation. The total reduction in itemized deductions cannot be greater than 80% of total deductions (the taxpayer may also elect to claim the standard deduction). Certain deductions are not subject to the Pease limitation, including the deductions for medical expenses and casualty and theft losses.
|
Taxpayers Claiming the Standard Deduction: Trends over Time In 2015, there were 148.4 million individual income tax returns filed claiming either the standard or itemized deduction (see Figure 2). In that same year, deductions were itemized on 44.6 million returns, with the rest of the returns filed using the standard deduction. Given these figures, 30% of taxpayers itemized deductions in 2015. The share of taxpayers itemizing deductions has declined in recent years. Between 2001 and 2008, the share of taxpayers itemizing deductions was closer to 35%. The share of taxpayers itemizing deductions in 2015 is closer to the share that itemized in the early to mid-1990s, when the itemization rate was below 30%.27
|
Tax Rates
The income tax system is designed to be progressive, with marginal tax rates increasing as income increases.28 At a particular marginal tax rate, all individuals subject to the regular income tax, regardless of their overall level of earnings, pay the same tax rate on taxable income within the bracket. Once taxpayers' incomes surpass a threshold level, placing them in a higher marginal tax bracket, the higher marginal tax rate is only applied on income that exceeds that threshold value. Currently, the individual income tax system has seven marginal income tax rates: 10%, 15%, 25%, 28%, 33%, 35%, and 39.6%.29 These marginal income tax rates are applied to taxable income to arrive at a taxpayer's gross income tax liability.30 Threshold levels associated with the rate brackets depend on filing status. Tax rates for 2017 are summarized in Table 2.
|
Married Filing Jointly |
|||
|
If taxable income is: |
Then, tax is: |
||
|
$0 |
to |
$18,650 |
10% of the amount over $0 |
|
$18,650 |
to |
$75,900 |
$1,865 plus 15% of the amount over $18,650 |
|
$75,900 |
to |
$153,100 |
$10,452.50 plus 25% of the amount over $75,900 |
|
$153,100 |
to |
$233,350 |
$29,752.50 plus 28% of the amount over $153,100 |
|
$233,350 |
to |
$416,700 |
$52,222.50 plus 33% of the amount over $233,350 |
|
$416,700 |
to |
$470,700 |
$112,728 plus 35% of the amount over $416,700 |
|
$470,700 |
plus |
$131,628 plus 39.6% of the amount over $470,700 |
|
|
Single |
|||
|
If taxable income is: |
Then, tax is: |
||
|
$0 |
to |
$9,325 |
10% of the amount over $0 |
|
$9,325 |
to |
$37,950 |
$932.50 plus 15% of the amount over $9,325 |
|
$37,950 |
to |
$91,900 |
$5,226.25 plus 25% of the amount over $37,950 |
|
$91,900 |
to |
$191,650 |
$18,713.75 plus 28% of the amount over $91,900 |
|
$191,650 |
to |
$416,700 |
$46,643,75 plus 33% of the amount over $191,650 |
|
$416,700 |
to |
$418,400 |
$120,910.25 plus 35% of the amount over $416,700 |
|
$418,400 |
plus |
$121,505.25 plus 39.6% of the amount over $418,400 |
|
|
Heads of Households |
|||
|
If taxable income is: |
Then, tax is: |
||
|
$0 |
to |
$13,350 |
10% of the amount over $0 |
|
$13,350 |
to |
$50,800 |
$1,335 plus 15% of the amount over $13,350 |
|
$50,800 |
to |
$131,200 |
$6,952.50 plus 25% of the amount over $50,800 |
|
$131,200 |
to |
$212,500 |
$27,052.50 plus 28% of the amount over $131,200 |
|
$212,500 |
to |
$416,700 |
$49,816.50 plus 33% of the amount over $212,500 |
|
$416,700 |
to |
$444,550 |
$117,202.50 plus 35% of the amount over $416,700 |
|
$444,550 |
plus |
$126,950 plus 39.6% of the amount over $444,550 |
|
Source: Internal Revenue Code.
As was noted above, income earned from long-term capital gains and qualified dividends is taxed at lower rates. The maximum rate on long-term capital gains and qualified dividends is 20%. This 20% rate applies to taxpayers in the 39.6% bracket. Taxpayers in the 25%, 28%, 33%, and 35% tax brackets face a 15% tax rate on long-term capital gains and qualified dividends. The tax rate on capital gains and qualified dividends is 0% for taxpayers in the 10% and 15% tax brackets.
Higher-income individuals with a high ratio of exemptions and deductions to income may be subject to the alternative minimum tax (AMT). There are two marginal tax rates under the AMT, 26% and 28%, that are applied to an expanded base. The AMT is discussed in further detail below.
|
Tax Returns and AGI by Statutory Tax Bracket Figure 3 classifies returns according to the highest statutory tax rate applied to each return. Few tax returns filed fall into the top statutory tax bracket. In 2015, 88% of returns filed were for ordinary income in the 25% bracket or below. Less than 1% of returns filed in 2015 were in the 39.6% tax bracket. Returns filed in higher tax brackets contain a larger proportion of reported AGI. In 2015, nearly 16% of AGI was reported on returns filed in the top statutory rate bracket of 39.6%. Not all AGI reported on returns in the 39.6% statutory bracket is taxed at a rate of 39.6%. Roughly half of AGI reported on returns in the 39.6% bracket is taxed at a rate of 39.6%, with the rest taxed at lower rates, per the progressive rate structure.
|
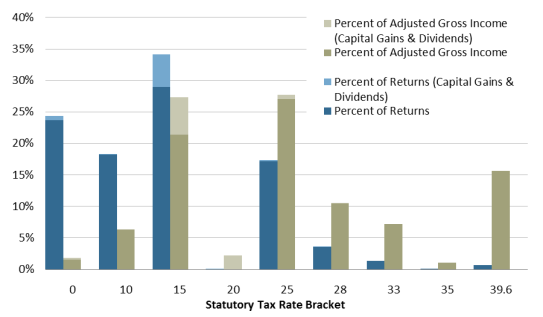
Few taxpayers file returns that are taxed at the top statutory tax rate (see Figure 3 and the related discussion). However, while less than 1% of returns filed are in the 39.6% tax bracket, nearly 16% of AGI was reported on returns that fell in the 39.6% bracket.
Net Investment Income
Certain higher-income individuals may be subject to an additional 3.8% tax on net investment income. Specifically, the tax applies to the lesser of (1) net investment income, or (2) the amount by which modified AGI exceeds fixed threshold amounts.31 The fixed threshold amounts are $250,000 for taxpayers filing jointly and $200,000 for other filers.32 The net investment income tax increases the maximum tax rate on capital gains and dividends to 23.8% for affected taxpayers. The maximum rate on other investment income, including interest, annuities, royalties, and rent is 43.4% for taxpayers with modified AGI above the threshold.
Tax Credits
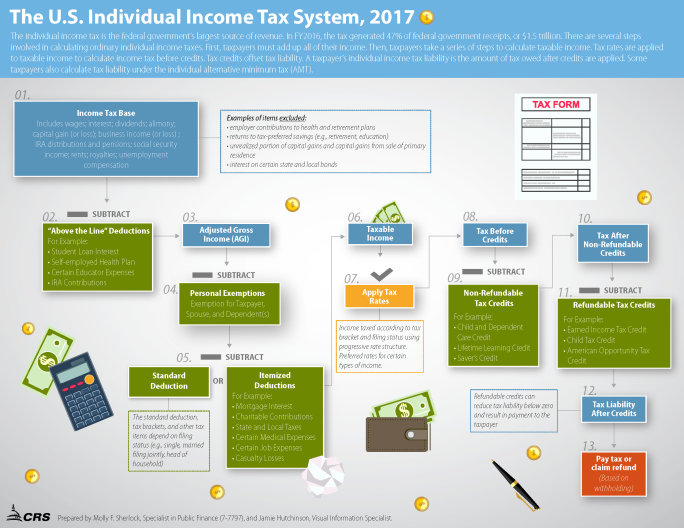
After a taxpayer's tax liability has been calculated, tax credits are subtracted from gross tax liability to arrive at a final tax liability (see Figure 4). Tax credits offset tax liability on a dollar-for-dollar basis. There are two different types of tax credits: refundable and nonrefundable. If a tax credit is refundable, and the credit amount exceeds tax liability, a taxpayer receives the credit (or a portion of the credit) as a refund. If credits are not refundable, then the credit is limited to the amount of tax liability. In some cases, unused credits can be carried forward to offset tax liability in future tax years. Some credits are phased out as income rises to limit or eliminate benefits for higher-income taxpayers.
Tax credits that are refundable or have a refundable portion include the earned income tax credit (EITC)33 and the child tax credit (CTC).34 A nonrefundable tax credit can be claimed for child and dependent care expenses.35 There are also tax credits for other purposes, such as education36 and health care. The American Opportunity Tax Credit (AOTC), for example, provides a partially refundable tax credit for tuition and other related expenses.37
|
Figure 4. Visualization of the U.S. Individual Income Tax System |
 |
|
Source: Congressional Research Service, CRS Infographic IG10010, The U.S. Individual Income Tax System, 2017, November 20, 2017. |
Given the complexities of the tax code, effective marginal tax rates differ from statutory marginal tax rates for many taxpayers.38 For example, the earned income tax credit (EITC) phases in as income increases, reducing a taxpayer's marginal tax rate. At higher income levels, as the credit phases out, the taxpayer faces a higher marginal tax rate during that phaseout range. Thus, effective marginal tax rates can be less than or greater than statutory rates.
Alternative Minimum Tax
Individuals may also pay tax under the alternative minimum tax (AMT).39 The AMT applies lower tax rates to a broader income base. The policy goal is to prevent certain higher-income taxpayers from using tax preferences to avoid paying anything in taxes. Under current law, to calculate the AMT, an individual first adds back various tax items, including personal exemptions and certain itemized deductions, to regular taxable income. This grossed up amount becomes the income base for the AMT.
The AMT exemption is subtracted from the AMT's income base. For 2017, the AMT exemption is $54,300 for single returns, and $84,500 for married taxpayers filing a joint return.40 These exemption amounts are indexed for inflation. The AMT exemption is reduced by 25% of the amount by which a taxpayer's AMT taxable income exceeds certain threshold amounts. In 2017, the AMT exemption amount begins to phase out at $120,700 for single filers, or $160,900 for married couples filing jointly.
A two-tiered rate structure of 26% and 28% is assessed against AMT taxable income. The taxpayer compares his AMT tax liability to his regular tax liability and pays the greater of the two. Most nonrefundable personal tax credits are allowed against the AMT.
Under current law, less than 4% of all tax filers pay the AMT.41 Higher-income taxpayers are more likely to be subject to the AMT (for 2017, the Tax Policy Center estimates that 63% of tax units with income between $500,000 and $1 million will pay the AMT, and 20% of taxpayers with income of more than $1 million pay the AMT). Taxpayers with more children, and married taxpayers, are also more likely to pay the AMT.
The Corporate Income Tax42
The corporate income tax generally only applies to C corporations (also known as regular corporations). These corporations—named for Subchapter C of the Internal Revenue Code (IRC), which details their tax treatment—are generally treated as taxable entities separate from their shareholders.43 That is, corporate income is taxed once at the corporate level according to the corporate income tax system. When corporate dividend payments are made or capital gains are realized income is taxed again at the individual-shareholder level according to the individual tax system (discussed above). In contrast, non-corporate businesses, including S corporations44 and partnerships,45 pass their income through to owners who pay taxes. Collectively, these non-corporate business entities are referred to as pass-throughs. For these types of entities, business income is taxed only once, at individual income tax rates.
The corporate income tax is designed as a tax on corporate profits (also known as net income). Broadly defined, corporate profit is total income minus the cost associated with generating that income.46 Business expenses that may be deducted from income include employee compensation; the decline in value of machines, equipment, and structures (i.e., deprecation); general supplies and materials; advertising; and interest payments. The corporate income tax also allows for a number of other special deductions, credits, and tax preferences that reduce taxes paid by corporations.47 Oftentimes, these provisions are intended to promote particular policy goals.
A corporation's tax liability can be calculated as:
Taxes = [(Total Income – Expenses)(1 – p) × t] – Tax Credits,
where t is the statutory tax rate and p is the Section 199 production activities deduction. The Section 199 deduction effectively lowers the corporate tax rate for those corporations engaged in domestic manufacturing activities.48 For income not eligible for the Section 199 deduction, p is zero.
Some corporations experience net operating losses (NOLs), which occur when total income less expenses is negative. A NOL can be "carried back" of "carried forward." If the firm had taxable income in the prior years and chooses to "carry back" the NOL it may be deducted from up to two prior years' taxable income. The corporation is then eligible for a refund equal to the difference between previously paid taxes and taxes owed after deducting the current year's loss. If the loss is too large to be fully carried back, it may be "carried forward" for up to 20 years and used to reduce future tax liabilities.
Most corporate income is subject to a 35% statutory tax rate. Table 3 contains the marginal corporate tax rates faced by U.S. firms. Smaller firms face a progressive tax schedule.49 To increase the effective tax rate for larger firms, the statutory rate increases above 35% for two brackets: the 39% bracket for income between $100,000 and $335,000 and the 38% bracket for income between $15,000,000 and $18,333,333. Having these "bubble" rates, or higher marginal tax rates along part of the schedule, increases the effective tax rate for higher-income corporations. Essentially, these higher "bubble" brackets serve to reduce any tax savings larger corporations would have incurred from having their first $75,000 in income taxed at lower rates.
In broad economic terms, the base of the corporate income tax is the return to equity capital. Wages are tax deductible, so labor's contribution to corporate revenue is excluded from the corporate tax base. Income produced by corporate capital investment includes that produced by corporate investment of borrowed funds, and that produced by investment of equity, or funds provided by stockholders. Profits from debt-financed investment are paid out as interest, which is deductible. Thus, the return to debt capital is excluded from the corporate tax base. Equity investments are financed by retained earnings and the sale of stock. The income equity investment generates is paid out as dividends and the capital gains that accrue as stock increases in value. Neither form of income is generally deductible. Thus, the base of the corporate income tax is largely the return to equity capital.
|
Taxable Corporate Income |
Corporate Tax Rate |
|
$0-$49,999 |
15% |
|
$50,000-$74,999 |
25% |
|
$75,000-$99,999 |
34% |
|
$100,000-$334,999 |
39% |
|
$335,000-$9,999,999 |
34% |
|
$10,000,000-$14,999,999 |
35% |
|
$15,000,000-$18,333,332 |
38% |
|
$18,333,333 and over |
35% |
Source: Internal Revenue Code.
Because of the nature of its base, the corporate income tax has several broad effects on the allocation of capital investment. First, it favors non-corporate investment—for example, unincorporated business and owner-occupied housing—over corporate investment. Second, it favors corporate debt over corporate equity investment since the former is not subject to the tax. However, while the base of the tax is largely equity income, the flow of capital out of the corporate sector and other economic adjustments probably cause the burden of the tax to spread to all owners of capital: owners of unincorporated business, bondholders, and homeowners. Government agencies analyzing the incidence of the corporate tax distribute most of the burden to owners of capital, with a smaller portion falling on labor income. Since owners of capital tend to be in higher income groups, and most of the corporate tax burden falls on capital, the corporate tax is widely viewed as being progressive.
Corporate Income Earned Abroad
The United States has a worldwide (or resident-based) tax system.50 As a result, U.S. corporations are generally liable for tax on their worldwide income. Under current law, corporations are allowed a credit, known as the foreign tax credit, for taxes paid to other countries.51 The foreign tax credit may not reduce a corporation's tax liability below zero. Additionally, corporations are not required to pay U.S. tax on overseas income until income is repatriated to the United States. This ability to defer taxes is often known simply as "deferral." Deferral is not an option, however, with "Subpart F" income, which generally includes passive types of income such as interest, dividends, annuities, rents, and royalties.52
|
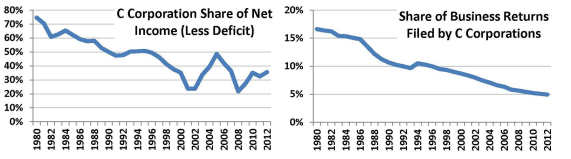
The Decline of the C Corporation Since the 1980s, both the proportion of businesses filing tax returns as C corporations and their share of net income have declined.53 In 1980, 17% of business returns were filed by C corporations, which were also responsible for 75% of net income.54 By 2012, C corporations filed 5% of business returns, accounting for 36% of net income. Fluctuations in net income tend to follow the business cycle. During both the early 2000s recession and the Great Recession (2007–2009), the share of net income fell sharply, reflecting losses in the corporate sector.
|
Social Insurance and Retirement Payroll Taxes
Payroll taxes are used to fund specific programs, largely Social Security and Medicare.55 Social Security and Medicare taxes are generally paid at a combined rate of 15.3% of wages, with 7.65% being paid by the employee and employer alike.56
The Social Security part of the tax, or the old age, survivors, and disability insurance (OASDI) tax, is 6.2% for both employees and employers (12.4% in total).57 In 2017, the tax applies to the first $127,200 in wages. This wage base is adjusted annually for inflation.
The Medicare portion of the tax, or the Medicare hospital insurance (HI) tax, is 1.45% for both employees and employers (2.9% in total).58 There is no wage cap for the HI tax (the Medicare HI tax applies to all wage earnings). Certain higher-income taxpayers may be subject to an additional HI tax of 0.9%. For married taxpayers filing jointly, combined wages above $250,000 are subject to the additional 0.9% HI tax.59 The threshold for single and head of household filers is $200,000. These threshold amounts are not indexed for inflation.
Employers may also be subject to a federal unemployment insurance payroll tax.60 This tax is 0.6% on the first $7,000 of wages.61 Federal unemployment insurance payroll taxes are used to pay for the administrative costs of the unemployment insurance (UI) program. State UI taxes generally pay for UI benefits.62
Most taxpayers pay more in payroll taxes than income taxes. The Tax Policy Center estimates that in 2016, 75% of tax units had positive payroll tax liability (compared to 56% of tax units with positive income tax liability) (this is discussed further in the context of Figure 9, below).63 Of units with a positive tax liability (either positive payroll or income tax), 76% paid more in payroll taxes than income taxes. Payroll taxes are also regressive, with higher-income taxpayers paying a smaller share of their income in payroll taxes than lower-income taxpayers. This is a result of two factors. First, the OASDI tax wage cap results in income over that cap not being subject to the tax. Second, payroll taxes only apply to wage income, and non-wage income tends to be concentrated towards the higher end of the income distribution.
Estate and Gift Taxes
Upon death, an individual's estate may be subject to tax.64 The base of the federal estate tax is generally property transferred at death, less allowable deductions and exemptions. An unlimited marital deduction is allowed for property transferred to a surviving spouse. Other allowable deductions include estate administration expenses and charitable bequests. The effective estate tax exemption is $5.49 million for 2017.65 The value of the estate over the exemption amount is generally taxed at a rate of 40%.66
The federal gift tax operates alongside the estate tax to prevent individuals from avoiding the estate tax by transferring property to heirs before dying. For 2017, the first $14,000 of gifts from one individual to another is excluded from taxation and does not apply to the lifetime exemption.67
The gift tax and estate tax are unified in that the same lifetime exemption amount applies to both taxes ($5.49 million in 2017). Being unified, taxable gifts reduce the exemption amount that is available for estate tax purposes. The gift tax rate is 40%, the same as the top rate for the estate tax, for gifts beyond the exemption amount.
Few taxpayers pay the estate tax. In 2015, an estimated 11,917 estate tax returns were filed, and 41% (4,918) of those returns were taxable.68 Estimates suggest that through 2024, each year roughly 0.2% of decedents will face the estate tax.69 The estate tax is also progressive, up to the very top of the income distribution. For taxpayers in the 95th to 99th percentile, the estate tax has been estimated to be 0.2% of cash income in 2016.70 For taxpayers in the top 1% and top 0.1% of the income distribution, the estate tax has been estimated to be 0.5% of cash income in 2016.
Excise Taxes
Excise taxes are levied on the consumption of goods and services rather than income. Unlike sales taxes, they apply to particular commodities, rather than to broad categories. Historically, the federal government has levied excise taxes, but not a broad-based sales tax, instead leaving sales taxes to the states as a revenue source.
Federal excise taxes are levied on a variety of products.71 The collection point of the tax varies across products. For some goods, taxes are collected at the production level. Other excise taxes are collected on retail sales. In terms of receipts, the single largest tax is the excise tax on gasoline.72 Other prominent excise taxes are those on diesel and other fuels; trucks, trailers, and tractors; aviation-related taxes and fees;73 excise taxes on beer, wine, and distilled spirits;74 taxes on tobacco products; Affordable Care Act (ACA) taxes and fees75 (e.g., insurance provider fee,76 medical device excise tax,77 branded pharmaceuticals fee); and taxes on firearms and ammunition.78
Most federal excise taxes are paid into federal trust funds devoted to specific federal activities, as opposed to remaining in the federal budget's general fund. In 2016, of the $95 billion in excise tax revenue, approximately 64% supported trust funds, with the remainder being general fund revenue.79 The largest trust fund is the Highway Trust Fund. Devoted revenue sources include excise taxes on fuels, trucks, and tires. Aviation-related excise taxes support the Airport and Airway Trust Fund, the second largest of the excise-tax-supported trust funds.80 General fund excise taxes include taxes on alcohol and tobacco and ACA-related excise taxes.
Excise taxes can result in consumers paying higher prices for goods and services. Overall, households from the lower part of the income distribution tend to pay a larger share of their income in excise taxes than higher-income households.81 Thus, taken as a whole, federal excise taxes are generally believed to be regressive. The degree of regressivity can vary for different types of excise taxes. For example, tobacco excise taxes are estimated to be more regressive than aviation-related excise taxes.82
Tax Statistics
Taxes as a Share of the Economy
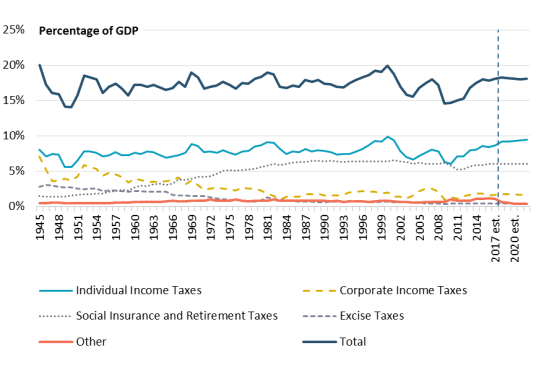
Federal revenues are derived from several sources and have collectively ranged from roughly one-fifth to one-sixth the size of the economy. Figure 6 displays total federal tax revenues and major sources of federal tax revenue as percentages of gross domestic product (GDP) since 1945. Revenues in 2016 were 17.8% of GDP, slightly above the post-World War II average of 17.3% of GDP.
Since the mid-1940s, the individual income tax has been the most important single source of federal revenue (business income may also be taxed under the individual income tax system, as discussed above in "The Individual Income Tax"). Between 2000 and 2010, however, the individual income tax receipts decreased relative to the size of the economy, falling from nearly 10% of GDP in 2000 to just over 6% in 2010. Individual income tax receipts have subsequently increased to 8.4% of GDP in 2016. Over time, the corporate income tax has fallen from the second- to the third-most important source of revenue. In the late 1960s, corporate taxes were replaced by social insurance and retirement taxes as the second-leading revenue source. Excise taxes and estate and gift taxes have also decreased in relative importance over time.
|
Figure 6. Federal Revenue as a Percentage of GDP 1945-2022 |
 |
|
Source: CRS calculations using data from U.S. Office of Management and Budget, Budget of the U.S. Government, Fiscal Year 2017, Historical Tables (Washington: GPO, 2017). Notes: Revenues for 2017-2022 are projections based on the President's FY2017 budget proposal, which does not include the effects of H.R. 1. FY2017 is noted with the vertical dotted line. |
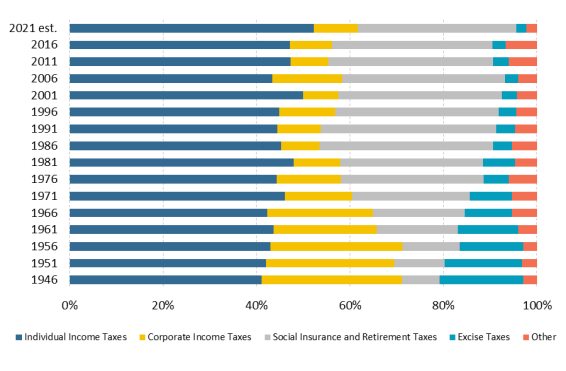
Composition of Tax Revenue
The changing shares of federal revenues over time are more clearly shown in Figure 7. For example, the corporate income tax accounted for roughly 30% of federal revenue in 1946, but less than 10% in 2016.83 Similarly, excise tax revenue is nearly 3% of federal receipts, down from nearly 18% in 1946. In contrast, receipts for social insurance and retirement taxes have risen post-World War II with the enactment of Social Security and Medicare and are now the second largest source of federal receipts at nearly 35%.
|
Figure 7. Composition of Federal Revenue Selected Years 1946-2021 |
 |
|
Source: CRS calculations using data from U.S. Office of Management and Budget, Budget of the U.S. Government, Fiscal Year 2017, Historical Tables (Washington: GPO, 2017). Note: The composition of revenues for 2021 are projections based on the President's FY2017 budget proposal, which does not include the effects of H.R. 1. |
The Distribution of the Tax Burden
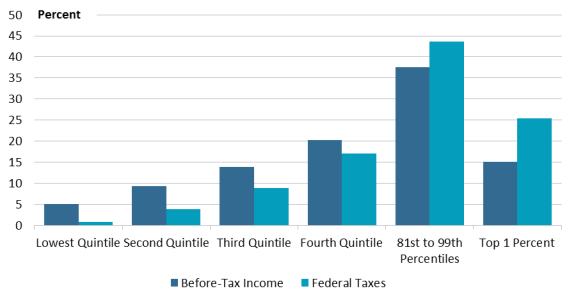
The U.S. tax system is generally progressive. As shown in Figure 8, households in the bottom four quintiles have greater shares of before-tax income than their share of federal taxes paid. In contrast, households in the top quintile received just over half of total before-tax income and paid over two-thirds of federal taxes. This is largely a result of the progressive rate structure of the individual income tax and results in a distribution of after-tax income that is slightly more even than the distribution of before-tax income.
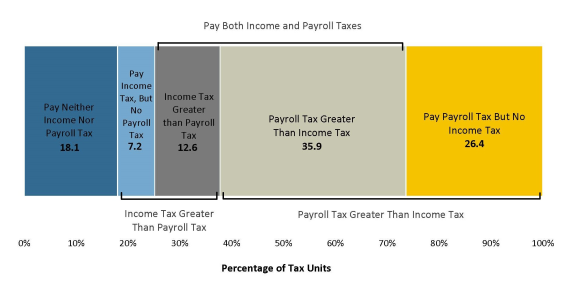
While Figure 8 highlights the distribution of the aggregate federal taxes borne by individuals along the income distribution, it does not provide a clear picture of the relative importance of federal taxes to most taxpayers. Figure 9 highlights the relative importance of the two largest categories of taxes (income and payroll) faced by most taxpayers. According to estimates from the Tax Policy Center, 62.3% of taxpayers pay more in payroll taxes than income taxes, while nearly 20% pay more in income taxes than payroll taxes.84 The remaining 18% who do not pay either tax is split evenly between retirees and those without jobs.
 |
|
Source: Urban-Brookings Tax Policy Center. Note: A "tax unit" is an individual or married couple that files a tax return, or would file a tax return if their income were high enough. |
International Comparisons
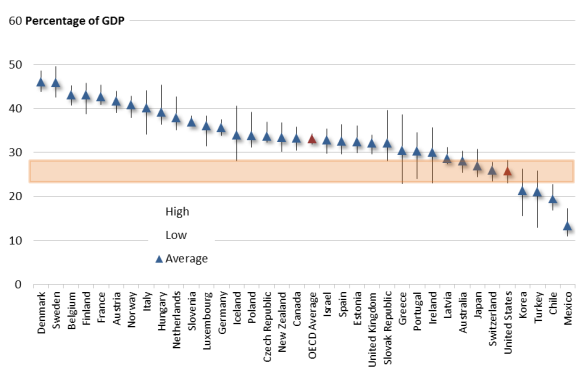
How the U.S. tax system compares to those in other countries is a perennial tax policy question. As shown in Figure 10, total U.S. taxes as a percentage of GDP is below the average for OECD countries. Four countries tend to have lower taxes as a percentage of GDP than the United States, with most others tending to have higher taxes relative to the size of the economy. Note that such a direct comparison can be difficult to interpret, as it does not take into account spending policies or deficit/surplus levels that provide more context.
OECD Countries, 1987-2016
 |
|
Source: OECD Revenue Statistics. Note: Government revenue includes all federal, state, and local collections. |
Table 4 provides this additional context for the United States and the other major democratic countries in the G-7. Among the G-7 countries, the United States has both the lowest revenue and spending as a percentage of GDP and the second highest deficit level.85
|
Government Revenues as a % of GDP |
Government Expenditures as a % of GDP |
Surplus/Deficit as a % of GDP |
|
|
Canada |
38.5 |
40.1 |
-1.6 |
|
France |
53.2 |
56.1 |
-2.9 |
|
Germany |
44.9 |
43.8 |
1.1 |
|
Italy |
47.0 |
49.2 |
-2.1 |
|
Japan |
33.9 |
38.8 |
-4.8 |
|
United Kingdom |
38.2 |
40.5 |
-2.3 |
|
United States |
33.0 |
37.6 |
-4.6 |
Source: OECD Economic Outlook Annex Tables.
Note: Government revenue and expenditures includes all federal, state, and local collections and spending.
Concluding Remarks
H.R. 1 includes broad changes to the federal tax system after the 2017 tax year. On the individual side, the act structurally changes the individual income tax system by repealing personal exemptions and increasing the standard deduction. Rates and brackets are modified, as are many individual income tax expenditures. The act also changes how businesses are taxed, with most pass-through business income being effectively taxed at rates that differ from the statutory tax rates under the individual income tax system. Corporations will face a reduced statutory tax rate, with many corporate and business tax expenditures otherwise modified. The act also moves towards a territorial tax system for multinational corporations.
This report provides an overview of the federal tax system, as in effect in 2017. Changes to the federal tax system enacted in the 115th Congress will be addressed in subsequent CRS products.
Appendix. Largest Individual and Corporate Tax Expenditures
The largest individual income tax expenditures are listed in Table A-1. In 2016, the sum of individual income tax expenditures was $1.2 trillion. Of this total, $844.2 billion (or 69%) is attributable to the top 10 provisions.
|
Individual Tax Expenditure |
$ billions |
||
|
Exclusion for Pension Contributions and Earnings |
|
||
|
Exclusion for Employer Provided Health Care |
|
||
|
Reduced Rates for Capital Gains and Dividends |
|
||
|
Earned Income Tax Credit |
|
||
|
Deduction for State and Local Taxes |
|
||
|
Deduction for Mortgage Interest |
|
||
|
Deduction for Charitable Contributions |
|
||
|
Child Tax Credit |
|
||
|
Expensing under Section 179 of Depreciable Business Property |
|
||
|
Subsidies for Insurance Purchased through Health Benefit Exchanges |
|
||
|
|
|||
|
Total (Top 10) |
|
||
|
Total (All) |
1,219.8 |
Source: Joint Committee on Taxation, Estimates of Federal Tax Expenditures for Fiscal Years 2016-2020, JCX-3-17, January 30, 2017.
The largest corporate income tax expenditures are listed in Table A-2. In 2016, the sum of corporate tax expenditures was $267.2 billion. Of this total, $222.8 billion (or 83%) is attributable to the top 10 provisions.
|
Corporate Tax Expenditures |
$ billions |
||
|
Deferral of Active Income of Controlled Foreign Corporations |
|
||
|
Expensing under Section 179 of Depreciable Business Property |
|
||
|
Depreciation of Equipment in Excess of the Alternative Depreciation System |
|
||
|
Deduction for Income Attributable to Domestic Production Activities |
|
||
|
Deferral of Gain on Like-Kind Exchanges |
|
||
|
Exclusion of Interest on Public Purpose State and Local Government Bonds |
|
||
|
Credit for Research and Experimentation |
|
||
|
Deferral of Active Finance Income |
|
||
|
Credit for Low-Income Housing |
|
||
|
Deferral of Gain on Non-Dealer Installment Sales |
|
||
|
|
|||
|
Total (Top 10) |
|
||
|
Total (All) |
267.2 |
Source: Joint Committee on Taxation, Estimates of Federal Tax Expenditures for Fiscal Years 2016-2020, JCX-3-17, January 30, 2017.
Author Contact Information
Footnotes
| 1. |
The full framework is available at https://www.speaker.gov/sites/speaker.house.gov/files/Tax%20Framework.pdf. |
| 2. |
See the President's Advisory Panel on Federal Tax Reform website, archived at https://govinfo.library.unt.edu/taxreformpanel/. |
| 3. |
A press release accompanying the release of The Tax Reform Act of 2014 in discussion draft form can be found at https://waysandmeans.house.gov/camp-releases-tax-reform-plan-to-strengthen-the-economy-and-make-the-tax-code-simpler-fairer-and-flatter/. |
| 4. |
Historical data on federal receipts by source can be found in Table 2.1 of the Historical Tables published by the Office of Management and Budget (OMB), available at https://www.whitehouse.gov/omb/budget/Historicals. |
| 5. |
Other sources include estate and gift taxes, customs duties and fees, and deposits of earnings by the Federal Reserve System. |
| 6. |
CRS Report RL30110, Federal Individual Income Tax Terms: An Explanation, by Mark P. Keightley. |
| 7. |
Internal Revenue Service, Statistics of Income, Individual Income Tax Statistics Table 1.4 provides information on sources of income, available at https://www.irs.gov/statistics/soi-tax-stats-individual-statistical-tables-by-size-of-adjusted-gross-income. |
| 8. |
See CRS Report R43104, A Brief Overview of Business Types and Their Tax Treatment, by Mark P. Keightley; and CRS Report R42359, Who Earns Pass-Through Business Income? An Analysis of Individual Tax Return Data, by Mark P. Keightley. |
| 9. |
The Haig-Simons comprehensive income definition was first developed in Robert Murray Haig, "The Concept of Income–Economic and Legal Aspects," in The Federal Income Tax, ed. Robert Murray Haig (New York, NY: Columbia University Press, 1921), pp. 1-28; and Henry C. Simons, Personal Income Taxation: The Definition of Income as a Problem of Fiscal Policy (Chicago, IL: University of Chicago Press, 1938). An overview of the concept can be found in Jonathan Gruber, Public Finance and Public Policy, 2nd ed. (New York, NY: Worth Publishers, 2007). |
| 10. |
Exclusions are a form of "tax expenditure." Tax expenditures are revenue losses associated with targeted provisions that move the income tax away from a "theoretical normal" tax system. For more information on individual income tax expenditures, see Table A-1. |
| 11. |
For additional information, see CRS Report 96-769, Capital Gains Taxes: An Overview, by Jane G. Gravelle; and CRS Report R43418, The Taxation of Dividends: Background and Overview, by Jane G. Gravelle and Molly F. Sherlock. |
| 12. |
Capital losses are generally deductible against capital gains. Taxpayers can also deduct up to $3,000 of capital losses from ordinary income per tax year. |
| 13. |
Unrealized capital gains are also excluded at death. This is discussed further in the "Estate and Gift Taxes" section below. |
| 14. |
Qualified dividends, which are generally dividends that have met certain holding period requirements, are taxed at the same reduced rate as capital gains. |
| 15. |
For background on types of business organizations, see CRS Report R43104, A Brief Overview of Business Types and Their Tax Treatment, by Mark P. Keightley. |
| 16. |
A list of "above the line" deductions can be found in the Internal Revenue Code (IRC) §62. |
| 17. |
For additional information, see CRS Report R42872, Tax Deductions for Individuals: A Summary, by Sean Lowry. |
| 18. |
The additional standard deduction for married taxpayers filing jointly is $1,250 per spouse that is either blind or elderly (or $2,500 if both blind and elderly). For single and head of household taxpayers, the additional standard deduction is $1,550 (or $3,100 if both blind and elderly). |
| 19. |
For more information on personal exemption amounts over time, see CRS Report RL34498, Individual Income Tax Rates and Other Key Elements of the Federal Individual Income Tax: 1988 to 2017, by Gary Guenther. |
| 20. |
For head of household filers, the personal exemption phaseout threshold is $287,650 in 2017. |
| 21. |
CRS Report RL32781, Federal Deductibility of State and Local Taxes, by Grant A. Driessen and Steven Maguire. |
| 22. |
CRS In Focus IF10584, Key Issues in Tax Reform: The Mortgage Interest Deduction, by Mark P. Keightley. |
| 23. |
CRS Report RL34608, Tax Issues Relating to Charitable Contributions and Organizations, by Jane G. Gravelle and Molly F. Sherlock. |
| 24. |
CRS Report R41596, The Mortgage Interest and Property Tax Deductions: Analysis and Options, by Mark P. Keightley. |
| 25. |
CRS Report R42872, Tax Deductions for Individuals: A Summary, by Sean Lowry. |
| 26. |
The limitation on itemized deductions for certain higher-income taxpayers is known as the Pease limitation in reference to its originator, Rep. Donald J. Pease. |
| 27. |
For more on this trend, see Chenxi Lu, The Rise and Fall of Itemized Deductions, TaxVox, Tax Policy Center, August 10, 2016, http://www.taxpolicycenter.org/taxvox/rise-and-fall-itemized-deductions. |
| 28. |
A marginal tax rate is the tax rate on the last dollar earned. |
| 29. |
For historical perspective on marginal tax rates, see CRS Report RL34498, Individual Income Tax Rates and Other Key Elements of the Federal Individual Income Tax: 1988 to 2017, by Gary Guenther. |
| 30. |
Take, for example, a single taxpayer with taxable income of $50,000. That taxpayer would fall in the 25% statutory rate bracket. However, that taxpayer's tax liability would be the sum of taxes applied to income falling within the first three brackets, the 10%, 15%, and 25% brackets. Specifically, the taxpayer would pay $932.50 (or 10%) on the first $9,325 in taxable income, $4,293.75 (or 15%) on the next $28,625 in taxable income, and $3,012.50 (or 25%) on the last $12,050 in income. Thus, the taxpayer's total tax bill would be $8,238.75 on $50,000 in taxable income. Even though this taxpayer is in the 25% tax bracket, their average tax rate is 16.5%. |
| 31. |
Modified AGI is AGI increased by the amount excluded from income as foreign earned income. |
| 32. |
The threshold amount is $125,000 for married taxpayers filing separate returns. These threshold amounts are not adjusted for inflation. |
| 33. |
CRS Report R43805, The Earned Income Tax Credit (EITC): An Overview, by Gene Falk and Margot L. Crandall-Hollick; CRS Report R44057, The Earned Income Tax Credit (EITC): An Economic Analysis, by Margot L. Crandall-Hollick; CRS Report R44825, The Earned Income Tax Credit (EITC): A Brief Legislative History, by Margot L. Crandall-Hollick; and CRS Report R43873, The Earned Income Tax Credit (EITC): Administrative and Compliance Challenges, by Margot L. Crandall-Hollick. |
| 34. |
CRS Report R41873, The Child Tax Credit: Current Law and Legislative History, by Margot L. Crandall-Hollick; and CRS Report R41935, The Child Tax Credit: Economic Analysis and Policy Options, by Margot L. Crandall-Hollick. |
| 35. |
CRS Report RS21466, Dependent Care: Current Tax Benefits and Legislative Issues, by Julie M. Whittaker (out-of-print; available to congressional clients upon request from the author of this report). |
| 36. |
CRS Report R41967, Higher Education Tax Benefits: Brief Overview and Budgetary Effects, by Margot L. Crandall-Hollick. |
| 37. |
CRS Report R42561, The American Opportunity Tax Credit: Overview, Analysis, and Policy Options, by Margot L. Crandall-Hollick. |
| 38. |
For additional information, see CRS Report R44787, Statutory, Average, and Effective Marginal Tax Rates in the Federal Individual Income Tax: Background and Analysis, by Molly F. Sherlock. |
| 39. |
CRS Report R44494, The Alternative Minimum Tax for Individuals: In Brief, by Donald J. Marples. |
| 40. |
The exemption for married individuals filing separately is half that of married filers filing jointly, as is the phaseout threshold. |
| 41. |
Tax Policy Center, T17-0149–Characteristics of Alternative Minimum Tax (AMT) Payers, 2016–2018 and 2027, April 28, 2017, available at http://www.taxpolicycenter.org/model-estimates/baseline-alternative-minimum-tax-amt-tables-april-2017/t17-0149-characteristics. |
| 42. |
For more information, see CRS Report R42726, The Corporate Income Tax System: Overview and Options for Reform, by Mark P. Keightley and Molly F. Sherlock. |
| 43. |
For more information, see CRS Report R43104, A Brief Overview of Business Types and Their Tax Treatment, by Mark P. Keightley. |
| 44. |
An S corporation is a closely held corporation that elects to be treated as a pass-through entity for tax purposes. S corporations are named for Subchapter S of the IRC, which details their tax treatment. By electing S corporation status, a business is able to combine many of the legal and business advantages of a C corporation with the tax advantages of a partnership. For more information, see CRS Report R43104, A Brief Overview of Business Types and Their Tax Treatment, by Mark P. Keightley. |
| 45. |
A partnership is a joint venture consisting of at least two partners organized to operate a trade or business with each partner sharing profits, losses, deductions, credits, and the like. The most common partnerships include general partnerships, limited liability partnerships, limited partnerships, publicly traded partnerships, and electing large partnerships. For more information, see CRS Report R43104, A Brief Overview of Business Types and Their Tax Treatment, by Mark P. Keightley. |
| 46. |
The primary components of business income are revenues generated from the sale of goods and services. Other income sources include investment income, royalties, rents, and capital gains. |
| 47. |
For more on corporate tax expenditures, see Table A-2. |
| 48. |
For more information on the production activities deduction, see CRS Report R41988, The Section 199 Production Activities Deduction: Background and Analysis, by Molly F. Sherlock. |
| 49. |
CRS Report RL32254, Small Business Tax Benefits: Current Law and Main Arguments For and Against Them, by Gary Guenther. |
| 50. |
CRS Report R41852, U.S. International Corporate Taxation: Basic Concepts and Policy Issues, by Mark P. Keightley and CRS Report RL34115, Reform of U.S. International Taxation: Alternatives, by Jane G. Gravelle. |
| 51. |
See IRC §901. |
| 52. |
Subpart F income is named after the section of the Internal Revenue Code where its tax treatment is defined. An exception to Subpart F income is for "active financing" income. Active financing income is income earned by American corporations that operate banking, financing, and insurance lines of business overseas. |
| 53. |
CRS Report R42113, Reasons for the Decline in Corporate Tax Revenues, by Mark P. Keightley. |
| 54. |
The measure of net income used here is net income (less deficit). This measure of net income includes losses. |
| 55. |
The taxes are also known as Federal Insurance Contributions Act (FICA) taxes. |
| 56. |
Self-employed taxpayers pay both the employer and employee share. |
| 57. |
CRS Report R42035, Social Security Primer, by Dawn Nuschler. |
| 58. |
CRS Report R40425, Medicare Primer, coordinated by Patricia A. Davis. |
| 59. |
The threshold amount for married taxpayers filing separately is $125,000. |
| 60. |
CRS In Focus IF10336, The Fundamentals of Unemployment Compensation, by Julie M. Whittaker and Katelin P. Isaacs; and CRS Report R44527, Unemployment Compensation: The Fundamentals of the Federal Unemployment Tax (FUTA), by Julie M. Whittaker. |
| 61. |
The tax rate is 6% of total wages for each employee, up to $7,000. However, there is a federal credit of 5.4% for state unemployment taxes, making the effective federal tax rate 0.6%. |
| 62. |
For more information, see CRS Report RL33362, Unemployment Insurance: Programs and Benefits, by Julie M. Whittaker and Katelin P. Isaacs. |
| 63. |
Tax Policy Center, Table T16-0129 Distribution of Federal Payroll and Income Taxes by Expanded Cash Income Percentile, 2016, July 18, 2016, available at http://www.taxpolicycenter.org/model-estimates/distribution-federal-payroll-and-income-taxes-july-2016/t16-0129-distribution. |
| 64. |
CRS Report R42959, Recent Changes in the Estate and Gift Tax Provisions, by Jane G. Gravelle. |
| 65. |
Although estate tax rates of the tax are graduated, the exemption is applied in the form of a credit and offsets taxes applied at the lower rates. |
| 66. |
The exemption amount is adjusted for inflation. |
| 67. |
A married couple could each give a child $14,000 for a total gift of $28,000. This $28,000 in gifts would not apply to the lifetime exemption. Gifts can also be made to more than one child. The exemption amount is indexed for inflation in $1,000 increments. |
| 68. |
Tax Policy Center, Number of Returns 2001–2015, December 21, 2016, http://www.taxpolicycenter.org/statistics/number-returns-2001-2015 and Tax Policy Center, Returns by Credits, December 21, 2016, http://www.taxpolicycenter.org/statistics/returns-credits. |
| 69. |
Joint Committee on Taxation, History, Present Law, And Analysis Of The Federal Wealth Transfer Tax System, March 16, 2015, https://www.jct.gov/publications.html?func=startdown&id=4744. |
| 70. |
Tax Policy Center, T17-0040—Average Effective Federal Tax Rates—All Tax Units, By Expanded Cash Income Percentile, 2016, March 17, 2017, http://www.taxpolicycenter.org/model-estimates/baseline-average-effective-tax-rates-march-2017/t17-0040-average-effective-federal. |
| 71. |
CRS Report R43189, Federal Excise Taxes: An Introduction and General Analysis, by Sean Lowry. |
| 72. |
CRS Report R43189, Federal Excise Taxes: An Introduction and General Analysis, by Sean Lowry. |
| 73. |
CRS Report R44749, The Airport and Airway Trust Fund (AATF): An Overview, by Rachel Y. Tang and Bart Elias. |
| 74. |
CRS Report R43350, Alcohol Excise Taxes: Current Law and Economic Analysis, by Sean Lowry. |
| 75. |
CRS In Focus IF10591, Taxes and Fees Enacted as Part of the Affordable Care Act, by Sean Lowry. |
| 76. |
CRS Report R43225, Patient Protection and Affordable Care Act: Annual Fee on Health Insurers, by Suzanne M. Kirchhoff. |
| 77. |
CRS Report R43342, The Medical Device Excise Tax: Economic Analysis, by Jane G. Gravelle and Sean Lowry. |
| 78. |
CRS Report R42992, Guns, Excise Taxes, and Wildlife Restoration, by R. Eliot Crafton and Jane G. Gravelle. |
| 79. |
Office of Management and Budget, Historical Tables, Table 2.4, available at https://www.whitehouse.gov/omb/budget/Historicals. |
| 80. |
CRS Report R44749, The Airport and Airway Trust Fund (AATF): An Overview, by Rachel Y. Tang and Bart Elias. |
| 81. |
Joseph Rosenberg, The Distributional Burden of Federal Excise Taxes, Tax Policy Center, September 2, 2015, available at http://www.taxpolicycenter.org/sites/default/files/alfresco/publication-pdfs/2000365-the-distributional-burden-of-federal-excise-taxes.pdf. |
| 82. |
Ibid. |
| 83. |
CRS Report R42113, Reasons for the Decline in Corporate Tax Revenues, by Mark P. Keightley. |
| 84. |
Roberton C. Williams, "Most Americans Pay More Payroll Tax Than Income Tax," September 6, 2016, available at http://www.taxpolicycenter.org/taxvox/most-americans-pay-more-payroll-tax-income-tax. |
| 85. |
The relatively low level of revenue collections in the United States may be partially explained by the lack of a federal-level consumption tax (like a Value-Added Tax), which is a feature of the other countries' tax systems. Similarly, the level of government spending may be partially explained by the lack of federal provision of health care that occurs in the other G-7 countries. |