Agriculture and Related Agencies: FY2020 Appropriations
Changes from October 18, 2019 to November 19, 2019
This page shows textual changes in the document between the two versions indicated in the dates above. Textual matter removed in the later version is indicated with red strikethrough and textual matter added in the later version is indicated with blue.
Agriculture and Related Agencies: FY2020 Appropriations
Contents
- Status of FY2020 Agriculture Appropriations
- Scope of Agriculture Appropriations
- Recent Trends in Agriculture Appropriations
- Action on FY2020 Appropriations
- Administration's Budget Request
- Discretionary Budget Caps and Subcommittee Allocations
- Budget Resolution
- Budget Caps
- Discretionary Spending Allocations
- Budget Sequestration
- House Action
- Comparison of Discretionary Authority to FY2019
- Comparison of Mandatory Spending to FY2019
- Senate Action
- Comparison of Discretionary Authority to FY2019
- Comparison of Discretionary Authority to the House-Passed Bill
- Comparison of Mandatory Spending to the House-Passed Bill
- Continuing Resolutions
- Policy-Related Provisions
Figures
Tables
- Table 1. Status of FY2020 Agriculture Appropriations
- Table 2. Agriculture and Related Agencies Appropriations, by Title, FY2019-FY2020
- Table 3. Agriculture and Related Agencies Appropriations, by Agency, FY2017-FY2020
- Table 4. Selected Policy Provisions Considered in FY2020 Agriculture Appropriations
- Table A-1. USDA Departmental Administration Appropriations
- Table B-1. General Provisions: Changes in Mandatory Program Spending (CHIMPS)
- Table B-2. General Provisions: Rescissions from Discretionary Accounts
- Table B-3. General Provisions: Other Appropriations
- Table B-4. General Provisions: Scorekeeping Adjustments
- Table C-1. Summary of Sequestration on Agriculture Accounts
- Table C-2. Sequestration of Mandatory Accounts
- Table D-1. Congressional Action on Agriculture Appropriations Since FY1996
Summary
Agriculture and Related Agencies:
FY2020 Appropriations
Updated November 19, 2019
Congressional Research Service
https://crsreports.congress.gov
R45974
SUMMARY
Agriculture and Related Agencies:
FY2020 Appropriations
The Agriculture appropriations bill funds the U.S. Department of Agriculture (USDA)
except for the U.S. Forest Service. It also funds the Food and Drug Administration
(FDA) and—in even-numbered fiscal years—the Commodity Futures Trading
Commission (CFTC).
R45974
November 19, 2019
Jim Monke
Specialist in Agricultural
Policy
Agriculture appropriations include both mandatory and discretionary spending. Discretionary amounts, though,
are the primary focus during the bill'’s development. The largest discretionary spending items are the Special
Supplemental Nutrition Program for Women, Infants, and Children (WIC); agricultural research; rural
development; FDA; foreign food assistance and trade; farm assistance loans and salaries; food safety inspection;
animal and plant health programs; and technical assistance for conservation programs.
In the absence of an enacted full-year appropriation, FY2020 began on October 1, 2019, under a continuing
resolution (P.L. 116-59, Division A).
For the regular annual appropriation, the Trump Administration requested in March 2019 $19.2 billion for
discretionary-funded accounts within the jurisdiction of Agriculture appropriations subcommittees. The request
would be a reduction of $4.1 billion from FY2019 (-18%).
On June 4, 2019, the House Appropriations Committee reported a stand-alone Agriculture appropriations bill (
(H.R. 3164, , H.Rept. 116-107) by a vote of 29-21. On June 25, 2019, the House passed a five-bill minibus
appropriation with Agriculture as Division B (H.R. 3055). The discretionary total of the House-passed Agriculture
appropriations bill is $24.3 billion. This is $1 billion more (+4%) than the comparable amount that was enacted
for FY2019for FY2019 and $5.1 more (+27%) than the Administration'’s request.
On September 19, the Senate Appropriations Committee reported its Agriculture appropriations bill (S. 2522, ,
S.Rept. 116-110) by a vote of 31-0. ) by a vote of 31-0. On October 31, 2019, the Senate passed a four-bill minibus appropriation with
Agriculture as Division B (H.R. 3055). The discretionary total of the Senate-reportedpassed bill is $23.1 billion. This is $58
$57 million more than the FY2019 appropriation (+0.32%), $4.2 billion more than the Administration'’s request,
and $893894 million less than the House-passed bill on a comparable amount without CFTC (-3.7%).
The primary components of the $1 billion increase in the House-passed bill from FY2019 include increases to
rural development accounts by $412 million (+14%, primarily for rural water, broadband, and housing), a rural
broadband pilot program by $393 million (+314%), foreign agricultural assistance by $377 million (+19%),
departmental administration by $205 million (+53%, primarily for construction to renovate USDA headquarters),
agricultural research programming by $197 million (+6%), and FDA appropriations by $185 million (+6%).
Reductions in budget authority include decreases to agricultural research buildings and facilities funding by -$331
million, rescinding WIC carryover balances an additional -$300 million, and eliminating temporary funding for
international food assistance by -$216 million (with a larger increase to the base appropriation, as noted above in
foreign agricultural assistance).
The primary differences that comprise the -$893894 million difference in the Senate-reported bill from the House-passedHousepassed bill include providing agricultural research $193 million more than in the House bill and department
administration accounts $12397 million more than in the House bill. These greater allowances are more than offset by
providing rural development $407 million less than in the House bill (largely from rural water and waste disposal
grants), rural broadband in the General Provisions title $518 million less than in the House bill, foreign
agricultural assistance $159 million less than in the House bill, and FDA $105 million less than the House bill.
|
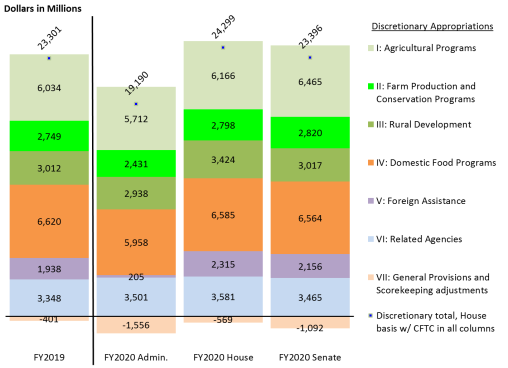
Discretionary Agriculture Appropriations, by Title, FY2019-FY2020 |
 |
passed
H.R. 3055 (Division B).
Note: FDA = Food and Drug Administration, CFTC = Commodity Futures Trading Commission. |
The appropriation also carries mandatory spending that is largely determined in separate authorizing laws. These
mandatory spending amounts total nearly $131 billion in the House-passed bill and $129 billion in the Senate-reportedSenatereported bill. Thus, the overall total of the FY2020 Agriculture appropriation would be about $155 billion in the
House-passed bill and $152 billion in the Senate-reported bill.
Policy provisions may also be included that affect how the appropriation is delivered. This year, these provisions
include issues such as the relocation of USDA agencies, disaster programs, rural definitions, livestock regulations,
nutrition programs, and dietary guidelines.
Budget sequestration continues to affect mandatory agricultural spending accounts. Sequestration refers to
automatic across-the-board reductions in spending authority. In FY2020, sequestration on mandatory spending
accounts is 5.9% and totals about $1.4 billion for agriculture accounts. Recent budget acts have extended
sequestration through FY2029.
Status of FY2020 Agriculture Appropriations
In the absence of an enacted full-year appropriation, FY2020 began on October 1, 2019, under a
Congressional Research Service
Agriculture and Related Agencies: FY2020 Appropriations
Contents
Status of FY2020 Agriculture Appropriations ................................................................................. 1
Scope of Agriculture Appropriations ............................................................................................... 4
Recent Trends in Agriculture Appropriations .................................................................................. 6
Action on FY2020 Appropriations .................................................................................................. 7
Administration’s Budget Request ............................................................................................. 7
Discretionary Budget Caps and Subcommittee Allocations...................................................... 7
Budget Resolution............................................................................................................... 7
Budget Caps ........................................................................................................................ 7
Discretionary Spending Allocations ................................................................................... 8
Budget Sequestration .......................................................................................................... 8
House Action ............................................................................................................................. 9
Comparison of Discretionary Authority: House-Passed Bill to FY2019 ............................ 9
Comparison of Mandatory Spending: House-Passed Bill to FY2019 .............................. 10
Senate Action .......................................................................................................................... 10
Comparison of Discretionary Authority: Senate-Passed Bill to FY2019........................... 11
Comparison of Discretionary Authority: Senate-Passed to House-Passed Bill ................ 12
Comparison of Mandatory Spending: Senate-Passed to House-Passed Bill ..................... 12
Continuing Resolutions ........................................................................................................... 13
Policy-Related Provisions ....................................................................................................... 21
Figures
Figure 1. Timeline of Action on Agriculture Appropriations, FY2010-FY2020 ............................. 3
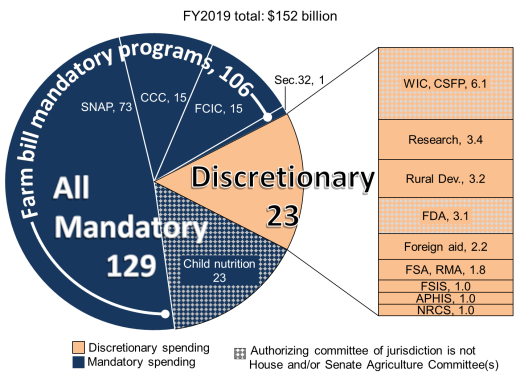
Figure 2. Scope of Agriculture and Related Agencies Appropriations ............................................ 5
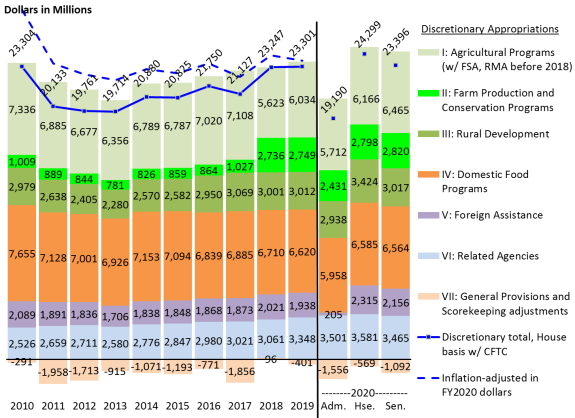
Figure 3. Discretionary Agriculture Appropriations, by Title, FY2010-FY2020 ............................ 6
Figure 4. BCA Discretionary Limits, FY2014-FY2021 .................................................................. 8
Tables
Table 1. Status of FY2020 Agriculture Appropriations ................................................................... 1
Table 2. Agriculture and Related Agencies Appropriations, by Title, FY2019-FY2020 ................. 2
Table 3. Agriculture and Related Agencies Appropriations, by Agency, FY2017-FY2020 .......... 15
Table 4. Selected Policy Provisions Considered in FY2020 Agriculture Appropriations ............. 21
Table A-1. USDA Departmental Administration Appropriations .................................................. 25
Table B-1. General Provisions: Changes in Mandatory Program Spending (CHIMPS) ............... 27
Table B-2. General Provisions: Rescissions from Discretionary Accounts ................................... 28
Table B-3. General Provisions: Other Appropriations................................................................... 29
Table B-4. General Provisions: Scorekeeping Adjustments .......................................................... 32
Table C-1. Summary of Sequestration on Agriculture Accounts ................................................... 33
Table C-2. Sequestration of Mandatory Accounts ......................................................................... 36
Congressional Research Service
Agriculture and Related Agencies: FY2020 Appropriations
Table D-1. Congressional Action on Agriculture Appropriations Since FY1996.......................... 39
Appendixes
Appendix A. Appropriations in Administrative Accounts ............................................................. 25
Appendix B. Appropriations in General Provisions ...................................................................... 27
Appendix C. Budget Sequestration ............................................................................................... 33
Appendix D. Action on Agriculture Appropriations, FY1996-FY2020 ........................................ 39
Contacts
Author Information........................................................................................................................ 40
Congressional Research Service
Agriculture and Related Agencies: FY2020 Appropriations
Status of FY2020 Agriculture Appropriations
In the absence of an enacted full-year appropriation, FY2020 began on October 1, 2019, under a
continuing resolution (P.L. 116-59, Division A) that lasts until November 21, 2019.
For the regular annual Agriculture appropriation, the House passed a five-bill minibus
appropriation on June 25, 2019 (H.R. 3055), and the Senate passed a four-bill minibus on October
31, 2019 (appropriation, the Senate Appropriations Committee reported its Agriculture appropriations bill on September 19, 2019 (S. 2522, S.Rept. 116-110). The House passed a five-bill minibus appropriation on June 25, 2019, with Agriculture appropriations in Division B (H.R. 3055). Senate floor action and final agreement between the chambers is pendingH.R. 3055) from Senate-reported bills as amended on the floor. In both cases, the
Agriculture portion is Division B (Table 1). The Administration released its budget request in two
parts: an overview on March 11, 2019, and more detailed documents on March 18, 2019 (Table 1). See . See
Figure 1 for a decade-long comparison of timelines and Appendix D for more details.
To set overall spending levels, the House Appropriations Committee established its Agriculture subcommittee allocationspending levels to develop the bills, an Agriculture subcommittee allocation was
established in the House on May 14, 2019 (H.Rept. 116-59). The Senate waited for an overall
budget agreement before marking up bills. On August 2, 2019, the Bipartisan Budget Act of 2019 (
(P.L. 116-37) raised the statutory caps on discretionary spending. The Senate Appropriations Committee subsequently set subcommittee allocationsA different subcommittee
allocation was set in the Senate on September 12, 2019 (S.Rept. 116-104).
|
Administration Request |
House Action |
Senate Action |
Continuing Resolution |
Final Appropriation |
||||
|
Subcmte. |
Cmte. |
Floor |
Subcmte. |
Cmte. |
Floor |
|||
). A compromise
appropriation is pending, including agreement to set common subcommittee spending levels.
Table 1. Status of FY2020 Agriculture Appropriations
House Action
Administration
Request
3/11/2019
3/18/2019 |
5/23/2019 Voice vote |
6/4/2019 6/4/2019
H.R. 3164
H.Rept.
116-107
Vote 29-21
| 6/25/2019 6/25/2019
H.R. 3055,
Division B
Vote
227-194
9/17/2019
Draft
Voice vote
|
9/17/2019 Voice vote |
9/19/2019 9/19/2019
S. 2522
S.Rept.
116-110
Vote 31-0
10/31/2019
H.R. 3055,
Division B
Vote
84-9
Voice vote
Continuing
Resolution
Final
Appropriation
|
— |
9/27//2019 9/27//2019
P.L. 116-59 |
— |
Source: CRS, compiled from Congress.gov, OMB, and agency websites.
Note: OMB = Office of Management and Budget, USDA = U.S. Department of Agriculture, FDA = Food and
Drug Administration, CFTC = Commodity Futures Trading Commission, and FCA = Farm Credit
Administration.
The discretionary total of the House-passed Agriculture appropriations bill is $24.3 billion. This
is $1 billion more than (+4%) than the comparable amount for FY2019FY2019 that includes the Commodity
Futures Trading Commission (CFTC)11 and $5.1 billion more than (+27%) than the request.
The $23.1 billion discretionary total in the Senate-reported bill would be $5857 million more than
(+0.32%) the amount enacted for FY2019. This is $893894 million less than (-3.7%) the House-passed
bill on a comparable basis without CFTC.
The appropriation also carries mandatory spending—though that is largely determined in separate
authorizing laws—that totals nearly $131 billion in the House-passed bill and $129 billion in the
Senate-reported bill. Thus, the overall total of the FY2020 Agriculture appropriation would be
about $155 billion in the House bill and $152 billion in the Senate bill (Table 2).
Table 2). 1 Jurisdiction for CFTC appropriations differs between the chambers. Since FY2008, CFTC is marked up in the Agriculture Subcommittee of the House Appropriations Committee and in the Financial Services and General Government Subcommittee of the Senate Appropriations Committee. The enacted CFTC appropriation is carried in the Agriculture bill in even-numbered fiscal years and in the Financial Services bill in odd-numbered fiscal years. Congressional Research Service 1 Agriculture and Related Agencies: FY2020 Appropriations Table 2. Agriculture and Related Agencies Appropriations, by Title, FY2019-FY2020
Budget authority in millions of dollars
FY2019
Title of Agriculture Appropriations Act
I. Agricultural Programs: Discretionary
P.L. 116-6
FY2020
Admin.
request
Change from FY2019
Housepassed
H.R. 3055
Senatepassed
H.R. 3055
Enacted
to Housepassed
to Senatepassed
6,033.9
5,712.3
6,165.6
6,439.2
—
+131.6
+405.3
Mandatory
1,374.0
1,404.0
1,404.0
1,404.0
—
+30.0
+30.0
Subtotal
7,407.9
7,116.3
7,569.6
7,843.2
—
+161.6
+435.3
2,748.8
2,430.6
2,798.0
2,819.9
—
+49.3
+71.1
Mandatory
30,821.1
34,489.6
34,489.6
34,489.6
—
+3,668.5
+3,668.5
Subtotal
33,569.9
36,920.2
37,287.6
37,309.5
—
+3,717.7
+3,739.6
III. Rural Development
3,011.7a
2,938.1
3,423.8a
3,016.7
—
+412.1
+5.0
IV. Domestic Food Programs: Discretionary
6,620.3
5,958.3
6,584.8
6,563.5
—
-35.5
-56.8
96,560.0
93,013.1
95,049.8
92,708.3
—
-1,510.2
-3,851.7
103,180.3
98,971.4
101,634.6
99,271.8
—
-1,545.7
-3,908.5
1,938.0a
205.0
2,315.2
2,156.3
—
+377.2
+218.4
II. Farm Production and Conservation Programs
Mandatory
Subtotal
V. Foreign Assistance
VI. Related Agencies:
—
Food and Drug Administration
3,080.5
3,251.3
3,265.7
3,160.5
—
+185.3
+80.0
Commodity Futures Trading Commission
[268.0]b
250.0
315.0
[305.0]b
—
+47.0
+37.0
VII. General Provisions:
CHIMPS and rescissionsc
—
-490.0
-1,153.0
-799.8
-810.1
—
-309.8
-320.1
493.5
0.0
628.8
141.5
—
+135.3
-352.0
-404.0
-403.0
-398.0
-398.0
—
+6.0
+6.0
23,032.7
18,939.6
[23,984.0]
23,089.6
—
+951.3
+56.9
[23,300.7]
19,189.6
24,299.0
[23,394.6]
—
+998.3
+93.9
Mandatory
128,755.1
128,906.7
130,943.4
128,601.9
—
+2,188.3
-153.2
Total: Senate basis w/o CFTC
151,787.8
147,846.4
154,927.4
151,691.5
—
+3,139.6
-96.4
Total: House basis w/ CFTC
152,055.8
148,096.4
155,242.4
151,996.5
—
+3,186.6
-59.4
Other appropriations
Scorekeeping adjustmentsd
Discretionary: Senate basis w/o CFTC
Discretionary: House basis w/ CFTC
Source:Budget authority in millions of dollars
|
FY2019 |
FY2020 |
Change from FY2019 |
|||||||
|
Title of Agriculture Appropriations Act |
Admin. request |
House-passed H.R. 3055 |
|
Enacted |
to House |
to Senate |
|||
|
I. Agricultural Programs: Discretionary |
6,033.9 |
5,712.3 |
6,165.6 |
6,465.2 |
— |
+131.6 |
+431.3 |
||
|
Mandatory |
1,374.0 |
1,404.0 |
1,404.0 |
1,404.0 |
— |
+30.0 |
+30.0 |
||
|
Subtotal |
7,407.9 |
7,116.3 |
7,569.6 |
7,869.2 |
— |
+161.6 |
+461.3 |
||
|
II. Farm Production and Conservation Programs |
2,748.8 |
2,430.6 |
2,798.0 |
2,819.9 |
— |
+49.3 |
+71.1 |
||
|
Mandatory |
30,821.1 |
34,489.6 |
34,489.6 |
34,489.6 |
— |
+3,668.5 |
+3,668.5 |
||
|
Subtotal |
33,569.9 |
36,920.2 |
37,287.6 |
37,309.5 |
— |
+3,717.7 |
+3,739.6 |
||
|
III. Rural Development |
|
2,938.1 |
|
3,016.7 |
— |
+412.1 |
+5.0 |
||
|
IV. Domestic Food Programs: Discretionary |
6,620.3 |
5,958.3 |
6,584.8 |
6,563.5 |
— |
-35.5 |
-56.8 |
||
|
Mandatory |
96,560.0 |
93,013.1 |
95,049.8 |
92,708.3 |
— |
-1,510.2 |
-3,851.7 |
||
|
Subtotal |
103,180.3 |
98,971.4 |
101,634.6 |
99,271.8 |
— |
-1,545.7 |
-3,908.5 |
||
|
V. Foreign Assistance |
|
205.0 |
2,315.2 |
2,156.3 |
— |
+377.2 |
+218.4 |
||
|
VI. Related Agencies: |
|||||||||
|
Food and Drug Administration |
3,080.5 |
3,251.3 |
3,265.7 |
3,160.5 |
— |
+185.3 |
+80.0 |
||
|
Commodity Futures Trading Commission |
|
250.0 |
315.0 |
|
— |
+47.0 |
+37.0 |
||
|
VII. General Provisions: |
|||||||||
|
-490.0 |
-1,153.0 |
-799.8 |
-810.1 |
— |
-309.8 |
-320.1 |
||
|
Other appropriations |
493.5 |
0.0 |
628.8 |
116.5 |
— |
+135.3 |
-377.0 |
||
|
-404.0 |
-403.0 |
-398.0 |
-398.0 |
— |
+6.0 |
+6.0 |
||
|
Discretionary: Senate basis w/o CFTC |
23,032.7 |
18,939.6 |
[23,984.0] |
23,090.6 |
— |
+951.3 |
+57.9 |
||
|
Discretionary: House basis w/ CFTC |
[23,300.7] |
19,189.6 |
24,299.0 |
[23,395.6] |
— |
+998.3 |
+94.9 |
||
|
Mandatory |
128,755.1 |
128,906.7 |
130,943.4 |
128,601.9 |
— |
+2,188.3 |
-153.2 |
||
|
Total: Senate basis w/o CFTC |
151,787.8 |
147,846.4 |
154,927.4 |
151,692.5 |
— |
+3,139.6 |
-95.4 |
||
|
Total: House basis w/ CFTC |
152,055.8 |
148,096.4 |
155,242.4 |
151,997.5 |
— |
+3,186.6 |
-58.4 |
||
Source: CRS, using appropriations text and reports, and unpublished CBO tables.
CRS, using appropriations text and reports, and unpublished CBO tables.
Notes: Amounts are nominal discretionary budget authority unless labeled otherwise. Excludes amounts in
supplemental appropriations acts. Bracketed amounts are not in the Agriculture appropriations totals due to
differing House-Senate jurisdiction for the Commodity Futures Trading Commission (CFTC).
a. Excludes amounts for other appropriations that are provided separately in General Provisions.
b. The amount for CFTC is from the Financial Services and General Government (FSGG) division of the
FY2019 Consolidated Appropriation and for FY2020 from the Senate bill for FSGG (S. 2524).
).
c. Changes in Mandatory Program Spending (CHIMPS) are reductions made to mandatory programs via
appropriations. Rescissions are permanent cancellations of previously provided budget authority.
d. “d. "Scorekeeping adjustments"” are not necessarily appropriated but are part of the official CBO accounting.
Congressional Research Service 2 Agriculture and Related Agencies: FY2020 Appropriations Figure 1. Timeline of Action on Agriculture Appropriations, FY2010-FY2020 |
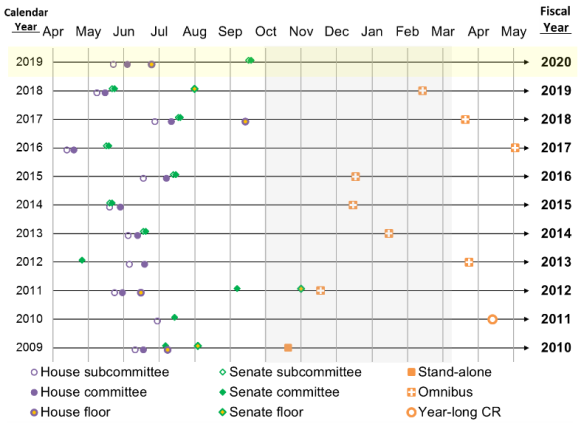 |
Source: CRS. For specific dates and links to bills, see |
Appendix D. Other CRS Resources for Agricultural Appropriations
In addition to the agency-level amounts presented in Table 3, the following CRS reports provide more detail and
|
Congressional Research Service 3 Agriculture and Related Agencies: FY2020 Appropriations Scope of Agriculture Appropriations
The Agriculture appropriations bill—formally known as the Agriculture, Rural Development,
Food and Drug Administration, and Related Agencies Appropriations Act—funds all of the U.S.
Department of Agriculture (USDA), excluding the U.S. Forest Service.22 It also funds the Food
and Drug Administration (FDA) in the Department of Health and Human Services and, in even-numberedevennumbered fiscal years, CFTC.
Jurisdiction is with the House and Senate Committees on Appropriations and their Subcommittees
on Agriculture, Rural Development, Food and Drug Administration, and Related Agencies. The
bill includes mandatory and discretionary spending, but the discretionary amounts are the primary
focus (Figure 2). Some programs are not in the authorizing jurisdiction of the House or Senate
Agriculture Committees, such as FDA, WIC, and child nutrition (checkered regions in Figure 2).
).
The federal budget process treats discretionary and mandatory spending differently:3
- 3
Discretionary spending is controlled by annual appropriations acts and receives
resolution4resolution4 process sets spending limits for discretionary appropriations. Agency Mandatory spending5 is Mandatory spending5 is carried in the appropriation and usually advanced66 Spending for so-called entitlement programs is determined in laws suchbill7bill7 and 2010 child nutrition reauthorizations.8
8
In the FY2019 appropriation (P.L. 116-6), the discretionary amount was 15% ($23 billion) of the
$152 billion total. Mandatory spending carried in the act comprised $129 billion, about 85% of
the total, of which about $106 billion is attributable to programs in the 2018 farm bill.
Within the discretionary total, the largest spending items are the Special Supplemental Nutrition
Program for Women, Infants, and Children (WIC); agricultural research; rural development;
FDA; foreign food aid and trade; farm assistance loans and salaries; food safety inspection;
animal and plant health programs; and technical assistance for conservation program.
The main mandatory spending items are the Supplemental Nutrition Assistance Program (SNAP)
and other food and nutrition act programs, child nutrition (school lunch and related programs),
crop insurance, and farm commodity and conservation programs that are funded through USDA's ’s
Commodity Credit Corporation (CCC). SNAP is referred to as an "“appropriated entitlement"” and
requires an annual appropriation.99 Amounts for the nutrition program are based on projected
spending needs. In contrast, the CCC appropriations reimburse spending from a line of credit.10
Key Budget Terms
Budget authority is the main purpose of an appropriations act or a law authorizing mandatory spending. It
Obligations are contractual agreements between a government agency and its clients or employees. These occur
Outlays are the payments (cash disbursements) that satisfy a valid obligation. Timing of outlays may differ from
Program level represents the sum of the activities undertaken by an agency. A program level may be higher than Rescissions are actions that reduce budget authority after enactment. They generally score budgetary savings.
CHIMPS (Changes in Mandatory Program Spending) are adjustments via an appropriations act that can change
For more background, see CRS Report 98-721, Introduction to the Federal Budget Process |
. Congressional Research Service 5 Agriculture and Related Agencies: FY2020 Appropriations Recent Trends in Agriculture Appropriations
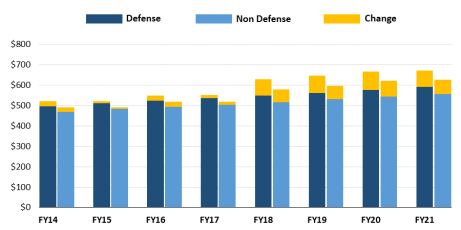
Discretionary Agriculture appropriations were at an all-time high in FY2010, declined through
FY2013, and have gradually increased since then. Changes within titles have generally been
proportionate to changes in the overall bill, though some areas have sustained relative increases,
such as FDA and rural development.
The stacked bars in Figure 3 represent the discretionary authorization for each appropriations
title. The total of the positive stacked bars is the budget authority in Titles I-VI. In FY2018,
USDA reorganization affected the placement of some programs between Titles I and II of the bill
(most noticeably, the Farm Service Agency). Prior to FY2018, the cumulative appropriation for
the agencies was higher than the official discretionary total in the spending allocation (the blue
line) because of the budgetary offset from negative amounts in Title VII (general provisions) and
other negative scorekeeping adjustments. These negative offsets were mostly due to limits on
mandatory programs and rescissions, which have been used less since FY2018.
Historical trends may be tempered by inflation adjustments, as shown in the dotted line. The
inflation-adjusted total since FY2011 has been nearly level until a slightly higher trend line in the
FY2018 appropriation.
Figure 3. Discretionary Agriculture Appropriations, by Title, FY2010-FY2020 |
 |
Source: CRS.
Note: For FY2020, Adm is the Trump Administration |
Congressional Research Service 6 Agriculture and Related Agencies: FY2020 Appropriations Action on FY2020 Appropriations
Administration'
Administration’s Budget Request
The Trump Administration released a general overview of its FY2020 budget request on March
11, 2019,1111 and a detailed budget proposal to Congress on March 18, 2019.12 12 USDA released its
more detailed budget summary and justification,1313 as did the FDA,1414 and the independent agencies
of the CFTC15CFTC15 and the Farm Credit Administration.1616 The Administration also highlighted
separately some of its proposed reductions and eliminations.17
17
For accounts in the jurisdiction of the Agriculture appropriations bill, the Administration'’s budget
requested $19.2 billion, a $4.1 billion reduction from FY2019 (-18%; Table 2, , Figure 3). The
Administration released its budget request for FY2020 after Congress had enacted the omnibus
FY2019 appropriation in February 2019 (P.L. 116-6). Amounts in the FY2019 column of the Administration'
Administration’s budget documents are based on FY2018 levels, not enacted FY2019 amounts.
Discretionary Budget Caps and Subcommittee Allocations
Budget enforcement has procedural and statutory elements. The procedural elements relate to a
budget resolution and are enforced with points of order. The statutory elements impose
discretionary spending limits and are enforced with budget caps and sequestration.18
Budget Resolution
18
Budget Resolution
Typically, each chamber'’s Appropriations Committee receives a top-line limit on discretionary
budget authority, referred to as a "“302(a)"” allocation, from the Budget Committee via an annual
budget resolution. The Appropriations Committees then in turn subdivide the allocation among
their subcommittees, referred to as the "“302(b)"” allocations.19
19
For FY2020, the House did not report or pass a budget resolution. The Senate Budget Committee
reported S.Con.Res. 12, though it received no further action.
Budget Caps
Budget Caps
The Budget Control Act of 2011 (BCA, P.L. 112-25) set discretionary budget caps through
FY2021 as a way of reducing federal spending.2020 Sequestration is an across-the-board backstop to
achieve budget reductions if spending exceeds the budget caps (2 U.S.C. §901(c)).21
Bipartisan Budget Acts (BBAs) have avoided sequestration on discretionary spending—with the exception of FY2013—by raising those caps four times in two-year increments in 2013, 2015, 21
Office of Management and Budget (OMB), A Budget for a Better America: President’s Budget FY 2020.
OMB, FY2020 Budget of the U.S. Government, Appendix.
13 USDA, FY2020 USDA Budget Summary; and USDA, FY2020 Budget Explanatory Notes.
14
FDA, FY2020 Justification of Estimates for Appropriations.
15 CFTC, FY2020 President’s Budget Request.
16 Farm Credit Administration, FY2020 Proposed Budget and Performance Plan.
17 OMB, FY2020 Budget of the U.S. Government, Major Savings and Reforms.
18 CRS Report R42388, The Congressional Appropriations Process: An Introduction.
19 References to 302(a) and 302(b) are to sections of the Congressional Budget Act of 1974.
20 CRS Report R44874, The Budget Control Act: Frequently Asked Questions.
21 CRS Report R42972, Sequestration as a Budget Enforcement Process: Frequently Asked Questions.
11
12
Congressional Research Service
7
Agriculture and Related Agencies: FY2020 Appropriations
Bipartisan Budget Acts (BBAs) have avoided sequestration on discretionary spending—with the
exception of FY2013—by raising those caps four times in two-year increments in 2013, 2015,
2018, and 2019 (Figure 4).22).22 Most recently, the BBA of 2019 (P.L. 116-37) raised the cap on
nondefense discretionary spending by $78 billion for FY2020 (to $621 billion) and by $72 billion
for FY2021 (to $627 billion). The amount for FY2020 is 4.1% greater than the nondefense cap in
FY2019. The BBA also provides language to execute (or "deem"“deem”) those higher caps for the
appropriations process without a budget resolution.23
23 Figure 4. BCA Discretionary Limits, FY2014-FY2021 Budget authority in billions of nominal dollars |
 |
Source: CRS Insight IN11148, The Bipartisan Budget Act of 2019: Changes to the BCA and Debt Limit |
. Discretionary Spending Allocations
In the absence of a budget resolution and before the BBA that occurred in August, the House
Appropriations Committee on May 14, 2019, set an overall discretionary target and provided the
subcommittees with 302(b) allocations (H.Rept. 116-59). The allocation for the House
Agriculture appropriations subcommittee is $24.3 billion, $1 billion greater (+4.3%) than the
comparable amount for the enacted FY2019 Agriculture appropriation (Table 2).
).
The Senate chose to wait for the overall budget agreement in the BBA of 2019 before setting
subcommittee allocations or proceeding to mark up any appropriations bills for FY2020. On
September 12, 2019, the Senate Appropriations Committee set its subcommittee allocations (
(S.Rept. 116-104). The allocation for the Agriculture appropriation subcommittee in the Senate is
$23.1 billion, $0.1 billion greater (+0.3%) than the enacted FY2019 appropriation.
Without Congress having agreed on a joint budget resolution, subcommittee allocations are
different between the chambers and eventually need to be reconciled.
Budget Sequestration
Budget Sequestration
Despite the BBA agreements that raise discretionary spending caps and avoid sequestration on
discretionary accounts, sequestration still applies to mandatory spending. Sequestration on
mandatory accounts began in FY2013, continues to the present, and has been extended beyond
22
23
CRS Insight IN11090, Increasing the BCA Spending Limits: Characteristics of Previously Enacted Legislation.
CRS Insight IN11148, The Bipartisan Budget Act of 2019: Changes to the BCA and Debt Limit.
Congressional Research Service
8
Agriculture and Related Agencies: FY2020 Appropriations
the original FY2021 sunset of the BCA. The various BBAs continue sequestration on mandatory
spending through FY2029. See Appendix A for more on budget sequestration and its effects on
agriculture spending.
House Action
House Action
The House Agriculture Appropriations Subcommittee marked up its FY2020 bill on May 23,
2019, by voice vote.2424 On June 4, 2019, the full Appropriations Committee passed and reported an
amended bill (H.R. 3164, , H.Rept. 116-107) by a vote of 29-21. The committee adopted four
amendments by voice vote.25
25
On June 25, 2019, the House passed a five-bill minibus appropriation (H.R. 3055) with the
Agriculture bill as Division B (Table 1, , Figure 1). Under a structured rule,2626 the Rules
Committee allowed 35 amendments for floor debate (H.Res. 445, , H.Rept. 116-119). The House
considered 33 of those amendments, of which 31 were adopted and two were rejected. Of the 31
amendments that were adopted, 28 were adopted en bloc by voice vote, two were adopted by
recorded votes, and another was adopted separately by voice vote. Of the 31 amendments that
were adopted, 1614 revised funding amounts with offsets,2727 three added policy statements, and 12 14
made no substantive changes but were for the purposes of discussion.
The $24.3 billion discretionary total in the House-passed FY2020 Agriculture appropriation
would be $1 billion more than (+4%) the comparable amount enacted for FY2019 that includes
the CFTC (Table 2, , Figure 3). Generally speaking, the House-passed bill does not include most
of the reductions proposed by the Administration.
Comparison of Discretionary Authority: House-Passed Bill to FY2019
Table 3 provides details of the House-passed bill at the agency level. The primary changes from
FY2019 that comprise the $1 billion increase, ranked by increases and decreases, include:
-
Increase Rural Development accounts by $412 million (+14%), including a $144
-
Increase foreign agricultural assistance by $377 million (+19%), including
The larger FY2020 amount would be to the program's base appropriation rather24 See the House Agriculture Appropriations Subcommittee website for the bill draft and report draft. House Appropriations Committee, “FY2020 Full Committee Adopted Amendments,” June 4, 2019. 26 CRS Report R42933, Regular Appropriations Bills: Terms of Initial Consideration and Amendment in the House, FY1996-FY2015. 27 These 14 amendments added $109 million spread across rural broadband, distance learning and telemedicine, dairy innovation, 1890s institutions, geographically disadvantaged farmers, nutrition initiatives, farm-to-school, rural energy, and opioid abuse. They remained budget neutral by reducing (offsetting) seven mostly administrative accounts by $110 million, including the Chief Information Officer (-$52 million), Office of General Counsel (-$30 million), Departmental Administration (-$21 million), Office of Communications (-$3.6 million), Office of the Secretary (-$1 million), Agricultural Marketing Service (-$1 million), and Agriculture Buildings and Facilities (-$1 million). These reductions were about 98% of the committee-proposed amount for the Departmental Administration, 73% of the Office of General Counsel, and 52% of the Chief Information Officer. See Table A-1. 25 Congressional Research Service 9 Agriculture and Related Agencies: FY2020 Appropriations The larger FY2020 amount would be to the program’s base appropriation rather than the FY2019 approach that used the General Provisions.than the FY2019 approach that used the General Provisions. - Increase related agencies appropriations by $232 million, including raising FDA
- Increase other agricultural program appropriations by $151 million, including:
-
Increase departmental administration accounts by a net $205 million (+53%),
Administration'Administration’s request for a $271 million -
Increase USDA regulatory programs by $56 million, including increasing the
-
Decrease agricultural research by a net $134 million (-4%), mostly through
-
Some of these increases are offset by a net change of -$175 million in budget
Comparison of Mandatory Spending: House-Passed Bill to FY2019
In addition to discretionary spending, the House-passed bill also carries mandatory spending—
largely determined in separate authorizing laws—that totals $131 billion. This is about $2 billion
more than in FY2019 often because of automatic changes from economic conditions and
expectations about enrollment in entitlement programs. Reimbursement for the CCC would
increase by $10 billion, mostly due to the cost of the Trump Administration's ’s trade aid assistance
that was announced in 2018.2828 Child nutrition programs would increase by $0.9 billion. Crop
insurance spending would decrease by $6.4 billion, and SNAP spending decreases by about $2.4
billion.
CHIMPS from the 2018 farm bill are incorporated in these spending levels and were subject to
budgetary enforcement at enactment of the 2018 farm bill.29
Senate Action
farm bill.29
Senate Action
The Senate Agriculture Appropriations Subcommittee marked up its FY2020 bill on September
17, 2019. On September 19, 2019, the full Appropriations Committee passed and reported an
See CRS Report R45310, Farm Policy: USDA’s 2018 Trade Aid Package. Most of the trade aid announced in 2019
(see CRS Report R45865, Farm Policy: USDA’s 2019 Trade Aid Package) is likely to be paid out (outlays) in FY2020
and reimbursed in the FY2021 appropriation after those payments are incorporated into CCC’s net realized losses.
29 See CRS Report R45425, Budget Issues That Shaped the 2018 Farm Bill.
28
Congressional Research Service
10
Agriculture and Related Agencies: FY2020 Appropriations
amended bill (S. 2522, , S.Rept. 116-110) by a vote of 31-0. The committee adopted a manager's ’s
amendment with three additions to bill text and 19 additions to report language.30
30
On October 31, 2019, the Senate passed a four-bill minibus appropriation (H.R. 3055, after
adopting S.Amdt. 948 in the nature of a substitute, which was comprised of four Senate-reported
bills and amended by floor amendments). The Agriculture bill is Division B (Table 1, Figure 1).
The Senate adopted 16 amendments to Division B, of which 14 were adopted en bloc by
unanimous consent and two were adopted by recorded votes. Of these 16 amendments, eight
revised funding amounts with offsets,31 three revised funding amounts within an existing
appropriation, three changed the terms of an appropriation, and two required reports or studies.
The $23.1 billion discretionary total in the Senate-reported FY2020 Agriculture appropriation
would be $5857 million more than (+0.32%) the amount enacted for FY2019 (Table 2, , Figure 3). ).
The Senate bill is $893894 million less than (-3.7%) the House-passed bill on a comparable basis
without CFTC. Generally speaking, the Senate-reported bill does not include most of the
reductions proposed by the Administration. Table 3 provides details of the Senate-reported bill at
the agency level.
Comparison of Discretionary Authority: Senate-Passed Bill to FY2019
Compared to FY2019 and ranked by increases and decreases, the primary changes that comprise
the $5857 million overall increase are the following:
-
Increase USDA departmental administration accounts by a net $
328302 million(+84(+77%), including a requested $271 million increase to renovate USDA -
Increase foreign agricultural assistance by $218 million (+11%), mostly by
- Increase other appropriations by $184 million, including:
- Increase FDA appropriations by $80 million (+3%).
-
Increase agricultural research by a net $60 million (+1.7%). ARS salaries and
-
Increase USDA regulatory programs by $39 million, including increasing the
-
Maintain Rural Development funding (+$5 million, +0.2%) by offsetting a
Cooperative Service ($12 million, -12%). The General Provisions title does Senate Appropriations Committee, “FY2020 Agriculture Manager’s Package,” September 19, 2019. These eight amendments added $25 million spread across food insecurity, urban agriculture, equine encephalitis, pet shelter and housing, distance learning and telemedicine, tribal student scholarships, 1890s institutions, and the farm and ranch stress network. They remained budget neutral by reducing (offsetting) three administrative accounts by $26 million, including Agriculture Buildings and Facilities (-$14 million), Chief Financial Officer (-$6 million), and Departmental Administration (-$6 million). These reductions were about 44% of the committee-proposed amount for the Departmental Administration and 27% of the Chief Financial Officer (Table A-1). 30 31 Congressional Research Service 11 Agriculture and Related Agencies: FY2020 Appropriations Cooperative Service ($12 million, -12%). The General Provisions title does not continue any funding for a rural broadband pilot program.not continue any funding for a rural broadband pilot program. - Most of these increases are offset by a net change of -$
697672 million in budget3964 million).
Comparison of Discretionary Authority: Senate-Passed to to the House-Passed Bill
Compared to the House-passed bill and ranked by increases and decreases, the primary changes
in the Senate-reported bill that comprise the -$893894 million difference from the House bill include:
-
Agricultural research would be $193 million greater in the Senate-reported bill
-
Departmental administration accounts would be $
12397 million greater in the SenateAssistant Secretary forDepartmental Administration that -
Rural Development would be $407 million less in the Senate-reported bill than in
non-pilotnonpilot rural broadband programs), $70 million less for Rural Housing Service, and -
In addition, for a separate rural broadband pilot account, the General Provisions
-
Foreign agricultural assistance would be $159 million less in the Senate bill than
-
FDA appropriations would be $105 million less in the Senate-reported bill than in
Comparison of Mandatory Spending: Senate-Passed to to the House-Passed Bill
In addition to discretionary spending, the Senate-reported bill also carries mandatory spending—
largely determined in separate authorizing laws—that totals $129 billion. This is $153 million
less than in FY2019 and $2.3 billion less than in the House-passed bill. Compared to the House-passedHousepassed bill, amounts for CCC and crop insurance are the same. Mandatory amounts for the child
nutrition programs are about $400 million less than the House bill, and the amount for SNAP is
about $1.9 billion less than in the House bill.
Continuing Resolutions
Congressional Research Service
12
Agriculture and Related Agencies: FY2020 Appropriations
Continuing Resolutions
In the absence of a final Agriculture appropriation at the beginning of FY2020 on October 1,
2019, Congress passed a continuing resolution (CR) to continue operations and prevent a
government shutdown (P.L. 116-59, Division A).3132 The CR lasts nearly eight weeks until
November 21, 2019.
In general, a CR continues the funding rates and conditions that were in the previous year's appropriation.32’s
appropriation.33 The Office of Management and Budget (OMB) may prorate funding to the
agencies on an annualized basis for the duration of the CR through a process known as
apportionment.3334 For the first 52 days (14%) of FY2020 through November 21, 2019, the CR:
-
Continues the terms of the FY2019 Agriculture appropriations act (§101) with a
-
Provides sufficient funding to maintain mandatory program levels, including for
CRs may adjust prior-year amounts through anomalies or make specific administrative changes.
Five anomalies apply specifically to the Agriculture appropriation during this CR:
-
Rural Water and Waste Disposal Program (§101(1))
.. Allows the CR to coverdirectdirect loans in addition to loan guarantees and grants. In FY2019, -
Disaster Assistance for Sugar Beet Processors
.. Amends the list of34 Agricultural Research36 Agricultural Research (§117).(§117).Allows USDA to waive the non-federal matching-
Summer Food for Children Demonstration Projects
.. Allocates fundingprevious CRs. These projects, which include the Summer Electronic Benefit32 CRS Report R45982, Overview of Continuing Appropriations for FY2020 (P.L. 116-59). CRS Report R42647, Continuing Resolutions: Overview of Components and Practices. 34 For example, if a CR lasts for three months, then three-twelfths of the previous fiscal year amount may be apportioned to limit agency spending. See OMB, “Apportionment of the Continuing Resolution(s) for Fiscal Year 2020,” September 30, 2019, See also CRS Report RL34700, Interim Continuing Resolutions (CRs): Potential Impacts on Agency Operations. 35 The OMB bulletin about CRs (footnote 34) identifies the scope of mandatory programs included in Section 111 by referencing the conference report for the Balanced Budget Act of 1997 (H.Rept. 105-217). For Agriculture appropriations, these include SNAP, child nutrition, CCC, crop insurance, Section 32, and the dairy indemnity program. 36 For more information, see CRS In Focus IF11245, FY2019 Supplemental Appropriations for Agriculture. 33 Congressional Research Service 13 Agriculture and Related Agencies: FY2020 Appropriations previous CRs. These projects, which include the Summer Electronic Benefit Transfer (EBT) demonstration, have operated in selected states since FY2010.37 CCC (§119).Transfer (EBT) demonstration, have operated in selected states since FY2010.35 CCC (§119).Allows CCC to receive its appropriation about a month earlier than3638 Many payments to farmers are due in October 2019, includingUSDA'USDA’s plan to make supplemental payments under its trade assistance3739 Without the anomaly, CCC might have exhausted its $30 billion lineHempHemp (§120).. Provides $16.5 million on an annualized basis to the USDA((P.L. 115-334, §10113), which was created in the 2018 farm bill.38
40 37 For more information, see CRS Report R45486, Child Nutrition Programs: Current Issues. For more information, see CRS Insight IN11168, The CCC Anomaly in an FY2020 Continuing Resolution. 39 For more information, see CRS Report R45865, Farm Policy: USDA’s 2019 Trade Aid Package. 40 For more information, see CRS In Focus IF11088, 2018 Farm Bill Primer: Hemp Cultivation and Processing. 38 Congressional Research Service 14 Table 3. Agriculture and Related Agencies Appropriations, by Agency, FY2017-FY2020
Budget authority in millions of dollars
Agency or major program
FY2017
FY2018
FY2019
P.L. 11531
P.L. 115141
P.L. 116-6
FY2020
Admin.
request
Change from FY2019
House
H.R. 3055
Senate
H.R. 3055
Enacted
to Housepassed
to Senatepassed
Title I. Agricultural Programs
Budget authority in millions of dollars
|
FY2017 |
FY2018 |
FY2019 |
FY2020 |
Change from FY2019 |
|||||||
|
Agency or major program |
Admin. request |
House H.R. 3055 |
|
Enacted |
to House |
to Senate |
|||||
|
Title I. Agricultural Programs |
|||||||||||
Departmental Administration ( |
403.9 |
396.0 |
390.4 |
695.1 |
595.3 |
717.9 |
— |
+205.0 |
+327.6 |
||
|
Research, Education and Economics |
|||||||||||
|
Agricultural Research Service |
1,269.8 |
1,343.4 |
1,684.5 |
1,253.5 |
1,397.5 |
1,729.8 |
— |
-287.0 |
+45.3 |
||
|
National Institute of Food and Agriculture |
1,362.9 |
1,407.8 |
1,471.3 |
1,391.7 |
1,617.1 |
1,484.7 |
— |
+145.8 |
+13.4 |
||
|
National Agricultural Statistics Service |
171.2 |
191.7 |
174.5 |
163.0 |
180.8 |
175.3 |
— |
+6.3 |
+0.8 |
||
|
Economic Research Service |
86.8 |
86.8 |
86.8 |
60.5 |
87.8 |
86.8 |
— |
+1.0 |
+0.0 |
||
|
Under Secretary |
0.9 |
0.8 |
0.8 |
0.8 |
0.8 |
0.8 |
— |
+0.0 |
+0.0 |
||
|
Marketing and Regulatory Programs |
|||||||||||
|
Animal and Plant Health Inspection Service |
949.4 |
985.1 |
1,014.3 |
984.6 |
1,037.2 |
1,031.1 |
— |
+22.9 |
+16.8 |
||
|
86.2 |
152.8 |
160.3 |
116.3 |
193.1 |
182.8 |
— |
+32.8 |
+22.5 |
||
|
Section 32 (M) |
1,322.0 |
1,344.0 |
1,374.0 |
1,404.0 |
1,404.0 |
1,404.0 |
— |
+30.0 |
+30.0 |
||
|
43.5 |
| |||||||||
|
Under Secretary |
0.9 |
0.9 |
0.9 |
0.8 |
0.8 |
0.9 |
— |
-0.1 |
+0.0 |
||
|
Food Safety |
|||||||||||
|
Food Safety and Inspection Service |
1,032.1 |
1,056.8 |
1,049.3 |
1,045.3 |
1,054.3 |
1,054.3 |
— |
+5.0 |
+5.0 |
||
|
Under Secretary |
0.8 |
0.8 |
0.8 |
0.8 |
0.8 |
0.8 |
— |
+0.0 |
+0.0 |
||
| |||||||||||
|
1,624.0 |
| |||||||||
|
8,002.6 |
| |||||||||
|
Risk Management Agency |
74.8 |
| |||||||||
|
Federal Crop Insurance Corporation (M) |
8,667.0 |
| |||||||||
|
Commodity Credit Corporation (M) |
21,290.7 |
| |||||||||
|
Under Secretary |
0.9 |
| |||||||||
|
Subtotal, Title I |
|||||||||||
|
Discretionary |
7,107.7 |
5,622.8 |
6,033.9 |
5,712.3 |
6,165.6 |
6,465.2 |
— |
+131.6 |
+431.3 |
||
|
Mandatory (M) |
31,280.2 |
1,344.0 |
1,374.0 |
1,404.0 |
1,404.0 |
1,404.0 |
— |
+30.0 |
+30.0 |
||
|
Subtotal |
38,387.9 |
6,966.8 |
7,407.9 |
7,116.3 |
7,569.6 |
7,869.2 |
— |
+161.6 |
+461.3 |
||
|
|
|
|
|
|
|
|
|
|
||
|
Business Center |
— |
1.0 |
216.4 |
206.5 |
206.5 |
206.5 |
— |
-9.8 |
-9.8 |
||
|
|
1,625.2 |
1,494.2 |
1,412.7 |
1,536.1 |
1,544.4 |
— |
+41.9 |
+50.2 |
||
|
|
8,005.6 |
7,987.7 |
7,674.3 |
7,997.8 |
8,037.8 |
— |
+10.1 |
+50.1 |
||
|
Risk Management Agency |
|
74.8 |
58.4 |
56.0 |
58.4 |
58.4 |
— |
+0.0 |
+0.0 |
||
|
Federal Crop Insurance Corporation (M) |
|
8,913.0 |
15,410.6 |
8,936.0 |
8,936.0 |
8,936.0 |
— |
-6,474.6 |
-6,474.6 |
||
|
Commodity Credit Corporation (M) |
|
14,284.8 |
15,410.0 |
25,553.1 |
25,553.1 |
25,553.1 |
— |
+10,143.1 |
+10,143.1 |
||
|
Conservation Operations |
864.5 |
874.1 |
819.5 |
755.0 |
829.6 |
835.2 |
— |
+10.1 |
+15.7 |
||
|
Watershed and Flood Prevention |
150.0 |
150.0 |
150.0 |
— |
155.0 |
175.0 |
— |
+5.0 |
+25.0 |
||
|
Watershed Rehabilitation Program |
12.0 |
10.0 |
10.0 |
— |
12.0 |
— |
— |
+2.0 |
-10.0 |
||
|
Under Secretary |
0.9 |
0.9 |
0.9 |
0.9 |
0.9 |
0.9 |
— |
+0.0 |
+0.0 |
||
|
Subtotal, Title II |
|||||||||||
|
Discretionary |
1,027.4 |
2,735.6 |
2,748.8 |
2,430.6 |
2,798.0 |
2,819.9 |
— |
+49.3 |
+71.1 |
||
|
Mandatory (M) |
|
23,198.3 |
30,821.1 |
34,489.6 |
34,489.6 |
34,489.6 |
— |
+3,668.5 |
+3,668.5 |
||
|
Subtotal |
|
25,933.9 |
33,569.9 |
36,920.2 |
37,287.6 |
37,309.5 |
— |
+3,717.7 |
+3,739.6 |
||
|
Title III. Rural Development |
|
|
|
||||||||
|
675.8 |
680.8 |
686.8 |
622.2 |
705.8 |
692.0 |
— |
+19.0 |
+5.2 |
||
|
Rural Housing Service |
1,654.9 |
1,582.4 |
1,606.0 |
1,467.0 |
1,749.7 |
1,678.8 |
— |
+143.7 |
+72.8 |
||
|
28,083.4 |
28,390.1 |
28,293.8 |
27,260.0 |
28,423.0 |
28,645.5 |
— |
+129.2 |
+351.7 |
||
|
97.7 |
109.5 |
98.6 |
27.5 |
109.3 |
87.0 |
— |
+10.7 |
-11.6 |
||
|
988.4 |
991.2 |
1,026.4 |
1,000.0 |
1,288.9 |
1,038.9 |
— |
+262.5 |
+12.5 |
||
|
Rural Utilities Service |
639.9 |
|
|
821.3 |
|
558.1 |
— |
+237.9 |
-62.1 |
||
|
8,217.0 |
8,219.9 |
8,419.9 |
7,390.0 |
8,419.9 |
8,419.9 |
— |
+0.0 |
+0.0 |
||
|
0.9 |
|
0.8 |
0.8 |
— |
+0.0 |
+0.0 |
||||
|
Subtotal, Title III |
3,069.2 |
|
|
3,016.7 |
|
3,016.7 |
— |
+412.1 |
+5.0 |
||
|
37,288.9 |
37,601.2 |
37,740.0 |
38,104.2 |
38,131.7 |
38,104.2 |
— |
+391.7 |
+364.2 |
||
|
Title IV. Domestic Food Programs |
|
|
|
||||||||
|
Child Nutrition Programs (M) |
22,794.0 |
24,254.1 |
23,140.8 |
23,943.2 |
24,041.6 |
23,602.6 |
— |
+900.8 |
+461.8 |
||
|
WIC Program |
6,350.0 |
6,175.0 |
6,075.0 |
5,750.0 |
6,000.0 |
6,000.0 |
— |
-75.0 |
-75.0 |
||
|
SNAP, Food and Nutrition Act Programs (M) |
78,480.7 |
74,013.5 |
73,476.9 |
69,069.9 |
71,093.9 |
69,163.3 |
— |
-2,383.0 |
-4,313.6 |
||
|
Commodity Assistance Programs |
315.1 |
322.1 |
322.1 |
55.5 |
344.2 |
344.2 |
— |
+22.1 |
+22.1 |
||
|
Nutrition Programs Administration |
170.7 |
153.8 |
164.7 |
152.0 |
154.0 |
160.9 |
— |
-10.6 |
-3.8 |
||
|
Under Secretary |
0.8 |
0.8 |
0.8 |
0.8 |
0.8 |
0.8 |
— |
+0.0 |
+0.0 |
||
|
Subtotal, Title IV |
|||||||||||
|
Discretionary |
6,884.7 |
6,709.8 |
6,620.3 |
5,958.3 |
6,584.8 |
6,563.5 |
— |
-35.5 |
-56.8 |
||
|
Mandatory (M) |
101,226.7 |
98,209.6 |
96,560.0 |
93,013.1 |
95,049.8 |
92,708.3 |
— |
-1,510.2 |
-3,851.7 |
||
|
Subtotal |
108,111.3 |
104,919.4 |
103,180.3 |
98,971.4 |
101,634.6 |
99,271.8 |
— |
-1,545.7 |
-3,908.5 |
||
|
Title V. Foreign Assistance |
|
|
|
||||||||
|
Foreign Agricultural Service |
196.6 |
199.7 |
213.9 |
192.8 |
215.5 |
217.9 |
— |
+1.6 |
+4.0 |
||
|
Food for Peace Title II, and admin. expenses |
|
|
|
0.1 |
1,850.1 |
1,716.1 |
— |
+350.0 |
+216.0 |
||
|
McGovern-Dole Food for Education |
201.6 |
207.6 |
210.3 |
0.0 |
235.0 |
210.3 |
— |
+24.7 |
+0.0 |
||
|
CCC Export Loan Salaries |
8.5 |
8.8 |
8.8 |
6.4 |
8.8 |
6.4 |
— |
+0.0 |
-2.5 |
||
|
Office of Codex Alimentarius |
— |
3.8 |
4.0 |
4.8 |
4.8 |
4.8 |
— |
+0.8 |
+0.8 |
||
|
Under Secretary |
— |
0.9 |
0.9 |
0.9 |
0.9 |
0.9 |
— |
+0.0 |
+0.0 |
||
|
Subtotal, Title V |
1,872.9 |
2,021.0 |
1,938.0 |
205.0 |
2,315.2 |
2,156.3 |
— |
+377.2 |
+218.4 |
||
|
Title VI. Related Agencies |
|
|
|||||||||
|
Food and Drug Administration |
2,771.2 |
2,811.9 |
3,080.5 |
3,251.3 |
3,265.7 |
3,160.5 |
— |
+185.3 |
+80.0 |
||
|
|
249.0 |
|
250.0 |
315.0 |
|
— |
+47.0 |
+37.0 |
||
|
Subtotal, Title VI |
[3,021.2] |
3,060.9 |
[3,348.5] |
3,501.3 |
3,580.7 |
[3,465.5] |
— |
+232.3 |
+117.0 |
||
|
Title VII. General Provisions |
|
|
|
||||||||
| |||||||||||
|
a. Conservation programs |
-235.0 |
|
|
-60.2 |
-60.2 |
-60.2 |
— |
+0.0 |
+0.0 |
||
|
b. Nutrition programs |
-106.0 |
+5.0 |
+5.0 |
— |
+6.0 |
+5.0 |
— |
+1.0 |
+0.0 |
||
|
c. Energy programs |
-40.0 |
-21.0 |
— |
— |
— |
— |
— |
— |
— |
||
|
d. Rural Development (Cushion of Credit) |
-132.0 |
— |
— |
— |
— |
— |
— |
— |
— |
||
|
e. Section 32 |
-231.0 |
— |
— |
— |
— |
— |
— |
— |
— |
||
|
f. Farm Production & Conservation Bus. Ctr. |
— |
|
|
+60.2 |
+60.2 |
+60.2 |
— |
+0.0 |
+0.0 |
||
|
g. Other CHIMPS and mandatory rescissions |
— |
+15.0 |
+10.0 |
— |
— |
— |
— |
-10.0 |
-10.0 |
||
|
-744.0 |
-1.0 |
+15.0 |
+0.0 |
+6.0 |
+5.0 |
— |
-9.0 |
-10.0 |
||
Table A-1)
403.9
396.0
390.4
695.1
595.3
691.9
—
+205.0
+301.6
Agricultural Research Service
1,269.8
1,343.4
1,684.5
1,253.5
1,397.5
1,729.8
—
-287.0
+45.3
National Institute of Food and Agriculture
1,362.9
1,407.8
1,471.3
1,391.7
1,617.1
1,484.7
—
+145.8
+13.4
171.2
191.7
174.5
163.0
180.8
175.3
—
+6.3
+0.8
86.8
86.8
86.8
60.5
87.8
86.8
—
+1.0
+0.0
0.9
0.8
0.8
0.8
0.8
0.8
—
+0.0
+0.0
949.4
985.1
1,014.3
984.6
1,037.2
1,031.1
—
+22.9
+16.8
86.2
152.8
160.3
116.3
193.1
182.8
—
+32.8
+22.5
1,322.0
1,344.0
1,374.0
1,404.0
1,404.0
1,404.0
—
+30.0
+30.0
Research, Education and Economics
National Agricultural Statistics Service
Economic Research Service
Under Secretary
Marketing and Regulatory Programs
Animal and Plant Health Inspection Service
Agricultural Marketing Servicea
Section 32 (M)
Grain Inspection, Packers, Stockyards Admin.a
Under Secretary
43.5
moved into Agricultural Marketing Servicea
0.9
0.9
0.9
0.8
0.8
0.9
—
-0.1
+0.0
1,032.1
1,056.8
1,049.3
1,045.3
1,054.3
1,054.3
—
+5.0
+5.0
0.8
0.8
0.8
0.8
0.8
0.8
—
+0.0
+0.0
Food Safety
Food Safety and Inspection Service
Under Secretary
Farm and Commodity
Programsa
Farm Service Agencyb
FSA Farm Loans: Loan Authorityc
CRS-15
1,624.0
moved to Title II: Farm Production and Conservationa
8,002.6
moved to Title II: Farm Production and Conservationa
Agency or major program
Risk Management Agency
Federal Crop Insurance Corporation (M)
Commodity Credit Corporation (M)
Under Secretary
FY2017
FY2018
FY2019
P.L. 11531
P.L. 115141
P.L. 116-6
FY2020
Admin.
request
House
H.R. 3055
74.8
moved to Title II: Farm Production and Conservationa
8,667.0
moved to Title II: Farm Production and Conservationa
21,290.7
moved to Title II: Farm Production and Conservationa
0.9
moved to Title II: Farm Production and Conservationa
Change from FY2019
Senate
H.R. 3055
Enacted
to Housepassed
to Senatepassed
Subtotal, Title I
Discretionary
7,107.7
5,622.8
6,033.9
5,712.3
6,165.6
6,439.2
—
+131.6
+405.3
Mandatory (M)
31,280.2
1,344.0
1,374.0
1,404.0
1,404.0
1,404.0
—
+30.0
+30.0
38,387.9
6,966.8
7,407.9
7,116.3
7,569.6
7,843.2
—
+161.6
+435.3
Business Center
—
1.0
216.4
206.5
206.5
206.5
—
-9.8
-9.8
Farm Service Agencyb
—a
1,625.2
1,494.2
1,412.7
1,536.1
1,544.4
—
+41.9
+50.2
—a
8,005.6
7,987.7
7,674.3
7,997.8
8,037.8
—
+10.1
+50.1
Risk Management Agency
—a
74.8
58.4
56.0
58.4
58.4
—
+0.0
+0.0
Federal Crop Insurance Corporation (M)
—a
8,913.0
15,410.6
8,936.0
8,936.0
8,936.0
—
-6,474.6
-6,474.6
Commodity Credit Corporation (M)
—a
14,284.8
15,410.0
25,553.1
25,553.1
25,553.1
—
+10,143.1
+10,143.1
Conservation Operations
864.5
874.1
819.5
755.0
829.6
835.2
—
+10.1
+15.7
Watershed and Flood Prevention
150.0
150.0
150.0
—
155.0
175.0
—
+5.0
+25.0
Watershed Rehabilitation Program
12.0
10.0
10.0
—
12.0
—
—
+2.0
-10.0
0.9
0.9
0.9
0.9
0.9
0.9
—
+0.0
+0.0
1,027.4
2,735.6
2,748.8
2,430.6
2,798.0
2,819.9
—
+49.3
+71.1
Mandatory (M)
—a
23,198.3
30,821.1
34,489.6
34,489.6
34,489.6
—
+3,668.5
+3,668.5
Subtotal
—a
25,933.9
33,569.9
36,920.2
37,287.6
37,309.5
—
+3,717.7
+3,739.6
Subtotal
Title II. Farm Production and
Conservationa
FSA Farm Loans: Loan Authorityc
Under Secretary
Subtotal, Title II
Discretionary
CRS-16
Agency or major program
FY2017
FY2018
FY2019
P.L. 11531
P.L. 115141
P.L. 116-6
FY2020
Admin.
request
Change from FY2019
House
H.R. 3055
Senate
H.R. 3055
Enacted
to Housepassed
to Senatepassed
Title III. Rural Development
Salaries and Expenses (including transfers)d
Rural Housing Service
RHS Loan
Authorityc
Rural Business-Cooperative
RBCS Loan
Servicee
Authorityc
Rural Utilities Service
RUS Loan Authorityc
Under Secretaryg
Subtotal, Title III
675.8
680.8
686.8
622.2
705.8
692.0
—
+19.0
+5.2
1,654.9
1,582.4
1,606.0
1,467.0
1,749.7
1,678.8
—
+143.7
+72.8
28,083.4
28,390.1
28,293.8
27,260.0
28,423.0
28,645.5
—
+129.2
+351.7
97.7
109.5
98.6
27.5
109.3
87.0
—
+10.7
-11.6
988.4
991.2
1,026.4
1,000.0
1,288.9
1,038.9
—
+262.5
+12.5
639.9
628.1f
620.2f
821.3
858.1f
558.1
—
+237.9
-62.1
8,217.0
8,219.9
8,419.9
7,390.0
8,419.9
8,419.9
—
+0.0
+0.0
temporarily moved to Dept. Admin.g
0.8
0.8
—
+0.0
+0.0
0.9
3,069.2
3,000.9f
3,011.7f
3,016.7
3,423.8f
3,016.7
—
+412.1
+5.0
37,288.9
37,601.2
37,740.0
38,104.2
38,131.7
38,104.2
—
+391.7
+364.2
22,794.0
24,254.1
23,140.8
23,943.2
24,041.6
23,602.6
—
+900.8
+461.8
6,350.0
6,175.0
6,075.0
5,750.0
6,000.0
6,000.0
—
-75.0
-75.0
78,480.7
74,013.5
73,476.9
69,069.9
71,093.9
69,163.3
—
-2,383.0
-4,313.6
Commodity Assistance Programs
315.1
322.1
322.1
55.5
344.2
344.2
—
+22.1
+22.1
Nutrition Programs Administration
170.7
153.8
164.7
152.0
154.0
160.9
—
-10.6
-3.8
0.8
0.8
0.8
0.8
0.8
0.8
—
+0.0
+0.0
6,884.7
6,709.8
6,620.3
5,958.3
6,584.8
6,563.5
—
-35.5
-56.8
Mandatory (M)
101,226.7
98,209.6
96,560.0
93,013.1
95,049.8
92,708.3
—
-1,510.2
-3,851.7
Subtotal
108,111.3
104,919.4
103,180.3
98,971.4
101,634.6
99,271.8
—
-1,545.7
-3,908.5
Subtotal, RD Loan Authorityc
Title IV. Domestic Food Programs
Child Nutrition Programs (M)
WIC Program
SNAP, Food and Nutrition Act Programs (M)
Under Secretary
Subtotal, Title IV
Discretionary
CRS-17
Agency or major program
FY2017
FY2018
FY2019
P.L. 11531
P.L. 115141
P.L. 116-6
FY2020
Admin.
request
Change from FY2019
House
H.R. 3055
Senate
H.R. 3055
Enacted
to Housepassed
to Senatepassed
Title V. Foreign Assistance
Foreign Agricultural Service
196.6
199.7
213.9
192.8
215.5
217.9
—
+1.6
+4.0
1,466.1f
1,600.1f
1,500.1f
0.1
1,850.1
1,716.1
—
+350.0
+216.0
201.6
207.6
210.3
0.0
235.0
210.3
—
+24.7
+0.0
CCC Export Loan Salaries
8.5
8.8
8.8
6.4
8.8
6.4
—
+0.0
-2.5
Office of Codex Alimentarius
—
3.8
4.0
4.8
4.8
4.8
—
+0.8
+0.8
Under Secretary
—
0.9
0.9
0.9
0.9
0.9
—
+0.0
+0.0
1,872.9
2,021.0
1,938.0
205.0
2,315.2
2,156.3
—
+377.2
+218.4
Food and Drug Administration
2,771.2
2,811.9
3,080.5
3,251.3
3,265.7
3,160.5
—
+185.3
+80.0
Commodity Futures Trading Commissionh
[250.0]i
249.0
[268.0]i
250.0
315.0
[305.0]i
—
+47.0
+37.0
[3,021.2]
3,060.9
[3,348.5]
3,501.3
3,580.7
[3,465.5]
—
+232.3
+117.0
a. Conservation programs
-235.0
[-0.1]k
[-60.2]k
-60.2
-60.2
-60.2
—
+0.0
+0.0
b. Nutrition programs
-106.0
+5.0
+5.0
—
+6.0
+5.0
—
+1.0
+0.0
-40.0
-21.0
—
—
—
—
—
—
—
d. Rural Development (Cushion of Credit)
-132.0
—
—
—
—
—
—
—
—
e. Section 32
-231.0
—
—
—
—
—
—
—
—
f. Farm Production & Conservation Bus. Ctr.
—
[+0.1]k
[+60.2]k
+60.2
+60.2
+60.2
—
+0.0
+0.0
g. Other CHIMPS and mandatory rescissions
—
+15.0
+10.0
—
—
—
—
-10.0
-10.0
Subtotal, CHIMPS (Table B-1)
-744.0
-1.0
+15.0
+0.0
+6.0
+5.0
—
-9.0
-10.0
Rescissions (discretionary)l ( |
-854.0 |
-800.0 |
-505.0 |
-1,153.0 |
-805.8 |
-815.1 |
— |
-300.8 |
-310.1 |
||
Table B-2)
-854.0
-800.0
-505.0
-1,153.0
-805.8
-815.1
—
-300.8
-310.1
Food for Peace Title II, and admin. expenses
McGovern-Dole Food for Education
Subtotal, Title V
Title VI. Related Agencies
Subtotal, Title VI
Title VII. General Provisions
Changes in Mandatory Programs (CHIMPS)j
c. Energy programs
CRS-18
Agency or major program
FY2017
FY2018
FY2019
P.L. 11531
P.L. 115141
P.L. 116-6
FY2020
Admin.
request
Change from FY2019
House
H.R. 3055
Senate
H.R. 3055
Enacted
to Housepassed
to Senatepassed
Other appropriations | |||||||||||
|
a. Disaster/emergency programs |
234.8 |
— |
— |
— |
— |
— |
— |
— |
— |
||
|
b. Water and Waste Water |
— |
500.0 |
75.0 |
— |
— |
— |
— |
-75.0 |
-75.0 |
||
|
c. Broadband pilot |
— |
600.0 |
125.0 |
— |
518.0 |
— |
— |
+393.0 |
-125.0 |
||
|
d. Opioid Enforcement and Surveillance |
— |
94.0 |
— |
— |
— |
— |
— |
— |
— |
||
|
e. Food for Peace |
134.0 |
116.0 |
216.0 |
— |
— |
— |
— |
-216.0 |
-216.0 |
||
|
f. Other appropriations |
103.4 |
68.1 |
77.5 |
— |
110.8 |
116.5 |
— |
+33.3 |
+39.0 |
||
|
Subtotal, Other appropriations |
472.2 |
1,378.1 |
493.5 |
— |
628.8 |
116.5 |
— |
+135.3 |
-377.0 |
||
|
Subtotal, Title VII |
-1,125.8 |
577.1 |
3.5 |
-1,153.0 |
-171.0 |
-693.6 |
— |
-174.5 |
-697.1 |
||
|
|
|
|
||||||||
|
Disaster declaration in this bill |
-206.1 |
— |
— |
— |
— |
— |
— |
— |
— |
||
|
Other scorekeeping adjustments |
-524.0 |
-481.0 |
-404.0 |
-403.0 |
-398.0 |
-398.0 |
— |
+6.0 |
+6.0 |
||
|
Subtotal, Scorekeeping adjustments |
-730.1 |
-481.0 |
-404.0 |
-403.0 |
-398.0 |
-398.0 |
— |
+6.0 |
+6.0 |
||
|
Totals |
|
|
|
|
|
||||||
|
20,877.0 |
[22,998.0] |
23,032.7 |
18,939.6 |
[23,984.0] |
23,090.6 |
— |
+951.3 |
+57.9 |
||
|
[21,127.0] |
23,247.0 |
[23,300.7] |
19,189.6 |
24,299.0 |
[23,395.6] |
— |
+998.3 |
+94.9 |
||
|
Mandatory (M) |
132,506.9 |
122,752.0 |
128,755.1 |
128,906.7 |
130,943.4 |
128,601.9 |
— |
+2,188.3 |
-153.2 |
||
|
Total: Senate basis w/o CFTC |
153,383.9 |
[145,750.0] |
151,787.8 |
147,846.4 |
[154,927.4] |
151,692.5 |
— |
+3,139.6 |
-95.4 |
||
|
Total: House basis w/ CFTC |
[153,633.9] |
145,999.0 |
[152,055.8] |
148,096.4 |
155,242.4 |
151,997.5 |
— |
+3,186.6 |
-58.4 |
||
Source: CRS, using appropriations text, report tables, and unpublished CBO tables. For FY2020: House-passed H.R. 3055 (Division B), and Senate-reported S. 2522.
Notes: Amounts are nominal discretionary budget authority in millions of dollars unless labeled otherwise. "(M)" indicates that the account is mandatory authority (or primarily mandatory authority). Excludes amounts in supplemental appropriations acts. Bracketed amounts are not in the Agriculture appropriations totals due to differing House-Senate jurisdiction for CFTC but are shown for comparison.
a. differing House-Senate jurisdiction for CFTC but are shown for comparison.
CRS-19
a.
b.
c.
d.
e.
f.
g.
h.
i.
j.
k.
l.
m.
CRS-20
Row headings reflect recent USDA reorganization. The Farm Service Agency and Risk Management Agency were moved from Title I to Title II, as was the
Commodity Credit Corporation and Federal Crop Insurance Corporation in mandatory spending. Grain Inspection, Packers, and Stockyards Administration was
moved into the Agricultural Marketing Service.
b.
Includes regular FSA salaries and expenses, plus transfers for farm loan program salaries and administrative expenses. Also includes farm loan program loan subsidy,
State Mediation Grants, Dairy Indemnity Program (mandatory funding), and Grassroots Source Water Protection Program. Does not include appropriations to the
Foreign Agricultural Service for export loans and P.L. 480 administration that are transferred to FSA.
c.
Loan authority is the amount of loans that can be made or guaranteed with a loan subsidy. This amount is not added in the budget authority subtotals or totals.
d.
Rural Development salaries and expenses include a base amount plus transfers from the three rural development agencies. Amounts presented for the agencies
therefore include program funds for loans and grants.
e.
Amounts for the Rural Business-Cooperative Service (RBCS) are before the rescission in the Cushion of Credit account, which is different than the Appropriations
Committee tables. The rescission is included with the CHIMPS as classified by CBO, which allows the RBCS subtotal to remain positive (Table B-1).
f. ).
Excludes a portion of the other appropriations that are provided separately in General Provisions (see Table B-3).
g. ).
The USDA-initiated reorganization in 2017 created an "“Assistant to the Secretary for Rural Development"” as part of the Office of the Secretary rather than the
previously Senate-confirmed undersecretary position. The 2018 farm bill reinstated the undersecretary position.
h.
Jurisdiction for the Commodity Futures Trading Commission (CFTC) is in the House Agriculture Appropriations Subcommittee and the Senate Financial Services
Appropriations Subcommittee. After FY2008, CFTC is carried in the enacted Agriculture appropriations in even-numbered fiscal years. It is always carried in House
Agriculture subcommittee markup but never in Senate Agriculture subcommittee markup. Bracketed amounts are not in the Agriculture appropriations totals due
to differing House-Senate jurisdiction for CFTC but are shown for comparison.
i.
The amount for CFTC in FY2017 and FY2019 is from the Financial Services and General Government (FSGG) division of the Consolidated Appropriation and for
FY2020 from the Senate bill for FSGG (S. 2524).
j. ).
Includes reductions (limitations and rescissions) and increases to mandatory programs that are known as CHIMPS.
k.
These bracketed amounts were not in the official CBO scoring of CHIMPS. Appropriations acts in FY2018 and FY2019 transferred mandatory conservation funding
into the Farm Production and Conservation Business Center, but the official CBO scoring of appropriations at that time did not record it as a CHIMP the way that
the FY2020 scoring reflects. For more background, see CRS Report R45406, FY2018 and FY2019 Appropriations for Agricultural Conservation.
l. .
Rescissions are actions that reduce a budget authority subsequent to an enacted appropriation. They score budgetary savings. Any rescissions from mandatory
programs are included with the CHIMPS.
m. "
“Scorekeeping adjustments"” are not necessarily appropriated items and may not be shown in Appropriations Committee tables but are part of the official CBO
score (accounting) of the bill. They predominantly include "“negative subsidies"” in loan program accounts (mostly from receipt of fees) and adjustments for disaster
designations in the bill.
Policy-Related Provisions
Agriculture appropriations
Agriculture and Related Agencies: FY2020 Appropriations
Policy-Related Provisions
Appropriations bills have also been a vehicle for policy-related provisions that direct how the
executive branch should carry out thean appropriation. These provisions may have the force of law if
they are included in the text of the appropriation, but their effect is generally limited to the current
fiscal year. In some instances, the provisions may amend the U.S. Code and have long-standing effects.
In addition to the text of an unless they amend the U.S. Code. Table 4 compares some of the primary policy
provisions that are included in the FY2020 Agriculture appropriations bills.
In addition to the text of an appropriations act, report language may also provide policy
instructions. Although report language does not carry the force of text in an act, it often explains
congressional intent, which the agencies may be expected to follow. IndeedStatements in the committee
reports that accompany the committee-reported versions of the FY2020 bills (H.Rept. 116-107 for
H.R. 3164, and S.Rept. 116-110 for S. 2522) are not included in Table 4.
In the past, Congress has said that committee and conference reports may need to be read together to
capture all of the congressional intent for a fiscal year. For example, the FY2019 explanatory
statement for the consolidated appropriations act instructs that the House and Senate reports
should be read together with the conference agreement:
Congressional Directives. The explanatory statement is silent on provisions that were in
both the House Report (H.Rept. 115-706) and Senate Report (S.Rept. 115-259) that remain
unchanged by this conference agreement, except as noted in this explanatory statement.
The conference agreement restates that executive branch wishes cannot substitute for Congress'
Congress’s own statements as to the best evidence of congressional intentions, which are
the official reports of the Congress…. The House and Senate report language that is not
changed by the explanatory statement is approved and indicates congressional intentions.
The explanatory statement, while repeating some report language for emphasis, does not
intend to negate the language referred to above unless expressly provided herein.39
Table 4 compares some of the primary policy provisions that are included in the text of the FY2020 Agriculture appropriations bills. Statements in the committee reports that accompany the bills may also express congressional intent but are not included in this table.
House-passed H.R. 3055 |
Senate-reported S. 2522 |
Enacted |
|
Relocation and restructuring |
||
, Division B
Senate-passed H.R. 3055, Division B
Enacted
Relocation and restructuring
Economic Research Service (ERS) | Title I)
No comparable provision in Title I.
Provides $15.5 million for relocation. |
— |
(§762)
—
National Institute of Food and Agriculture | Title I) No comparable provision in Title I.
Provides $9.5 million for relocation. |
— |
| Title I)a
Same as House provision. ( |
— |
|
No comparable provision. See §716. |
— |
|
|
— |
(§716)b
—
Relocation. None of the funds may be used to |
No comparable provision. |
— |
Restructuring. None of the funds may be used to |
No comparable provision. |
— |
|
Disaster Programs |
||
Disaster payments. In general, prohibits the use of |
|
— |
|
No comparable provision. |
(§714)c
No comparable provision.
Disaster assistance for sugar beet processors | |
|
Agricultural Research |
||
|
No comparable provision. |
— |
(§784)
No comparable provision.
—
Matching requirement |
No comparable provision. |
— |
(§762)
No comparable provision.
—
National Bio and Agro-Defense Facility (NBAF). | (§766)
Same as House provision. (§ |
— |
|
Nutrition Assistance Programs |
||
735)
—
SNAP retailer standards. Prohibits funding to | (§728)
Same as House provision. |
— |
(§726)
—
School meal prices. |
No comparable provision. |
— |
(§747)
No comparable provision.
—
Vegetables in school breakfast. Prohibits funding to |
Same as House provision. (§751) |
— |
|
Livestock, Animals, Regulatory Agencies |
||
(§750)
Livestock, Animals, Regulatory Agencies
Horse slaughter. Prohibits USDA from conducting | (§740)
Same as House provision. (§ |
— |
765)
—
Animal Welfare Act |
(§736)
Same as House provision. (§ |
— |
739)
—
Directs the Animal and Plant Health Inspection Service |
No comparable provision. |
— |
(§760)
No comparable provision.
—
Organic livestock. Directs USDA to finalize the | (§756)
Same as House provision. (§ |
— |
752)
—
Poultry from China. Prohibits funds to buy raw or |
No comparable provision. |
— |
(§739)
No comparable provision.
—
Prohibits funding to finalize the proposed rule, |
No comparable provision. |
— |
(§742)
No comparable provision.
—
Swine Slaughter Inspection. Prohibits USDA from |
No comparable provision. |
— |
|
No comparable provision. |
(§779)
No comparable provision.
—
No comparable provision.
Genetically engineered salmon. Prohibits | |
|
Rural Development |
||
| (§737)
Same as House provision. (§ |
— |
740)
—
Persistent poverty counties. Requires that at least |
(§741)
Same as House provision. |
— |
|
No comparable provision. |
(§745)
—
No comparable provision.
REAP Zones. Sets aside funding for Rural Economic | |
|
Food and Drug Administration |
||
(§741)
Congressional Research Service
23
House-passed H.R. 3055, Division B
Senate-passed H.R. 3055, Division B
Enacted
Food and Drug Administration
Produce for human consumption | (§746)
Grapes for wine. Similar to House provision except |
— |
|
No comparable provision. |
— |
(§751)
No comparable provision.
—
Human embryos. Prohibits FDA from using funds to | Same as House provision. (§ |
— |
|
No comparable provision. |
730)
—
No comparable provision.
E-cigarettes and | |
| ||
Forest Service. Prohibits USDA from eliminating the |
No comparable provision. |
— |
|
Other |
||
(§780)
No comparable provision.
—
Other
Hemp. No comparable provision in Division B. | Prohibits using appropriations to contravene §7606 of |
727)
Source: CRS.
CRS.
a. The issue of closing an FSA county office is also addressed in a permanent law that requires certain
conditions and notifications (7 U.S.C. §6932a). This appropriations provision, continued from previous
years, would augment the standing law for one year.
b. For USDA, Section 716 of the House bill omits a conditional clause that has been used in prior years' ’
appropriations that would presumably allow reorganization only if USDA notifies Congress and receives
approval from the Appropriations committees. For CFTC and FDA, Section 717 of the House bill (and
Section 716 of the Senate bill for USDA and FDA) retains the conditional approval clause. The USDA Office
of General Counsel recently noted that these types of approval clauses have been found to be
unconstitutional as determined by the Supreme Court in INS v. Chada (1983). See the USDA inspector general'
general’s report about relocating ERS and NIFA and the USDA Office of General Counsel'’s comments (OIG OIG
Report 91801-00001-23, p. 35, August 2019).
c. Appropriations acts from FY2012 to FY2016 imposed a complete prohibition on disaster payments that
relied upon Clause (3) of Section 327 (U.S.C. §612c) or Section (5) of the Commodity Credit Corporation
(CCC, 15 U.S.C. §714c). Beginning in FY2017, the restriction provision in appropriations began to allow a
limited amount of carryover in Section 32 to fund Clause (3) up to $75 million, but the complete
prohibition continued on Section (5) of CCC. Beginning in FY2018, the restriction on CCC was lifted (by
no longer being inserted into the appropriation), and the Section 32 allowance for carryover rose to up to
$350 million.
d. Although the Forest Service is part of USDA, jurisdiction for its appropriations are in the Interior and
Related Agencies Appropriations Act.
Appendix A.
Congressional Research Service
24
Appendix A. Appropriations in Administrative Accounts
Table A-1. USDA Departmental Administration Appropriations
Budget authority in millions of dollars
Office
FY2017
FY2018
FY2019
P.L. 11531
P.L. 115141
P.L. 116-6
FY2020
Admin.
request
Change from FY2019
House
H.R. 3055
Senate
H.R. 3055
3.9
6.0
Enacted
to Housepassed
to Senatepassed
-1.2
+1.0
-0.8
-0.8
Office of the Secretary
Office of the Secretary
5.1
Office of Tribal Relations
Assistant to the Sec. for Rural
0.5
Developmenta
5.1
5.1
4.9
—
Combined with Public Partnership and Engagement
—
0.8
0.8
0.8
Office of Homeland Security
1.5
1.5
1.5
1.4
1.4
1.5
—
+0.0
+0.0
Public Partnership and Engagementb
1.2
4.7
4.7
1.7
6.2
4.7
—
+1.5
+0.0
Assistant Secretary for Admin.
0.8
0.8
0.9
0.9
0.9
0.9
—
+0.0
+0.0
Departmental Administration
24.1
22.3
22.3
21.4
0.4
16.3
—
-21.9
-6.0
Asst. Sec. Congressional Relations
3.9
3.9
3.9
3.1
3.1
3.9
—
-0.8
+0.0
Office of Communications
7.5
7.5
7.5
7.3
3.7
7.5
—
-3.8
+0.0
44.6
46.5
46.6
41.4
19.5
40.8
—
-27.1
-5.8
Office of Chief Economist
18.9
19.8
21.3
18.5
21.0
24.3
—
-0.3
+3.0
Office of Hearings and Appeals
13.4
15.2
15.2
13.5
15.2
15.2
—
+0.0
+0.0
9.5
9.5
9.5
8.2
9.5
9.5
—
+0.0
+0.0
41.8
44.5
46.0
40.2
45.8
49.0
—
-0.3
+3.0
Subtotal
Moved back to Rural Developmenta
Executive Operations
Office of Budget, Program Analysis
Subtotal
CRS-25
Office
FY2017
FY2018
FY2019
P.L. 11531
P.L. 115141
P.L. 116-6
FY2020
Admin.
request
Change from FY2019
House
H.R. 3055
Senate
H.R. 3055
Enacted
to Housepassed
to Senatepassed
Other Administration
Chief Information Officer
49.5
59.0
55.6
101.4
48.9
101.4
—
-6.7
+45.8
Chief Financial Officer
8.0
6.0
6.0
13.5
6.0
7.5
—
+0.0
+1.5
Assistant Secretary for Civil Rights
0.9
0.9
0.9
0.8
0.9
0.9
—
+0.0
+0.0
Office of Civil Rights
24.2
24.2
24.2
21.2
24.2
24.2
—
+0.0
+0.0
Buildings and facilities
84.2
64.4
60.0
331.1
330.1
317.1
—
+270.1
+257.1
3.6
3.5
3.5
3.3
5.3
3.5
—
+1.8
+0.0
Office of Inspector General
98.2
98.2
98.2
98.2
99.2
98.2
—
+1.0
+0.0
General Counsel
44.7
44.5
45.1
41.2
11.2
45.1
—
-33.9
+0.0
4.1
4.1
4.1
2.8
4.1
4.1
—
+0.0
+0.0
317.5
304.9
297.7
613.5
530.1
602.1
—
+232.3
+304.4
403.9
396.0
390.4
695.1
595.3
691.9
—
+205.0
+301.6
Hazardous materials management
Office of Ethics
Subtotal
Total, Departmental Administration
Source: CRS, using appropriations text and report tables. For FY2020, House-passed and Senate-passed are H.R. 3055 (Division B).
a. The USDA-initiated reorganization in 2017 created an “Assistant to the Secretary for Rural Development” as part of the Office of the Secretary rather than the
previously Senate-confirmed undersecretary position. The 2018 farm bill reinstated the undersecretary position.
b. Budget authority in millions of dollars
|
FY2017 |
FY2018 |
FY2019 |
FY2020 |
Change from FY2019 |
|||||||
|
Office |
Admin. request |
House H.R. 3055 |
|
Enacted |
to House |
to Senate |
|||||
|
Office of the Secretary |
|||||||||||
|
Office of the Secretary |
5.1 |
5.1 |
5.1 |
4.9 |
3.9 |
|
— |
-1.2 |
+1.0 |
||
|
Office of Tribal Relations |
0.5 |
Combined with Public Partnership and Engagement |
|||||||||
|
— |
0.8 |
0.8 |
0.8 |
|||||||
|
Office of Homeland Security |
1.5 |
1.5 |
1.5 |
1.4 |
1.4 |
1.5 |
— |
+0.0 |
+0.0 |
||
|
1.2 |
4.7 |
4.7 |
1.7 |
6.2 |
4.7 |
— |
+1.5 |
+0.0 |
||
|
Assistant Secretary for Admin. |
0.8 |
0.8 |
0.9 |
0.9 |
0.9 |
0.9 |
— |
+0.0 |
+0.0 |
||
|
Departmental Administration |
24.1 |
22.3 |
22.3 |
21.4 |
0.4 |
22.3 |
— |
-21.9 |
+0.0 |
||
|
Asst. Sec. Congressional Relations |
3.9 |
3.9 |
3.9 |
3.1 |
3.1 |
3.9 |
— |
-0.8 |
+0.0 |
||
|
Office of Communications |
7.5 |
7.5 |
7.5 |
7.3 |
3.7 |
7.5 |
— |
-3.8 |
+0.0 |
||
|
Subtotal |
44.6 |
46.5 |
46.6 |
41.4 |
19.5 |
46.8 |
— |
-27.1 |
+0.2 |
||
|
Executive Operations |
|||||||||||
|
Office of Chief Economist |
18.9 |
19.8 |
21.3 |
18.5 |
21.0 |
24.3 |
— |
-0.3 |
+3.0 |
||
|
Office of Hearings and Appeals |
13.4 |
15.2 |
15.2 |
13.5 |
15.2 |
15.2 |
— |
+0.0 |
+0.0 |
||
|
Office of Budget, Program Analysis |
9.5 |
9.5 |
9.5 |
8.2 |
9.5 |
9.5 |
— |
+0.0 |
+0.0 |
||
|
Subtotal |
41.8 |
44.5 |
46.0 |
40.2 |
45.8 |
49.0 |
— |
-0.3 |
+3.0 |
||
|
Other Administration |
|||||||||||
|
Chief Information Officer |
49.5 |
59.0 |
55.6 |
101.4 |
48.9 |
101.4 |
— |
-6.7 |
+45.8 |
||
|
Chief Financial Officer |
8.0 |
6.0 |
6.0 |
13.5 |
6.0 |
13.5 |
— |
+0.0 |
+7.5 |
||
|
Assistant Secretary for Civil Rights |
0.9 |
0.9 |
0.9 |
0.8 |
0.9 |
0.9 |
— |
+0.0 |
+0.0 |
||
|
Office of Civil Rights |
24.2 |
24.2 |
24.2 |
21.2 |
24.2 |
24.2 |
— |
+0.0 |
+0.0 |
||
|
Buildings and facilities |
84.2 |
64.4 |
60.0 |
331.1 |
330.1 |
331.1 |
— |
+270.1 |
+271.1 |
||
|
Hazardous materials management |
3.6 |
3.5 |
3.5 |
3.3 |
5.3 |
3.5 |
— |
+1.8 |
+0.0 |
||
|
Office of Inspector General |
98.2 |
98.2 |
98.2 |
98.2 |
99.2 |
98.2 |
— |
+1.0 |
+0.0 |
||
|
General Counsel |
44.7 |
44.5 |
45.1 |
41.2 |
11.2 |
45.1 |
— |
-33.9 |
+0.0 |
||
|
Office of Ethics |
4.1 |
4.1 |
4.1 |
2.8 |
4.1 |
4.1 |
— |
+0.0 |
+0.0 |
||
|
Subtotal |
317.5 |
304.9 |
297.7 |
613.5 |
530.1 |
622.1 |
— |
+232.3 |
+324.4 |
||
|
Total, Departmental Administration |
403.9 |
396.0 |
390.4 |
695.1 |
595.3 |
717.9 |
— |
+205.0 |
+327.6 |
||
Source: CRS, using appropriations text and report tables. For FY2020: House-passed H.R. 3055 (Division B) and Senate-reported S. 2522.
a. The USDA-initiated reorganization in 2017 created an "Assistant to the Secretary for Rural Development" as part of the Office of the Secretary rather than the previously Senate-confirmed undersecretary position. The 2018 farm bill reinstated the undersecretary position.
b. Formerly, this was the Office of Advocacy and Outreach.
Appendix B.
Formerly, this was the Office of Advocacy and Outreach.
CRS-26
Appendix B. Appropriations in General Provisions
Table B-1. General Provisions: Changes in Mandatory Program Spending (CHIMPS)
Budget authority in millions of dollars
CHIMPS and mandatory rescissions
FY2017
FY2018
FY2019
P.L. 11531
P.L. 115141
P.L. 116-6
FY2020
Admin.
request
Change from FY2019
House
H.R. 3055
Senate
H.R. 3055
Enacted
to Housepassed
to Senatepassed
a. Farm bill conservation programs
Farm Security Rural Investment Act programs
—
[-0.1]a
[-60.2]a
-60.2
-60.2
-60.2
—
+0.0
+0.0
-179.0
—
—
—
—
—
—
—
—
Watershed Rehabilitation Program
-54.0
—
—
—
—
—
—
—
—
Agricultural Management Assistance
-2.0
—
—
—
—
—
—
—
—
Fresh Fruit and Vegetable Program
-125.0
—
—
—
—
—
—
—
—
The Emergency Food Assistance Program
+19.0
—
—
—
—
—
—
—
—
—
+5.0
+5.0
—
+6.0
+5.0
—
+1.0
+0.0
Biorefinery Assistance Program
-20.0
—
—
—
—
—
—
—
—
Biomass Crop Assistance Program
-20.0
-21.0
—
—
—
—
—
—
—
—
+15.0
—
—
—
—
—
—
—
-381.0
-1.0
+5.0
-60.0
-54.0
-55.0
—
+1.0
+0.0
—
[+0.1]a
[+60.2]a
+60.2
+60.2
+60.2
—
+0.0
+0.0
Cushion of Credit (Rural Development)
-132.0
—
—
—
—
—
—
—
—
Section 32
-231.0
—
—
—
—
—
—
—
—
—
—
+10.0
—
—
—
—
-10.0
-10.0
Environmental Quality Incentives Program
b. Other farm bill programs
Farm to School
Tree Assistance Program
Subtotal, farm bill programs
Other CHIMPS
Farm Production & Conservation Bus. Ctr.
Food for Progress
CRS-27
CHIMPS and mandatory rescissions
Total CHIMPS
FY2017
FY2018
FY2019
P.L. 11531
P.L. 115141
P.L. 116-6
-744.0
-1.0
+15.0
FY2020
Admin.
request
+0.0
Change from FY2019
House
H.R. 3055
Senate
H.R. 3055
+6.0
+5.0
Enacted
—
to Housepassed
to Senatepassed
-9.0
-10.0
Source: CRS, using appropriations text and report tables, and unpublished CBO tables. For FY2020, House-passed and Senate-passed are H.R. 3055 (Division B).
a. Amounts in brackets were not in the official CBO scoring of CHIMPS. Appropriations acts in FY2018 and FY2019 transferred mandatory conservation funding into
the Farm Production and Conservation Business Center, but the official CBO scoring of appropriations at that time did not record it as a CHIMP the way that the
Budget authority in millions of dollars
|
FY2017 |
FY2018 |
FY2019 |
FY2020 |
Change from FY2019 |
|||||||
|
CHIMPS and mandatory rescissions |
Admin. request |
House H.R. 3055 |
|
Enacted |
to House |
to Senate |
|||||
|
a. Farm bill conservation programs |
|||||||||||
|
Farm Security Rural Investment Act programs |
— |
|
|
-60.2 |
-60.2 |
-60.2 |
— |
+0.0 |
+0.0 |
||
|
Environmental Quality Incentives Program |
-179.0 |
— |
— |
— |
— |
— |
— |
— |
— |
||
|
Watershed Rehabilitation Program |
-54.0 |
— |
— |
— |
— |
— |
— |
— |
— |
||
|
Agricultural Management Assistance |
-2.0 |
— |
— |
— |
— |
— |
— |
— |
— |
||
|
b. Other farm bill programs |
|||||||||||
|
Fresh Fruit and Vegetable Program |
-125.0 |
— |
— |
— |
— |
— |
— |
— |
— |
||
|
The Emergency Food Assistance Program |
+19.0 |
— |
— |
— |
— |
— |
— |
— |
— |
||
|
Farm to School |
— |
+5.0 |
+5.0 |
— |
+6.0 |
+5.0 |
— |
+1.0 |
+0.0 |
||
|
Biorefinery Assistance Program |
-20.0 |
— |
— |
— |
— |
— |
— |
— |
— |
||
|
Biomass Crop Assistance Program |
-20.0 |
-21.0 |
— |
— |
— |
— |
— |
— |
— |
||
|
Tree Assistance Program |
— |
+15.0 |
— |
— |
— |
— |
— |
— |
— |
||
|
Subtotal, farm bill programs |
-381.0 |
-1.0 |
+5.0 |
-60.0 |
-54.0 |
-55.0 |
— |
+1.0 |
+0.0 |
||
|
Other CHIMPS |
|||||||||||
|
Farm Production & Conservation Bus. Ctr. |
— |
|
|
+60.2 |
+60.2 |
+60.2 |
— |
+0.0 |
+0.0 |
||
|
Cushion of Credit (Rural Development) |
-132.0 |
— |
— |
— |
— |
— |
— |
— |
— |
||
|
Section 32 |
-231.0 |
— |
— |
— |
— |
— |
— |
— |
— |
||
|
Food for Progress |
— |
— |
+10.0 |
— |
— |
— |
— |
-10.0 |
-10.0 |
||
|
Total CHIMPS |
-744.0 |
-1.0 |
+15.0 |
+0.0 |
+6.0 |
+5.0 |
— |
-9.0 |
-10.0 |
||
Source: CRS, using appropriations text and report tables, and unpublished CBO tables. For FY2020: House-passed H.R. 3055 (Division B), and Senate-reported S. 2522.
a. Amounts in brackets were not in the official CBO scoring of CHIMPS. Appropriations acts in FY2018 and FY2019 transferred mandatory conservation funding into the Farm Production and Conservation Business Center, but the official CBO scoring of appropriations at that time did not record it as a CHIMP the way that the FY2020 scoring reflects. For more background, see CRS Report R45406, FY2018 and FY2019 Appropriations for Agricultural Conservation.
. Table B-2. General Provisions: Rescissions from Discretionary Accounts
Budget authority in millions of dollars
Rescissions of discretionary accounts
Special Supplemental Nutrition Program for
Women, Infants, and Children
FY2017
FY2018
FY2019
P.L. 11531
P.L. 115141
P.L. 116-6
FY2020
Admin.
request
Change from FY2019
House
H.R. 3055
Senate
H.R. 3055
Enacted
to Housepassed
to Senatepassed
-850.0
-800.0
-500.0
-1,000.0
-800.0
-800.0
—
-300.0
-300.0
—
—
—
—
-5.8
—
—
-5.8
—
-4.0
—
—
—
—
—
—
—
—
Rural community facilities program
—
—
—
-4.2
—
—
—
—
—
Rural Housing Service
—
—
—
-40.0
—
—
—
—
—
Water and waste disposal cancellation
—
—
—
-100.0
—
—
—
—
—
Electric loan refinancing
—
—
—
—
—
-15.1
—
—
-15.1
FAS salaries and expenses
—
—
—
-8.8
—
—
—
—
—
USDA unobligated balances
—
—
-5.0
—
—
—
—
+5.0
+5.0
-854.0
-800.0
-505.0
-1,153.0
-805.8
-815.1
—
-300.8
-310.1
NIFA buildings and facilities (relocation)
Rural Development balances
Total
Source: CRS, using appropriations text and report tables, and unpublished CBO tables. For FY2020, House-passed and Senate-passed are H.R. 3055 (Division B).
CRS-28
Budget authority in millions of dollars
|
FY2017 |
FY2018 |
FY2019 |
FY2020 |
Change from FY2019 |
|||||||
|
Rescissions of discretionary accounts |
Admin. request |
House H.R. 3055 |
|
Enacted |
to House |
to Senate |
|||||
|
Special Supplemental Nutrition Program for Women, Infants, and Children |
-850.0 |
-800.0 |
-500.0 |
-1,000.0 |
-800.0 |
-800.0 |
— |
-300.0 |
-300.0 |
||
|
NIFA buildings and facilities (relocation) |
— |
— |
— |
— |
-5.8 |
— |
— |
-5.8 |
— |
||
|
Rural Development balances |
-4.0 |
— |
— |
— |
— |
— |
— |
— |
— |
||
|
Rural community facilities program |
— |
— |
— |
-4.2 |
— |
— |
— |
— |
— |
||
|
Rural Housing Service |
— |
— |
— |
-40.0 |
— |
— |
— |
— |
— |
||
|
Water and waste disposal cancellation |
— |
— |
— |
-100.0 |
— |
— |
— |
— |
— |
||
|
Electric loan refinancing |
— |
— |
— |
— |
— |
-15.1 |
— |
— |
-15.1 |
||
|
FAS salaries and expenses |
— |
— |
— |
-8.8 |
— |
— |
— |
— |
— |
||
|
USDA unobligated balances |
— |
— |
-5.0 |
— |
— |
— |
— |
+5.0 |
+5.0 |
||
|
Total |
-854.0 |
-800.0 |
-505.0 |
-1,153.0 |
-805.8 |
-815.1 |
— |
-300.8 |
-310.1 |
||
Table B-3. General Provisions: Other Appropriations
Table B-3. General Provisions: Other Appropriations
Budget authority in millions of dollars
Program
FY2017
FY2018
FY2019
P.L. 11531
P.L. 115141
P.L. 116-6
FY2020
Admin.
request
Change from FY2019
House
H.R. 3055
Senate
H.R. 3055
Enacted
to Housepassed
to Senatepassed
Opioid Enforcement and Surveillance
—
94.0
—
—
—
—
—
—
—
FDA buildings and facilities
—
—
—
—
—
20.0
—
—
+20.0
10.0
—
—
—
—
—
—
—
—
Agriculture Risk Coverage pilot
5.0
5.0
5.0
—
—
—
—
-5.0
-5.0
Dairy Innovation
—
—
—
—
—
20.0
—
—
+20.0
Mitigation banking
—
—
—
—
—
5.0
—
—
+5.0
Conservation Reserve Program pilot
—
1.0
1.0
—
—
1.0
—
-1.0
+0.0
Farmland Relending Program
—
—
—
—
5.0
—
—
+5.0
—
Farm Ownership Report
—
—
—
—
1.0
—
—
+1.0
—
Citrus greening
5.5
7.5
8.5
—
8.5
8.5
—
+0.0
+0.0
Pet shelter and housing assistance grant
—
—
—
—
—
3.0
—
—
+3.0
Eastern equine encephalitis
—
—
—
—
—
1.0
—
—
+1.0
APHIS buildings and facilities
47.0
—
—
—
—
—
—
—
—
Fruit fly quarantine payments
—
—
9.0
—
—
—
—
-9.0
-9.0
Hardwood trees reforestation pilot
0.6
0.6
—
—
—
—
—
—
—
Geographically disadvantaged farmers
2.0
2.0
2.0
—
2.0
2.0
—
+0.0
+0.0
Farming Opportunities Training and Outreach
—
—
—
—
10.0
—
—
+10.0
—
Water Bank
4.0
4.0
4.0
—
—
4.0
—
-4.0
+0.0
Rural Energy Savings Program
8.0
8.0
10.0
—
15.0
10.0
—
+5.0
+0.0
Maturing mortgage pilot
1.0
1.0
1.0
—
—
1.0
—
-1.0
+0.0
Rural microentrepreneur assistance program
—
—
3.0
—
—
—
—
-3.0
-3.0
Zika virus, Ebola funding
CRS-29
Program
FY2017
FY2018
FY2019
P.L. 11531
P.L. 115141
P.L. 116-6
FY2020
Admin.
request
Change from FY2019
House
H.R. 3055
Senate
H.R. 3055
Enacted
to Housepassed
to Senatepassed
Water and Waste Water
—
500.0
75.0
—
—
—
—
-75.0
-75.0
Waste water pilot
—
—
—
—
—
5.0
—
—
+5.0
Broadband pilot
—
600.0
125.0
—
518.0
—
—
+393.0
-125.0
Distance Learning Telemedicine
—
20.0
16.0
—
—
1.0
—
-16.0
-15.0
Rural Hospital Technical Assistance
—
—
—
—
1.0
—
—
+1.0
—
Protecting Animals with Shelter Grants
—
—
—
—
2.0
—
—
+2.0
—
Tribal Demonstration Projects
—
—
—
—
3.0
—
—
+3.0
—
13.8
5.0
—
—
—
—
—
—
—
Healthy Food Financing Initiative
1.0
1.0
2.0
—
10.0
2.0
—
+8.0
+0.0
Healthy Fluid Milk
—
—
—
—
1.0
1.0
—
+1.0
+1.0
RISE grants
—
—
—
—
—
5.0
—
—
+5.0
Farm and Ranch Stress Network
—
—
—
—
—
5.0
—
—
+5.0
NIFA military veterans grants
5.0
5.0
5.0
—
5.0
5.0
—
+0.0
+0.0
NIFA buildings and facilities (relocation)
—
6.0
—
—
—a
—
—
—
—
ERS-NIFA relocation expenses
—
—
—
—
—
25.0
—
—
+25.0
Genome to Phenome
—
—
—
—
1.0
—
—
+1.0
—
Science Technology Engineering Math programs
0.5
—
—
—
—
—
—
—
—
NIFA 1890 land grants, Centers of Excellence
—
—
5.0
—
10.0
3.0
—
+5.0
-2.0
Tribal Student Scholarships
—
—
—
—
2.5
5.0
—
+2.5
+5.0
International Agriculture Education
—
—
—
—
1.0
—
—
+1.0
—
Pollinator Research Coordinator
—
—
—
—
0.4
—
—
+0.4
—
Urban Agriculture Office
—
—
—
—
5.0
5.0
—
+5.0
+5.0
Food Loss Liaison
—
—
—
—
0.4
—
—
+0.4
—
Electric loan refinancing
CRS-30
Program
Food for Peace
FY2017
FY2018
FY2019
P.L. 11531
P.L. 115141
P.L. 116-6
FY2020
Admin.
request
Change from FY2019
House
H.R. 3055
Senate
H.R. 3055
Enacted
to Housepassed
to Senatepassed
134.0
116.0
216.0
—
—
—
—
-216.0
-216.0
Food for Progress
—
—
6.0
—
—
—
—
-6.0
-6.0
Child Nutrition training pilot
—
2.0
—
—
—
—
—
—
—
Nutrition Assistance Program Study
—
—
—
—
7.0
—
—
+7.0
—
Micro-Grants for Food Security
—
—
—
—
10.0
2.0
—
+10.0
+2.0
Food insecurity pilot project
—
—
—
—
—
2.0
—
—
+2.0
School breakfast expansion
—
—
—
—
10.0
—
—
+10.0
—
237.4
1,378.1
493.5
0.0
628.8
141.5
—
+135.3
-352.0
Emergency Watershed Protection
103.1
—
—
—
—
—
—
—
—
Emergency Conservation Program
131.6
—
—
—
—
—
—
—
—
234.8b
—
—
—
—
—
—
—
—
472.2
1,378.1
493.5
0.0
628.8
141.5
—
+135.3
-352.0
Subtotal, other spending provisions
Disaster/Emergency programs
Subtotal, disaster/emergency programs
Total
Source: CRS, using appropriations text and report tables, and unpublished CBO tables. For FY2020, House-passed and Senate-passed are H.R. 3055 (Division B).
Note:Budget authority in millions of dollars
|
FY2017 |
FY2018 |
FY2019 |
FY2020 |
Change from FY2019 |
|||||||
|
Program |
Admin. request |
House H.R. 3055 |
|
Enacted |
to House |
to Senate |
|||||
|
Opioid Enforcement and Surveillance |
— |
94.0 |
— |
— |
— |
— |
— |
— |
— |
||
|
FDA buildings and facilities |
— |
— |
— |
— |
— |
20.0 |
— |
— |
+20.0 |
||
|
Zika virus, Ebola funding |
10.0 |
— |
— |
— |
— |
— |
— |
— |
— |
||
|
Agriculture Risk Coverage pilot |
5.0 |
5.0 |
5.0 |
— |
— |
— |
— |
-5.0 |
-5.0 |
||
|
Dairy Innovation |
— |
— |
— |
— |
— |
20.0 |
— |
— |
+20.0 |
||
|
Mitigation banking |
— |
— |
— |
— |
— |
5.0 |
— |
— |
+5.0 |
||
|
Conservation Reserve Program pilot |
— |
1.0 |
1.0 |
— |
— |
1.0 |
— |
-1.0 |
+0.0 |
||
|
Farmland Relending Program |
— |
— |
— |
— |
5.0 |
— |
— |
+5.0 |
— |
||
|
Farm Ownership Report |
— |
— |
— |
— |
1.0 |
— |
— |
+1.0 |
— |
||
|
Citrus greening |
5.5 |
7.5 |
8.5 |
— |
8.5 |
8.5 |
— |
+0.0 |
+0.0 |
||
|
APHIS buildings and facilities |
47.0 |
— |
— |
— |
— |
— |
— |
— |
— |
||
|
Fruit fly quarantine payments |
— |
— |
9.0 |
— |
— |
— |
— |
-9.0 |
-9.0 |
||
|
Hardwood trees reforestation pilot |
0.6 |
0.6 |
— |
— |
— |
— |
— |
— |
— |
||
|
Geographically disadvantaged farmers |
2.0 |
2.0 |
2.0 |
— |
2.0 |
2.0 |
— |
+0.0 |
+0.0 |
||
|
Farming Opportunities Training and Outreach |
— |
— |
— |
— |
10.0 |
— |
— |
+10.0 |
— |
||
|
Water Bank |
4.0 |
4.0 |
4.0 |
— |
— |
4.0 |
— |
-4.0 |
+0.0 |
||
|
Rural Energy Savings Program |
8.0 |
8.0 |
10.0 |
— |
15.0 |
10.0 |
— |
+5.0 |
+0.0 |
||
|
Maturing mortgage pilot |
1.0 |
1.0 |
1.0 |
— |
— |
1.0 |
— |
-1.0 |
+0.0 |
||
|
Rural microentrepreneur assistance program |
— |
— |
3.0 |
— |
— |
— |
— |
-3.0 |
-3.0 |
||
|
Water and Waste Water |
— |
500.0 |
75.0 |
— |
— |
— |
— |
-75.0 |
-75.0 |
||
|
Waste water pilot |
— |
— |
— |
— |
— |
5.0 |
— |
— |
+5.0 |
||
|
Broadband pilot |
— |
600.0 |
125.0 |
— |
518.0 |
— |
— |
+393.0 |
-125.0 |
||
|
Distance Learning Telemedicine |
— |
20.0 |
16.0 |
— |
— |
— |
— |
-16.0 |
-16.0 |
||
|
Rural Hospital Technical Assistance |
— |
— |
— |
— |
1.0 |
— |
— |
+1.0 |
— |
||
|
Protecting Animals with Shelter Grants |
— |
— |
— |
— |
2.0 |
— |
— |
+2.0 |
— |
||
|
Tribal Demonstration Projects |
— |
— |
— |
— |
3.0 |
— |
— |
+3.0 |
— |
||
|
Electric loan refinancing |
13.8 |
5.0 |
— |
— |
— |
— |
— |
— |
— |
||
|
Healthy Food Financing Initiative |
1.0 |
1.0 |
2.0 |
— |
10.0 |
2.0 |
— |
+8.0 |
+0.0 |
||
|
Healthy Fluid Milk |
— |
— |
— |
— |
1.0 |
1.0 |
— |
+1.0 |
+1.0 |
||
|
RISE grants |
— |
— |
— |
— |
— |
5.0 |
— |
— |
+5.0 |
||
|
NIFA military veterans grants |
5.0 |
5.0 |
5.0 |
— |
5.0 |
5.0 |
— |
+0.0 |
+0.0 |
||
|
NIFA buildings and facilities (relocation) |
— |
6.0 |
— |
— |
|
— |
— |
— |
— |
||
|
ERS-NIFA relocation expenses |
— |
— |
— |
— |
— |
25.0 |
— |
— |
+25.0 |
||
|
Genome to Phenome |
— |
— |
— |
— |
1.0 |
— |
— |
+1.0 |
— |
||
|
Science Technology Engineering Math programs |
0.5 |
— |
— |
— |
— |
— |
— |
— |
— |
||
|
NIFA 1890 land grants, Centers of Excellence |
— |
— |
5.0 |
— |
10.0 |
— |
— |
+5.0 |
-5.0 |
||
|
Tribal Student Scholarships |
— |
— |
— |
— |
2.5 |
— |
— |
+2.5 |
— |
||
|
International Agriculture Education |
— |
— |
— |
— |
1.0 |
— |
— |
+1.0 |
— |
||
|
Pollinator Research Coordinator |
— |
— |
— |
— |
0.4 |
— |
— |
+0.4 |
— |
||
|
Urban Agriculture Office |
— |
— |
— |
— |
5.0 |
— |
— |
+5.0 |
— |
||
|
Food Loss Liaison |
— |
— |
— |
— |
0.4 |
— |
— |
+0.4 |
— |
||
|
Food for Peace |
134.0 |
116.0 |
216.0 |
— |
— |
— |
— |
-216.0 |
-216.0 |
||
|
Food for Progress |
— |
— |
6.0 |
— |
— |
— |
— |
-6.0 |
-6.0 |
||
|
Child Nutrition training pilot |
— |
2.0 |
— |
— |
— |
— |
— |
— |
— |
||
|
Nutrition Assistance Program Study |
— |
— |
— |
— |
7.0 |
— |
— |
+7.0 |
— |
||
|
Micro-Grants for Food Security |
— |
— |
— |
— |
10.0 |
2.0 |
— |
+10.0 |
+2.0 |
||
|
School breakfast expansion |
— |
— |
— |
— |
10.0 |
— |
— |
+10.0 |
— |
||
|
Subtotal, other spending provisions |
237.4 |
1,378.1 |
493.5 |
0.0 |
628.8 |
116.5 |
— |
+135.3 |
-377.0 |
||
|
Disaster/Emergency programs |
|||||||||||
|
Emergency Watershed Protection |
103.1 |
— |
— |
— |
— |
— |
— |
— |
— |
||
|
Emergency Conservation Program |
131.6 |
— |
— |
— |
— |
— |
— |
— |
— |
||
|
Subtotal, disaster/emergency programs |
|
— |
— |
— |
— |
— |
— |
— |
— |
||
|
Total |
472.2 |
1,378.1 |
493.5 |
0.0 |
628.8 |
116.5 |
— |
+135.3 |
-377.0 |
||
Source: CRS, using appropriations text and report tables, and unpublished CBO tables. For FY2020: House-passed H.R. 3055 (Division B), and Senate-reported S. 2522.
Note: Excludes supplemental appropriations outside the annual appropriations act.
a. See Excludes supplemental appropriations outside the annual appropriations act.
a. See Table B-2 for a rescission from the FY2018 appropriation.
b. Of this amount, $206 million was designated as a disaster spending and not counted against the discretionary spending limit (see Table B-4).
). CRS-31 Table B-4. General Provisions: Scorekeeping Adjustments
Budget authority in millions of dollars
Scorekeeping Adjustment
FY2017
FY2018
FY2019
P.L. 11531
P.L. 115141
P.L. 116-6
FY2020
Admin.
request
Change from FY2019
House
H.R. 3055
Senate
H.R. 3055
Enacted
to Housepassed
to Senatepassed
Loan program negative subsidies
Rural housing negative subsidy
-146.0
-147.0
-135.0
-125.0
-125.0
-125.0
—
+10.0
+10.0
Rural community facilities negative subsidy
-159.0
-99.0
-72.0
-72.0
-72.0
-72.0
—
+0.0
+0.0
Rural elec. & tele. loan negative subsidy
-203.0
-207.0
-173.0
-176.0
-176.0
-176.0
—
-3.0
-3.0
-2.0
-2.0
-2.0
-3.0
-3.0
-3.0
—
-1.0
-1.0
-24.0
-24.0
-23.0
-23.0
-23.0
-23.0
—
+0.0
+0.0
-534.0
-479.0
-405.0
-399.0
-399.0
-399.0
—
+6.0
+6.0
Denali Commission
4.0
—
—
-4.0
—
—
—
—
—
Interest Native American Fund Endowment
5.0
—
—
—
—
—
—
—
—
Child nutrition equipment grants
1.0
1.0
1.0
—
1.0
1.0
—
+0.0
+0.0
Emergency designations not counted in allocation
-206.1
—
—
—
—
—
—
—
—
Total
-730.1
-481.0
-404.0
-403.0
-398.0
-398.0
—
+6.0
+6.0
Rural water & waste loan negative subsidy
Ag credit loan negative subsidy
Subtotal, negative subsidies
Source: CRS, using appropriations text and report tables, and unpublished CBO tables. For FY2020, House-passed and Senate-passed are H.R. 3055 (Division B).
Notes: A negative subsidy for a loan program generally occurs when the interest rate and/or fees charged to the borrowers are more than sufficient to cover the costs
of the risk of default (Government Accountability Office, “Credit Reform: Current Method to Estimate Credit Subsidy Costs Is More Appropriate for Budget Estimates
Than a Fair Value Approach,”Budget authority in millions of dollars
|
FY2017 |
FY2018 |
FY2019 |
FY2020 |
Change from FY2019 |
|||||||
|
Scorekeeping Adjustment |
Admin. request |
House H.R. 3055 |
|
Enacted |
to House |
to Senate |
|||||
|
Loan program negative subsidies |
|||||||||||
|
Rural housing negative subsidy |
-146.0 |
-147.0 |
-135.0 |
-125.0 |
-125.0 |
-125.0 |
— |
+10.0 |
+10.0 |
||
|
Rural community facilities negative subsidy |
-159.0 |
-99.0 |
-72.0 |
-72.0 |
-72.0 |
-72.0 |
— |
+0.0 |
+0.0 |
||
|
Rural elec. & tele. loan negative subsidy |
-203.0 |
-207.0 |
-173.0 |
-176.0 |
-176.0 |
-176.0 |
— |
-3.0 |
-3.0 |
||
|
Rural water & waste loan negative subsidy |
-2.0 |
-2.0 |
-2.0 |
-3.0 |
-3.0 |
-3.0 |
— |
-1.0 |
-1.0 |
||
|
Ag credit loan negative subsidy |
-24.0 |
-24.0 |
-23.0 |
-23.0 |
-23.0 |
-23.0 |
— |
+0.0 |
+0.0 |
||
|
Subtotal, negative subsidies |
-534.0 |
-479.0 |
-405.0 |
-399.0 |
-399.0 |
-399.0 |
— |
+6.0 |
+6.0 |
||
|
Denali Commission |
4.0 |
— |
— |
-4.0 |
— |
— |
— |
— |
— |
||
|
Interest Native American Fund Endowment |
5.0 |
— |
— |
— |
— |
— |
— |
— |
— |
||
|
Child nutrition equipment grants |
1.0 |
1.0 |
1.0 |
— |
1.0 |
1.0 |
— |
+0.0 |
+0.0 |
||
|
Emergency designations not counted in allocation |
-206.1 |
— |
— |
— |
— |
— |
— |
— |
— |
||
|
Total |
-730.1 |
-481.0 |
-404.0 |
-403.0 |
-398.0 |
-398.0 |
— |
+6.0 |
+6.0 |
||
Source: CRS, using appropriations text and report tables, and unpublished CBO tables. For FY2020: House-passed H.R. 3055 (Division B) and Senate-reported S. 2522.
Notes: A negative subsidy for a loan program generally occurs when the interest rate and/or fees charged to the borrowers are more than sufficient to cover the costs of the risk of default (Government Accountability Office, "Credit Reform: Current Method to Estimate Credit Subsidy Costs Is More Appropriate for Budget Estimates Than a Fair Value Approach," GAO-16-41, January 2016).
Appendix C.
GAO-16-41, January 2016).
CRS-32
Agriculture and Related Agencies: FY2020 Appropriations
Appendix C. Budget Sequestration
Budget Sequestration
Sequestration is a process to reduce federal spending through automatic, largely across-the-board
reductions that permanently cancel mandatory and/or discretionary budget authority.40 42
Sequestration is triggered as a budget enforcement mechanism when federal spending would
exceed statutory budget goals.4143 Sequestration is currently authorized by the BCA (P.L. 112-25).
A sequestration rate is the percentage reduction that is subtracted from an appropriated budget
authority to achieve an intended budget goal. OMB computes these rates annually. Table C-1
shows the rates of sequestration that have been announced and the total amounts of budget
authority that have been cancelled from accounts in Agriculture appropriations. Table C-2
provides additional detail at the program level for mandatory accounts.
Table C-1. Summary of Sequestration on Agriculture Accounts
Discretionary Accounts
Fiscal Year
Sequestration
Rate
Sequestered
Budget
Authority
($ millions)
Mandatory Accounts
Sequestration
Rate
Sequestered
Budget
Authority
($ millions)
2013
5.0%
1,153
5.1%
713
2014
—
—
7.2%
1,052
2015
—
—
7.3%
1,153
2016
—
—
6.8%
1,819
2017
—
—
6.9%
1,686
2018
—
—
6.6%
1,316
2019
—
—
6.2%
1,530
2020
—
—
5.9%
1,378
Source: Table C-1. Summary of Sequestration on Agriculture Accounts
|
Discretionary Accounts |
Mandatory Accounts |
|||
|
Fiscal Year |
Sequestration Rate |
|
Sequestration Rate |
|
|
2013 |
5.0% |
1,153 |
5.1% |
713 |
|
2014 |
— |
— |
7.2% |
1,052 |
|
2015 |
— |
— |
7.3% |
1,153 |
|
2016 |
— |
— |
6.8% |
1,819 |
|
2017 |
— |
— |
6.9% |
1,686 |
|
2018 |
— |
— |
6.6% |
1,316 |
|
2019 |
— |
— |
6.2% |
1,530 |
|
2020 |
— |
— |
5.9% |
1,378 |
Source: CRS, compiled from OMB, Reports to the Congress on the Joint Committee Reductions, various fiscal years.
Available for FY2018-FY2020 at https://www.whitehouse.gov/omb/legislative/sequestration-reports-orders and
for FY2013-FY2017 at https://obamawhitehouse.archives.gov/omb/legislative_reports/sequestration.
Notes: sequestration.
Notes: Sequestration rates listed here are for nonexempt, nondefense accounts. CRS computed amount totals
from the compilation in Table C-2.
Discretionary Spending
Table C-2.
Discretionary Spending
For discretionary spending, sequestration is authorized through FY2021 if discretionary defense
and nondefense spending exceed caps that are specified in statute (2 U.S.C. §901(c)).
In FY2013, the timing of the appropriations acts and the first year of sequestration resulted in
triggering sequestration on discretionary spending.
In FY2014-FY2019, BBAs in 2013, 2015, and 2018 (P.L. 113-67, , P.L. 114-74, and P.L. 115-123, ,
respectively) have avoided sequestration on discretionary spending. These BBAs raised the
discretionary budget caps that were placed in statute by the BCA and allowed Congress to enact
larger appropriations than would have been allowed. The enacted appropriations in FY2014-FY201442
43
CRS Report R43411, The Budget Control Act of 2011: Legislative Changes to the Law and Their Budgetary Effects.
CRS Report R42972, Sequestration as a Budget Enforcement Process: Frequently Asked Questions.
Congressional Research Service
33
Agriculture and Related Agencies: FY2020 Appropriations
FY2019 met the spending limitations of the revised budget caps, and therefore no sequestration
on discretionary accounts was necessary.
For FY2020-FY2021, the BBA of 2019 (P.L. 116-37) similarly provides a higher discretionary
cap that may avoid sequestration (see "“Discretionary Budget Caps and Subcommittee Allocations").42
Mandatory Spending
Allocations”).44 Mandatory Spending Sequestration Occurs and Continues
For mandatory spending, sequestration is presently authorized and scheduled to continue through
FY2029, having been amended and extended by budget acts that were subsequent to the BCA (2
U.S.C. §901a(6)). That is, sequestration of mandatory spending has not been avoided by the
BBAs and continues to apply annually to certain accounts (Table C-2).
).
The original FY2021 sunset on the sequestration of mandatorymandatory accounts has been extended five
times as an offset to pay for raising the caps on discretionarydiscretionary spending to avoid sequestration in
the near term (or as a general budgetary offset for other authorization acts):
-
1. Congress extended the duration of mandatory sequestration by two years (until
43 - 45
2. Congress extended it by another year (until FY2024) to maintain retirement
-
3. Congress extended sequestration on nonexempt mandatory accounts another year
44 - 46
4. Congress extended sequestration on nonexempt mandatory accounts for two
45 - 47
5. Congress extended sequestration on nonexempt mandatory accounts by another
46
48 Exemptions from Sequestration
Some USDA mandatory programs are statutorily exempt from sequestration. Those expressly
exempt by statute are the nutrition programs (SNAP, the child nutrition programs, and the
Commodity Supplemental Food Program)4749 and the Conservation Reserve Program.4850 Some prior legal obligations in the Federal Crop Insurance Corporation49 and the farm commodity programs may be exempt50
44
CRS Insight IN11148, The Bipartisan Budget Act of 2019: Changes to the BCA and Debt Limit.
CBO, Bipartisan Budget Act of 2013, December 11, 2013, https://www.cbo.gov/publication/44964.
46
CBO, Bipartisan Budget Act of 2015, October 28, 2015, https://www.cbo.gov/publication/50938. In addition to
extending sequestration and related to mandatory spending in agriculture, crop insurance was used as an additional
budgetary offset in BBA 2015. The effect was temporary, however, and the crop insurance reduction was restored. For
more background, see the section on crop insurance and the Standard Reinsurance Agreement in CRS Report R44240,
Agriculture and Related Agencies: FY2016 Appropriations.
47 CBO, Bipartisan Budget Act of 2018, February 8, 2018, https://www.cbo.gov/publication/53556.
48 CBO, Bipartisan Budget Act of 2019, July 23, 2019, https://www.cbo.gov/publication/55478.
49 2 U.S.C. §905(h).
50 2 U.S.C. §905(g)(1)(A).
45
Congressional Research Service
34
Agriculture and Related Agencies: FY2020 Appropriations
legal obligations in the Federal Crop Insurance Corporation51 and the farm commodity programs
may be exempt52 as determined by OMB.53
as determined by OMB.51
Generally speaking, the experience since FY2013 is that OMB has ruled that most of crop
insurance is exempt from sequestration, while the farm commodity programs, disaster assistance,
and most conservation programs have been subject to it.52
54 Implementation of Sequestration
Nonexempt mandatory spending in FY2020 is to be reduced by a 5.9% sequestration rate (Table Table
C-1) and thus would be paid at 94.1% of what would otherwise have been provided. This is
projected to result in a reduction of about $1.4 billion from mandatory agriculture accounts in
FY2020, including over $900 million from amounts paid by the CCC (Table C-2).
).
For example, for the farm commodity programs that support farm income such as the Agricultural
Risk Coverage and Price Loss Coverage programs,5355 payments to farmers are computed by a
regular formula authorized in the farm bill, and the final actual payment to the farmer is reduced
by the sequestration rate. For programs that operate on a fixed budget authority, such as the
Environmental Quality Incentives Program and the Market Assistance Program, the sequestration
rate is applied to the available budget authority for the fiscal year.
51
2 U.S.C. §905(g)(2).
2 U.S.C. §906(j).
53 Some administrative expenses may be subject to sequestration, and therefore programs that are otherwise exempt
may have a relatively small sequesterable amount compared to their total budget authority, as shown, for example, in
Table C-2 for the Federal Crop Insurance Corporation, SNAP, child nutrition programs, and WIC.
54 CRS Report R42050, Budget “Sequestration” and Selected Program Exemptions and Special Rules.
55 CRS In Focus IF11161, 2018 Farm Bill Primer: ARC and PLC Support Programs.
52
Congressional Research Service
35
Table C-2. Sequestration of Mandatory Accounts
Table C-2. Sequestration of Mandatory Accounts
Sequestered budget authority in millions of dollars
|
FY2013 |
FY2014 |
FY2015 |
FY2016 |
FY2017 |
FY2018 |
FY2019 |
FY2020 |
|
Sequestered budget authority in millions of dollars
FY2013
Sequestration rate on nonexempt, |
5.1% |
7.2% |
7.3% |
6.8% |
6.9% |
6.6% |
6.2% |
5.9% |
|
U.S. Department of Agriculture |
||||||||
|
Office of the Secretary |
— |
— |
0.9 |
0.9 |
0.9 |
0.9 |
0.8 |
0.9 |
|
Office of Chief Economist |
— |
— |
0.1 |
0.1 |
0.1 |
0.1 |
0.1 |
0.1 |
|
Agricultural Research Service |
0.1 |
0.1 |
0.1 |
0.1 |
0.1 |
0.1 |
0.1 |
0.1 |
|
National Institute of Food and Agriculture |
— |
— |
— |
9.9 |
10.0 |
— |
— |
11.7 |
|
Extension |
0.3 |
0.4 |
1.8 |
— |
— |
3.3 |
0.3 |
— |
|
Biomass Research and Development |
— |
— |
0.2 |
0.2 |
0.2 |
— |
— |
— |
|
Integrated Activities |
— |
— |
7.3 |
— |
— |
6.6 |
5.0 |
— |
|
Animal and Plant Health Inspection Service |
||||||||
|
Salaries appropriation |
13.6 |
18.8 |
21.5 |
20.1 |
19.5 |
18.8 |
52.1 |
51.3 |
|
Miscellaneous Trust Funds |
0.1 |
0.1 |
0.1 |
0.1 |
0.1 |
0.1 |
0.1 |
0.1 |
|
Food Safety Inspection Service |
0.1 |
0.1 |
0.1 |
0.1 |
0.1 |
0.1 |
0.1 |
0.1 |
|
Grain Inspection Packers and Stockyards Administration |
2.1 |
3.0 |
3.0 |
3.1 |
3.1 |
2.9 |
— |
— |
|
Agricultural Marketing Service |
||||||||
|
Section 32 |
40.4 |
79.7 |
81.9 |
77.3 |
79.6 |
78.1 |
74.4 |
72.2 |
|
Payments to states and possessions |
— |
— |
5.3 |
5.0 |
5.0 |
5.6 |
5.3 |
5.0 |
|
Milk Market Orders Assessment Fund |
2.9 |
4.2 |
4.2 |
4.0 |
4.1 |
4.0 |
3.8 |
4.8 |
|
— |
— |
— |
— |
— |
— |
— |
2.9 |
|
Marketing services |
— |
— |
2.2 |
2.0 |
2.1 |
2.0 |
3.0 |
2.1 |
|
Perishable Agriculture Commodities Act |
0.6 |
0.8 |
0.8 |
0.8 |
0.8 |
0.7 |
0.7 |
0.6 |
|
Expenses and refunds |
0.4 |
0.9 |
0.9 |
1.3 |
1.3 |
0.4 |
0.4 |
0.6 |
|
Risk Management Agency |
— |
— |
— |
— |
0.6 |
— |
— |
— |
|
Federal Crop Insurance Corporation |
3.0 |
4.2 |
5.9 |
3.5 |
3.9 |
3.7 |
5.0 |
3.2 |
|
Farm Service Agency |
||||||||
|
Commodity Credit Corporation Fund |
329.5 |
573.7 |
710.8 |
1,388.6 |
1,238.6 |
904.1 |
1,088.2 |
938.6 |
|
Wool Apparel Manufacturers Trust Fund |
— |
— |
— |
2.0 |
2.1 |
2.0 |
1.9 |
1.8 |
|
Pima Cotton Trust Fund |
— |
— |
— |
1.1 |
1.1 |
1.1 |
— |
0.9 |
|
Commodity Credit Corporation Export Loans |
— |
— |
— |
0.4 |
0.4 |
0.3 |
0.3 |
0.2 |
|
Agricultural Credit Insurance Corporation |
— |
— |
0.1 |
0.1 |
0.1 |
0.1 |
0.1 |
0.1 |
|
Agricultural Disaster Relief Fund |
70.0 |
— |
— |
— |
— |
— |
— |
— |
|
Tobacco Trust Fund |
49.0 |
69.1 |
— |
— |
— |
— |
— |
— |
|
Farm Production and Conservation Business Center |
— |
— |
— |
— |
— |
— |
3.7 |
— |
|
Natural Resources Conservation Service |
||||||||
|
Farm bill conservation programs |
171.2 |
263.1 |
269.9 |
265.7 |
281.5 |
254.9 |
262.4 |
252.2 |
|
Watershed Rehabilitation Program |
— |
11.9 |
11.2 |
4.7 |
4.7 |
4.4 |
3.0 |
3.0 |
|
Damage Assessment Restoration Revolving Fund |
— |
— |
— |
— |
— |
— |
0.1 |
0.1 |
|
Rural Development, Rural Business Cooperative Service |
||||||||
|
Rural Energy for America Program |
1.1 |
3.0 |
3.7 |
3.4 |
3.5 |
3.3 |
3.1 |
3.0 |
|
Biorefinery Assistance Program |
— |
— |
3.7 |
3.4 |
1.4 |
1.3 |
— |
1.5 |
|
Rural Cooperative Development Grants |
— |
— |
— |
— |
— |
— |
— |
1.1 |
|
Rural Economic Development Grants |
— |
— |
— |
1.6 |
— |
— |
0.9 |
0.9 |
|
Rural Microenterprise Investment Program |
— |
0.2 |
0.2 |
0.2 |
0.2 |
0.2 |
— |
— |
|
Energy Assistance Payments |
3.3 |
3.2 |
1.1 |
1.0 |
1.0 |
1.0 |
— |
0.4 |
|
Foreign Agricultural Service |
0.1 |
0.1 |
0.1 |
0.1 |
0.1 |
0.1 |
0.1 |
0.1 |
| ||||||||
|
SNAP |
4.7 |
8.0 |
8.4 |
9.8 |
10.6 |
9.6 |
9.2 |
9.4 |
|
Child Nutrition Programs |
2.5 |
4.2 |
4.2 |
3.9 |
4.3 |
4.0 |
3.9 |
3.2 |
|
Commodity Assistance Program |
1.1 |
1.5 |
1.5 |
1.4 |
1.4 |
1.4 |
1.3 |
1.2 |
|
WIC |
0.1 |
0.1 |
0.1 |
0.1 |
0.1 |
0.1 |
0.1 |
0.1 |
|
Related Agencies |
||||||||
|
Commodity Futures Trading Commission |
0.7 |
0.9 |
1.0 |
2.2 |
2.2 |
0.1 |
0.3 |
3.5 |
|
Food and Drug Administration |
||||||||
|
Revolving Fund for Certification |
0.4 |
0.6 |
0.6 |
0.6 |
0.6 |
0.6 |
0.6 |
0.6 |
|
User fees |
16.3 |
— |
— |
— |
— |
— |
— |
— |
|
Farm Credit System Insurance Corporation |
0.2 |
0.3 |
0.3 |
0.3 |
0.3 |
0.3 |
0.2 |
0.2 |
|
Total |
713.3 |
1,051.9 |
1,153.0 |
1,818.9 |
1,685.6 |
1,315.9 |
1,530.3 |
1,377.8 |
Source: CRS, compiled from amounts published in advance in OMB, Reports to the Congress on the Joint Committee Reductions, various fiscal years. Available for FY2018-FY2019FY2018FY2019 at https://www.whitehouse.gov, and for FY2013-FY2017 at https://obamawhitehouse.archives.gov.
.
Notes: Column totals were computed by CRS based on the jurisdiction of the House Agriculture Appropriations Subcommittee. Sequestration rates are for nonexempt,
nondefense accounts. The sequesterable budget authority for each cell may be computed by dividing the amount of sequestration by the sequestration rate.
a. USDA reorganization moved the Grain Inspection, Packers, and Stockyards Administration into the Agricultural Marketing Service.
b. Benefits from the nutrition programs are generally exempt from sequestration by statute, but some administrative expenses in these programs may be subject to
sequestration, and therefore a relatively small portion of the total budget authority may be sequesterable.
Appendix D.
CRS-38
Agriculture and Related Agencies: FY2020 Appropriations
Appendix D. Action on Agriculture Appropriations,
FY1996-FY2020
Table D-1. Congressional Action on Agriculture Appropriations Since FY1996
House Action
Senate Action
Final Appropriation
Fiscal
Year
Subcmte.
Cmte.
Floor
Subcmte.
Cmte.
Floor
1996
6/14/1995
6/27/1995
7/21/1995
9/13/1995
9/14/1995
9/20/1995
10/21/1995
E
P.L. 104-37
95-624
1997
5/30/1996
6/6/1996
6/12/1996
7/10/1996
7/11/1996
7/24/1996
8/6/1996
E
P.L. 104-180
IB96015
1998
6/25/1997
7/14/1997
7/24/1997
7/15/1997
7/17/1997
7/24/1997
11/18/1997
E
P.L. 105-86
97-201
1999
6/10/1998
6/16/1998
6/24/1998
6/9/1998
6/11/1998
7/16/1998
10/21/1998
O
P.L. 105-277
98-201
2000
5/13/1999
5/24/1999
6/8/1999
6/15/1999
6/17/1999
8/4/1999
10/22/1999
E
P.L. 106-78
RL30201
2001
5/4/2000
5/16/2000
7/11/2000
5/4/2000
5/10/2000
7/20/2000
10/28/2000
E
P.L. 106-387
RL30501
2002
6/6/2001
6/27/2001
7/11/2001
Polled out
7/18/2001
10/25/2001
11/28/2001
E
P.L. 107-76
RL31001
2003
6/26/2002
7/26/2002
—
7/23/2002
7/25/2002
—
2/20/2003
O
P.L. 108-7
RL31301
2004
6/17/2003
7/9/2003
7/14/2003
7/17/2003
11/6/2003
11/6/2003
1/23/2004
O
P.L. 108-199
RL31801
2005
6/14/2004
7/7/2004
7/13/2004
9/8/2004
9/14/2004
—
12/8/2004
O
P.L. 108-447
RL32301
2006
5/16/2005
6/2/2005
6/8/2005
6/21/2005
6/27/2005
9/22/2005
11/10/2005
E
P.L. 109-97
RL32904
2007
5/3/2006
5/9/2006
5/23/2006
6/20/2006
6/22/2006
—
2/15/2007
Y
P.L. 110-5
RL33412
2008
7/12/2007
7/19/2007
8/2/2007
7/17/2007
7/19/2007
—
12/26/2007
O
P.L. 110-161
RL34132
2009
6/19/2008
—
—
Polled out
7/17/2008
—
3/11/2009
O
P.L. 111-8
R40000
2010
6/11/2009
6/18/2009
7/9/2009
Polled out
7/7/2009
8/4/2009
10/21/2009
E
P.L. 111-80
R40721
2011
6/30/2010
—
—
Polled out
7/15/2010
—
4/15/2011
Y
P.L. 112-10
R41475
2012
5/24/2011
5/31/2011
6/16/2011
Polled out
9/7/2011
11/1/2011
11/18/2011
O
P.L. 112-55
R41964
2013
6/6/2012
6/19/2012
—
Polled out
4/26/2012
—
3/26/2013
O
P.L. 113-6
R43110
2014
6/5/2013
6/13/2013
—
6/18/2013
6/20/2013
—
1/17/2014
O
P.L. 113-76
R43110
2015
5/20/2014
5/29/2014
—
5/20/2014
5/22/2014
—
12/16/2014
O
P.L. 113-235
R43669
2016
6/18/2015
7/8/2015
—
7/14/2015
7/16/2015
—
12/18/2015
O
P.L. 114-113
R44240
2017
4/13/2016
4/19/2016
—
5/17/2016
5/19/2016
—
5/5/2017
O
P.L. 115-31
R44588
2018
6/28/2017
7/12/2017
9/14/2017
7/18/2017
7/20/2017
—
3/23/2018
O
P.L. 115-141
R45128
2019
5/9/2018
5/16/2018
—
5/22/2018
5/24/2018
8/1/2018
2/15/2019
O
P.L. 116-6
R45230
2020
5/23/2019
6/4/2019
6/25/2019
9/17/2019
9/19/2019
10/31/2019
—
—
Enacted
Public Law
—
R45974
Source: CRS.
Notes: E = Enacted as standalone appropriation (eight times over 24 years); O = Omnibus appropriation (14
times); Y = Year-long CR (two times). “Polled out” refers to a procedure that permits a Senate subcommittee to
Table D-1. Congressional Action on Agriculture Appropriations Since FY1996
|
House Action |
Senate Action |
Final Appropriation |
|||||||||
|
Fiscal Year |
Subcmte. |
Cmte. |
Floor |
Subcmte. |
Cmte. |
Floor |
Enacted |
Public Law |
CRS Report |
||
|
1996 |
6/14/1995 |
6/27/1995 |
7/21/1995 |
9/13/1995 |
9/14/1995 |
9/20/1995 |
10/21/1995 |
E |
95-624 |
||
|
1997 |
5/30/1996 |
6/6/1996 |
6/12/1996 |
7/10/1996 |
7/11/1996 |
7/24/1996 |
8/6/1996 |
E |
IB96015 |
||
|
1998 |
6/25/1997 |
7/14/1997 |
7/24/1997 |
7/15/1997 |
7/17/1997 |
7/24/1997 |
11/18/1997 |
E |
|||
|
1999 |
6/10/1998 |
6/16/1998 |
6/24/1998 |
6/9/1998 |
6/11/1998 |
7/16/1998 |
10/21/1998 |
O |
|||
|
2000 |
5/13/1999 |
5/24/1999 |
6/8/1999 |
6/15/1999 |
6/17/1999 |
8/4/1999 |
10/22/1999 |
E |
|||
|
2001 |
5/4/2000 |
5/16/2000 |
7/11/2000 |
5/4/2000 |
5/10/2000 |
7/20/2000 |
10/28/2000 |
E |
|||
|
2002 |
6/6/2001 |
6/27/2001 |
7/11/2001 |
Polled out |
7/18/2001 |
10/25/2001 |
11/28/2001 |
E |
|||
|
2003 |
6/26/2002 |
7/26/2002 |
— |
7/23/2002 |
7/25/2002 |
— |
2/20/2003 |
O |
|||
|
2004 |
6/17/2003 |
7/9/2003 |
7/14/2003 |
7/17/2003 |
11/6/2003 |
11/6/2003 |
1/23/2004 |
O |
|||
|
2005 |
6/14/2004 |
7/7/2004 |
7/13/2004 |
9/8/2004 |
9/14/2004 |
— |
12/8/2004 |
O |
|||
|
2006 |
5/16/2005 |
6/2/2005 |
6/8/2005 |
6/21/2005 |
6/27/2005 |
9/22/2005 |
11/10/2005 |
E |
|||
|
2007 |
5/3/2006 |
5/9/2006 |
5/23/2006 |
6/20/2006 |
6/22/2006 |
— |
2/15/2007 |
Y |
|||
|
2008 |
7/12/2007 |
7/19/2007 |
8/2/2007 |
7/17/2007 |
7/19/2007 |
— |
12/26/2007 |
O |
|||
|
2009 |
6/19/2008 |
— |
— |
Polled out |
7/17/2008 |
— |
3/11/2009 |
O |
|||
|
2010 |
6/11/2009 |
6/18/2009 |
7/9/2009 |
Polled out |
7/7/2009 |
8/4/2009 |
10/21/2009 |
E |
|||
|
2011 |
6/30/2010 |
— |
— |
Polled out |
7/15/2010 |
— |
4/15/2011 |
Y |
|||
|
2012 |
5/24/2011 |
5/31/2011 |
6/16/2011 |
Polled out |
9/7/2011 |
11/1/2011 |
11/18/2011 |
O |
|||
|
2013 |
6/6/2012 |
6/19/2012 |
— |
Polled out |
4/26/2012 |
— |
3/26/2013 |
O |
|||
|
2014 |
6/5/2013 |
6/13/2013 |
— |
6/18/2013 |
6/20/2013 |
— |
1/17/2014 |
O |
|||
|
2015 |
5/20/2014 |
5/29/2014 |
— |
5/20/2014 |
5/22/2014 |
— |
12/16/2014 |
O |
|||
|
2016 |
6/18/2015 |
7/8/2015 |
— |
7/14/2015 |
7/16/2015 |
— |
12/18/2015 |
O |
|||
|
2017 |
4/13/2016 |
4/19/2016 |
— |
5/17/2016 |
5/19/2016 |
— |
5/5/2017 |
O |
R44588 |
||
|
2018 |
6/28/2017 |
7/12/2017 |
9/14/2017 |
7/18/2017 |
7/20/2017 |
— |
3/23/2018 |
O |
|||
|
2019 |
5/9/2018 |
5/16/2018 |
— |
5/22/2018 |
5/24/2018 |
8/1/2018 |
2/15/2019 |
O |
|||
|
2020 |
5/23/2019 |
6/4/2019 |
6/25/2019 |
9/17/2019 |
9/19/2019 |
— |
— |
— |
— |
— |
|
Source: CRS.
Notes: E = Enacted as standalone appropriation (eight times over 24 years); O = Omnibus appropriation (14 times); Y = Year-long CR (two times). "Polled out" refers to a procedure that permits a Senate subcommittee to transmit a bill to its full committee without a formal markup session. See CRS Report RS22952, Proxy Voting and
Polling in Senate Committee.
Author Contact Information
Key Policy Staff
|
Area of Expertise |
Name |
|
Agricultural appropriations, USDA budget |
Jim Monke |
|
Agricultural Marketing Service |
Joel Greene |
|
Animal and Plant Health Inspection Service |
Tadlock Cowan |
|
Commodity Futures Trading Commission |
Rena Miller |
|
Conservation |
Megan Stubbs |
|
Crop insurance |
Randy Schnepf |
|
Disaster assistance |
Megan Stubbs |
|
Farm Service Agency |
Jim Monke |
|
Food and Drug Administration |
Agata Dabrowska |
|
Food safety, generally |
Renée Johnson |
|
Food safety, meat and poultry inspection |
Joel Greene |
|
International food assistance |
Alyssa Casey |
|
Nutrition and domestic food assistance |
Nutrition and domestic food assistance Randy Alison Aussenberg
Kara Clifford Billings
Research and extension
Genevieve Croft
Rural development
Alyssa Casey
Trade
Anita Regmi
Disclaimer
This document was prepared by the Congressional Research Service (CRS). CRS serves as nonpartisan
shared staff to congressional committees and Members of Congress. It operates solely at the behest of and
under the direction of Congress. Information in a CRS Report should not be relied upon for purposes other
than public understanding of information that has been provided by CRS to Members of Congress in
connection with CRS’s institutional role. CRS Reports, as a work of the United States Government, are not
subject to copyright protection in the United States. Any CRS Report may be reproduced and distributed in
its entirety without permission from CRS. However, as a CRS Report may include copyrighted images or
material from a third party, you may need to obtain the permission of the copyright holder if you wish to
copy or otherwise use copyrighted material.
Congressional Research Service
R45974 · VERSION 3 · UPDATED
40
|
|
Research and extension |
Genevieve Croft |
|
Rural development |
Alyssa Casey |
|
Trade |
Anita Regmi |
Footnotes
| 1. |
Jurisdiction for CFTC appropriations differs between the chambers. Since FY2008, CFTC is marked up in the Agriculture Subcommittee of the House Appropriations Committee and in the Financial Services and General Government Subcommittee of the Senate Appropriations Committee. The enacted CFTC appropriation is carried in the Agriculture bill in even-numbered fiscal years and in the Financial Services bill in odd-numbered fiscal years. |
| 2. |
Although the Forest Service is part of USDA, jurisdiction for its appropriations are in the Interior and Related Agencies Appropriations Act. |
| 3. |
See CRS In Focus IF11032, Budgetary Decisionmaking in Congress; and CRS Report R44582, Overview of Funding Mechanisms in the Federal Budget Process, and Selected Examples. |
| 4. |
See CRS Report R42388, The Congressional Appropriations Process: An Introduction. |
| 5. |
Mandatory spending creates funding stability and consistency compared to annual discretionary appropriations. In agriculture, it originated with farm commodity programs that had uncertain outlays due to weather and markets. |
| 6. |
See CRS Report 98-560, Baselines and Scorekeeping in the Federal Budget Process. |
| 7. |
P.L. 115-334 (Agricultural Act of 2018). See CRS Report R45425, Budget Issues That Shaped the 2018 Farm Bill. |
| 8. |
P.L. 111-296 (Healthy, Hunger-Free Kids Act of 2010). See CRS In Focus IF10266, An Introduction to Child Nutrition Reauthorization. |
| 9. |
See CRS Report RS20129, Entitlements and Appropriated Entitlements in the Federal Budget Process. |
| 10. |
See CRS Report R44606, The Commodity Credit Corporation: In Brief. |
| 11. |
Office of Management and Budget (OMB), A Budget for a Better America: President's Budget FY 2020. |
| 12. |
OMB, FY2020 Budget of the U.S. Government, Appendix. |
| 13. |
USDA, FY2020 USDA Budget Summary; and USDA, FY2020 Budget Explanatory Notes. |
| 14. |
FDA, FY2020 Justification of Estimates for Appropriations. |
| 15. |
CFTC, FY2020 President's Budget Request. |
| 16. |
Farm Credit Administration, FY2020 Proposed Budget and Performance Plan. |
| 17. |
OMB, FY2020 Budget of the U.S. Government, Major Savings and Reforms. |
| 18. |
CRS Report R42388, The Congressional Appropriations Process: An Introduction. |
| 19. |
References to 302(a) and 302(b) are to sections of the Congressional Budget Act of 1974. |
| 20. |
CRS Report R44874, The Budget Control Act: Frequently Asked Questions. |
| 21. |
CRS Report R42972, Sequestration as a Budget Enforcement Process: Frequently Asked Questions. |
| 22. |
CRS Insight IN11090, Increasing the BCA Spending Limits: Characteristics of Previously Enacted Legislation. |
| 23. |
CRS Insight IN11148, The Bipartisan Budget Act of 2019: Changes to the BCA and Debt Limit. |
| 24. |
See the House Agriculture Appropriations Subcommittee website for the bill draft and report draft. |
| 25. |
House Appropriations Committee, "FY2020 Full Committee Adopted Amendments," June 4, 2019. |
| 26. |
CRS Report R42933, Regular Appropriations Bills: Terms of Initial Consideration and Amendment in the House, FY1996-FY2015. |
| 27. |
|
| 28. |
See CRS Report R45310, Farm Policy: USDA's 2018 Trade Aid Package. Most of the trade aid announced in 2019 (see CRS Report R45865, Farm Policy: USDA's 2019 Trade Aid Package) is likely to be paid out (outlays) in FY2020 and reimbursed in the FY2021 appropriation after those payments are incorporated into CCC's net realized losses. |
| 29. |
See CRS Report R45425, Budget Issues That Shaped the 2018 Farm Bill. |
| 30. |
Senate Appropriations Committee, "FY2020 Agriculture Manager's Package," September 19, 2019. |
| 31. |
CRS Report R42647, Continuing Resolutions: Overview of Components and Practices. |
| 32. |
CRS Report RL34700, Interim Continuing Resolutions (CRs): Potential Impacts on Agency Operations. |
| 33. |
For example, if a CR lasts for three months, then three-twelfths of the previous fiscal year amount may be apportioned to limit agency spending. See OMB, "Apportionment of the Continuing Resolution(s) for Fiscal Year 2019," September 28, 2018, https://www.whitehouse.gov/wp-content/uploads/2017/11/bulletin_no_18_05.pdf. |
| 34. |
For more information, see CRS In Focus IF11245, FY2019 Supplemental Appropriations for Agriculture. |
| 35. |
For more information, see CRS Report R45486, Child Nutrition Programs: Current Issues. |
| 36. |
For more information, see CRS Insight IN11168, The CCC Anomaly in an FY2020 Continuing Resolution. |
| 37. |
For more information, see CRS Report R45865, Farm Policy: USDA's 2019 Trade Aid Package. |
| 38. |
For more information, see CRS In Focus IF11088, 2018 Farm Bill Primer: Hemp Cultivation and Processing. |
| 39. |
H.Rept. 116-9, Conference Report for the FY2019 Consolidated Appropriations Act, Explanatory Statement for Division B. |
| 40. |
CRS Report R43411, The Budget Control Act of 2011: Legislative Changes to the Law and Their Budgetary Effects. |
| 41. |
CRS Report R42972, Sequestration as a Budget Enforcement Process: Frequently Asked Questions. |
| 42. |
CRS Insight IN11148, The Bipartisan Budget Act of 2019: Changes to the BCA and Debt Limit. |
| 43. |
CBO, Bipartisan Budget Act of 2013, December 11, 2013, https://www.cbo.gov/publication/44964. |
| 44. |
CBO, Bipartisan Budget Act of 2015, October 28, 2015, https://www.cbo.gov/publication/50938. In addition to extending sequestration and related to mandatory spending in agriculture, crop insurance was used as an additional budgetary offset in BBA 2015. The effect was temporary, however, and the crop insurance reduction was restored. For more background, see the section on crop insurance and the Standard Reinsurance Agreement in CRS Report R44240, Agriculture and Related Agencies: FY2016 Appropriations. |
| 45. |
CBO, Bipartisan Budget Act of 2018, February 8, 2018, https://www.cbo.gov/publication/53556. |
| 46. |
CBO, Bipartisan Budget Act of 2019, July 23, 2019, https://www.cbo.gov/publication/55478. |
| 47. |
2 U.S.C. §905(h). |
| 48. |
2 U.S.C. §905(g)(1)(A). |
| 49. |
2 U.S.C. §905(g)(2). |
| 50. |
2 U.S.C. §906(j). |
| 51. |
|
| 52. |
CRS Report R42050, Budget "Sequestration" and Selected Program Exemptions and Special Rules. |
| 53. |
CRS In Focus IF11161, 2018 Farm Bill Primer: ARC and PLC Support Programs. |