U.S. Farm Support: Compliance with WTO Commitments
As a member of the World Trade Organization (WTO) agreements, the United States has committed to abide by WTO rules and disciplines, including those that govern domestic farm policy as spelled out in the Agreement on Agriculture (AoA). Since establishment of the WTO on January 1, 1995, the United States has complied with its WTO spending limits on market-distorting types of farm program outlays (referred to as amber box spending). However, the addition of large, new trade assistance payments to producers in 2018 and 2019, on top of existing farm program support, has raised concerns by some U.S. trading partners, as well as market watchers and policymakers, that U.S. domestic farm subsidy outlays might exceed the annual spending limit of $19.1 billion agreed to as part of U.S. commitments to WTO member countries. CRS analysis indicates that the United States probably did not violate its WTO spending limit in 2018 but could potentially exceed it in 2019.
A farm support program can violate WTO commitments in two principal ways: first, by exceeding spending limits on certain market-distorting programs, and second, by generating distortions that spill over into the international marketplace and cause significant adverse effects. Program outlays are cumulative, and compliance with WTO commitments is based on annual aggregate spending levels. Under the WTO’s AoA, total U.S. amber box outlays (that is, those outlays deemed market distorting) are limited to $19.1 billion annually, subject to de minimis exemptions. De minimis exemptions are spending that is sufficiently small (less than 5% of the value of production)—relative to either the value of a specific product or total production—to be deemed benign. Since 1995, the United States has apparently stayed within its amber box limits. However, U.S. compliance has hinged on judicious use of the de minimis exemptions in a number of years to exclude certain amber box spending from counting against the amber box limit. These exemptions have never been challenged by another WTO member.
According to CRS analysis, projected U.S. amber box spending for 2018 (inclusive of $8.7 billion in product-specific outlays under the 2018 trade assistance package) could exceed $14 billion. This would be the largest U.S. amber box notification since 2001. However, despite its magnitude, it still would fit within the U.S. spending limit of $19.1 billion. A more ambiguous result is projected for 2019. The expansion of direct payments under a second trade assistance package to $14.5 billion in 2019 and their shift to a non-product-specific WTO classification—when combined with currently projected spending under other non-product-specific programs such as the Price Loss Coverage (PLC) and Agricultural Risk Coverage (ARC) programs—could push U.S. amber box outlays above $24 billion. This would be in excess of the U.S. amber box spending limit of $19.1 billion. However, this projection hinges on several as-yet-unknown factors, including market prices, output values, and program outlays under traditional countercyclical ARC and PLC programs. If the final price and revenue values are higher than currently projected, then program payments under ARC and PLC could be smaller than those used in this analysis. This could decrease both aggregate non-product-specific outlays and the possibility of exceeding the amber box spending limit.
If cumulative payments in any year were to exceed the agreed-upon spending limit, then the United States would be in violation of its commitments and could be vulnerable to a challenge under the WTO’s dispute settlement mechanism. Furthermore, to the extent that such program outlays might induce surplus production and depress market prices, they could also result in potential challenges under the WTO.
U.S. Farm Support: Compliance with WTO Commitments
Jump to Main Text of Report
Contents
- Introduction
- What Is the Issue?
- Report Objectives
- WTO Disciplines on Farm Program Spending
- AoA Defines Spending Disciplines
- Some Program Spending May Be Exempt from Disciplines
- U.S. Farm Support Programs
- Farm Program Changes Under the 2018 Farm Bill
- Coupled, Product-Specific Support Levels Raised for Selected Commodities
- Decoupled, Non-Product-Specific Support Potentially Expanded Under ARC and PLC
- Several Product-Specific Payment Programs Exempted from Payment Limits
- Potential Pool of Payment Beneficiaries Expanded
- Minor Increase to Sugar MAL Rate
- Federal Crop Insurance Direct Support Expanded
- Large Payments Expected Under Ad Hoc Trade Aid Programs
- 2018 MFP Payments Are Likely to Be Notified as Product-Specific AMS
- 2019 MFP Payments Are Likely to Be Notified as Non-Product-Specific AMS
- Will U.S. Farm Spending Comply with WTO Limits in 2018 and 2019?
- Sources for Farm Program Outlay Data for 2018 and 2019
- Compliance Hinges on the Non-Product-Specific De Minimis Threshold
- Scenario 1: Non-Product-Specific Outlays Not Exempted Under De Minimis
- Scenario 2: Non-Product-Specific Outlays Exempted Under De Minimis
- Other Potentially Influential Factors
- Conclusion
Figures
Tables
Summary
As a member of the World Trade Organization (WTO) agreements, the United States has committed to abide by WTO rules and disciplines, including those that govern domestic farm policy as spelled out in the Agreement on Agriculture (AoA). Since establishment of the WTO on January 1, 1995, the United States has complied with its WTO spending limits on market-distorting types of farm program outlays (referred to as amber box spending). However, the addition of large, new trade assistance payments to producers in 2018 and 2019, on top of existing farm program support, has raised concerns by some U.S. trading partners, as well as market watchers and policymakers, that U.S. domestic farm subsidy outlays might exceed the annual spending limit of $19.1 billion agreed to as part of U.S. commitments to WTO member countries. CRS analysis indicates that the United States probably did not violate its WTO spending limit in 2018 but could potentially exceed it in 2019.
A farm support program can violate WTO commitments in two principal ways: first, by exceeding spending limits on certain market-distorting programs, and second, by generating distortions that spill over into the international marketplace and cause significant adverse effects. Program outlays are cumulative, and compliance with WTO commitments is based on annual aggregate spending levels. Under the WTO's AoA, total U.S. amber box outlays (that is, those outlays deemed market distorting) are limited to $19.1 billion annually, subject to de minimis exemptions. De minimis exemptions are spending that is sufficiently small (less than 5% of the value of production)—relative to either the value of a specific product or total production—to be deemed benign. Since 1995, the United States has apparently stayed within its amber box limits. However, U.S. compliance has hinged on judicious use of the de minimis exemptions in a number of years to exclude certain amber box spending from counting against the amber box limit. These exemptions have never been challenged by another WTO member.
According to CRS analysis, projected U.S. amber box spending for 2018 (inclusive of $8.7 billion in product-specific outlays under the 2018 trade assistance package) could exceed $14 billion. This would be the largest U.S. amber box notification since 2001. However, despite its magnitude, it still would fit within the U.S. spending limit of $19.1 billion. A more ambiguous result is projected for 2019. The expansion of direct payments under a second trade assistance package to $14.5 billion in 2019 and their shift to a non-product-specific WTO classification—when combined with currently projected spending under other non-product-specific programs such as the Price Loss Coverage (PLC) and Agricultural Risk Coverage (ARC) programs—could push U.S. amber box outlays above $24 billion. This would be in excess of the U.S. amber box spending limit of $19.1 billion. However, this projection hinges on several as-yet-unknown factors, including market prices, output values, and program outlays under traditional countercyclical ARC and PLC programs. If the final price and revenue values are higher than currently projected, then program payments under ARC and PLC could be smaller than those used in this analysis. This could decrease both aggregate non-product-specific outlays and the possibility of exceeding the amber box spending limit.
If cumulative payments in any year were to exceed the agreed-upon spending limit, then the United States would be in violation of its commitments and could be vulnerable to a challenge under the WTO's dispute settlement mechanism. Furthermore, to the extent that such program outlays might induce surplus production and depress market prices, they could also result in potential challenges under the WTO.
Introduction
The long-term objective of the World Trade Organization's (WTO's) Agreement on Agriculture (AoA) is to establish a fair and market-oriented agricultural trading system.1 The principal approach for achieving this goal is, first, to achieve specific binding commitments by all WTO members in each of the three pillars of agricultural trade policy reform—market access, domestic support, and export subsidies—and second, to provide for substantial progressive reductions in domestic agricultural support and border protection from foreign products.
As a signatory member of the WTO agreements, the United States has committed to abide by WTO rules and disciplines, including those that govern domestic farm policy as spelled out in the AoA.2 Since the WTO was established on January 1, 1995, the United States has generally met its WTO commitments, including spending limits on market-distorting types of farm program outlays.
What Is the Issue?
Direct payments to producers under U.S. farm support programs are cumulative, and compliance with WTO commitments is based on annual spending levels. The addition of large, ad hoc trade assistance payments to producers in 2018 and 2019,3 on top of existing farm program support, has raised concerns by some U.S. trading partners, as well as market watchers and policymakers, that U.S. domestic farm subsidy outlays in those two years might exceed the annual spending limit of $19.1 billion agreed to as part of U.S. commitments to the WTO.
Report Objectives
This report examines whether the United States might exceed its WTO spending limit. As background, this report briefly reviews the WTO rules and disciplines on farm program spending.4 Then, it reviews the types of U.S. farm programs that are subject to WTO disciplines—in particular, it focuses on programs that make direct payments to producers based on agricultural production activities. The review of farm programs includes a discussion of how U.S. compliance may be affected by changes made to U.S. farm programs under the 2018 farm bill (the Agricultural Improvement Act of 2018, P.L. 115-334),5 as well as by the two rounds of ad hoc direct payments made under the Market Facilitation Program initiated by the Secretary of Agriculture in 2018 and 2019 under other statutory authorities.6
The nature and timing of U.S. farm support program outlays are discussed in the context of relevant WTO commitments—in particular, how different types of program outlays are notified to the WTO and how they might count against the aggregate U.S. spending limit. Finally, this report examines current projections about farm program outlays for 2018-2019 and assesses the possibility of whether U.S. farm program spending might exceed the $19.1 billion spending limit in those years.
WTO Disciplines on Farm Program Spending
Farm support programs can violate WTO commitments in two principal ways: first, by exceeding spending limits on certain market-distorting programs, or second, by generating market distortions that spill over into the international marketplace and cause significant adverse effects for other market participants. In general, U.S. farm support outlays should be evaluated against both of these criteria for a potential violation of WTO commitments. However, this report focuses on the first potential pathway for a violation: excessive spending.7
AoA Defines Spending Disciplines
WTO member nations have agreed to limit spending on their most market-distorting farm policies. The WTO's AoA spells out the rules for countries to determine whether their policies are potentially trade-distorting, how to calculate the costs of any distortion, and how to report those costs to the WTO in a public and transparent manner. (See the text box "WTO Classification of Domestic Support" below. More detail on WTO classifications of domestic support is provided in two appendices to this report: Appendix A, "WTO Domestic Support Commitments," and Appendix B, "U.S. Domestic Support Notifications.")
Domestic farm subsidies under the AoA are measured using a specially defined indicator, the "Aggregate Measure of Support" (AMS). AMS encompasses two types of support provided as a benefit to agricultural producers: product-specific support (that is, benefits linked to a specific commodity) and non-product-specific support (general benefits not linked to a specific commodity). This distinction is important for evaluating compliance, as discussed below. In addition, some types of programs are not subject to spending limits under WTO commitments.
The United States, along with 27 other original members of the WTO, agreed to establish ceilings for their non-exempt AMS, referred to as the amber box. The U.S. ceiling for amber box spending has been fixed at $19.1 billion since 2000. If the United States were to exceed its WTO annual spending limit, then U.S. farm support programs could be vulnerable to challenge by another WTO member under the WTO's dispute settlement rules.8
Some Program Spending May Be Exempt from Disciplines
Not all farm support program outlays count against amber box spending limits. Certain domestic support outlays may be exempt from counting against the amber box spending limit if they meet one of four possible conditions (Appendix A). First, if a program's outlays are considered to be minimally or non-trade distorting (in accordance with specific criteria listed in Annex 2 of the AoA), then they may qualify as green box programs and not be included in the AMS. Second, if program spending is market-distorting but has offsetting features that limit the production associated with support payments, then they may qualify as blue box programs and not be included in the AMS. Finally, if AMS outlays are sufficiently small relative to the value of the output—measured as a share of either product-specific or non-product-specific output—then they are not included in the amber box. In addition to these exemptions, the timing of outlays across crop, calendar, or marketing years may also influence the calculation of total AMS spending for any given year and help avoid exceeding the amber box spending limit during a particular time period.
|
WTO Classification of Domestic Support The WTO classifies program spending according to the degree of market distortion. Aggregate Measure of Support (AMS) sums in monetary terms the market-distorting program outlays. AMS encompasses two types of support provided as a benefit to agricultural producers: product-specific support (that is, benefits linked to a specific commodity) and non-product-specific support (general benefits not linked to a specific commodity). Certain program spending may be excluded from the AMS by green or blue box criteria (see below). AMS outlays may be eligible for exemption from counting against spending limits by product- or non-product-specific de minimis 5% spending thresholds (see below).
|
U.S. Farm Support Programs
The U.S. Department of Agriculture (USDA) implements four general types of farm programs that provide payments (classified as AMS) directly to individual producers:
- Traditional farm programs authorized under Title I of the 2018 farm bill (P.L. 115-334).9 These include the Market Assistance Loan (MAL), Agricultural Risk Coverage (ARC), Price Loss Coverage (PLC), Dairy Margin Coverage (DMC), and sugar programs. Payments under these programs during crop years 2014-2018 were authorized by the 2014 farm bill (P.L. 113-79).10 These programs were modified by the 2018 farm bill and include payments made for crop years 2019-2023. Because of the way their payments are triggered,11 outlays under the MAL, DMC, and sugar programs are notified as product-specific AMS, whereas ARC and PLC payments are notified as non-product-specific AMS.
- Permanent disaster assistance programs include the Livestock Forage Disaster Program (LFP), Livestock Indemnity Program (LIP), Tree Assistance Program (TAP), and Emergency Assistance for Livestock, Honeybees, and Farm-Raised Fish Program (ELAP).12 Payments under all of these permanent disaster assistance programs are coupled to producer choices and notified as product-specific AMS.13
- The federal crop insurance program provides premium subsidies to producers.14 Premium subsidies are statutorily defined as a percentage of a policy's total premium, and premiums vary with insured units, coverage levels, and crop values. Since 2012, USDA has notified crop insurance premium subsidies to the WTO as product-specific AMS, since they are coupled to producer crop choices.15
- Ad hoc programs may be authorized by the Secretary of Agriculture, outside of Congress, using authority under the Commodity Credit Corporation (CCC) Charter Act16 to make payments in support of U.S. agriculture. Two such programs are the trade assistance programs of 2018 and 2019.17 USDA has not yet notified any trade assistance payments to the WTO, nor has USDA announced the WTO classification it intends to use for such payments.
Payments under U.S. conservation programs are generally deemed non-market-distorting and are notified as green box, where they are not subject to any spending limit.
The traditional revenue support programs, as well as the disaster assistance and ad hoc payment programs, are implemented by USDA's Farm Service Agency (FSA) using mandatory CCC funding. The federal crop insurance program is implemented by USDA's Risk Management Agency (RMA) using mandatory funding from the Federal Crop Insurance Corporation.
Farm Program Changes Under the 2018 Farm Bill
The United States has instituted several farm program changes since early 2018 that could bring increased scrutiny from other WTO members.18 With respect to the current incarnation of traditional farm support programs, most were established under previous farm bills. They were reauthorized by the 2018 farm bill but with some modifications that might alter their treatment under WTO disciplines. In general, the 2018 farm bill incrementally shifts farm safety net outlays away from decoupled programs and toward coupled (and more market-distorting) programs. This was done by raising support levels for certain existing coupled programs, removing several of the coupled programs from individual farm payment limit requirements, and expanding the potential pool of family-farm payment recipients, thus weakening payment limit restrictions. Similarly, federal crop insurance coverage was expanded under the 2018 farm bill, thus increasing the potential for greater premium subsidy outlays.
Coupled, Product-Specific Support Levels Raised for Selected Commodities
The 2018 farm bill increased statutory, product-specific MAL rates for several program crops.19 MAL payments are coupled directly to actual harvested production (subject to a producer's participation choice).20 MAL payments may be triggered when the local market price for a MAL commodity falls below its statutory MAL rate. Raising the MAL loan rate has two effects: It increases the probability of triggering a coupled MAL payment when market prices are declining, but it decreases the maximum potential payment under the decoupled PLC program associated with that commodity.21 The potential for increased MAL payments has become more relevant under the 2018 farm bill, because all MAL benefits were removed from counting against annual USDA producer payment limits.22
Furthermore, the 2018 farm bill raised support levels for participating dairy producers under the DMC program.23 DMC payments are triggered when the monthly average of a formula-determined margin, between milk prices and feed costs per unit, falls below a producer-selected margin coverage level. DMC payments are made on a farm-level historical milk production base. Milk producers must participate in the DMC to be eligible for payments. Thus, DMC payments are treated as coupled. DMC, like its predecessor—the Margin Protection Program—operates without any limit on payments received.
Coupled payments can influence producer production choices in favor of those farm activities expected to receive larger support payments. If such payments represent a significant share of a commodity's farm value and result in surplus production that moves into international markets, then they could attract the attention of competitor nations. Such spillovers, if measurably harmful to foreign export competitors or producers, could lead to challenges under the WTO's dispute settlement process.24
Decoupled, Non-Product-Specific Support Potentially Expanded Under ARC and PLC
Of the direct payment programs, the ARC and PLC programs are partially decoupled from producer behavior: Payments are made to a portion (85%) of historical base acres irrespective of current-year plantings.25 However, ARC and PLC payment calculations use current market-year prices to determine if a payment has been triggered, thus partially coupling them to market conditions.26 The partial decoupling of both ARC and PLC is in deference to WTO rules that view decoupled payments as less distorting of markets than coupled payments. Furthermore, ARC's use of a moving average formula based on historical prices and yields is also in response to a WTO panel finding (under dispute settlement) to consider market conditions in setting program support levels. In contrast, PLC's use of a statutorily fixed reference price ignores market conditions. Similarly, ARC's revenue formula uses the PLC reference price as a floor price. Thus, ARC only reflects market conditions when prices are above PLC reference prices. As a result, both ARC and PLC could be market distorting when market prices are below the statutory reference prices for prolonged periods.27
By basing ARC and PLC payments on historical acres rather than current planted acres (i.e., current crop choices), the payments are partially decoupled, and USDA notified them as non-product-specific. As a result, ARC and PLC payments have been excluded from counting against amber box spending limits in the WTO since their origin in 2014 under the non-product-specific de minimis exclusion.28
PLC Program Changes That Expand Potential Payments
Two changes to the PLC program under the 2018 farm bill include the option for producers to update their program yields (used in the PLC payment formula) and an escalator provision that could potentially raise a covered commodity's effective reference price (used in both the PLC and ARC payment rate) by as much as 115% of the statutory PLC reference price based on 85% of the five-year Olympic average29 of farm prices. Both of these options would likely be used by producers only when they offer the potential to expand program payments.
ARC Program Changes That Expand Potential Payments
The 2018 farm bill also specifies several changes to the ARC program. Among the changes, ARC will use a trend-adjusted yield to calculate its revenue guarantee. In addition, the five-year Olympic average county yield calculations will increase the yield floor (substituted into the formula for each year where the actual county yield is lower) to 80%, up from 70%, of the transitional county yield.30 This yield calculation is used to calculate the ARC benchmark county revenue guarantee. Both of these yield modifications have the potential to raise ARC revenue guarantees for producers, thus increasing the potential for payments when actual current-year yields or prices turn downward.
Joint ARC and PLC Changes
The 2018 farm bill offers producers the option in 2019 of switching between ARC and PLC coverage, on a commodity-by-commodity basis, effective for both 2019 and 2020. Beginning in 2021, producers again have the option to switch between ARC and PLC but on an annual basis for each of 2021, 2022, and 2023. This flexibility could allow producers to benefit from current market information to select the program, ARC or PLC, that offers the greatest potential to make payments. Both ARC and PLC payments are subject to annual USDA farm payment limits under the 2018 farm bill (unchanged from the 2014 farm bill).
Several Product-Specific Payment Programs Exempted from Payment Limits
In a change from previous farm policy, the 2018 farm bill removed several coupled, direct payment programs from annual farm payment limit requirements. These include benefits under MAL and the three permanent disaster assistance programs: LIP, TAP, and ELAP.31 DMC, like its predecessor—the Margin Protection Program—operates without any farm payment limit. All of these programs make product-specific amber box payments. The absence of a limit on benefits received by an individual farmer under these programs represents the potential for unlimited, fully coupled outlays that count against the U.S. amber box limit unless exempted under the PS de minimis exemption.
Higher DMC and MAL support levels increase the potential for higher program payments during a market downturn when prices are lower. Weak market conditions and relatively low commodity prices (below MAL loan rates) would be needed to trigger payments under MAL. DMC payments are triggered by weak farm milk prices relative to feed costs. In contrast, disaster payments are triggered by natural disasters or other qualifying perils occurring at the farm level.
Potential Pool of Payment Beneficiaries Expanded
The 2018 farm bill made no changes to the "actively engaged in farming" criteria used to determine whether an individual is eligible for farm program payments.32 However, it modified the criteria for farm program eligibility. The definition of family farm is expanded to include first cousins, nieces, and nephews, thus increasing the potential pool of individuals eligible for individual payment limits on family farming operations. With respect to payment limits and the adjusted gross income (AGI) criteria, the 2018 farm bill left both the payment limit of $125,000 per individual ($250,000 per married couple) and the AGI threshold of $900,000 unchanged.
Minor Increase to Sugar MAL Rate
The U.S. sugar program does not rely on direct payments from USDA, and no changes were made to this status under the 2018 farm bill.33 Instead, USDA provides indirect price support via MAL loans to processors at statutorily fixed prices (which were raised 5% by the 2018 farm bill), while limiting both the amount of sugar supplied for food use in the U.S. market and the amount of sugar that may enter the United States under a series of tariff rate quotas. In its 2016 notification of domestic support to the WTO (the most recent notification year), USDA notified the implicit cost of the sugar program at $1.5 billion in market price support. The change in the sugar MAL rate is not expected to influence the United States' implicit sugar cost notification.
Federal Crop Insurance Direct Support Expanded
Federally subsidized crop insurance is available for over 100 agricultural commodities—including both program commodities and others.34 Federal crop insurance is permanently authorized by the Federal Crop Insurance Act (7 U.S.C. 1501 et seq.) but is periodically modified by new farm legislation. The principal subsidy component of federal crop insurance is a premium subsidy that has paid for an average of 63% of the cost of buying crop insurance since 2014.35
Premiums (and premium subsidies) vary with the type of policy, insured unit, and coverage level selected. Thus, both the premium and its subsidy component are coupled to producer behavior. In its annual notifications to the WTO of domestic support outlays, USDA has declared the premium subsidies as product-specific direct payments to producers (i.e., product-specific AMS).
The 2018 farm bill expanded the federally subsidized crop insurance program. In addition, the 2018 farm bill extended the authority for catastrophic policies to forage and grazing crops and grasses. It allows producers to purchase separate crop insurance policies for crops that can be both grazed and mechanically harvested on the same acres and to receive independent indemnities for each intended use. Annual USDA premium subsidies—which have averaged $6.2 billion per year since 2014—count against the U.S. amber box spending limit of $19.1 billion but are subject to potential exclusion at the commodity level under the product-specific de minimis exemption.
Large Payments Expected Under Ad Hoc Trade Aid Programs
During 2018 and 2019, the Secretary of Agriculture has used his authority under the CCC Charter Act36 to initiate two ad hoc trade assistance programs. USDA initiated the trade aid packages as part of the Administration's effort to provide short-term assistance to farmers in response to foreign trade retaliation targeting U.S. agricultural products.37 The first trade aid package was announced on July 24, 2018.38 It targeted production for selected agricultural commodities in 2018 and was valued at up to $12 billion. The second trade aid package was announced on May 23, 2019.39 It targeted production for an expanded list of commodities and was valued at up to an additional $16 billion.
According to USDA, the two trade aid packages are structured in a similar manner and include three principal components (Table 1):
- The Market Facilitation Program (MFP) provides direct payments to producers of certain USDA-specified commodities. MFP payments are administered by FSA.
- The Food Purchase and Distribution Program (FPDP) is intended to purchase unexpected surpluses of affected commodities such as fruits, nuts, rice, legumes, beef, pork, milk, and other specified products for redistribution through federal nutrition assistance programs. It is administered by USDA's Agricultural Marketing Service.
- The Agricultural Trade Promotion (ATP) program provides funding to assist in developing new export markets for affected U.S. farm products. It is administered by the USDA's Foreign Agriculture Service in conjunction with the private sector.
The two years of trade assistance are valued at a combined $28 billion (Table 1). The largest part of the aid is two years of MFP payments valued at a combined $24.5 billion.
|
Trade Aid Component |
2018 Package |
2019 Package |
||||
|
Market Facilitation Payments |
|
|
||||
|
Food Purchase and Distribution Program |
|
|
||||
|
Agricultural Trade Promotion |
|
|
||||
|
Total Funding |
|
|
Source: Compiled by CRS from USDA, various news releases, and program documentation; https://www.farmers.gov/manage/mfp. For program details, see CRS Report R45310, Farm Policy: USDA's 2018 Trade Aid Package; and CRS Report R45865, Farm Policy: USDA's 2019 Trade Aid Package.
Notes: The funding allocations cited in this table represent maximum potential outlays.
The United States has yet to notify spending to the WTO under any of the trade assistance programs, so the exact WTO spending classification is currently unknown. However, past practice can serve as a useful guide for the likely notification.
The FPDP and ATP programs for 2018 and 2019 are expected to be implemented in a similar manner during both years. USDA outlays under food purchase and distribution programs have historically been notified to the WTO as green box compliant and thus not subject to any spending limit. Trade promotion programs, such as ATP, are not notified under domestic support, because they do not involve direct payments to producers. Thus, the FPDP and ATP programs are not expected to affect the United States' ability to meet its WTO commitments.
However, the anticipated large outlays under the MFP programs have raised questions.40 Payments under the two MFP programs are structured differently during 2018 and 2019. As a result, they are likely to be notified under different WTO classifications. The specific manner of determining how payments are made to individual producers is likely to determine their WTO status.
2018 MFP Payments Are Likely to Be Notified as Product-Specific AMS
USDA's MFP payments for 2018 are based on each farm's harvested production of eligible crops during 2018 times a fixed per-unit payment rate. Payments to dairy are based on historical production, while hog payments use midyear inventory data. Under this specification, 2018 MFP payments are likely to be notified as coupled, product-specific AMS and count against the U.S. annual spending limit of $19.1 billion (unless they are exempted under the product-specific de minimis exemption).41
USDA initially announced potential 2018 MFP payments of up to $10 billion. As of August 22, 2019, USDA reported that $8.59 billion in MFP payments had already been distributed to producers, including $7.07 billion to soybean producers, $483 million to cotton, $245 million to sorghum, $241 million to wheat, $182 million to dairy, $156 million to hogs, $133 million to corn, $42 million to fresh sweet cherries, and $20 million to shelled almonds.42 These MFP payments have to be added to all other non-exempt, product-specific payments for each of these commodities and then be evaluated against their individual product-specific de minimis exemptions.
Both MFP payment caps and AGI criteria are relevant. However, the FY2019 Supplemental Appropriations for Disaster Relief Act (P.L. 116-20) altered the AGI requirement as it applies to MFP payments such that it may be waived if at least 75% of AGI is from farming, ranching, or forestry-related activities.43
To the extent that producers expect similar MFP payments to occur in future years, product-specific payments can become market distorting in favor of those commodities with higher per-unit payments and subject to potential WTO challenge.
2019 MFP Payments Are Likely to Be Notified as Non-Product-Specific AMS
USDA is making MFP payments for the 2019 trade assistance program under a different formulation that avoids identifying payments with a specific crop. Instead, the underlying product-specific MFP payment rates are weighted at the county level by historical planted acres and yields to produce a single per-acre MFP payment rate for the entire county. This county-specific rate is then applied to each producer's total planted acres for all eligible commodities within that county, irrespective of the share of planted acres for any particular crop. Thus, payments are coupled to a producer's having planted at least one eligible commodity within the county, but they are independent of which commodity or commodities were planted. Under this specification, the 2019 MFP payments would appear to be coupled to planted acres—a producer has to plant an eligible crop to get a payment—but non-product-specific, thus possibly notifiable as non-product-specific AMS.44
Will U.S. Farm Spending Comply with WTO Limits in 2018 and 2019?
The United States has notified its farm program support outlays through the crop year 2016.45 Under a normal timeline, USDA would notify spending for the crop year 2017 in the fall of 2019. Notification of domestic support for crop year 2018 would not be expected before 2020. Similarly, notification of domestic support outlays for crop year 2019 is not expected before 2021. U.S. compliance with WTO spending limits for 2018 and 2019 cannot be definitively known until notifications for those crop years have been released. As a result, the delay in notification may inhibit or deter another WTO member from bringing a case, assuming that MFP payments are not extended beyond 2019.
This section analyzes available data on U.S. farm program payments for crop years 2017, 2018, and 2019 to evaluate the potential for the United States to remain in compliance with its amber box spending limit of $19.1 billion, particularly with the addition of large MFP payments in 2018 and 2019.46 There are several questions that will largely determine whether the United States remains in compliance with its amber box spending limit.
- 1. How will USDA classify the MFP payments for 2018 and 2019 in its notifications to the WTO?
- 2. How will market conditions and commodity prices evolve in 2019 with respect to final crop values and product-specific de minimis exemptions?
- 3. What will be the final value of total U.S. farm output in 2019 for evaluating the 5% non-product-specific de minimis exemption threshold against total non-product-specific AMS outlays?
- 4. How will market conditions affect decoupled ARC and PLC payments and total non-product-specific outlays in 2019?
- 5. Will the U.S.-China trade dispute continue into 2020, and if so, will a third year of trade assistance be in the offing?
In response to the first question, the 2018 MFP payments appear to be coupled, product-specific AMS, whereas 2019 MFP payments appear to be non-product-specific AMS. Thus, different de minimis exemptions will be important for these two programs when evaluating compliance in 2018 and 2019.
|
U.S. Notification of Farm Support Is Based on Crop Year Data Since the origin of the WTO in 1995, the United States has notified its agricultural support outlays on a crop year basis—that is, program outlays are associated with the crop that they are supporting, even if the actual payment does not occur until a later year. This is an important point, since many farm programs do not make outlays until after a crop is harvested and the producer has reported acreage and yield to the FSA county office. Often this occurs in the calendar year following the planting and harvesting of a crop. For example, both the ARC and PLC programs require a full 12 months of marketing year data to calculate the market-year average price, which is then used to evaluate whether ARC or PLC payments have been triggered. As a result, ARC and PLC payments are not made until after October 1 of the year following the crop's harvest. However, the payments are still associated with the crop from the previous year. This delays both the collection and notification of payment data. |
Sources for Farm Program Outlay Data for 2018 and 2019
To conduct an analysis of the potential WTO compliance of U.S. farm program spending for 2017, 2018, and 2019, data are drawn from several sources. Whenever available, actual USDA program outlays are used. For example, FSA estimates DMC outlays for 2019 at approximately $300 million.47 Federal crop insurance premium subsidy outlays are available for the 2018 and 2019 crop years from USDA's RMA.48 When actual data are unavailable for any major farm program (most notably under ARC and PLC), then the projected spending data from the Congressional Budget Office (CBO) baseline for farm programs are used.49 Wherever values are not available from either USDA or CBO, then the 2017 value is repeated for 2018 and 2019.
With respect to MFP program outlays, USDA has not released any official payment data on outlays under the 2018 or 2019 MFP programs, although some information has been released episodically to various news media (for example, see footnote 42). CRS relies on those media reports for information on 2018 MFP payments.50 Final MFP payments for 2018 are projected by CRS at $8.7 billion. The full $14.5 billion for 2019 MFP payments is incorporated into the WTO notification projection for 2019.
Compliance Hinges on the Non-Product-Specific De Minimis Threshold
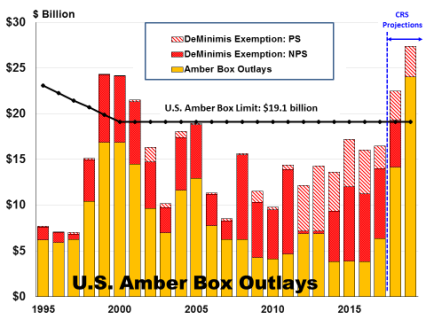
According to this analysis, U.S. amber box spending for 2018, projected at over $14 billion, fits within the U.S. spending limit of $19.1 billion (Table 2). However, if realized, this would be the largest U.S. amber box notification since 2001 (Figure 1). Large product-specific outlays to soybeans (projected at $8.275 billion), wheat ($1.153 billion), cotton ($990 million), and peanuts ($231 million) in particular exceed their product-specific de minimis exemptions and contribute to the large amber box projection for 2018.
A more uncertain result is found for 2019. The expansion of MFP payments to $14.5 billion in 2019, and their shift to a non-product-specific WTO classification, suggests that the United States may potentially approach or exceed its $19.1 billion amber box spending limit. In this analysis, U.S. compliance with WTO spending limits in 2019 depends on how eventual aggregate non-product-specific outlays compare with the final 5% non-product-specific de minimis threshold as evidenced by the two scenarios presented in Table 2 and discussed below.
Scenario 1: Non-Product-Specific Outlays Not Exempted Under De Minimis
Under scenario 1, the value of total U.S. farm output for 2019 is projected at $378 billion (Figure 1). This is roughly equivalent to a three-year average of $377.954 billion for crop years 2014-2016. If realized, the $378 billion in total farm output would yield a 5% non-product-specific de minimis threshold of $18.9 billion. Total non-product-specific outlays for 2019 are projected at $18.92 billion—just in excess of the non-product-specific de minimis exemption threshold. As a result, the full $18.92 billion of non-product-specific AMS would count against the amber box spending limit. When combined with the projected $5.119 billion in product-specific, non-exempt AMS outlays, total U.S. amber box outlays in 2019 would be a projected $24.039 billion—in excess of the $19.1 billion spending limit.
Scenario 2: Non-Product-Specific Outlays Exempted Under De Minimis
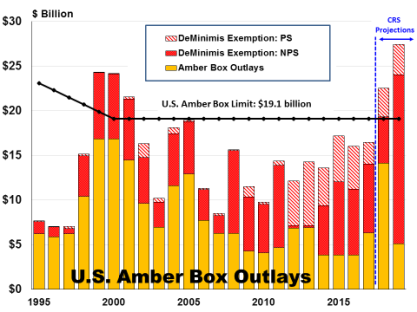
Under scenario 2, an entirely different result is produced with only a minor increase in the projected value of total U.S. farm output at $380 billion (Figure 2), up $2 billion from scenario 1. The choice of $380 billion in the total output value in scenario 2 highlights the sensitivity between compliance and noncompliance based on a small (0.53%) change in total output value between the two scenarios. In this scenario, the 5% non-product-specific de minimis threshold is $19 billion, and the entire projected non-product-specific AMS total of $18.92 billion would be exempted from counting against the amber box spending limit. As a result, total U.S. amber box outlays under scenario 2 would be equal to the projected product-specific, non-exempt AMS total of $5.119 billion—within the amber box spending limit.
Other Potentially Influential Factors
Other factors that could alter this analysis are the final realized 2019 market year average farm prices and county revenue values used to determine outlays for major program crops under the MAL, PLC, and ARC programs. Also, crop yields for corn and soybeans in 2019 are still uncertain due to the delayed planting and late crop progress in several important growing regions. Better-than-expected yields or higher-than-expected harvests could push market prices lower, whereas lower yield or harvest estimates could help to raise farm prices. Also, a continuation or possibly a deepening of the U.S.-China trade dispute could keep downward pressure on commodity markets.
If the final price and revenue values are lower than currently projected, then program payments under ARC and PLC could be larger than those used in this analysis. This could increase aggregate non-product-specific outlays and increase the possibility of exceeding the 2019 amber box spending limit. At the same time, lower market values, if realized, would contribute to a lower total valuation for U.S. farm output and a subsequent lower 5% non-product-specific de minimis threshold for aggregate non-product-specific outlays to surpass, thus affecting the potential non-product-specific de minimis exemption status.
In contrast, resolution of the U.S.-China trade dispute and an improved demand outlook could have the opposite effect of raising prices and commodity output values while lowering payments under countercyclical farm programs such as MAL, PLC, and ARC.
Conclusion
According to the scenarios developed in this analysis, including a projected set of market conditions, the United States may potentially exceed its cumulative amber box spending limit of $19.1 billion in 2019. Excessive amber box payments in 2019 could result from the addition of large MFP payments to the traditional decoupled revenue support programs ARC and PLC.
However, this analysis found that U.S. compliance with WTO amber box spending limits was very sensitive to a change in market conditions and market valuations. Noncompliance hinges on many key market factors that are currently unknown but would have to occur in such a manner as to broadly depress commodity prices through the 2019 marketing year (which extends through August 31, 2020, for corn and soybeans). Another crucial uncertainty is how the U.S.-China trade dispute—with its deleterious effects on U.S. agricultural markets—will evolve.51 Resolution of the U.S.-China trade dispute and an improved demand outlook could lead to higher commodity prices and output values while lowering payments under countercyclical farm programs such as MAL, PLC, and ARC. Such a turn of events could help facilitate U.S. compliance with its WTO spending limits.
|
WTO classification |
Actual |
Projected |
||||||||||||
|
2014 |
2015 |
2016 |
2017 |
2018 |
2019 |
|||||||||
|
Product-specific (PS) AMS |
|
|
|
|
|
|
|
|||||||
|
Non-product-specific (NPS) AMS |
|
|
|
|
|
|
|
|||||||
|
AMS (prior to exemptions) |
|
|
|
|
|
|
|
|||||||
|
SCENARIO 1: U.S. farm output value is $378 billion in 2018 and 2019 |
||||||||||||||
|
Value of U.S. farm output |
|
|
|
|
|
|
|
|||||||
|
NPS de minimis 5% threshold |
|
|
|
|
|
|
|
|||||||
|
De minimis exemptions |
|
|
|
|
|
|
|
|||||||
|
PS de minimis |
|
|
|
|
|
|
|
|||||||
|
NPS de minimis |
|
|
|
|
|
|
|
|||||||
|
Scenario 1: amber box |
|
|
|
|
|
|
|
|||||||
|
PS AMS after exemptions |
|
|
|
|
|
|
|
|||||||
|
NPS AMS after exemptions |
|
|
|
|
|
|
|
|||||||
|
SCENARIO 2: U.S. farm output value is $380 billion in 2018 and 2019 |
||||||||||||||
|
Value of U.S. farm output |
|
|
|
|
|
|
|
|||||||
|
NPS de minimis 5% threshold |
|
|
|
|
|
|
|
|||||||
|
De minimis exemptions |
|
|
|
|
|
|
|
|||||||
|
PS de minimis |
|
|
|
|
|
|
|
|||||||
|
NPS de minimis |
|
|
|
|
|
|
|
|||||||
|
Scenario 2: amber box |
|
|
|
|
|
|
|
|||||||
|
PS AMS after exemptions |
|
|
|
|
|
|
|
|||||||
|
NPS AMS after exemptions |
|
|
|
|
|
|
|
|||||||
|
WTO Spending Limit |
|
|
|
|
|
|
|
|||||||
Source: Data for 2014-2016 are from official U.S. notifications to the WTO. Data for 2017-2019 are compiled by CRS from several sources. Actual program data from USDA are given precedent. For example, FSA estimates DMC outlays for 2019 at approximately $300 million. When actual data are missing for any major farm program, then the projected spending data from the CBO baseline for farm programs (May 2019) are used. With respect to CBO data, fiscal year T is used to represent crop year T-1. Federal crop insurance premium subsidy outlays are available for the 2018 and 2019 crop years (as of September 20, 2019) from USDA's RMA. CRS projects final MFP payments for 2018 as $8.7 billion of PS outlays based on USDA reports to news media and program documentation. The full $14.5 billion for 2019 MFP payments is incorporated with 2019 NPS outlays. Wherever values are not available from either USDA or CBO, then the 2017 value is repeated for 2018 and 2019.
Notes: Amber box totals under each scenario should be compared with the WTO spending limit of $19.1 billion. The two scenarios use different values for U.S. farm output for 2018 and 2019. Scenario 1 uses $378 billion and Scenario 2 uses $380 billion, a slight increase that illustrates the sensitivity of compliance. The actual "total value" of U.S. farm output used for calculating the NPS de minimis threshold will not be known until the official USDA notification is made to the WTO.
|
Figure 1. U.S. Amber Box Compliance, Scenario 1: Farm Output Value = $378 Billion |
 |
|
Source: PS=product specific; NPS=non-product-specific. Compiled by CRS from official U.S. notification to the WTO for 1995-2016. Years 2017-2019 are compiled by CRS from USDA payment data and CBO baseline projections for farm program outlays (May 2019). See Table 2 notes for additional details. Notes: Scenario 1 assumes total U.S. farm output value in 2019 of $378 billion with a 5% de minimis NPS threshold of $18.9 billion. NPS outlays in 2019 projected at $18.92 billion are not exempted. |
|
Figure 2. U.S. Amber Box Compliance, Scenario 2: Farm Output Value = $380 Billion |
 |
|
Source: PS=product specific; NPS=non-product-specific. See Figure 1 for sources. Notes: Scenario 2 assumes the total value of U.S. farm output in 2019 is $380 billion, which yields a 5% de minimis NPS threshold of $19 billion. NPS outlays in 2019 projected at $18.92 billion are exempted. |
Appendix A. WTO Domestic Support Commitments
WTO member nations have agreed to limit spending on their market-distorting farm policies. With respect to farm program outlays, the AoA spells out the rules for countries to determine whether their policies are potentially trade-distorting, how to calculate the costs of any distortion, and how to report those costs to the WTO in a public and transparent manner.
Aggregate Measure of Support (AMS)
Domestic support is measured in monetary terms and expressed as the AMS.52 Domestic support includes both direct and indirect support in favor of agricultural producers—in other words, it includes any government measure that benefits producers, including revenue support, input subsidies, and marketing-cost reductions. Domestic subsidies include both budgetary outlays and revenue forgone by governments. Such support is measured at both the national and subnational level (i.e., state, county, or other local level). Producer-paid fees are deducted from the AMS.
Domestic support should be calculated as closely as practical to the point of first sale of the basic agricultural product concerned—preferably at the farm gate. Support measures directed at processors should be included to the extent that such measures benefit producers.
AMS encompasses two types of support provided as a benefit to agricultural producers: product-specific support (that is, benefits linked to a specific commodity) and non-product-specific support (a general benefit not linked to a specific commodity). Certain AMS outlays may be exempt from counting against any WTO spending limit if they comply with criteria defined under either the green or blue box or if their sum is sufficiently small as to be deemed benign under the de minimis exemption. (Exemptions are described below.)
Amber Box Outlays
Non-exempt AMS outlays are referred to (or classified) as "amber box" spending and subject to a strict spending limit. Under WTO commitments, cumulative U.S. amber box outlays are limited to $19.1 billion annually.
Goal of AMS Exemptions
By leaving no constraint on green or blue box compliant spending, while imposing limits on amber box spending, the WTO's AoA classification structure encourages countries to design their domestic farm support programs to be more green and blue box compliant and less market-distorting.
Green Box Exemptions53
Green box programs are minimally or non-trade-distorting and are not included in the AMS—thus they are not subject to any spending limits. Examples of green box programs include domestic food assistance programs, conservation and environmental programs, and general services such as research, inspection services, and extension activities. In its most recent notification to the WTO, the United States declared $119.5 billion in outlays for programs that met green box criteria during the 2016 crop year.54
A key to evaluating whether a program's annual outlays qualify for the green box exemption is to assess how payments are triggered. If payments are fully decoupled from producer behavior and market conditions and instead are based on some other independent criteria such as historical planted acres, then they could potentially be excluded from the AMS under the green box criteria. For example, Direct Payment outlays under the 1996, 2002, and 2008 farm bills55 were fully decoupled and thus exempted from the AMS under green box criteria. If, instead, payments are coupled to current producer behavior (such as planted acres or harvested output) or to market conditions (such as price movements or trade levels), then they likely are not eligible for exemption from the AMS under green box criteria.
Blue Box Exemptions56
Blue box programs are described as market-distorting but production-limiting. Blue box programs generally have a supply-control feature that partially offsets their trade-distorting effects. For example, payments may be based on either a fixed area or yield or a fixed number of livestock or are made on less than 85% of base production. As such, blue box programs are not included in the AMS—thus they are not subject to any spending limits. The United States has not notified any program spending under the blue box criteria since 1995.57
De Minimis Exemptions from AMS58
Programs outlays that fail to meet green or blue box criteria are part of the AMS. However, there are two additional exemptions that may prevent AMS outlays for certain programs from counting against the amber box spending limit. If AMS spending is sufficiently small (as described below), then it is deemed to be benign and excluded from counting under the AMS's amber box. There are two types of de minimis exemptions: product-specific and non-product-specific.
Product-specific outlays include all coupled outlays that are linked to the current planting or production of a specific commodity. Under the product-specific de minimis exemption, if total product-specific program outlays for a commodity are less than 5% of the value of production for that commodity, then such spending may be excluded from the country's AMS. Product-specific outlays are evaluated on a commodity-by-commodity basis against the 5% de minimis threshold.59
Non-product-specific outlays include all AMS outlays that are decoupled from the specific commodities that are actually produced but are coupled to a non-commodity-specific measure such as market conditions or national average prices. All non-commodity-specific AMS outlays are aggregated and evaluated against 5% of the total value of U.S. agricultural output.60
Coupled, Product-Specific Payments
If the payment is based on the planted or harvested area or output of a specific commodity during the crop year, then program payments would be coupled directly to farmer behavior. Such payments would likely be notified as product-specific AMS spending and would count against the amber box ceiling. However, product-specific payments could potentially be excluded from counting against the AMS total by the product-specific de minimis exclusion—if they are less than 5% of the value of that specific commodity's output during that crop year.
Coupled or Partially Coupled, Non-Product-Specific Payments
If the payment is based on a formula that pools the planted or harvested area or output of several commodities—for example, as a single county-level payment—but where the farmer need only have produced at least one of the pooled commodities to be eligible for the full county payment, then the payment could potentially be notified as coupled, non-product-specific AMS. Both ARC and PLC outlays on base acres are notified this way. However, ARC and PLC payments made on generic base under the 2014 farm bill were notified as commodity-specific payments, since the farmer had to plant the specific crop to receive a payment.
If the payment is based on a historical measure such as planted or harvested acres or output for some past period of time, but where some production of an eligible crop must occur during the current crop year to be eligible for a payment, then the payments would likely be notified as partially decoupled, non-product-specific payments.
Annual Notification of Compliance
To provide for monitoring and compliance of WTO policy commitments, each WTO member is expected to submit annual notification reports of domestic support program spending within the context of the agreed-to WTO commitments.61 However, there is no enforcement mechanism or penalty for late notifications.
The annual period used by each WTO member—calendar, fiscal, or marketing year—is specified in the "schedule of concessions" (also referred to as the country schedule).62 The WTO's Committee on Agriculture reviews the annual notifications. However, the notification reports are public documents—they are posted online by the WTO where they are available for review (and possible challenge) by any other member or third party.63
Appendix B. U.S. Domestic Support Notifications
The most recent U.S. notification to the WTO of domestic support outlays (made on October 31, 2018) is for the 2016 crop year.64 The majority of U.S. domestic agricultural program outlays have been categorized as indirect support that adhere to green box criteria ($119.5 billion) and thus have not been subject to any payment limit. In addition, the United States has traditionally relied on the de minimis exemptions to exempt substantial program outlays from counting against the amber box spending limit.
In 2016, the United States notified $16 billion in AMS outlays (prior to applying eligible exemptions), including $8.6 billion of product-specific spending and $7.4 billion of non-product-specific spending. However, the United States notified $12.2 billion in de minimis exemptions, thus reducing the original $16 billion AMS to just $3.8 billion in amber box spending to count against the $19.1 billion spending limit.
With respect to the non-product-specific de minimis exemption, the total value of U.S. national agricultural output in 2016 was $355.5 billion. As a result, the 5% de minimis non-product-specific threshold was $17.8 billion. Since non-product-specific outlays of $7.4 billion were well below this threshold, they were exempted in total from counting against the amber box spending limit.
In addition, the United States notified $4.8 billion in product-specific de minimis exemptions. An example of a product-specific de minimis exemption is corn. In 2016, U.S. corn production was valued at $51.3 billion. Thus the product-specific 5% value threshold for corn was $2.565 billion. The United States notified $2.345 billion in AMS for corn in 2016, but since it was less than the 5% threshold, the entire amount was exempted from counting against the amber box limit. Similarly, product-specific exemptions for other crops made up the difference for the $4.8 billion in total product-specific exemptions.
The De Minimis Exemption Aids U.S. Compliance
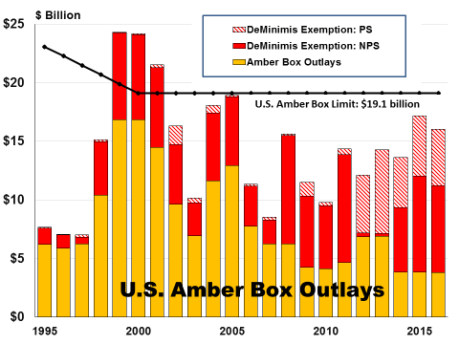
Since 1995, the United States has stayed within its amber box spending limits (Figure B-1), but this compliance has hinged on use of the de minimis exemptions in a number of years (e.g., 1999-2001 and 2005) to exclude substantial AMS spending from counting against the amber box limit.
Since the 2002 farm bill (P.L. 107-171), the United States has designed several of its major farm revenue support programs to meet non-product-specific criteria.65 Since the non-product-specific de minimis exemption threshold is measured as a share of the total value of U.S. agricultural output, it is associated with a very large exemption threshold. From 2010 to 2016, the value of total U.S. agricultural output has averaged $376.8 billion, which implies an average non-product-specific 5% de minimis threshold of $18.8 billion.
The manner by which the United States has notified its amber box outlays—that is, non-product-specific versus product-specific—has changed over the years (particularly for federal crop insurance subsidies) in such a way as to facilitate compliance with the amber box spending limit. Generally, non-product-specific de minimis exemptions are much larger than product-specific de minimis exemptions (Figure B-1). Since 2010, non-product-specific de minimis exclusions have averaged $4.8 billion annually, compared with average product-specific exclusions of $3.8 billion.
The largest non-product-specific exemption was reached in 2011, when $7.5 billion in net crop insurance indemnities66 was exempted. In 2011, U.S. agricultural output value was $380.8 billion, which, in turn, yielded a non-product-specific 5% value threshold of $19.0 billion.
Starting in 2012, USDA switched to notifying crop insurance premium subsidies for each individual insured commodity as product-specific. Since then, crop insurance premiums are evaluated at the individual crop level and eligible to be exempted under the product-specific de minimis exemption if they do not exceed 5% of the value of that commodity's output when combined with other PS outlays for that commodity. Since 2012, over $5 billion in product-specific crop insurance premium subsidies have been exempted each year.
As a result of this crop insurance notification switch, coupled with relatively high farm prices during 2012 and 2013 that reduced payments on the non-product-specific revenue support programs, product-specific de minimis exemptions surpassed non-product-specific exemptions during those two years. Then, starting in 2014, under program changes authorized by the 2014 farm bill (P.L. 113-79), the value of non-product-specific exemptions again surpassed product-specific exemptions. This was driven by large non-product-specific outlays under the new, decoupled revenue support programs ARC (which incorporated high farm prices into its payment formula) and PLC. Annual ARC and PLC outlays averaged a combined $6.7 billion during 2014-2016, including $4.7 billion for ARC and $2.0 billion for PLC.
Author Contact Information
Footnotes
| 1. |
The WTO is a global rules-based, member-driven organization dealing with the rules of trade between nations. As of July 29, 2016, the WTO included 164 members. See CRS Report R45417, World Trade Organization: Overview and Future Direction. |
| 2. |
See CRS Report R45305, Agriculture in the WTO: Rules and Limits on U.S. Domestic Support. See also WTO, "Agreement on Agriculture," https://www.wto.org/english/docs_e/legal_e/14-ag_01_e.htm. |
| 3. |
The trade-assistance payments are in response to trade losses related to an ongoing trade dispute between the United States and China. For details, see CRS Report R45865, Farm Policy: USDA's 2019 Trade Aid Package, and CRS Report R45865, Farm Policy: USDA's 2019 Trade Aid Package. |
| 4. |
WTO disciplines governing farm support programs are reviewed in more detail in Appendix A. Additional references are indicated in footnotes throughout the report. |
| 5. |
See CRS Report R45525, The 2018 Farm Bill (P.L. 115-334): Summary and Side-by-Side Comparison. |
| 6. |
See CRS Report R45310, Farm Policy: USDA's 2018 Trade Aid Package. |
| 7. |
For a discussion of the second pathway—market distortions—see CRS Report RS22522, Potential Challenges to U.S. Farm Subsidies in the WTO: A Brief Overview. |
| 8. |
The remedy under WTO dispute settlement rules is withdrawal of the offending subsidy or suspension of concessions. In general it is not damage payments to foreign farmers unless the United States agrees to such terms under a settlement with the challenging country. For example, the United States successfully challenged China's provision of domestic support (in excess of China's WTO AMS spending commitments) for producers of each of wheat, Indica rice, Japonica rice, and corn during 2012, 2013, 2014, and 2015. A WTO panel found that the policies related to corn had expired in 2015 prior to the initiation of the dispute. However, the subsidies provided to wheat and rice were both germane to the dispute and in violation of WTO commitments. China did not contest the panel findings and agreed to remove the offending policies by March 31, 2020. See WTO dispute settlement case DS511, "China—Domestic Support for Agricultural Producers," https://www.wto.org/english/tratop_e/dispu_e/cases_e/ds511_e.htm. |
| 9. |
In 2018, the United States enacted the five-year omnibus 2018 farm bill. It covers a broad range of agriculture-related program areas in 12 separate titles. The first title, Commodities, authorizes the farm programs that make direct payments to eligible producers and are notified as AMS—including the revenue support programs for major program crops. See CRS Report R45730, Farm Commodity Provisions in the 2018 Farm Bill (P.L. 115-334). |
| 10. |
The DMC was created under the 2018 farm bill but is a modification of the Margin Payment Program created under the 2014 farm bill. |
| 11. |
The payment triggers for ARC and PLC are described in the section "Decoupled, Non-Product-Specific Support Potentially Expanded Under ARC and PLC" of this report. |
| 12. |
LFP, LIP, TAP, and ELAP are permanently authorized by the 2014 farm bill. See CRS Report RS21212, Agricultural Disaster Assistance. |
| 13. |
Coupled means that payments are linked to current producer behavior. In contrast, decoupled payments are not linked to producer behavior but are instead based on some other measure outside of the producer's decisionmaking sphere, such as historical acres planted to program crops. Coupled payments have the most distortive influence on producer behavior. Decoupling of payments is intended to minimize their incentives on producer behavior. |
| 14. |
Federal crop insurance is permanently authorized by the Federal Crop Insurance Act of 1980 as amended (7 U.S.C. §1501 et seq.). See CRS Report R45193, Federal Crop Insurance: Program Overview for the 115th Congress. |
| 15. |
Prior to 2012, crop insurance outlays were notified as "net indemnities" that comprised total indemnity payments minus the producer-paid share of premiums. These net indemnities were classified as NPS AMS outlays and excluded from counting against the amber box spending limit under the NPS de minimis exemption. Neither the PS nor NPS notification of crop insurance premiums has ever been challenged by another WTO member. See Appendix B. |
| 16. |
See CRS Report R44606, The Commodity Credit Corporation: In Brief. |
| 17. |
See CRS Report R45865, Farm Policy: USDA's 2019 Trade Aid Package; and CRS Report R45310, Farm Policy: USDA's 2018 Trade Aid Package. |
| 18. |
Joseph Glauber, "How Farmer Trade Aid Undermines the US in World Markets," The Hill, August 5, 2019. |
| 19. |
MAL rates were raised for barley, corn, grain sorghum, oats, extra-long-staple cotton, rice, soybeans, dry peas, lentils, and small and large chickpeas. Commodities excluded from the rate increases are upland cotton, peanuts, minor oilseeds, nongraded wool, mohair, and honey. |
| 20. |
For a description of potential MAL benefits under the previous 2014 farm bill (P.L. 113-79), see CRS In Focus IF10714, Farm Bill Primer: The Marketing Assistance Loan Program. |
| 21. |
This is because the PLC payment rate equals the PLC reference price minus the higher of the market-year average price or the MAL loan rate. Thus, raising the MAL loan rate squeezes the potential maximum PLC payment rate. |
| 22. |
See section "Several Product-Specific Payment Programs Exempted from Payment Limits" of this report. |
| 23. |
Most of the increases in support occur for a participating producer's first 5 million pounds of milk production. See CRS In Focus IF11188, 2018 Farm Bill Primer: Dairy Programs. |
| 24. |
For more details, see CRS Report R43817, 2014 Farm Bill Provisions and WTO Compliance, and CRS Report RS22522, Potential Challenges to U.S. Farm Subsidies in the WTO: A Brief Overview. |
| 25. |
Base acres describe the historical planted acreage on each FSA farm using a multi-year average from as far back as the 1980s for purposes of calculating program payments under PLC or ARC. See CRS Report R45730, Farm Commodity Provisions in the 2018 Farm Bill (P.L. 115-334). |
| 26. |
PLC payments are triggered at the national level for a program crop when the current market-year average price (MYAP) is below the statutory PLC reference price. ARC payments are triggered at the county level when the current county revenue for a program crop (equal to the county yield times the MYAP) is below the ARC guarantee (equal to 86% of historical revenue based on five-year averages of county yield and MYAP but excluding the years with high and low values). |
| 27. |
Requisite conditions underlying potential market distortions include both low market prices and the producer expectation for program yield and base updating, which would incentivize planting program crops that receive the largest relative per-acre subsidy. |
| 28. |
See Appendix B, "U.S. Domestic Support Notification," for more information on NPS exemptions. |
| 29. |
The Olympic average excludes the high- and low-price years from calculation of the average. |
| 30. |
Each county has a different transitional (or T) yield based on the 10-year historical average yield. See A. Plastina and W. Edwards, "Proven Yields and Insurance Units for Crop Insurance," Ag Decision Maker, updated June 2017, https://www.extension.iastate.edu/agdm/crops/html/a1-55.html. |
| 31. |
See CRS In Focus IF10722, Farm Bill Primer: Program Eligibility and Payment Limits. |
| 32. |
See CRS Report R44656, USDA's Actively Engaged in Farming (AEF) Requirement. |
| 33. |
For more information, see CRS Report R43998, U.S. Sugar Program Fundamentals. |
| 34. |
See CRS In Focus IF10980, Farm Bill Primer: Federal Crop Insurance. |
| 35. |
CRS calculation based on RMA, Summary of Business Data, as of September 16, 2019. |
| 36. |
See CRS Report R44606, The Commodity Credit Corporation: In Brief. |
| 37. |
See CRS Report R45903, Retaliatory Tariffs and U.S. Agriculture. |
| 38. |
See CRS Report R45310, Farm Policy: USDA's 2018 Trade Aid Package. |
| 39. |
See CRS Report R45865, Farm Policy: USDA's 2019 Trade Aid Package. |
| 40. |
Doug Palmer, "Other Nations Question New U.S. Trade Aid Payments for Farmers," Politico, June 17, 2019. |
| 41. |
This potential notification is a CRS projection based on analysis of the design of the 2018 MFP program and how it corresponds with previous U.S. notifications. USDA may use a different line of reasoning and notify 2018 MFP payments under a different WTO classification. |
| 42. |
Jacqui Fatka, "First Round of 2019 MFP Payments Issued," Feedstuffs, August 22, 2019. |
| 43. |
This expansion of AGI criteria was particularly useful for allowing greater MFP payments on certain specialty crops. |
| 44. |
This potential notification is based on CRS analysis of the design of the 2019 MFP program and how it corresponds with previous U.S. notifications. USDA may use a different line of reasoning and notify 2019 MFP payments under a different WTO classification. |
| 45. |
WTO, U.S. Notification of Domestic Support for Marketing Year 2016, G/AG/N/USA/123, August 31, 2018. |
| 46. |
This analysis follows the USDA practice of associating farm support payments with the specific crop (by year) that they are supporting. See the shadow box on the next page for details. |
| 47. |
FSA, "2019 Dairy Margin Coverage Program, Enrollment Report by State," September 23, 2019. |
| 48. |
RMA, "Summary of Business Report," September 23, 2019. |
| 49. |
CBO, "Baseline for Farm Programs," May 2, 2019. Note that CBO's data is reported on a fiscal year basis and must be shifted backward by one year to represent crop year data. For example, FY2020 projections are used to represent crop year 2019 program support. |
| 50. |
USDA's MFP program documentation provides a detailed description of the payment formula and funding authority. |
| 51. |
See CRS Report R45929, China's Retaliatory Tariffs on U.S. Agriculture: In Brief. |
| 52. |
For a description of AMS, see the AoA's Article 1, "Definition of Terms," and Article 6, "Domestic Support Commitments." For details on the calculation of AMS, see the AoA's Annex 3, "Domestic Support: Calculation of Aggregate Measure of Support," and Annex 4, "Domestic Support: Calculation of Equivalent Measure of Support." |
| 53. |
Green box exemptions are listed in Annex 2 of the AoA. |
| 54. |
WTO, U.S. Notification of Domestic Support for Marketing Year 2016, G/AG/N/USA/123, August 31, 2018. |
| 55. |
The 1996 farm bill (P.L. 104-127), the 2002 farm bill (P.L. 107-171), and the 2008 farm bill (P.L. 110-246) all authorized the Direct Payments program. The 2014 farm bill (P.L. 113-79) ended Direct Payments. |
| 56. |
Blue box exemptions are listed in Article 6, paragraph 5 of the AoA. |
| 57. |
An example of a production-limiting program is the now-abandoned U.S. target-price, deficiency-payment program that linked payments to land set-aside requirements. The target-price, deficiency-payment program was first established under the 1973 farm bill (the Agricultural and Consumer Protection Act of 1973; P.L. 93-86) and was terminated by the 1996 farm bill (the Federal Agriculture Improvement and Reform Act of 1996; P.L. 104-127). As a result, the United States notified blue box payments under this program only for 1995, its last year of operation. |
| 58. |
The de minimis exemption is listed in Article 6, paragraph 4 of the AoA. |
| 59. |
If product-specific support for a particular commodity exceeds its product-specific de minimis threshold (i.e., 5% of the output value of that commodity) by any amount, then the entire product-specific support for that commodity must count against the amber box limit. |
| 60. |
If non-product-specific support for a particular commodity exceeds the non-product-specific de minimis threshold (i.e., 5% of the total value of agricultural output) by any amount, then the entire non-product-specific support must count against the amber box limit. |
| 61. |
WTO, AoA, Article 18, "Review of the Implementation of Commitments." |
| 62. |
For WTO member schedules see, http://www.wto.org/english/tratop_e/schedules_e/goods_schedules_e.htm. The United States reports its domestic support outlays on a marketing year basis. |
| 63. |
WTO, "Documents Online," https://docs.wto.org/dol2fe/Pages/FE_Search/FE_S_S005.aspx. |
| 64. |
WTO, U.S. Notification of Domestic Support for Marketing Year 2016, G/AG/N/USA/123, August 31, 2018. |
| 65. |
This includes the Counter-Cyclical Payment program under the 2002 and 2008 farm bills, and the ARC and PLC programs under the 2014 and 2018 farm bills. |
| 66. |
Prior to 2012, the United States notified most federal crop insurance subsidies as a single annual aggregate non-product-specific net indemnity payment. Net indemnities equal total indemnity payments minus the producer-paid portion of the crop insurance premium. |