Federal Crop Insurance: Program Overview for the 115th Congress
Since its inception in 1938, the federal crop insurance program has evolved from an ancillary program with low participation to a central pillar of federal support for agriculture. From 2007 to 2016, the federal crop insurance title had the second-largest outlays in the farm bill after nutrition. The total net cost of the program for crop years 2007-2016 was about $72 billion, of which $43 billion (60%) was of direct benefit to producers, $28 billion (39%) went to private insurers, and $754 million (1%) went to the Risk Management Agency (RMA) within the U.S. Department of Agriculture (USDA).
Historically, the agricultural insurance market has been underdeveloped compared to other insurance markets. Agricultural insurance can be challenging to price for several reasons, including lack of crop data, difficulty in calculating actuarially based rates, production and price variations, geographically correlated risks, moral hazard, and adverse selection (i.e., the tendency of higher-risk farmers being more likely to purchase insurance than lower-risk farmers).
In 1938, on the heels of the Great Depression and the Dust Bowl, Congress created the federal crop insurance program as a potential alternative to supplemental disaster assistance payments. Initially polices were available for only a few principal crops in a limited number of counties. Few eligible acres were insured. The program underwent significant changes in 1980, when Congress authorized premium subsidies and brought private insurers into the program.
Since 1980, federal crop insurance has operated through a shared public-private arrangement funded by taxpayers and producers. Three principal actors operate the program:
Private insurance companies, known as Approved Insurance Providers (AIPs), which are the primary insurers selling and servicing the insurance policies;
The Federal Crop Insurance Corporation (FCIC), which reinsures the policies and subsidizes the delivery expenses of AIPs; and
RMA, which determines policy terms, sets premium rates, and regulates AIPs.
The terms of the financial arrangement between FCIC and AIPs are set out in a mutually negotiated Standard Reinsurance Agreement (SRA). Each AIP signs an SRA with FCIC annually.
In contrast to the program’s limited scope and low participation rate in its early years, by 2011 federal crop insurance was providing more than $100 billion of insurance protection (liability) for over 100 crops (excluding hay, livestock, nursery, pasture, rangeland, and forage) on about 238 million acres. Policy offerings and participation were smaller for the livestock sector—$1.3 billion in liability on less than 3% of total eligible livestock inventory. In 2015, total premium for crops (excluding livestock and other policies) was about $9.8 billion, of which FCIC paid about 62% and producers paid about 38%. From 2000 to 2016, four crops—corn, soybeans, wheat, and cotton—accounted for 75% of enrolled acreage.
The program is permanently authorized and would continue to operate if Congress does not enact a new farm bill. However, past farm bills have made changes to the underlying authority. Given the program’s significant cost and share of USDA program outlays, it is a frequent target for budgetary savings. Multiple bills introduced in the 115th Congress would modify the main financial components of the program. As with any large program, especially those with private sector involvement, congressional oversight has a significant role in ensuring that the federal crop insurance program meets its intended policy goals and operates efficiently.
Federal Crop Insurance: Program Overview for the 115th Congress
Jump to Main Text of Report
Contents
- Introduction
- Role of Crop Insurance in the Farm Bill
- Background
- Challenges of Agricultural Insurance
- Inception and Growth of the Federal Crop Insurance Program
- Effect of Crop Insurance on Supplemental Disaster Payments
- Participation, Policy Types, and Restrictions
- Participation
- Crops Covered
- Acres Enrolled vs. Claim Payments, by Crop
- Primary Policy Types
- Most Popular Policies by Liability
- Conservation-Related Requirements
- Sodsaver
- Sodbuster and Swampbuster
- No Payment Limitations or Means Testing
- Program Operation and Finances
- Entities Operating the Program
- Producer-Paid Premium and Fees
- Standard Reinsurance Agreement (SRA)
- Program Funding
- Program Accounting of Costs
- Premium Subsidies
- Indemnity (Claim) Payments
- Delivery Expenses
- Underwriting Gains and Losses
- Conclusion
Figures
- Figure 1. Projected Cumulative Farm Bill Spending, FY2018-FY2027
- Figure 2. Timeline of Significant Legislation and Events Related to Crop Insurance
- Figure 3. Total Insured vs. Total Planted Acres
- Figure 4. Supplemental Disaster Assistance for Agriculture
- Figure 5. Acres Enrolled in the Crop Insurance Program and Claim Payments
- Figure 6. Federal Crop Insurance Premium by Policy Type in 2016
- Figure 7. Federal Crop Insurance Liabilities by Policy Type from 1989 to 2017
- Figure 8. Entities Operating the Federal Crop Insurance Program
- Figure 9. Net Cost of Federal Crop Insurance to the Government
- Figure 10. Producer-Paid Premium and FCIC Premium Subsidies
- Figure 11. Total Claim Payments Received and Premiums Paid by Producers
- Figure 12. Delivery Subsidies in the Federal Crop Insurance Program
- Figure 13. FCIC's and AIPs' Net Underwriting Gains/Losses
- Figure B-1. Yield Protection Projected Price for Corn and Soybeans
- Figure B-2. Revenue Protection Timeline of Projected and Harvest Prices
- Figure B-3. Federal Crop Insurance Policy Cycle
- Figure D-1. Participating Insurance Companies' Retained Premiums, the Government's Quota Share, and Companies' Underwriting Gains/Losses
Tables
Summary
Since its inception in 1938, the federal crop insurance program has evolved from an ancillary program with low participation to a central pillar of federal support for agriculture. From 2007 to 2016, the federal crop insurance title had the second-largest outlays in the farm bill after nutrition. The total net cost of the program for crop years 2007-2016 was about $72 billion, of which $43 billion (60%) was of direct benefit to producers, $28 billion (39%) went to private insurers, and $754 million (1%) went to the Risk Management Agency (RMA) within the U.S. Department of Agriculture (USDA).
Historically, the agricultural insurance market has been underdeveloped compared to other insurance markets. Agricultural insurance can be challenging to price for several reasons, including lack of crop data, difficulty in calculating actuarially based rates, production and price variations, geographically correlated risks, moral hazard, and adverse selection (i.e., the tendency of higher-risk farmers being more likely to purchase insurance than lower-risk farmers).
In 1938, on the heels of the Great Depression and the Dust Bowl, Congress created the federal crop insurance program as a potential alternative to supplemental disaster assistance payments. Initially polices were available for only a few principal crops in a limited number of counties. Few eligible acres were insured. The program underwent significant changes in 1980, when Congress authorized premium subsidies and brought private insurers into the program.
Since 1980, federal crop insurance has operated through a shared public-private arrangement funded by taxpayers and producers. Three principal actors operate the program:
- 1. Private insurance companies, known as Approved Insurance Providers (AIPs), which are the primary insurers selling and servicing the insurance policies;
- 2. The Federal Crop Insurance Corporation (FCIC), which reinsures the policies and subsidizes the delivery expenses of AIPs; and
- 3. RMA, which determines policy terms, sets premium rates, and regulates AIPs.
The terms of the financial arrangement between FCIC and AIPs are set out in a mutually negotiated Standard Reinsurance Agreement (SRA). Each AIP signs an SRA with FCIC annually.
In contrast to the program's limited scope and low participation rate in its early years, by 2011 federal crop insurance was providing more than $100 billion of insurance protection (liability) for over 100 crops (excluding hay, livestock, nursery, pasture, rangeland, and forage) on about 238 million acres. Policy offerings and participation were smaller for the livestock sector—$1.3 billion in liability on less than 3% of total eligible livestock inventory. In 2015, total premium for crops (excluding livestock and other policies) was about $9.8 billion, of which FCIC paid about 62% and producers paid about 38%. From 2000 to 2016, four crops—corn, soybeans, wheat, and cotton—accounted for 75% of enrolled acreage.
The program is permanently authorized and would continue to operate if Congress does not enact a new farm bill. However, past farm bills have made changes to the underlying authority. Given the program's significant cost and share of USDA program outlays, it is a frequent target for budgetary savings. Multiple bills introduced in the 115th Congress would modify the main financial components of the program. As with any large program, especially those with private sector involvement, congressional oversight has a significant role in ensuring that the federal crop insurance program meets its intended policy goals and operates efficiently.
Introduction
This report provides an overview of the federal crop insurance program. Since its inception in 1938, the program has evolved from an ancillary program with low participation to a central pillar of federal support for agriculture. As the program has grown—in types of insurance policies, breadth of crops covered, and millions of acres enrolled—so has the cost of the program to the federal government.
From 2007 to 2016, the total net cost of the federal crop insurance program was about $72 billion, of which $43 billion (60%) was of direct benefit to producers, $28 billion (39%) went to private insurers, and $754 million (1%) went to the Risk Management Agency (RMA) within the U.S. Department of Agriculture (USDA).1
The "Role of Crop Insurance in the Farm Bill" section compares the cost of the federal crop insurance program with other titles in the 2014 farm bill and recounts that previous farm bills have modified the program. Several bills, including the House Agriculture Committee's Agriculture and Nutrition Act of 2018 (H.R. 2), have proposed changes to the federal crop insurance program.
The "Background" section of this report discusses the federal government's entrance into the crop insurance market, outlines the inception and growth of the federal crop insurance program, and examines the federal crop insurance program's uncertain effect on supplemental disaster programs. The "Participation, Policy Types, and Restrictions" section describes the federal crop insurance portfolio—market penetration, crops and livestock covered, the primary policy types, the distribution of claim payments across primary crops, and conservation-related requirements. The "Program Operation and Finances" section explains the relationship between the entities operating the program, how the program is funded, and the accounting of program costs.
This report does not analyze specific legislative proposals. It also does not address the intricacies of the Standard Reinsurance Agreement,2 the details of how the Federal Crop Insurance Corporation (FCIC) and RMA share authority for the program, mandatory spending under the Federal Crop Insurance Act (7 U.S.C. §1501 et seq.) that is not characterized as a "direct cost" by RMA, or issues relating to improper payments, fraud, and congressional oversight of the program.
Role of Crop Insurance in the Farm Bill
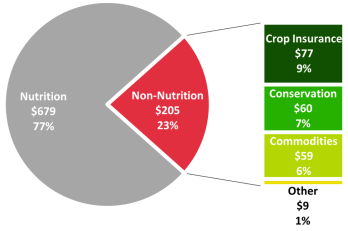
From 2007 to 2016,3 the federal crop insurance title had the second-largest outlays in the farm bill after nutrition. The total net cost of the program during those years was about $72 billion.4 For FY2018 through FY2027, the Congressional Budget Office (CBO) projects that crop insurance will continue to be the second-largest farm bill outlay after nutrition, averaging about $7.7 billion a year, assuming current law remains in effect (Figure 1).5
The federal crop insurance program is permanently authorized (7 U.S.C. §1501 et seq.) and receives mandatory funding.6 As such, it would continue to operate in the event that Congress does not enact a new farm bill, although farm bills have been vehicles for modifying the program in the past. As the expiration of the 2014 farm bill draws nearer,7 Congress may debate proposals to modify the federal crop insurance program in considering the next farm bill.8
Background
Challenges of Agricultural Insurance
Insurance is a cornerstone of commercial business.9 Historically, the agricultural insurance market has been underdeveloped compared to other insurance markets. Agricultural insurance can be difficult to price due to "unique challenges, including shortness of data, and highly variable losses from year to year, which are often geographically correlated."10 Early providers of crop insurance faced a number of challenges that limited the availability and types of insurance products and helped shape the government's decision to intervene in the market. Many of the challenges of agricultural insurance can be described in five broad categories:
- 1. Lack of crop data and actuarially based rates. This was "one of the most serious handicaps" that confronted private crop insurers in the late 1800s and early 1900s.11 Although data availability and rating methodologies have improved, they still pose significant challenges due to uncertainty in yield reporting12 and evolving climate risks.13
- 2. Production and price variations. Farm income can be unstable because it is primarily determined by the combination of variable production and fluctuating commodity prices. Farm production varies due to pests, weather, natural disasters, and other risks. Agricultural commodity prices are influenced by many factors, including supply and demand in domestic and international markets. Prices of these farm commodities tend to be more volatile year to year and day to day than prices of most nonfarm goods and services.14
- 3. Geographically correlated risks. Pooling of risk is a key insurance concept in which a large number of individuals contribute premiums to a common fund to insure particular risks. Insurers use the common fund to pay indemnities to those who experience covered losses. In theory, when an insurer sells policies to many individuals with "less than perfectly correlated risks, the total portfolio is less risky than the average of the individual policies."15 This is because when an insurer spreads uncorrelated risks across the insurance pool, the probability of all insureds having a loss from those uncorrelated risks at the same time can be extremely low.16 Geographically correlated risk refers to a single event causing simultaneous losses in a particular geographic area, such as droughts, floods, and other natural disasters. Compared to uncorrelated risks, correlated risks are more likely to result in very high losses across an insurer's portfolio. Agricultural production is vulnerable to numerous geographically correlated risks, as well as several uncorrelated risks.17 The private market has successfully insured some uncorrelated risks, such as hail and fire, but historically it has had challenges insuring the geographically correlated risks that affect agriculture.
- 4. Multiple peril vs. single or named peril. Prior to the federal crop insurance program, private insurers were unsuccessful with crop policies that covered multiple perils and revenue.18 In contrast to named-peril policies that cover only risks specifically listed in the policy, multiple-peril policies cover all risks within broadly defined categories. Early multiple-peril policies incurred losses that "greatly exceed[ed]" premium income19 and were especially difficult for insurers operating in small geographic areas. Revenue insurance added the challenge of absorbing losses from large price declines.20
- 5. Adverse selection and moral hazard. Adverse selection and moral hazard "are often cited as major causes of private insurance market difficulties" in the agricultural sector.21 Adverse selection refers to higher-risk farmers being more likely to purchase insurance than lower-risk farmers at the same premium rate. It largely stems from an insured having more information about the risk of loss than the insurer.22 Moral hazard refers to the general tendency of an insured party to take on greater risk once insured.23
Inception and Growth of the Federal Crop Insurance Program
According to a USDA publication from 1938, the federal government spent "hundreds of millions of dollars to assist farmers in the wake of crop failures" from around 1923 to 1938.24 USDA maintained that "the public, through the Government, could well afford to bear the administrative expense of an insurance program which would help farmers to stand on their own feet as an alternative to providing direct relief in time of crop disasters."25
In 1936, on the heels of the Great Depression and the Dust Bowl,26 the President's Committee on Crop Insurance recommended a plan of "all-risk" (multiple-peril) crop insurance.27 In 1938, Congress enacted the Agricultural Adjustment Act of 1938 (P.L. 75-43), which created FCIC, a wholly owned government corporation. Initially, FCIC self-insured and administered federal crop insurance policies without the involvement of private insurance companies—that development would not come about until 1980.
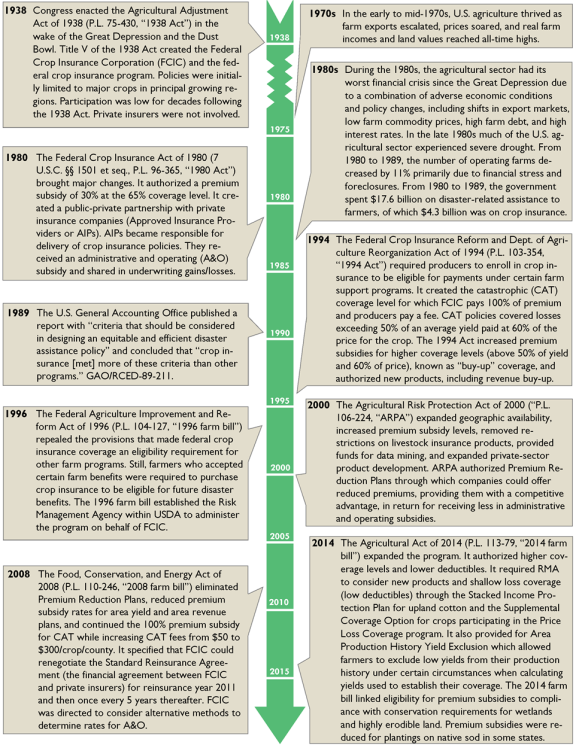
In the early years of federal crop insurance, polices were available for only a few principal crops (mainly corn, barley, oats, sorghum, wheat, cotton, and rice) and in a limited number of counties. Partly as a consequence of the program's limited scope, only a small proportion of planted acres were enrolled.28 The program largely continued in this way until 1980, when major changes—including the introduction of federal premium subsidies and the participation of private insurance companies—led to a substantial increase in enrollment. The Federal Crop Insurance Act of 1980 (7 U.S.C. §1501 et seq.), modified by subsequent farm bills and other legislation, is the permanent statutory authority for the program as it exists today. Figure 2 outlines key modifications to the program from 1938 to 2014.
Between 1980 and 2015, acres enrolled in crop insurance grew from 26.6 million acres (12% of eligible acres)29 to about 238 million acres (86% of all acres), excluding hay, pasture, range, and forage and separately livestock and nurseries.30 During that time frame, the number of crops insured increased from 2831 to 123.32 The types of policies offered also increased over this period from one—yield insurance—to over 20, including yield, revenue, margin, and whole farm revenue, among others.
|
Figure 2. Timeline of Significant Legislation and Events Related to Crop Insurance |
 |
|
Source: CRS compilation from multiple sources. |
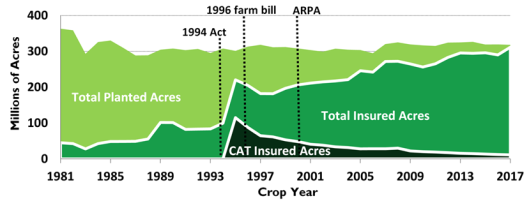
Participation in the federal crop insurance program increased as a share of total planted acres from 1981 to 2017 (Figure 3). A spike in enrollment followed the Federal Crop Insurance Reform and Department of Agriculture Reorganization Act of 1994 ("1994 Act," P.L. 103-354) in response to a provision in the 1994 Act requiring producers to enroll in crop insurance to be eligible for a variety of other federal farm programs.
As a further incentive to participate, the 1994 Act also created the catastrophic (CAT) coverage level, for which FCIC pays 100% of the premium and producers pay a minimal administrative fee. About half of the acres enrolled in 1995 were for CAT coverage.
|
Figure 3. Total Insured vs. Total Planted Acres Principal Crops |
 |
|
Source: CRS using total insured acres and catastrophic-level (CAT) insured acres from RMA Summary of Business data and final acres planted to principal crops from the National Agricultural Statistics Service. Notes: Dotted lines do not indicate precise dates and are placed within the year in which the Federal Crop Insurance Reform and Department of Agriculture Reorganization Act of 1994 (1994 Act), the Federal Agriculture Improvement and Reform Act of 1996 (1996 farm bill), and the Agricultural Risk Protection Act of 2000 (ARPA) were enacted. Acres of insured specialty crops have also increased over the years and today account for 16% of total insured liability. However, specialty crops are not well-suited to measurement by acres and thus are not included in this chart. For more information, see CRS In Focus IF10765, Federal Crop Insurance for Specialty Crops. |
Following the spike in insured acres in 1995 to approximately 73% of total eligible planted acres (Figure 3), participation dipped with the passage of the Federal Agriculture Improvement and Reform Act of 1996 ("1996 farm bill," P.L. 104-127), which repealed the provisions making federal crop insurance coverage an eligibility requirement for other farm programs. The participation slump following the 1996 farm bill proved to be temporary as participation generally increased from 1998 to 2017. The increasing level of participation during this period could be attributed in part to the Agricultural Risk Protection Act of 2000 (ARPA, P.L. 106-224), which significantly increased premium subsidy levels. This reduced the portion of policy premiums paid by farmers and made crop insurance more affordable. ARPA also expanded the role of private insurers in developing products.
Effect of Crop Insurance on Supplemental Disaster Payments
According to CBO, one of the stated policy goals of federal crop insurance has been to reduce the agricultural sector's reliance on supplemental or "ad hoc" disaster assistance payments.33 However, it is difficult to assess whether this policy goal has been achieved. According to CBO, "it is not possible to compare federal spending on the crop insurance program with spending on supplemental assistance that might have been provided in its absence, nor are data available with which to measure declines in federal assistance resulting from increases in spending on the crop insurance program."34 Even so, others assert differently, claiming that crop insurance has actually cost more than the disaster assistance that it was designed to replace.35 Figure 4 shows supplemental assistance for crop losses from FY1994 to FY2016.
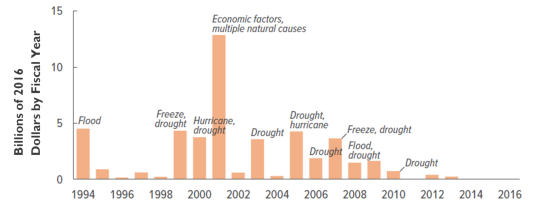
On February 9, 2018, Congress passed and the President signed into law the Bipartisan Budget Act of 2018 (P.L. 115-123), which broadly authorized supplemental appropriations, including $2.36 billion in disaster assistance for crop losses from hurricanes and wildfires in 2017.36
Participation, Policy Types, and Restrictions
Since the Agricultural Act of 2014 ("2014 farm bill," P.L. 113-79), the federal crop insurance program has become a central agricultural support program, with comparable or larger outlays than either commodity price and income support programs (e.g., Agricultural Risk Coverage, Price Loss Coverage, and Marketing Assistance Loans) or conservation programs (e.g., Environmental Quality Incentives Program, Conservation Stewardship Program, and Conservation Reserve Program).
Participation
RMA reports that in 2015 the crop insurance program provided approximately $102.5 billion of insurance protection (liability) for over 100 crops (excluding hay, livestock, nursery, pasture, rangeland, and forage) on about 238 million acres, or 86% of eligible acres.37 Policy offerings and participation were much smaller for the livestock sector—$1.3 billion in liability for livestock (primarily cattle, swine, and dairy) on less than 3% of total eligible head or hundredweight. Total premium for crops (not including livestock and other policies) was about $9.8 billion with premium subsidies paid by FCIC amounting to about $6 billion.38
Crops Covered
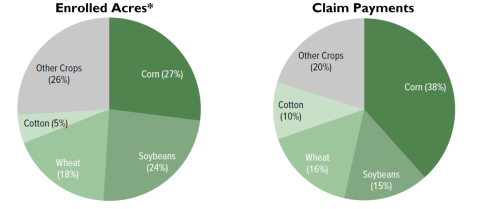
Crop insurance covers a variety of crops, including major field crops and many types of fruits, vegetables, and nursery crops. Because of their large planted area and value, corn and soybeans have been the predominant crops insured. In crop year 2015, liability for corn was $40.3 billion, and liability for soybeans was $24.3 billion out of a total liability of $102.5 billion. Corn and soybeans accounted for approximately 63% of the program's total liability that year.39
Acres Enrolled vs. Claim Payments, by Crop
During the 2000-2016 period, the four largest crops produced in the United States—corn, soybeans, wheat, and cotton—accounted for about 75% of the enrolled acreage and 80% of the claims paid (Figure 5).40 Additional information and analysis on the federal crop insurance portfolio, including crop coverage and market penetration, as well as specific policy terms for different policy types, is available from RMA.41
Primary Policy Types
Producers may select from several types of federal crop insurance policies.42 Most federal crop insurance policies may be purchased as individual or area-wide policies with coverage based on either yield or revenue from the insured area. These two choices result in four potential policy categories: (1) individual yield, (2) individual revenue, (3) area yield, or (4) area revenue.
Individual-based policies insure losses specific to a farm's insured acres. Area-based policies insure losses in the county or region where a farm is located. Yield-based policies insure against production losses from natural causes such as drought, excessive moisture, hail, wind, insects, and diseases.43 Revenue-based policies insure against the combination of production losses from natural causes and declines in commodity prices. In 2016, the top two policies by premium were individual revenue (84% of premium) and individual yield (11% of premium) (Figure 6).
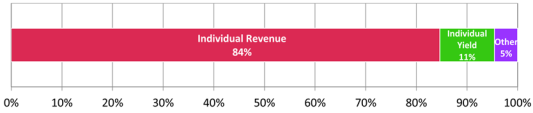
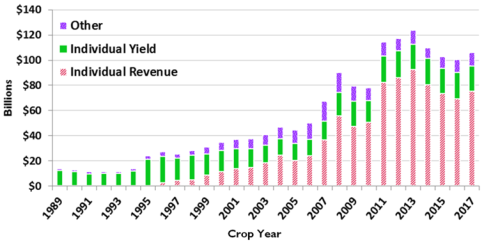
The dominant policy types have changed over time (Figure 7). Since their introduction in the late 1990s, individual revenue policies have grown to replace individual yield policies as the dominant policy type.
Most Popular Policies by Liability
Table 1 shows the top three policies (described below) by liability in crop year 2017: (1) Revenue Protection, (2) Actual Production History, and (3) Yield Protection. Together these three policies accounted for approximately 88% of total liabilities in the federal crop insurance program. For more information on these policy types and the federal crop insurance cycle, see Appendix B.
|
Policy Type |
Policy Name |
Liabilities ($) |
% of Total Liabilities |
|
Individual Revenue |
Revenue Protection |
73,580,488,145 |
69.3% |
|
Individual Yield |
Actual Production History |
13,304,661,814 |
12.5% |
|
Individual Yield |
Yield Protection |
6,777,344,108 |
6.4% |
|
Other |
N/A |
12,437,237,274 |
11.8% |
|
(all policies) |
(all policies) |
106,099,731,341 |
100% |
Source: CRS using RMA Summary of Business data, accessed February 19, 2018.
Conservation-Related Requirements
Three conservation provisions could affect a producer's eligibility for federal crop insurance premium subsidies: (1) sodsaver, (2) sodbuster, and (3) swampbuster.44
Sodsaver
Section 12020 of the Food, Conservation, and Energy Act of 2008 ("2008 farm bill," P.L. 110-246) made native sod45 acreage ineligible for crop insurance premium subsidies and the Noninsured Crop Disaster Assistance Program for the first five years of planting if the acreage had been tilled for an annual crop. This provision was known as "sodsaver" and would initially be applied only at the option of the governor of each respective state with cropland in the Prairie Pothole National Priority Area.46 No governors opted to participate in the program.47
Section 11014 of the 2014 farm bill (P.L. 113-79) amended and expanded a sodsaver provision originally enacted in the 2008 farm bill (P.L. 110-246). The 2014 sodsaver provision applied to native sod in six states—Minnesota, Iowa, North Dakota, South Dakota, Montana, and Nebraska—rather than only the area covered by the Prairie Pothole National Priority Area. The 2014 provision lowered approved yield guarantees and reduced crop insurance premium subsidies by 50 percentage points for production on native sod during the first four years of planting. It also clarified that native sod could include land that had never been tilled or cases where a producer could not substantiate that the ground had ever been tilled.48
Sodbuster and Swampbuster
The 2014 farm bill added crop insurance premium subsidies to the list of USDA program benefits that could be lost if a producer were out of compliance with the conservation provisions protecting highly erodible lands, known as sodbuster,49 or conservation provisions protecting wetlands, known as swampbuster.50
Producers requesting premium subsidies in the first full reinsurance year after enactment had to certify their compliance with the sodbuster and swampbuster provisions. USDA was tasked with evaluating these certifications. Producers out of compliance with sodbuster or swampbuster would be ineligible to receive any premium subsidies. The loss of the insurance premium subsidy was not retroactive and would take effect only after all administrative appeals were exhausted. The 2014 farm bill also extended the exemptions for compliance, allowing producers new to compliance requirements additional time (five reinsurance years) to develop and comply with a conservation plan before losing access to federal crop insurance premium subsidies. Producers with compliance violations prior to the 2014 farm bill's enactment were allowed two reinsurance years to develop and comply with a conservation plan.51
No Payment Limitations or Means Testing
Unlike some farm subsidy programs, federal crop insurance does not limit subsidy or indemnity amounts per individual or entity, nor does it restrict eligibility based on adjusted gross income.52
Program Operation and Finances
The federal crop insurance program is operated through public and private entities and is funded by both taxpayers and producers.
Entities Operating the Program
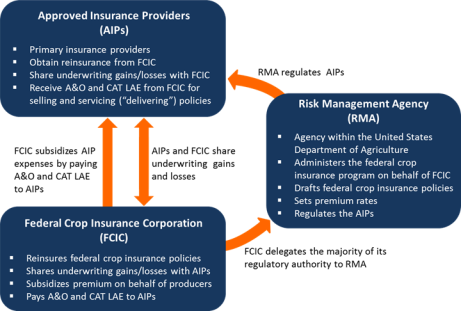
Three main entities operate the federal crop insurance program (Figure 8):
- 1. Private insurance companies, known as Approved Insurance Providers (AIPs),53 are the primary insurers selling and servicing the insurance policies.
- 2. FCIC reinsures the insurance policies, subsidizes the AIPs' expenses by paying them Administrative and Operating subsidies (A&O), and pays AIPs for catastrophic risk protection loss adjustment expenses (CAT LAE).54
- 3. RMA drafts federal crop insurance policies, sets premium rates, and regulates AIPs.
|
Figure 8. Entities Operating the Federal Crop Insurance Program |
 |
|
Source: CRS, based on the 2018 SRA and descriptions of the program published by multiple sources. |
Producer-Paid Premium and Fees
FCIC pays 100% of the premium for CAT policies, while producers pay a $300 administrative fee for each crop insured at the CAT level in each county. At higher coverage levels (known as buy-up), FCIC pays part of the total premium for producers; producers pay the remaining premium.
The FCIC subsidy rate decreases as the coverage level increases. At the highest coverage level (75%-85%, depending on policy type), FCIC pays 38% of the premium. From 2007 to 2016, in aggregate FCIC paid 61% of total premium, and producers paid 39% of total premium.55
Standard Reinsurance Agreement (SRA)
The terms of the financial agreement between FCIC and AIPs are set out in a mutually negotiated document referred to as the Standard Reinsurance Agreement (SRA). Each AIP signs an SRA with FCIC every reinsurance year. The general terms of the SRA are the same for each company. What differs is how the companies choose to divide their books between two risk pools—"commercial," in which the companies retain the majority of the risk, and "assigned risk," in which FCIC retains the majority of the risk.
Under the terms of the SRA, FCIC pays A&O subsidies to AIPs for delivering policies with buy-up coverage, as well as CAT LAE for delivering policies with CAT coverage. (See "Delivery Expenses"). FCIC shares underwriting losses and gains with AIPs—in accordance with the terms of the SRA—by reinsuring federal crop insurance policies sold by AIPs.
The 2008 farm bill allowed FCIC to renegotiate the SRA every five years starting with the 2011 reinsurance year (the 12-month period beginning July 1, 2010). The 2011 reinsurance year was the last time the SRA was renegotiated. The 2011 SRA and all subsequent annual SRAs through reinsurance year 2019 are substantially identical.
A provision in the 2014 farm bill requires that any subsequent SRA renegotiations be budget-neutral. The budget-neutrality requirement prevents FCIC from renegotiating the SRA with financial terms that add costs or result in savings compared to the 2011 SRA.56
Program Funding
The federal crop insurance program is permanently authorized by the Federal Crop Insurance Act of 1980, as amended (7 U.S.C. §1501 et seq.). The act provides mandatory funding of "such sums as are necessary" for A&O, premium subsidies, and other uses.57 In contrast, RMA employees and resources are funded through discretionary funding authorized in annual appropriations bills. In recent years RMA's discretionary funding has hovered around $75 million per fiscal year.
RMA defines direct costs as premium subsidies, indemnities, delivery costs, and underwriting gains/losses. In this report, "indirect" costs refer to costs not included in RMA's list of direct costs.58
Program Accounting of Costs
The total direct cost of the federal crop insurance program to the federal government for crop years 2007-2016 was about $72 billion, of which about $43 billion (60%) directly benefitted producers, $28 billion (39%) went to AIPs, and $754 million (1%) went to RMA appropriations.59
There are three principal types of federal subsidy embedded in the federal crop insurance program—producer premium subsidies, A&O and CAT LAE expense payments to AIPs, and shared underwriting risk with the AIPs.
However, on a transactional basis, the program costs can be divided into four categories:60
- 1. Delivery costs (A&O and CAT LAE),
- 2. Total indemnities fronted by FCIC,61
- 3. Underwriting gains attributed to AIPs, and
- 4. RMA appropriations.
Premium subsidies are not included in the four categories listed above because they are taken into account in attributing gains/losses between FCIC and AIPs.
External funding sources that potentially contribute funds to the program can be divided into three categories:
- 1. Producer-paid premiums,
- 2. Producer-paid CAT fees, and
- 3. Underwriting losses attributed to AIPs.
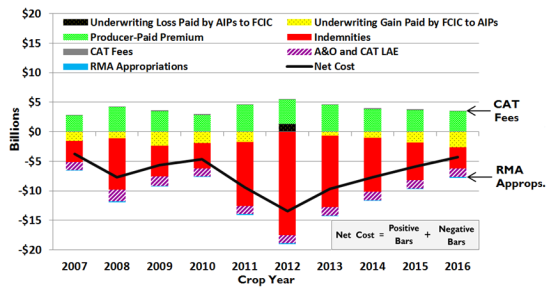
The shared underwriting costs (or gains) vary with the extent of annual losses. In most years, the federal government pays large underwriting costs to the AIPs, but in 2012 the AIPs made a positive underwriting transfer to the federal government (Table A-1). This may be seen in Figure 9, which illustrates the net cost of federal crop insurance to the federal government for crop years 2007-2016 using the four categories of costs and three categories of external funding described above.
In the context of overall funding in crop insurance, RMA appropriations and producer-paid CAT fees are small relative to other factors considered.
|
Figure 9. Net Cost of Federal Crop Insurance to the Government |
 |
|
Source: CRS, using the RMA table Crop Year Government Cost of Federal Crop Insurance Program 2007-2016 as of April 17, 2017, https://www.rma.usda.gov/aboutrma/budget/16cygovcost.pdf. CAT fees and RMA appropriations are from the Budget of the United States Government—Appendix, FY2007-2016, at https://www.gpo.gov. Notes: Years are crop years, except for CAT fees and RMA appropriations, which are on a fiscal year basis. Positive numbers indicate external funding coming into the federal government. Negative numbers indicate costs paid by the federal government. The "Net Cost" line is the result of combining the negative amounts with the positive amounts. FCIC premium subsidies are not included as an individual category because they are taken into account in the calculation of net underwriting gains and losses. CRS could not locate data for certain indirect costs authorized by the Federal Crop Insurance Act, such as data mining and education programs. CAT fees are the thin brown lines above producer-paid premium (green bars). RMA appropriations are the thin blue lines below "A&O and CAT LAE" (purple and white striped bars). |
In Figure 9, the black line represents the net cost of the program to the federal government as calculated by combining the negative bars and the positive bars. External funding sources are shown as positive amounts. These include CAT fees averaging $48 million a year, producer-paid premium averaging approximately $3.8 billion a year, and underwriting losses of $1.3 billion paid by AIPs to FCIC in 2012.
Government costs are shown as negative amounts consisting of delivery costs (A&O and CAT LAE) averaging $1.5 billion a year, indemnities averaging $8.1 billion a year, underwriting gains paid by FCIC to AIPs averaging $1.4 billion a year, and RMA appropriations averaging $75 million a year.
The category "Underwriting Loss Paid by AIPs to FCIC," represented by a black bar with yellow dots in Figure 9, occurs only in crop year 2012. That year the United States experienced a severe and widespread drought in the Midwest.62 Over the remaining nine years, AIPs had net underwriting gains represented by the yellow bars with black dots.
In practice, AIPs collect producer premium and, within a few weeks, transfer the funds to FCIC. FCIC does not pay premium subsidies directly to producers or AIPs. Premium subsidies (FCIC-paid premium) are accounted for in the underwriting gain and loss division between FCIC and AIPs. AIPs each have escrow accounts that are funded by FCIC. Initially, FCIC pays all indemnities through these escrow accounts. Once a month, through an account settlement process, RMA calculates how much of the indemnities paid that month should be attributed to AIPs, accounting for how much of the risk was retained by AIPs and accounting for FCIC-paid premium. Depending on these factors, some months AIPs need to pay FCIC back for part of the indemnities FCIC "fronted" those months.
At the end of the reinsurance year, there is an annual settlement process to calculate all the risk-sharing terms of the SRA (fund allocation, proportional reinsurance or net book quota share, and nonproportional reinsurance) for all crops, by state, to make a final determination of how underwriting gains and losses will be divided.
Premium Subsidies
FCIC premium subsidies (also referred to as FCIC-paid premium) are not shown as a cash-flow category in Figure 9 because they are taken into account in the division of underwriting gains and losses between FCIC and AIPs. For comparison, Figure 10 shows producer-paid premium and FCIC premium subsidies for crop years 2007-2016. Total premium is the sum of producer-paid premium and FCIC premium subsidies.
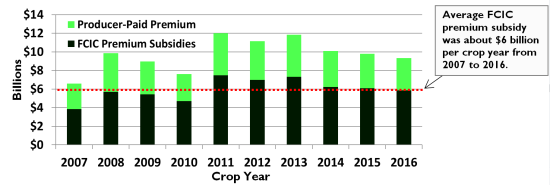
Premiums subsidy rates are statutorily set by the Federal Crop Insurance Act. Premium subsidies have been increased statutorily by Congress five times—first in 1980, then in 1994, 1998, 1999, and 2000. Premium subsidy rates generally decline as coverage rises (deductible decreases), with the exception of the shallow-loss policies (low deductible)—Supplemental Coverage Option (SCO) and Stacked Income Protection Plan (STAX)—which have static premium subsidy rates of 60% and 80%, respectively.63
Subsidy rates for buy-up coverage on yield and revenue policies that offer higher levels of coverage and lower deductibles generally range from 38% to 80%. CAT coverage, the lowest level of coverage for crop losses, has a 100% premium subsidy.
Indemnity (Claim) Payments
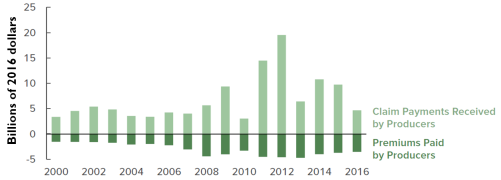
In terms of cash flow (Figure 9), all indemnity payments (also referred to as claim payments) are shown as a cost to FCIC. The division of the indemnity payments between FCIC and AIPs, per the terms of the SRA, is taken into account in the sharing of underwriting gains and losses between FCIC and the AIPs.
From 2000 to 2016, producers received $65 billion more in claim payments than they paid in premiums (Figure 11).64 In other words, during this period an average producer received an average of $2.22 in claim payments for each dollar paid in crop insurance premiums.65 Not every producer experienced a net positive return from purchasing crop insurance, and some received more than the calculated average. RMA data indicate widespread regional variation in benefits under the crop insurance program.66 For example, one study noted that Illinois soybean growers in aggregate had a negative return on crop insurance in 18 out of 26 years from 1989 to 2014.67
Delivery Expenses
Program "delivery" generally refers to marketing policies, processing applications, collecting premiums, and adjusting claims. FCIC subsidizes the AIPs' delivery costs by paying:
- A&O subsidy for policies with buy-up coverage, and
- CAT LAE for policies with CAT-level coverage.
A&O and CAT LAE are not based on the actual expenses of AIPs. Instead, they are calculated as a percentage of premium. They are not, however, taken from total premium. They are paid as a separate government subsidy to AIPs. The SRA sets their amounts as follows:
- A&O equals between 12% and 21.9% of premium, depending on policy type and coverage level. AIPs receive a bonus percentage of A&O, called "snapback," in states with a loss ratio greater than 1.2.68
CAT LAE is fixed at 6% of premium.
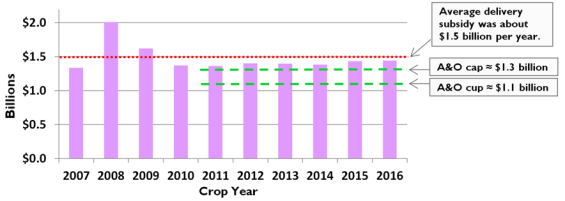
The 2011 SRA established a maximum (cap) for A&O subsidies of approximately $1.3 billion per year and a minimum (cup) of approximately $1.0 billion. As 2011 was the last time the SRA was renegotiated, subsequent SRAs through reinsurance year 2019 have the same A&O cap and cup.69 CAT LAE and A&O subsidies for certain policies are not counted toward the minimum and maximum amounts set for A&O.70 From 2007 to 2016, annual delivery costs (A&O and CAT LAE) averaged about $1.5 billion, which was about 15% of total premium (Figure 12).71
The largest single delivery expense reported by AIPs is compensation to crop insurance agents.72 Crop insurance agents are largely independent agents who sell policies for multiple AIPs. Because RMA determines premium rates, AIPs cannot compete for business based on price. Instead they tend to compete by establishing relationships with agents and on customer service. Thus, it is in an AIP's interest to hire successful agents. This has made the federal crop insurance agent market competitive.
The 2011 and subsequent SRAs set limits on the amount AIPs are allowed to pay agents.73 Specifically, AIPs may not pay more than 80% of A&O and CAT LAE by state as base commission to agents.74 However, an AIP may pay compensation up to 100% of A&O and CAT LAE by state if certain conditions are met.75 There is no limitation on how much any given agent may receive so long as it is within the maximum amount allowable per state.76 In other words, an AIP could pay one agent 80% of the A&O it received in a particular state so long as it did not pay commissions to any other agent.
Underwriting Gains and Losses
Customary insurance vocabulary does not precisely fit the unique characteristics of the federal crop insurance program because of its public-private cost-share structure. In other insurance sectors, the formula generally used to calculate underwriting gains/losses is:
Underwriting Gains/Losses Other Ins. Sectors = Premiums - Indemnities - Expenses
In federal crop insurance, expenses are reimbursed77 through A&O and CAT LAE. Because of this, RMA calculates underwriting gains/losses in the federal crop insurance program without considering expenses.
Underwriting Gains/Losses Federal Crop Insurance = Premiums - Indemnities
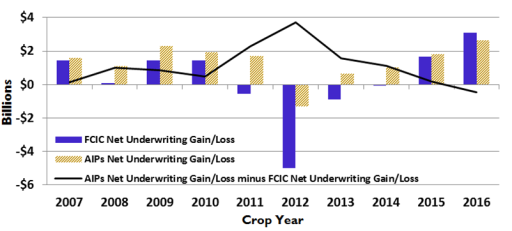
Figure 13 shows the net underwriting gains/losses of FCIC and the AIPs. The striped beige bars represent the AIPs' underwriting gains (positive bars) or losses (negative bars). The solid blue bars represent FCIC's underwriting gains/losses. The black line shows the difference between the net underwriting gains/losses of the AIPs and FCIC—that is, AIPs' net underwriting gains/losses minus FCIC's net underwriting gains/losses. A positive value for the black line indicates that AIPs had a larger share of gains or smaller share of losses relative to taxpayers.
 |
|
Source: CRS using RMA Crop Year Government Cost of the Federal Crop Insurance Program 2007-2016. |
From 2007 to 2016 the program had a net total underwriting gain of almost $16 billion, of which about $2.6 billion (16%) went to FCIC and $13.4 billion (84%) went to AIPs (Figure 13).78 During those years AIPs had an underwriting loss in a single year—2012—whereas FCIC had underwriting losses in 2011, 2012, 2013, and 2014. FCIC outperformed AIPs only in 2016.
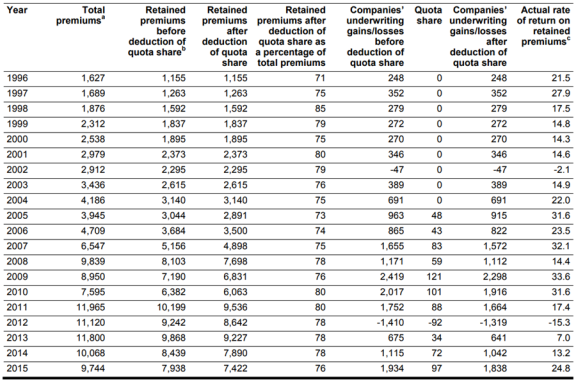
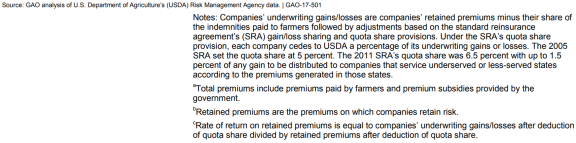
The SRA sets the methodology for dividing underwriting gains and losses between FCIC and the AIPs.79 The 2011 and subsequent SRAs have an implicit 14.5% target rate of return on retained premiums80 to AIPs based on the underwriting gain/loss share structure. Figure D-1 shows the AIPs' rate of return on retained premium from 1996 to 2015.
Conclusion
The federal crop insurance program is a central part of federal support for agriculture. Given the program's significant cost and share of USDA program outlays, it is a frequent target for budgetary savings. Multiple bills introduced in the 115th Congress would modify the main financial components of the program—premium subsidies, the division of underwriting gains and losses between FCIC and AIPs, and A&O and CAT LAE paid to AIPs. As with any large program, especially those with private sector involvement, congressional oversight has a significant role in ensuring that the federal crop insurance program meets its intended policy goals and operates efficiently.
Appendix A. Cost of Federal Crop Insurance to the Government
|
( A ) |
( B ) |
( C = A - B ) |
( D ) |
( E ) |
( F ) |
( G ) |
( H ) |
( I ) |
( J = C - D - E + F - G ) |
( K = J - H + I ) |
|
|
Crop Yeara |
Total Premium |
FCIC Premium Subsidies |
Producer-Paid Premium |
Indem-nities |
UW Gains Paid by FCIC to AIPs |
UW Losses Paid by AIPs to FCIC |
A&O and CAT LAE |
RMA Appro-priations |
CAT Fees |
Total Direct Cost |
Total Net Costb |
|
2007 |
6.573 |
3.828 |
2.745 |
3.551 |
1.575 |
0.000 |
1.335 |
0.077 |
0.047 |
-3.716 |
-3.746 |
|
2008 |
9.867 |
5.696 |
4.171 |
8.691 |
1.096 |
0.000 |
2.011 |
0.076 |
0.043 |
-7.627 |
-7.660 |
|
2009 |
8.961 |
5.431 |
3.530 |
5.231 |
2.299 |
0.000 |
1.621 |
0.077 |
0.042 |
-5.621 |
-5.656 |
|
2010 |
7.607 |
4.715 |
2.892 |
4.258 |
1.918 |
0.000 |
1.371 |
0.080 |
0.064 |
-4.655 |
-4.671 |
|
2011 |
12.012 |
7.478 |
4.534 |
10.879 |
1.705 |
0.000 |
1.363 |
0.079 |
0.058 |
-9.413 |
-9.434 |
|
2012 |
11.152 |
6.992 |
4.160 |
17.490 |
0.000 |
1.316 |
1.405 |
0.075 |
0.060 |
-13.419 |
-13.434 |
|
2013 |
11.836 |
7.308 |
4.528 |
12.107 |
0.644 |
0.000 |
1.398 |
0.069 |
0.053 |
-9.621 |
-9.637 |
|
2014 |
10.099 |
6.223 |
3.876 |
9.141 |
1.040 |
0.000 |
1.386 |
0.072 |
0.053 |
-7.691 |
-7.710 |
|
2015 |
9.802 |
6.101 |
3.701 |
6.334 |
1.820 |
0.000 |
1.434 |
0.075 |
0.034 |
-5.887 |
-5.928 |
|
2016 |
9.335 |
5.864 |
3.471 |
3.595 |
2.633 |
0.000 |
1.443 |
0.075 |
0.029 |
-4.200 |
-4.246 |
|
Total |
97.244 |
59.636 |
37.608 |
81.277 |
14.730 |
1.316 |
14.767 |
0.754 |
0.483 |
-71.850 |
-72.121 |
|
Avg. |
9.724 |
5.964 |
3.761 |
8.128 |
1.473 |
0.132 |
1.477 |
0.075 |
0.048 |
-7.185 |
-7.212 |
Source: CRS using RMA "Direct Costs of Federal Crop Insurance Program" chart for columns A, B, D, E, F, and G at https://www.rma.usda.gov/aboutrma/budget/16cygovcost.pdf. Column H is from RMA fiscal year appropriations. Column I is from USDA Fiscal Year Budget Explanatory Notes.
Notes: FCIC = Federal Crop Insurance Corporation; UW = Underwriting; AIPs = Approved Insurance Providers; CAT = catastrophic coverage; LAE = loss adjustment expenses. Column D shows indemnities, which are accounted for as a cost to FCIC. Column E and F show underwriting gains and losses between FCIC and AIPs. Column G shows A&O and CAT LAE delivery expenses paid by FCIC to AIPs. Column H shows RMA fiscal year appropriations (largely salaries and expenses). Column I shows CAT fees by fiscal year. Total direct costs and total net costs are presented as negative numbers because they are funds leaving the federal government. Total direct cost uses the costs RMA characterizes as "direct." Total net cost uses "direct" costs as well as RMA appropriations and CAT fees.
a. Columns A through G are by crop year. Columns H and I are by fiscal year.
b. Total net costs do not account for all indirect costs. CRS could not locate data for certain indirect costs authorized by the Federal Crop Insurance Act, such as data mining, education programs, cooperative agreements, expert reviews, and reimbursements for products submitted by private submitters under Section 508(h) of the Federal Crop Insurance Act.
|
Crop Year |
( L = F - E - G ) |
( M = C - D + I ) |
( N = -H ) |
( O = L + M + H ) ( O = K ) |
( P = L / O *100 ) |
( Q = M / O *100 ) |
( R = H / O * 100 ) |
||
|
FCIC Spending on AIPs |
FCIC Spending on Producers |
RMA Appro-priations0 |
Total Net Cost |
FCIC Spending on AIPs as % of Total Net Cost |
FCIC Spending on Producers as % of Total Net Cost |
RMA Appropriations as % of Total Net Cost |
|||
|
2007 |
-2.910 |
-0.759 |
-0.0767 |
-3.746 |
79.31% |
20.69% |
2.05% |
||
|
2008 |
-3.107 |
-4.477 |
-0.0761 |
-7.660 |
40.97% |
59.03% |
0.99% |
||
|
2009 |
-3.920 |
-1.659 |
-0.0772 |
-5.656 |
70.26% |
29.74% |
1.36% |
||
|
2010 |
-3.289 |
-1.302 |
-0.0803 |
-4.671 |
71.64% |
28.36% |
1.72% |
||
|
2011 |
-3.068 |
-6.287 |
-0.0788 |
-9.434 |
32.80% |
67.20% |
0.84% |
||
|
2012 |
-0.089 |
-13.270 |
-0.0749 |
-13.434 |
0.67% |
99.33% |
0.56% |
||
|
2013 |
-2.042 |
-7.526 |
-0.0691 |
-9.637 |
21.34% |
78.66% |
0.72% |
||
|
2014 |
-2.426 |
-5.212 |
-0.0715 |
-7.710 |
31.76% |
68.24% |
0.93% |
||
|
2015 |
-3.254 |
-2.599 |
-0.0748 |
-5.928 |
55.60% |
44.40% |
1.26% |
||
|
2016 |
-4.076 |
-0.095 |
-0.0748 |
-4.246 |
97.72% |
2.28% |
1.76% |
||
|
Total |
-28.181 |
-43.186 |
-0.7542 |
-72.121 |
Avg. 39.07% |
59.88% |
1.05% |
||
Source: Compiled by CRS based on data from RMA and other sources.
Notes: FCIC = Federal Crop Insurance Corporation; AIPs = Approved Insurance Providers. Columns L, M, N, and O refer to columns C, D, E, F, G, H, I, and K in Table A-1. Consistent with Figure 9, FCIC spending is presented as negative numbers. Column N = Risk Management Agency (RMA) Appropriations, which are largely RMA salaries and expenses.
Appendix B. Crop Insurance Policy Types and Cycle
The top three policies by liability in crop year 2017 were (1) Revenue Protection, (2) Actual Production History (APH), and (3) Yield Protection (YP). Together these three policies accounted for approximately 88% of total liabilities in the federal crop insurance program.
Individual-Yield Policy Type: APH, YP, and Others
Individual yield policies insure an individual producer's historical yield at a specific price, which RMA sets every spring prior to planting based on projected market prices. RMA offers two main types of yield policies: APH policies and YP policies. They are similar but use different methodologies to determine projected prices.
Both APH and YP policies use a producer's historical yield guarantee, the APH. RMA determines a producer's APH using records submitted by the producer. With a few exceptions, RMA requires a minimum of four years of records and will accept records for up to 10 years. Acceptable records include sale receipts and storage records. For most crops, the APH is a simple average of the historical yields.
If producers do not have four years of records, RMA substitutes a transition or "T yield" for the missing years. T yields are based on the 10-year average county yield. Growers with no records are assigned 65% of the T yield as their APH yield. If producers provide acceptable records for less than four years, they can receive between 80% and 100% of the T yield for the missing years depending on how many years they provide.
For APH policies, RMA determines the projected price using a variety of tools depending on the crop. For YP policies, RMA determines the projected price from commodity exchanges using the methodology published in the applicable Commodity Exchange Price Provisions (CEPPs).81 For corn and soybeans, the projected price is the average Chicago Mercantile Exchange (CME, formerly Chicago Board of Trade) daily price in February for the December-futures contract of the same year for corn and the November-futures contract for soybeans (Figure B-1).
|
Figure B-1. Yield Protection Projected Price for Corn and Soybeans |
 |
|
Source: CRS. |
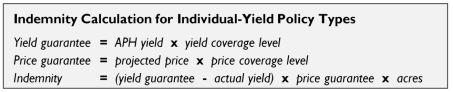
For both APH and YP policies, producers select coverage levels between 50% and 75% (up to 85% in some areas) of their APH yields and between 55% and 100% of the projected prices. Indemnities are triggered only if actual yields fall below the yield guarantee. The higher the coverage level, the lower the premium subsidy rate. RMA offers CAT coverage to individual producers at 50% of the APH yield and 55% of the projected price for an administrative fee of $300 per crop per county.
Yield and price guarantees equal the selected coverage levels times the APH yield and projected price, respectively. An indemnity is triggered only if actual yields fall below the yield guarantee. Indemnities equal the difference between the yield guarantee and the actual yield times the price guarantee times the number of acres insured.82
Individual-Revenue Policy Type: Revenue Protection and Others
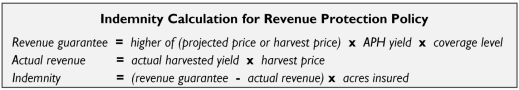
RMA offers several revenue policies. The individual Revenue Protection policy (RP) is the most prevalent revenue product. RP policies insure against loss of revenue (equal to production times price). These policies use an individual producer's APH yield and the higher of either a "projected price" or "harvest price" (as defined by the applicable CEPPs)83 to set a revenue guarantee.
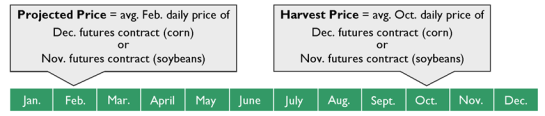
In the case of corn and soybeans, the projected price is the average CME daily price in February for the December-futures contract of the same year for corn and the November-futures contract for soybeans (Figure B-2). The harvest price is the average CME daily price in October for the December-futures contract for corn of the same year and the November-futures contract for soybeans.
|
Figure B-2. Revenue Protection Timeline of Projected and Harvest Prices for Corn and Soybeans |
 |
|
Source: CRS. |
For RP policies, indemnities are triggered if an individual producer's "actual" revenue is lower than the revenue guarantee. The revenue guarantee is the product of the APH yield guarantee and the projected or harvest price (whichever is higher), times the level of guarantee selected (between 65% and 85%). "Actual" revenue is the product of the producer's actual yield and the harvest price. It does not use the actual price the producer receives for the crop. RMA does not offer CAT coverage for RP policies.84
The default option for RP described above takes the higher of the projected price or harvest price. RMA also offers a less expensive variation of this policy called RP with Harvest Price Exclusion, which uses only the projected price.85
Other Policies
In addition to individual revenue and yield policies, the federal crop insurance program offers several other types of policies, such as whole-farm revenue protection and margin insurance products.86 These policies made up about 11.8% of liabilities in the federal crop insurance book in crop year 2017.
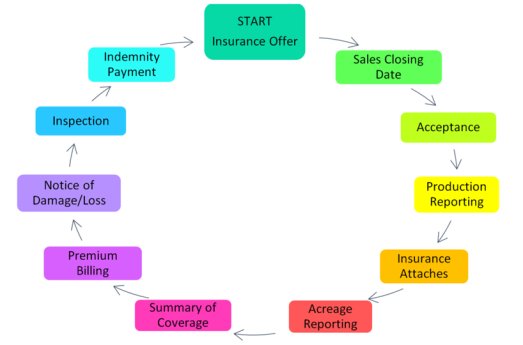
Federal Crop Insurance Cycle
Federal crop insurance policies follow a cycle that differs from policies in other sectors. Unlike many other insurance sectors that charge premiums upfront, federal crop insurance premiums are billed toward the end the insurance cycle (Figure B-3).
 |
|
Source: CRS using RMA descriptions of the federal crop insurance cycle at https://www.rma.usda.gov/policies/cycle/insurance_cycle.html, and ARMtech Insurance Services, Crop Insurance Cycle, http://www.armt.com/Page.aspx?MID=2&SID=6. |
Appendix C. List of Approved Insurance Providers
|
ACE American Insurance Company (Rain and Hail, LLC)a |
|
American Agri-Business Insurance Company (ARMtech Insurance Services, Inc.) |
|
American Agricultural Insurance Company (American Farm Bureau Insurance Services, Inc.) |
|
CGB Insurance Company (CGB Diversified Services) |
|
COUNTRY Mutual Insurance Company |
|
Farmers Mutual Hail Insurance Company of Iowa |
|
Great American Insurance Company |
|
GuideOne Mutual Insurance Company (Crop Pro Insurance Services, LLC) |
|
Hudson Insurance Company |
|
NAU Country Insurance Companyb |
|
Producers Agriculture Insurance Company (Pro Ag Management, Inc.) |
|
Rural Community Insurance Companyc |
|
Stratford Insurance Company (Crop Risk Services Inc.) |
|
Technology Insurance Company, Inc. (AmTrust Agriculture Insurance Services) |
|
XL Reinsurance America, Inc. (Global Ag Insurance Services, LLC) |
Source: The AIPs for 2018 reinsurance year are from RMA Crop Insurance Providers List for 2018 at https://www3.rma.usda.gov/tools/agents/companies/indexCI.cfm.
Notes: In reinsurance year 2016, the three largest AIPs by direct written premium were ACE American Insurance Company (Rain and Hail, LLC), Rural Community Insurance Services, and NAU Country Insurance Company. Together they wrote about 47% of all federal crop insurance premiums before reinsurance. See Insurance Information Institute, "Top 10 Writers of Multiple Peril Crop Insurance by Direct Premiums Written, 2016," https://www.iii.org/article/background-on-crop-insurance.
a. In reinsurance year 2016, ACE American Insurance Company wrote $1.73 billion in direct written premium before reinsurance, or approximately 18.6% of all federal crop insurance premiums that year.
b. In reinsurance year 2016, NAU Country Insurance Company wrote $1.12 billion in direct written premium before reinsurance, or approximately 12.1% of all federal crop insurance premiums that year.
c. In reinsurance year 2016, Rural Community Insurance Services wrote $1.50 billion in direct written premium before reinsurance, or approximately 16.2% of all federal crop insurance premiums that year.
Appendix D. Rate of Return on Premium
|
Figure D-1. Participating Insurance Companies' Retained Premiums, the Government's Quota Share, and Companies' Underwriting Gains/Losses 1996-2015 |
 |
Author Contact Information
Acknowledgments
Randy Schnepf was instrumental in refining the structure and content of this report. His contribution was invaluable.
Footnotes
| 1. |
See Table A-2 for underlying calculations and data sources. Some tables and figures in this report use constant dollars that are adjusted for inflation to more accurately compare dollar values from one period to another. However, most of the tables and figures are not in constant dollars and do not account for inflation. If a table or figure does not indicate that dollars are adjusted to the value of a particular year, then those dollars are not constant. |
| 2. |
The terms of the financial agreement between the Federal Crop Insurance Corporation and private insurance companies are set out in a mutually negotiated document referred to as the Standard Reinsurance Agreement (SRA). |
| 3. |
This is the time frame that was available on April 19, 2018, on the RMA website at https://www.rma.usda.gov/aboutrma/budget/16cygovcost.pdf. |
| 4. |
RMA, "Crop Year Government Cost of Federal Crop Insurance Program—Direct Costs," https://www.rma.usda.gov/aboutrma/budget/16cygovcost.pdf. "Federal direct costs" for crop insurance do not include appropriations for RMA, which averaged about $75 million per year from FY2007 to FY2016, or catastrophic (CAT) level policy fees paid by producers, which averaged about $48 million per year from FY2007 to FY2016. |
| 5. |
CBO, Baseline Projections, June 29, 2017. |
| 6. |
See CRS In Focus IF10783, Farm Bill Primer: Budget Issues for more on mandatory versus discretionary funding. |
| 7. |
Programs funded by the 2014 farm bill have different expiration dates depending on whether they use fiscal years or crop years. Programs using fiscal years are generally scheduled to expire on September 30, 2018. Programs using crop years are to expire at the end of the 2018 crop year. Specific crop year dates vary by crop and by the location of the crop. For more information on the expiration of farm bills, see CRS Report R42442, Expiration and Extension of the 2008 Farm Bill. |
| 8. |
Several bills have been introduced in the 115th Congress that propose changes to the federal crop insurance program, including H.R. 2, H.R. 2332, H.R. 3698, H.R. 4305, S. 2096, S. 1773, H.R. 4425, H.R. 5203, S. 2512, S. 2713, H.R. 5485, and S. 2667. |
| 9. |
Albert Gain Black, "Toward Farm Security," USDA Bureau of Agricultural Economics, Miscellaneous Publication No. 308 (1938), p. 13. See also Desmond Keith Derrington, "Insurance as a Cornerstone of Civilisation—And Another Cornerstone," 7 Corp. & Bus. L.J. 1 (1994). |
| 10. |
Lysa Porth, Wenjun Zhu, and Ken Seng Tan, "A Credibility-Based Erlang Mixture Model for Pricing Crop Reinsurance," Agricultural Finance Review, vol. 74, no. 2 (2014), pp.162-187. |
| 11. |
Henry A. Wallace, "Report and Recommendations of the President's Committee on Crop Insurance," December 1936, p. 4. |
| 12. |
Joy Harwood et al., "Income Risk Management in Agriculture," USDA and Organization of Economically Countries (OECD), May 2000, p. 94, http://www.oecd.org/agriculture/agricultural-policies/42750750.pdf. |
| 13. |
Arthur Charpentier, "Insurability of Climate Risks," The Geneva Papers, vol. 33, no. 1 (2008), pp. 91-109. https://link.springer.com/article/10.1057/palgrave.gpp.2510155. See also J. Antón et al., "A Comparative Study of Risk Management in Agriculture Under Climate Change," OECD, http://dx.doi.org/10.1787/5k94d6fx5bd8-en. |
| 14. |
William Tomeck and Kenneth Robinson, Agricultural Product Prices, 4th ed. (Ithaca, NY: Cornell University Press, 2003), pp. 2, 4. |
| 15. |
Harwood et al., "Income Risk Management in Agriculture." |
| 16. |
Harwood et al., "Income Risk Management in Agriculture." |
| 17. |
For example, hail tends not to be geographically correlated, meaning that a loss on one farm does not imply losses throughout the surrounding area. Private insurers in the United States have been successful with rating and managing risks associated with crop policies that covered only hail and fire. Those "crop hail" policies are not federally subsidized and are entirely regulated by the state departments of insurance. Federal crop insurance policies also cover hail and fire losses stemming from natural causes. Some producers choose to buy separate hail and fire insurance to supplement federal policies. See National Association of Insurance Commissioners, "Federal Crop Insurance Handbook: A Guide for Insurance Regulators," May 2013, http://www.naic.org/store/free/CRO-PB-13.pdf. See also Harwood et al., "Income Risk Management in Agriculture." |
| 18. |
Black, "Toward Farm Security." |
| 19. |
Wallace, "Report and Recommendations of the President's Committee on Crop Insurance." |
| 20. |
Black, "Toward Farm Security." |
| 21. |
Lysa Porth and Ken Seng Tan, "Agricultural Insurance—More Room to Grow?," The Actuary, vol. 12, no. 2 (April/May 2015), p. 37. |
| 22. |
Harwood et al., "Income Risk Management in Agriculture." |
| 23. |
Porth and Seng Tan, "Agricultural Insurance." |
| 24. |
Black, "Toward Farm Security." |
| 25. |
Black, "Toward Farm Security." |
| 26. |
Prolonged drought in the Midwest and West, combined with a lack of structural, cultural, and vegetative water conservation resulted in severe wind erosion in the early 1930s. These conditions persisted for a number of years, resulting in severe dust storms, millions of tons of topsoil loss, and prolonged ecological damage that made national headlines. The term dust bowl is frequently used to describe this condition and time frame, as well as the impacted areas of Colorado, Kansas, New Mexico, Oklahoma, and Texas. For additional information, see Douglas Helms, "Readings in the History of the Soil Conservation Service," USDA, p. 142, https://www.nrcs.usda.gov/Internet/FSE_DOCUMENTS/stelprdb1043484.pdf. |
| 27. |
Wallace, "Report and Recommendations of the President's Committee on Crop Insurance." |
| 28. |
Joseph W. Glauber, "The Growth of the Federal Crop Insurance Program, 1990-2011," American Journal of Agricultural Economics, vol. 95, no. 2 (January 1, 2013), pp. 482-488, https://doi.org/10.1093/ajae/aas091. |
| 29. |
Jeffrey L. Miller, "A New Role for Federal Crop Insurance," Federal Reserve Bank of Chicago, September/October 1981, p. 19, https://www.chicagofed.org/~/media/ ... /1981/ep-sep-oct1981-part3-miller-pdf. |
| 30. |
RMA, "The Risk Management Safety Net: Market Penetration and Market Potential, Analysis of the Federal Crop Insurance Portfolio," September 2017, p. 1. |
| 31. |
Richard M. Todd, "Expanded Federal Crop Insurance: A Better Way for Taxpayers to Share Farmers' Risks," Federal Reserve Bank of Minneapolis, Quarterly Review, Winter 1982, pp. 10, 20. |
| 32. |
RMA, "The Risk Management Safety Net." |
| 33. |
CBO, Options to Reduce the Budgetary Costs of the Federal Crop Insurance Program, December 2017, p. 1, https://www.cbo.gov/system/files/115th-congress-2017-2018/reports/53375-federalcropinsuranceprogram.pdf. |
| 34. |
CBO, Options to Reduce the Budgetary Costs of the Federal Crop Insurance Program, p.11. |
| 35. |
See, for example, Anne Weir and Craig Cox, "Crop Insurance: An Annual Disaster," Environmental Working Group, November 2015, p. 1, concluding that "crop insurance actually costs billions of dollars more than disaster payments." |
| 36. |
CRS In Focus IF10829, Agriculture Funding in the Bipartisan Budget Act of 2018. |
| 37. |
Indemnity payments are losses paid by insurers to insureds. Claims are requests made by insureds to insurers for payment of losses. Indemnity payments, indemnities, and claim payments are used interchangeably in this report. |
| 38. |
RMA, "The Risk Management Safety Net." |
| 39. |
RMA, "The Risk Management Safety Net." |
| 40. |
CBO, Options to Reduce the Budgetary Costs of the Federal Crop Insurance Program. |
| 41. |
Basic provisions and crop provisions are available at https://www.rma.usda.gov/policies/. Special provisions are available in RMA's Actuarial Information Browser at https://webapp.rma.usda.gov/apps/actuarialinformationbrowser/. |
| 42. |
For more information, see RMA, "2018 Crop Policies and Pilots," https://www.rma.usda.gov/policies/2018policy.html. |
| 43. |
RMA, "Common Crop Insurance Policy Basic Provisions," §12, https://www.rma.usda.gov/policies/2018/18-br.pdf. |
| 44. |
For additional information, see CRS Report R42459, Conservation Compliance and U.S. Farm Policy. |
| 45. |
Native sod is defined in Section 12020(a)(o)(1) of the 2008 farm bill (P.L. 110-246). |
| 46. |
The Prairie Pothole National Priority Area consists of specific counties within Iowa, Minnesota, Montana, North Dakota, and South Dakota. For more information, see RMA, "Prairie Pothole National Priority Area," https://www.rma.usda.gov/data/pothole/. |
| 47. |
CRS Report RL34557, Conservation Provisions of the 2008 Farm Bill (available to congressional clients from the author upon request). |
| 48. |
CRS Report R43504, Conservation Provisions in the 2014 Farm Bill (P.L. 113-79). |
| 49. |
P.L. 113-79, §2611. |
| 50. |
P.L. 113-79, §1211. |
| 51. |
CRS Report R43504, Conservation Provisions in the 2014 Farm Bill (P.L. 113-79). |
| 52. |
CRS Report R44739, U.S. Farm Program Eligibility and Payment Limits. |
| 53. |
As of the 2018 reinsurance year, there were 15 AIPs. See Table C-1 for a list of the 2018 reinsurance year AIPs. In 2016, three AIPs sold 47% of total premium. |
| 54. |
A&O and CAT LAE are compensation AIPs receive from FCIC for delivering policies. They are calculated as a percentage of total annual premium. |
| 55. |
See columns (A), (B), and (C) of Table A-1. |
| 56. |
7 U.S.C. §1508(k)(8)(F), added by the 2014 farm bill (P.L. 113-79). |
| 57. |
7 U.S.C. §1516 (2). The federal crop insurance program mandatory funding authorization is referenced in the Consolidated Appropriations Act, 2017, P.L. 115-31. |
| 58. |
RMA Direct Costs of Federal Crop Insurance, Crop Years 2007-2016, as of 04/17/2017, https://www.rma.usda.gov/aboutrma/budget/16cygovcost.pdf. |
| 59. |
See Table A-2 for calculations. RMA appropriations are largely salaries and expenses for RMA employees. |
| 60. |
CRS could not locate data for all indirect costs authorized by the Federal Crop Insurance Act, such as data mining, education programs, cooperative agreements, and Section 508(h) product reimbursements, among others. |
| 61. |
FCIC pays all indemnities up front on behalf of AIPs through escrow accounts. Monthly accounting and annual accounting processes calculate how much of the indemnities are attributed to AIPs. AIPs pay FCIC back for indemnities that are attributed to the AIPs on a monthly and annual basis. |
| 62. |
May to August 2012 was "the driest four months the United States has experienced since 1895." Jane J. Lee, National Geographic News, "Finding the Reasons for the 2012 Drought," April 12, 2013. |
| 63. |
STAX and SCO policies cover shallow losses. STAX is available only for upland cotton. SCO is available for a variety of crops in conjunction with an underlying policy. See CRS Report R43494, Crop Insurance Provisions in the 2014 Farm Bill (P.L. 113-79). |
| 64. |
Two studies that have looked at the difference in how much producers pay in premium compared to how much they receive in indemnity payments are (1) CBO, Options to Reduce the Budgetary Costs of the Federal Crop Insurance Program, p. 13; and (2) Bruce A. Babcock, "Crop Insurance: A Lottery That's a Sure Bet," Environmental Working Group, February 2016. |
| 65. |
CBO, Options to Reduce the Budgetary Costs of the Federal Crop Insurance Program. |
| 66. |
See RMA national maps for the annual distribution of county-level indemnity payments at https://www.rma.usda.gov/data/indemnity/index.html. |
| 67. |
Babcock, "Crop Insurance." |
| 68. |
As used here, loss ratio is the result of dividing indemnities by premium. |
| 69. |
The 2018 SRA, Section III, subsections (a)(2)(F) and (G), provide formulas for the A&O minimum and maximum amounts and detail which policies count toward the minimum and maximum A&O amounts. See pp. 22-23 at https://www.rma.usda.gov/pubs/ra/sraarchives/18sra.pdf. CRS estimated the cup and cap A&O amounts by applying the 2008 total delivery subsidies in the formulas for the cup and cap. |
| 70. |
See 2018 SRA Section III, subsections (a)(2)(C), (D), and (E), p. 22. |
| 71. |
See Table A-1. |
| 72. |
Joseph W. Glauber, "Crop Insurance and Private Sector Delivery: Reassessing the Public-Private Partnership," Taxpayers for Common Sense, December 2016, p. 7, citing Grant Thornton, LLP, "Federal Crop Insurance Program: Profitability and Effectiveness Analysis, 2013 Update," 2014. |
| 73. |
Section III(a)(4) of the 2011 and subsequent SRAs set limitations on compensation that AIPs may pay to persons involved in the direct sale and service of eligible crop insurance contracts. |
| 74. |
See the RMA Standard Reinsurance Agreement Fact Sheet at https://www.rma.usda.gov/news/2010/06/610srafactsheet.pdf. |
| 75. |
Section III(a)(4)(C) of the 2011 and subsequent SRAs. |
| 76. |
RMA, "Frequently Asked Questions: Agent Compensation—Schemes or Devices," https://www.rma.usda.gov/help/faq/agentcomp.html. |
| 77. |
National Crop Insurance Services maintains that A&O and CAT LAE do not cover all AIP expenses. See Grant Thornton, "Federal Crop Insurance Program: Profitability and Effectiveness Analysis, 2016." |
| 78. |
See Table A-1. Net Total UW Gain/Loss = Total (A) - Total (D). FCIC UW Gain/Loss = [Total (A) - Total (D) - Total (E) + Total (F)]. AIPs UW Gain/Loss = [Total (E) - Total (F)]. |
| 79. |
SRA divides underwriting gains/losses between FCIC and AIPs using three mechanisms: (1) fund allocation, (2) nonproportional reinsurance, and (3) net book quota share. The division of underwriting gains/losses is beyond the scope of this report. |
| 80. |
AIPs' rate of return on retained premiums is their underwriting gains divided by the premiums that they retain under the SRA. A target rate of return is not a guaranteed rate of return. For more information, see U.S. Government Accountability Office, Opportunities Exist to Improve Program Delivery and Reduce Costs, GAO-17-501, July 2017, p. 4. See also RMA Standard Reinsurance Agreement Final Draft Fact Sheet. |
| 81. |
CEPPs set price discovery period and methodology. See RMA site at https://www.rma.usda.gov/policies/cepp.html. |
| 82. |
RMA, "Policies," https://www.rma.usda.gov/policies/. See also Iowa State University Extension Ag Decision Maker, "Yield Protection Crop Insurance," File A1-52, https://www.extension.iastate.edu/agdm/crops/html/a1-52.html. |
| 83. |
CEPPs for eligible crops include the price discovery period for projected prices (and harvest prices in the case of an RP policy) and the price formulas. See RMA, "Commodity Exchange Price Provisions (CEPP)," https://www.rma.usda.gov/policies/cepp.html. |
| 84. |
RMA, "Policies." See also, Iowa State University Extension Ag Decision Maker, "Revenue Protection Crop Insurance," File A1-54, https://www.extension.iastate.edu/agdm/crops/html/a1-54.html. |
| 85. |
There have been a few bills introduced in the 115th Congress to remove the premium subsidy for RP and only provide premium subsidies for RP with Harvest Price Exclusion—for example, the Harvest Price Subsidy Prohibition Act (S. 2096 and H.R. 4305). |
| 86. |
For information on the types of federal crop insurance policies offered and crops covered, see the "Crop Policies and Pilots" page on the RMA website at https://www.rma.usda.gov/policies/2017policy.html. |