Retaliatory Tariffs and U.S. Agriculture
Certain foreign nations have targeted U.S. food and agricultural products with retaliatory tariffs since early 2018 in response to U.S. Section 232 tariffs on steel and aluminum imports and Section 301 tariffs levied on U.S. imports from China. Retaliatory tariffs have made imports of U.S. agricultural products relatively more expensive compared to similar products from competitor nations. In the short run, U.S. shipments of products to countries with retaliatory tariffs have declined, reducing overall global demand for affected U.S. agricultural products and driving down the prices of U.S. agricultural commodities. Depending on the length and depth of the tariffs and the range of products affected, some experts caution that the long-run trade impacts could inflict further harm as U.S. competitor countries have an incentive to expand their agricultural production.
In response to U.S. Section 232 and Section 301 actions, China levied retaliatory tariffs on almost all U.S. agricultural products, ranging from 5% to 50%. In response to U.S. Section 232 tariffs, Canada, Mexico, the European Union (EU), and Turkey retaliated with tariffs during the summer of 2018 on U.S. fruit, nuts, prepared vegetables and meats, pork, cheese, breakfast cereal, fruit juices, and whiskey. India implemented retaliatory tariffs on certain U.S. products after a Presidential Proclamation removed India from the U.S. Generalized System of Preferences program in May 2019. Canada and Mexico levied retaliatory tariffs in mid-2018, but these tariffs were removed in May 2019 after the Trump Administration announced an agreement with Canada and Mexico to remove the Section 232 tariffs on imports from both countries to facilitate ratification of the U.S.-Mexico-Canada Agreement—a proposed regional free trade agreement that is meant to supersede the North American Free Trade Agreement (NAFTA).
U.S. Agricultural Exports to China, 2014-2018
In Nominal Billions of U.S. Dollars
/
Source: U.S. Census Bureau trade data, accessed July 2019.
Note: Data are in calendar years, January to December.
The total value of exports of U.S. food and agricultural products levied retaliatory tariffs in 2018 was $22 billion, down 27% from $30 billion in 2017. China accounted for about 80% of the total affected trade in both years. Despite the retaliatory tariffs, U.S. agricultural exports rose in 2018 to $140 billion from $138 billion in 2017, partly due to higher imports during the months leading up to the retaliatory tariffs and increased exports to other nonretaliating countries. With the continuation of retaliatory tariffs, U.S. Department of Agriculture (USDA) projects U.S. agricultural exports to decline about 4% in 2019.
In the short run, retaliatory tariffs contributed to declining prices for certain U.S. agricultural commodities and reduced exports, particularly for soybeans. Declining prices and exports sales combined with rising input and farm machinery costs contributed to a 16% decrease in U.S. net farm income in 2018, compared with 2017. China’s soybean imports are expected to resume growing over the next decade, but a USDA study expects the volume traded to be less than previously anticipated. Because of the retaliatory tariffs on U.S. soybeans, USDA projects that Brazil will account for two-thirds of the global growth in soybean exports to China. The United States accounted for 40% of China’s total soybean imports in 2016 and 35% in 2017, compared with Brazil’s 46% in 2016 and 53% in 2017. In 2018, the U.S. share of China’s soybean import market dropped to 19% and Brazil’s share was up at 76%.
Chinese Imports of Russian Agricultural Products, 2016-2018
In Nominal Millions of U.S. Dollars
/
Source: China Customs Statistics accessed via Global Trade Atlas, July 2019.
Note: Other animal prods = Other animal products.
To help alleviate the financial loss incurred by U.S. farmers due to retaliatory tariffs, USDA announced $12 billion in financial assistance in 2018—referred to as a trade aid package—for certain U.S. agricultural commodities using Section 5 of the Commodity Credit Corporation (CCC) Charter Act (15 U.S.C. 714c). In 2019, USDA announced a second trade-aid package of $16 billion. Increased trade aid to U.S. farmers has generated questions from some World Trade Organization (WTO) members about whether the trade-aid package may violate U.S. WTO commitments.
While trade-aid packages may provide short-term financial assistance, some studies and critics of the President’s actions caution that the long-term consequences of the retaliatory tariffs may present more challenges. Even as China has raised tariffs on U.S. imports, it has improved access to its markets for other exporting countries. Brazil, Russia, and other countries are expanding their agricultural production to meet China’s import demand. For example, Russia’s investments during the past two decades have resulted in agricultural productivity growth ranging from 25% to 75%, with higher productivity growth along its southern region. Although still at relatively modest levels, China’s total food and agricultural imports from Russia increased 61% between 2017 and 2018.
The continuation of trade disputes and retaliatory tariffs may be of interest to Congress for the following reasons. Trade disputes have disrupted global markets and increased uncertainty in the farm input and output sectors. They may add to production costs, and they have dampened exports, impacted farm income, and triggered additional federal assistance for the farm sector. In the short run, there could be some transient benefits associated with various aspects of the agricultural sector. In the long run, other countries may expand agricultural production, potentially displacing U.S. agricultural exports to become larger food and agricultural suppliers to China.
Retaliatory Tariffs and U.S. Agriculture
Jump to Main Text of Report
Contents
- Introduction
- Report Objectives
- Retaliatory Tariffs on U.S. Agricultural Exports
- Chinese Retaliatory Tariffs
- Retaliatory Tariffs by Canada and Mexico
- Retaliatory Tariffs by the EU, Turkey, and India
- U.S. Agricultural Trade Affected by Tariff Hikes
- U.S. Agricultural Exports to Retaliating Countries
- U.S. Exports Under Chinese Retaliatory Tariffs
- Key Competitors for China's Agricultural Market
- China's Total Annual Agricultural Imports
- China's Imports of Soybeans
- China's Imports of Cotton
- China's Imports of Wheat
- China's Imports of Sorghum
- China's Imports of Pork and Pork Products
- China's Imports of Dairy Products
- China's Imports of Hides and Skins
- Retaliatory Partner Imports of Other Agricultural Products
- Economic Impact of Retaliatory Tariffs
- Short-Run Impacts
- Potential Long-Run Implications
- Estimated Economic Impacts
- Commodity Level
- State Level
- National-Level Effects of Retaliatory Tariffs
- Global-Level Effects
- Some Possible Benefits to U.S. Agriculture
- U.S. Stakeholder Views on Retaliatory Tariffs
- Issues for Congress
Figures
- Figure 1. Imports of U.S. Agricultural Products Affected by Retaliatory Tariffs
- Figure 2. EU and Turkey Imports of U.S. Products Subject To Retaliatory Tariffs
- Figure 3. U.S. Agricultural Exports to China, 2014 to 2018
- Figure 4. U.S. and Brazilian Soybean Free on Board (FOB) Prices
- Figure 5. China's Imports of Agricultural Products, 2014 to 2018
- Figure 6. China's Monthly Imports of Soybeans
- Figure 7. China's Monthly Imports of Cotton
- Figure 8. China's Monthly Wheat Imports
- Figure 9. China's Monthly Sorghum Imports
- Figure 10. China's Monthly Imports of U.S. Pork
- Figure 11. China's Monthly Imports of Dairy Products
- Figure 12. China's Monthly Imports of Hides and Skins
- Figure 13. U.S. Agricultural Exports to China, January to April
- Figure 14. U.S. Soybean Farm Prices
- Figure 15. China's Imports of Russian Agricultural Products
Tables
- Table 1. Comparison of Retaliatory Tariff Hikes on U.S. Agricultural Products: September 2018 versus June 2019
- Table 2. U.S. Agricultural Exports to Retaliating and Nonretaliating Countries
- Table 3. Selected U.S. Agricultural Exports to China, 2014-2018
- Table A-1. Summary of China's Retaliatory Tariffs on U.S. Agricultural Imports
Appendixes
Summary
Certain foreign nations have targeted U.S. food and agricultural products with retaliatory tariffs since early 2018 in response to U.S. Section 232 tariffs on steel and aluminum imports and Section 301 tariffs levied on U.S. imports from China. Retaliatory tariffs have made imports of U.S. agricultural products relatively more expensive compared to similar products from competitor nations. In the short run, U.S. shipments of products to countries with retaliatory tariffs have declined, reducing overall global demand for affected U.S. agricultural products and driving down the prices of U.S. agricultural commodities. Depending on the length and depth of the tariffs and the range of products affected, some experts caution that the long-run trade impacts could inflict further harm as U.S. competitor countries have an incentive to expand their agricultural production.
In response to U.S. Section 232 and Section 301 actions, China levied retaliatory tariffs on almost all U.S. agricultural products, ranging from 5% to 50%. In response to U.S. Section 232 tariffs, Canada, Mexico, the European Union (EU), and Turkey retaliated with tariffs during the summer of 2018 on U.S. fruit, nuts, prepared vegetables and meats, pork, cheese, breakfast cereal, fruit juices, and whiskey. India implemented retaliatory tariffs on certain U.S. products after a Presidential Proclamation removed India from the U.S. Generalized System of Preferences program in May 2019. Canada and Mexico levied retaliatory tariffs in mid-2018, but these tariffs were removed in May 2019 after the Trump Administration announced an agreement with Canada and Mexico to remove the Section 232 tariffs on imports from both countries to facilitate ratification of the U.S.-Mexico-Canada Agreement—a proposed regional free trade agreement that is meant to supersede the North American Free Trade Agreement (NAFTA).
|
U.S. Agricultural Exports to China, 2014-2018 In Nominal Billions of U.S. Dollars |
 |
|
Source: U.S. Census Bureau trade data, accessed July 2019. Note: Data are in calendar years, January to December. |
The total value of exports of U.S. food and agricultural products levied retaliatory tariffs in 2018 was $22 billion, down 27% from $30 billion in 2017. China accounted for about 80% of the total affected trade in both years. Despite the retaliatory tariffs, U.S. agricultural exports rose in 2018 to $140 billion from $138 billion in 2017, partly due to higher imports during the months leading up to the retaliatory tariffs and increased exports to other nonretaliating countries. With the continuation of retaliatory tariffs, U.S. Department of Agriculture (USDA) projects U.S. agricultural exports to decline about 4% in 2019.
In the short run, retaliatory tariffs contributed to declining prices for certain U.S. agricultural commodities and reduced exports, particularly for soybeans. Declining prices and exports sales combined with rising input and farm machinery costs contributed to a 16% decrease in U.S. net farm income in 2018, compared with 2017. China's soybean imports are expected to resume growing over the next decade, but a USDA study expects the volume traded to be less than previously anticipated. Because of the retaliatory tariffs on U.S. soybeans, USDA projects that Brazil will account for two-thirds of the global growth in soybean exports to China. The United States accounted for 40% of China's total soybean imports in 2016 and 35% in 2017, compared with Brazil's 46% in 2016 and 53% in 2017. In 2018, the U.S. share of China's soybean import market dropped to 19% and Brazil's share was up at 76%.
|
Chinese Imports of Russian Agricultural Products, 2016-2018 In Nominal Millions of U.S. Dollars |
 |
|
Source: China Customs Statistics accessed via Global Trade Atlas, July 2019. Note: Other animal prods = Other animal products. |
To help alleviate the financial loss incurred by U.S. farmers due to retaliatory tariffs, USDA announced $12 billion in financial assistance in 2018—referred to as a trade aid package—for certain U.S. agricultural commodities using Section 5 of the Commodity Credit Corporation (CCC) Charter Act (15 U.S.C. 714c). In 2019, USDA announced a second trade-aid package of $16 billion. Increased trade aid to U.S. farmers has generated questions from some World Trade Organization (WTO) members about whether the trade-aid package may violate U.S. WTO commitments.
While trade-aid packages may provide short-term financial assistance, some studies and critics of the President's actions caution that the long-term consequences of the retaliatory tariffs may present more challenges. Even as China has raised tariffs on U.S. imports, it has improved access to its markets for other exporting countries. Brazil, Russia, and other countries are expanding their agricultural production to meet China's import demand. For example, Russia's investments during the past two decades have resulted in agricultural productivity growth ranging from 25% to 75%, with higher productivity growth along its southern region. Although still at relatively modest levels, China's total food and agricultural imports from Russia increased 61% between 2017 and 2018.
The continuation of trade disputes and retaliatory tariffs may be of interest to Congress for the following reasons. Trade disputes have disrupted global markets and increased uncertainty in the farm input and output sectors. They may add to production costs, and they have dampened exports, impacted farm income, and triggered additional federal assistance for the farm sector. In the short run, there could be some transient benefits associated with various aspects of the agricultural sector. In the long run, other countries may expand agricultural production, potentially displacing U.S. agricultural exports to become larger food and agricultural suppliers to China.
Introduction
|
Box 1. Tariffs and Harmonized Tariff Schedules A tariff is a customs duty levied on imported goods and services. When a good enters a U.S. port of entry, merchandise is classified and tariffs are assessed using the U.S. Harmonized Tariff Schedule (HTS), a compendium of tariff rates based on a globally standardized nomenclature. At the global level, the Harmonized System (HS), established by the World Customs Organization, is the standardized nomenclature for the classification of products. It allows participating countries to classify traded goods on a common basis for customs purposes. The HS codes are standard up to 6 digits, the most detailed level that can be compared internationally. Beyond 6 digits, countries can introduce national distinctions for tariffs and for other purposes. The U.S. HTS code agrees with the HS code at the 6-digit level, but may vary from other countries at 8- or higher digit levels. |
Since early 2018, certain foreign nations have targeted U.S. food and agricultural products with retaliatory tariffs (for more on tariffs, see Box 1) in response to U.S. Section 232 tariffs on steel and aluminum imports and U.S. Section 301 tariffs levied on imports from China.1 The first U.S. trade action occurred on March 8, 2018, when President Trump imposed tariffs of 25% on steel and 10% on aluminum imports (with some flexibility on the application of tariffs by country) using presidential powers granted under Section 232 of the Trade Expansion Act of 1962.2 Section 232 authorizes the President to impose restrictions on certain imports based on an affirmative determination by the Department of Commerce that the targeted import products threaten national security. The targeted exporters, China, Canada, Mexico, the European Union (EU), and Turkey, responded by levying retaliatory tariffs on U.S. food and agricultural products, and other goods. India proposed retaliatory tariffs but did not implement them until June 2019.
A second action occurred in July 2018 when the Trump Administration used a Section 301 investigation to impose tariffs of 25% on $34 billion of selected imports from China, citing concerns over China's policies on intellectual property, technology, and innovation.3 In August 2018, the Administration levied a second round of Section 301 tariffs, also of 25%, on an additional $16 billion of imports from China. In September 2018, additional tariffs of 10% were applied to $200 billion of imports from China and, in May 2019, these were raised to 25%.4 On August 13, 2019, the Office of U.S. Trade Representative (USTR) published two lists of additional Chinese imports that would face 10% tariffs, effective September 1, 2019, and December 15, 2019.5 The imposition of the Section 301 tariffs on Chinese goods resulted in retaliatory tariffs by China. Additionally, in August 2019, China asked its state-owned enterprises to halt purchases of U.S. agricultural goods.6 On August 23, 2019, China further retaliated by levying two additional sets of tariffs: 5% or 10% tariffs on U.S. imports, including 695 different U.S. agricultural tariff lines effective September 1, 2019; and another 5% or 10% tariffs on U.S. imports including 184 different U.S. agricultural tariff lines effective December 15, 2019.7
During 2018, China, Canada, Mexico, the EU, and Turkey jointly levied retaliatory tariffs on more than 1,000 U.S. food and agricultural tariff lines. India prepared a list of U.S. products targeted for retaliatory tariffs in 2018 but refrained from implementing them. Then in 2019, India implemented retaliatory tariffs on certain U.S. lentils, apples, and tree nuts8 after the United States removed India from the U.S. Generalized System of Preferences (GSP) program on May 31, 2019.9 GSP provides duty-free tariff treatment for certain products from designated developing countries. India's removal from GSP is expected to raise duties valued at about $5 billion to $6 billion on goods the United States imports from India—or slightly more than 10% of India's total 2018 exports of $54 billion to the United States.10 In response to U.S. action, India implemented the retaliatory tariffs identified in 2018, with some changes, effective June 16, 2019.11
On May 17, 2019, the Trump Administration reached an agreement with Canada and Mexico to remove the Section 232 tariffs on steel and aluminum imports from those countries and to remove all retaliatory tariffs imposed on U.S. goods.12 The Administration reduced tariffs on Turkish steel imports, and Turkey responded on May 21, 2019, by halving its retaliatory tariffs on U.S. imports.13
Report Objectives
This report recaps the chronology and the effect of U.S. Section 232 and Section 301 actions on U.S. food and agricultural imports and the retaliatory tariffs imposed on U.S. agricultural exports by its trading partners during 2018 and the spring of 2019. As China is subjected to the largest set of U.S. tariff increases and has levied the most expansive set of retaliatory tariffs on U.S. agricultural products, this report largely focuses on the effects of Chinese retaliatory tariffs on U.S. agricultural trade. Because almost all U.S. food and agricultural tariff lines are affected by Chinese retaliatory tariffs, the report provides illustrative examples using selected agricultural products. Thus, the report is not a comprehensive review of the effect of Chinese retaliatory tariffs on every U.S. agricultural product exported to China.
Retaliatory tariffs have made U.S. products relatively more expensive in China, with the result that Chinese imports from other countries have increased in lieu of U.S. products. This report discusses the short- and long-run economic effects of the changes in trade flows, locally, nationally, and globally. The long-run effects may potentially be more problematic, as China and Russia have increased their agricultural productivity over the past two to three decades,14 and China has increased investments in other countries to develop potential future sources of imports.15 Additionally, China has improved market access for imports from other countries while it has increased tariffs on U.S. imports. Finally, the report presents the views of selected U.S. agricultural stakeholders on retaliatory tariffs, and it identifies issues that may be of interest for Congress.
Retaliatory Tariffs on U.S. Agricultural Exports
Except for China, which faces both Section 232 and Section 301 tariffs, other countries' retaliatory tariffs respond only to U.S. Section 232 tariffs on U.S. imports of certain steel and aluminum products. Higher retaliatory tariffs represent increases above the World Trade Organization (WTO) Most Favored Nation (MFN) tariff rates or beyond any existing preferential tariff rates. Retaliatory tariffs for Canada and Mexico are increases from the existing North American Free Trade Agreement (NAFTA) rates, most of which, at zero percent, are below the MFN rates.
Table 1 summarizes the retaliatory tariff increases on U.S. agricultural products by comparing tariff increases of September 2018 with the retaliatory tariffs in effect in June 2019.16 A potential reason for observed changes in applied tariffs rates is that some tariffs are levied based on quantity (such as per ton or per kilograms) and, for purposes of analyses, tariffs are converted to percentage of total import value, ad valorem rates (see Box 2). When the price of a traded product changes, the ad valorem tariff rate imposed on a product can change. Additionally, it is not always possible to match the U.S. Harmonized Tariff Schedule17 (HTS) with the retaliatory country's 8- or 10-digit tariff code (see Box 1). Thus, it may be difficult to link the U.S. Census Bureau trade data with the tariff codes of products affected by retaliatory tariffs. Therefore, this report makes use of both U.S. export data and partner country import data as appropriate to provide the most accurate measure of the magnitude of the affected U.S. trade. For U.S. retaliating trade partners, Table 1 provides the minimum, maximum, and simple (not trade-weighted) average retaliatory tariff hike rates.
Table 1. Comparison of Retaliatory Tariff Hikes on U.S. Agricultural Products: September 2018 versus June 2019
Percentage Increases Over World Trade Organization (WTO) Most Favored Nation (MFN) Tariff Rates or Rates Under the North American Free Trade Agreement (NAFTA)
|
Country |
Productsa |
Effective |
Tariffs increases as of September 2018 |
Tariff increases as of June 2019 |
||||
|
Minb |
Maxc |
Avgd |
Minb |
Maxc |
Avgd |
|||
|
Chinae |
Almost all products |
First of 5 tranches initiated April 2, 2018. |
5% |
50% |
20% |
5% |
50% |
24% |
|
Canadaf |
Coffee; prepared meats, fruit, vegetables and other products; whiskey |
July 1, 2018 |
10% |
10% |
10% |
0% |
0% |
0% |
|
Mexicof |
Pork; cheese; apples; prepared fruits and vegetables; whiskey |
June 5, 2018 |
7% |
25% |
18% |
0% |
0% |
0% |
|
European Union |
Prepared vegetables and legumes; grains; fruit juice; peanut butter; whiskey |
June 22, 2018 |
10% |
25% |
24% |
10% |
25% |
24% |
|
Turkeyg |
Tree nuts; rice; miscellaneous prepared foods; whiskey; tobacco |
June 21, 2018 |
20% |
140% |
58% |
10% |
70% |
29% |
|
Indiah |
Almonds; walnuts; apples; chickpeas; lentils |
June 16, 2019 |
0% |
0% |
0% |
10% |
29% |
18.5% |
Sources: USDA, Foreign Agricultural Service (FAS), various GAIN Reports: CH18034, June 21, 2018; CH18034, August 6, 2018; CH19030, May 17, 2019; E18045, June 21, 2018; TR8018, June 28, 2018; TR9012, May 22, 2019; MX8028, June 6, 2018; and IN8108, September 21, 2018; The Gazette of India, Customs Notification No. 16/2019, June 15, 2019; Department of Finance, Canada, "Notice of Intent to Impose Countermeasures Action Against the United States in Response to Tariffs on Canadian Steel And Aluminum Products," May 31, 2018; Toubia et al., "Canada and Mexico Eliminate Section 232 Steel/Aluminum Countermeasures as of May 20," International Trade Law, May 20, 2019.
Notes: MFN tariff rates are the tariff rates that WTO members levy on imports from other WTO members, excluding those with whom a preferential trade agreement may exist. Canada and Mexico have signed NAFTA with the United States and levy tariff rates lower than the MFN rates—zero on almost all U.S. imports.
a. Products include most of chapters 1-24 of the U.S. Harmonized Tariff Schedule, which cover meat, grains, animal feed, dairy, horticultural products, processed foods, unprocessed tobacco, alcoholic beverages; plus essential oils in chapter 33; animal hides and skins in chapters 41 and 43; and silk, cotton, and wool in chapters 50, 51, and 52. Fishery products (chapter 3 and parts of chapter 16) and forest products are not considered in the table.
b. Min = minimum retaliatory tariff levied by the country on the listed products.
c. Max = maximum retaliatory tariff levied by the country on the listed products.
d. Avg = Simple average (unweighted) tariff rates for the listed products. Within a category of traded products, trade may mostly occur for a few products' harmonized tariff lines rather than being evenly divided across all lines. Weighted averages are therefore considered as the "effective" average tariff rates.
e. China imposed the first set of retaliatory tariffs (in response to 232 tariffs) in April 2018, followed by the first round in response to 301 tariffs in July 2018, then successive rounds in August 2018, September 2018, and finally in June 2019.
f. Canada and Mexico removed their retaliatory tariffs effective May 20, 2019, and have in effect the zero NAFTA tariffs.
g. Turkey halved the retaliatory tariffs on U.S. imports on May 21, 2019, in response to U.S. action that reduced tariffs on Turkish steel imports.
h. India proposed retaliatory tariffs in June 2018, but implemented them effective June 16, 2019.
Chinese Retaliatory Tariffs18
China is subject to the largest set of U.S. tariff increases—both the U.S. Section 232 steel and aluminum tariffs and the Section U.S. 301 tariffs in response to unfair trade practices. As a result, China has countered with an expansive list of retaliatory tariffs. In particular, all U.S. products affected by Chinese retaliatory tariffs in response to the U.S. Section 232 action also faced additional retaliatory tariffs in response to U.S. Section 301 trade action.
China first retaliated against U.S. Section 232 action in April 2018, by raising tariffs on certain U.S. imports including agricultural products.19 During the first round of Chinese retaliatory tariffs, these products included pork, fruit, and tree nuts. In July 2018, China retaliated against U.S. Section 301 tariffs by raising tariffs on an expanded number of products, including most U.S. agricultural products exported to China.20 Tariffs were also raised on products affected by the earlier April 2018 retaliatory tariffs in response to U.S. Section 301 action, with most subject to an additional tariff of 25%.
China levied two more rounds of retaliatory tariff increases (against U.S. Section 301 action) in 2018—in August and September—expanding the coverage of the affected products. In September 2018, China imposed 5% and 10% tariff increases on certain products (including agricultural products) which had not been subject to any retaliatory tariffs in response to U.S. Section 301 action.21 In June 2019, China increased tariffs on some additional products that had not been previously targeted with retaliatory tariffs, as well as some products that had been hit with the 5% or 10% retaliatory tariff in September 2018.22 As a result, almost all U.S. agricultural products shipped to China face retaliatory tariffs, ranging from 5% to 50% above their MFN tariff rates through August 31, 2019,23 with a simple average tariff rate increase of 24% across all products as of July 2019. See Table A-1 for information on average Chinese retaliatory tariffs across different food and agricultural product categories.
Retaliatory Tariffs by Canada and Mexico
In June 2018, Mexico levied a 15% tariff on U.S. sausage imports; a 20% tariff on other pork products, certain cheeses, apples, potatoes, and cranberries; and a 25% tariff increase on whey, blue-veined cheese, and whiskies.24
Starting in July 2018, Canada imposed a retaliatory tariff of 10% on certain U.S. products including dairy, poultry, and beef products; coffee, chocolate, sugar, and confectionery; prepared food products; condiments; bottled water; and whiskies.25
To facilitate the ratification of the proposed U.S.-Mexico-Canada Agreement (USMCA) that the leaders of the three countries agreed to on September 30, 2018,26 the United States removed the Section 232 tariffs on steel and aluminum imports from Canada and Mexico on May 17, 2019, and, in turn, these countries removed their retaliatory tariffs on U.S. imports.27
Retaliatory Tariffs by the EU, Turkey, and India
In June 2018, in response to U.S. Section 232 tariffs, the EU imposed a 25% tariff on imports of U.S. corn, rice, sweetcorn, kidney beans, certain breakfast cereals, peanut butter, orange juice, cranberry juice, whiskies, cigars, and other tobacco products, and a 10% tariff on certain essential oils.28
In June 2018, Turkey also responded to U.S. Section 232 tariffs on Turkish steel imports by levying retaliatory tariffs on selected U.S. imports.29 On August 10, 2018, the United States doubled its tariffs on steel imports from Turkey to 50%, stating that the 25% tariffs did not reduce Turkish steel imports as much as anticipated.30 Turkey responded by doubling tariffs on certain U.S. imports including a 20% retaliatory tariff on U.S. tree nuts and certain prepared food, 25% and 50% tariffs on U.S. rice (depending on whether milled or unmilled), 60% tariff on U.S. tobacco, and 140% tariff on U.S. alcoholic beverages including whiskies.31 When the United States reduced its tariffs on Turkish steel imports on May 21, 2019, Turkey halved its retaliatory tariffs on U.S. imports.32
India identified certain U.S. food products for retaliatory tariffs in 201833 but did not levy them until June 16, 2019. Indian tariff hikes above the MFN rate are 10% for imports of U.S. chickpeas, 29% for over-quota shelled almonds (ad valorem rate), and 20% for U.S. walnuts, apples, and lentils.
U.S. Agricultural Trade Affected by Tariff Hikes
Foreign nations may target U.S. food and agricultural products with retaliatory tariffs for several reasons. First, the United States is the largest exporter of food and agricultural products, so many countries are able to retaliate against those goods. Second, agricultural commodities are often more easily substituted from among potential suppliers, so curbing imports from one country would not necessarily limit an importing country's access to the commodity. Third, several food and agricultural products are produced primarily in certain regions of the United States, and thus may be targeted with a view to negatively and disproportionately affecting the constituents of specific U.S. lawmakers.
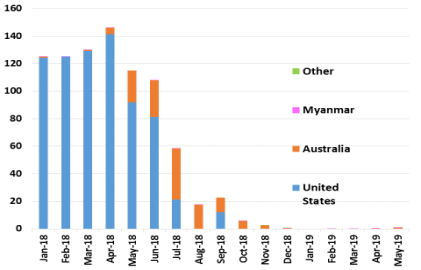
The retaliatory tariffs imposed by U.S. trading partners affected many products exported by the United States, including meats, grains, dairy products, specialty and horticultural crops, and alcoholic beverages.34 As discussed in Box 3, "Tariffs Increase Import Prices," a number of factors affect trade, including tariffs that tend to increase the price of imported goods. In 2018, total imports of affected U.S. food and agricultural products by all retaliating countries amounted to almost $22 billion, based on customs data from these countries. This represents a 27% decline from the $29.7 billion in 2017 (Figure 1).35
|
Box 3. Tariffs Increase Import Prices Economic principles state that comparative advantage, based on available resources, enables some countries to produce an exportable surplus of certain goods while other countries may have a deficit in these same goods but may produce an exportable surplus of other goods. A nation may choose whether to import a good in which it has a deficit, based on the differential between the import price and the cost of producing the good domestically. Thus, the decision whether to import from a certain trading partner or produce the good domestically hinges on the relative prices of imported versus domestically produced goods. In a dynamic international market, a number of factors determine agricultural commodity prices. These include, for example, the existing level of stocks for a given commodity, annual production levels, the anticipated demand for both the commodity and potential substitutes, prices of substitutes, and exchange rates. Trade policy is another important factor. Trade barriers such as tariffs raise the price of an imported product, which in turn may lower the demand for certain products in the importing country. If new tariffs target imports from a particular supplier, imports from other suppliers become cheaper relative to imports from the country with higher tariffs. For more on this topic, see Houck, J. P., Elements of Agricultural Trade Policies, 1992, Waveland Press Inc, Prospect Heights, IL. |
Based on Chinese customs data, the total value of Chinese agricultural imports from the United States affected by retaliatory tariffs declined from $22.5 billion in 2017 to $14.7 billion in 2018.36
Canadian customs data show that imports of U.S. agricultural products declined to $2.3 billion in 2018 from $2.4 billion in 2017.37 Canadian retaliatory tariffs include certain tariff lines covering prepared product categories under beef, poultry, dairy, fruit, vegetables, drinks, coffee and spices, chocolate and confectionary, and whiskey. As noted earlier, Canada removed its retaliatory tariffs on U.S. imports in May 2019, in response to the U.S. removal of Section 232 tariffs on steel and aluminum imports from Canada.
A review of Mexican customs data finds that imports of U.S. agricultural products by Mexico also declined from $2.6 billion in 2017 to $2.5 billion in 2018,38 largely accounted for by sausage and pork products. Mexico's imports of these products declined from $2.3 billion in 2017 to $1.6 billion in 2018. In addition to pork products, Mexico had imposed retaliatory tariffs on cheeses, apples, prepared fruit, vegetables and other food, and whiskey. Mexico also removed its retaliatory tariffs on U.S. imports in May 2019, in response to U.S. removal of Section 232 tariffs on steel and aluminum imports from Mexico.
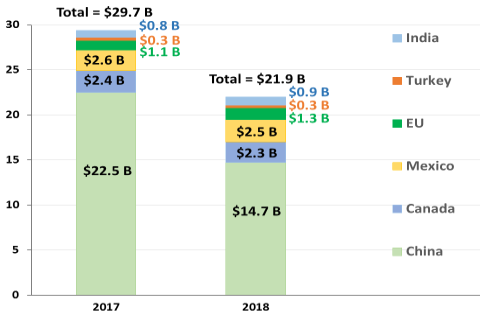
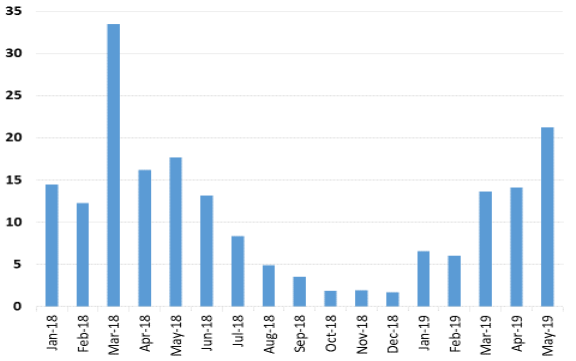
EU customs data show the import value of U.S. food and agricultural products affected by the EU retaliatory tariffs increased to $1.3 billion in 2018 from $1.1 billion in 2017.39 The EU imposed tariff hikes on certain prepared vegetables, pulses, breakfast cereals, fruit juices, peanut butter, tobacco products, whiskey, and essential oils. A temporary surge in sales in the months prior to the imposition of duties appears to have offset a slump in sales that coincided with the onset of retaliatory duties later in the year (Figure 2). Based on the quarterly import data, by the first quarter of 2019, the total value of EU imports of U.S. products affected by retaliatory tariffs was lower than during the last quarter of 2017 or the first quarter of 2018. Since the second quarter of 2018, EU imports of affected food and agricultural products from the United States declined. As discussed above, beyond the tariff increases, a number of factors may have contributed to this reduction in imports. For instance, when countries first released their proposed lists of products that they targeted for retaliation, some EU importers may have imported larger quantities of the affected products prior to the imposition of the duties, thus boosting EU imports of U.S. agricultural goods in 2018.
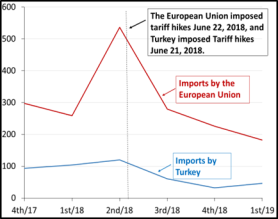
Similar to the EU, the total value of Turkish imports of U.S. food and agricultural products affected by retaliatory tariffs increased between 2017 ($299 million) and 2018 ($316 million), based on Turkish customs data.40 Turkey had imposed tariff hikes on certain tree nuts, prepared food, rice, tobacco, whiskey, and other alcoholic beverages. Imports in the months prior to the imposition of duties had increased (Figure 2), which may have offset the decline in imports during the second half of 2018. In the third and fourth quarter of 2018, Turkish imports of affected U.S. food and agricultural products declined. Since May 2019, Turkey halved its retaliatory tariffs on imports from the United States.41
During 2018, India did not levy any retaliatory tariffs on imports of U.S. food and agricultural products. Starting in June 16, 2019, India implemented retaliatory tariffs on imports of U.S. almonds, walnuts, chickpeas, lentils, and apples.42 Based on the Indian customs data, the total value of Indian imports of these products was $824 million in 2017 and $859 million in 2018.43
U.S. Agricultural Exports to Retaliating Countries
Table 2 presents U.S. agricultural exports to retaliating and nonretaliating countries, in nominal values, from 2014 to 2018. As discussed in Box 1, U.S. exports to trading partners and the reported import values in destination countries can differ due to differences in HS classification of goods in different countries. Canada, the EU, Mexico, and Turkey levied retaliatory tariffs in 2018 on selected U.S. agricultural products, while China imposed retaliatory tariffs on almost all U.S. food and agricultural products. During 2018, India did not levy any retaliatory tariffs. Thus, the changes in 2018 U.S. food and agricultural exports, compared to prior years, varied across these countries (Table 2).
Despite the retaliatory tariffs, U.S. agricultural exports grew from $138 billion in 2017 to $140 billion in 2018. Greater U.S. exports of products to nonretaliating countries ($76 billion in 2018, up from $66 billion in 2017) offset the value of trade lost to China and Turkey. In addition, increased U.S. exports of products without retaliatory tariffs and products targeted for retaliatory tariffs during the months prior to their implementation (to Canada, Mexico, and the EU) also helped to offset the decline in exports of products with retaliatory tariffs to these countries.44
Table 2. U.S. Agricultural Exports to Retaliating and Nonretaliating Countries
In Nominal Billions of U.S. Dollars, 2014 to 2018
|
2014 |
2015 |
2016 |
2017 |
2018 |
2018-2017 |
|
|
Total U.S. Global Agricultural Exports |
150 |
133 |
135 |
138 |
140 |
1% |
|
U.S. Exports to Countries With Retaliatory Tariffs in 2018 |
||||||
|
Canada |
22 |
21 |
20 |
21 |
21 |
1% |
|
Mexico |
19 |
18 |
18 |
19 |
19 |
3% |
|
European Union |
13 |
12 |
12 |
11 |
14 |
18% |
|
China |
24 |
20 |
21 |
19 |
9 |
-53% |
|
Turkey |
2 |
1 |
1 |
2 |
1 |
-19% |
|
U.S. Exports to Countries Without Retaliatory Tariffs in 2018 |
||||||
|
Other Countries |
70 |
61 |
63 |
66 |
76 |
15% |
Source: U.S. Census Bureau trade data, accessed August 2019.
Notes: Data are provided in calendar years. As India did not levy any retaliatory tariffs during 2018, it is excluded from the list of countries with retaliatory tariffs in 2018. USDA's definition of agriculture is used in the table, which includes products in Chapters 1-24 of the U.S. Harmonized Tariff Schedule (except for fishery products in Chapters 3 and 16, manufactured tobacco products like cigarettes and cigars in Chapter 24, and spirits in Chapter 22), essential oils (Chapter 33), raw rubber (Chapter 40), raw animal hides and skins (Chapter 41), and wool and cotton (Chapters 51-52).
Trade data for 2017 and 2018 in Table 2 differ from those presented in Figure 1, which only includes HS lines subject to retaliatory tariffs. Data in Table 2 also do not include alcoholic beverages that were subject to tariff hikes by all retaliatory countries, potentially understating the decline in U.S. exports to retaliating countries in 2018.
U.S. Exports Under Chinese Retaliatory Tariffs45
The Chinese market is important for several U.S. agricultural products. For example, in 2016 and 2017, the United States supplied over a third of China's total soybean imports, almost all of China's distillers' grain imports (primarily used as animal feed), and most of China's sorghum imports.46 In 2017, the Chinese market accounted for about 57% of global U.S. soybean exports, 17% of global U.S. cotton exports, 80% of global U.S. sorghum exports, 11% of global U.S. dairy product exports, 10% of global U.S. pork exports, 6% of global U.S. wheat exports, and 5% of global U.S. fruit exports.
In response to U.S. Section 232 and Section 301 tariffs on U.S. imports of Chinese goods imposed in 2018, China levied retaliatory tariffs on imports of almost all U.S. agricultural products. In 2017, China was the second-leading export market by value for U.S. agricultural products. However, after the imposition of retaliatory tariffs on U.S. imports beginning in April 2018, U.S. agricultural exports to China experienced a 53% decline from $19.5 billion in 2017 to $9.2 billion in 2018 (Figure 3).47 China thus moved down in rank to become the fourth-largest U.S. agricultural market, after Canada, Mexico, and Japan.
Among other goods, China imposed a 25% retaliatory tariff on U.S. soybeans in July 2018. Since 2000, China had been the top export market for U.S. soybeans. In 2017, China imported about $12 billion worth of U.S. soybeans, accounting for 57% of the total value of all U.S. soybean exports that year. With higher tariffs in place, China has been purchasing more soybeans from Brazil and other countries to meet its demand.48 Consequently, U.S. soybean exports to China in 2018 declined to $3 billion (Figure 3). U.S. Census Bureau trade data indicate China was still the top foreign destination for U.S. soybeans in 2018, followed by Mexico, which imported $1.8 billion of U.S. soybeans.
Reduced Chinese import demand in 2018 contributed to declining farm prices for affected commodities and lower U.S. agricultural exports to China for several commodities, including sorghum, soybeans, cotton, and pork.49 Consequently, U.S. soybean prices reached 10-year lows during July-October 2018 (Figure 4), weighing on prices of other agricultural commodities, such as corn, that compete with soybeans for acreage.50 Prices recovered some during the last quarter of 2018, coincident with reported commitments by China to purchase a "very substantial amount of U.S. agricultural" goods.51 However, Chinese purchases failed to materialize and U.S. commodity prices resumed their downward trend through the first quarter of 2019 before stabilizing.
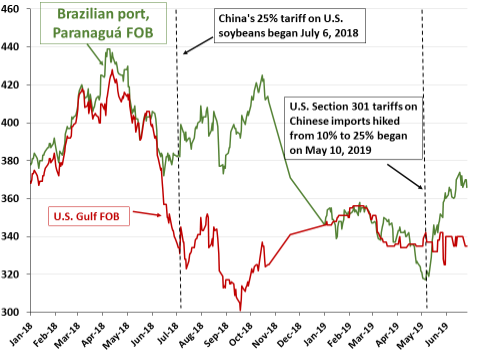
As U.S. soybean prices declined in 2018, Brazilian soybean prices started to rise, indicative of a greater demand for Brazilian soybeans from China (Figure 4).52 Since 2007, Brazilian and U.S. soybean prices had tended to move together.53 Starting in April 2018, U.S. soybean prices started to fall and Brazilian soybean prices started to rise. China's imposition of a 25% tariff on U.S. soybeans in July 2018 initially precipitated a widening of the gap between the two prices. On October 23, 2018, U.S. soybean Free on Board (FOB) prices were $86 per metric ton lower than Brazilian (Paranaguá) FOB prices.54
|
Product |
2014 |
2015 |
2016 |
2017 |
2018 |
2018-2017 |
|
Total Agricultural Productsa |
24,219 |
20,230 |
21,394 |
19,507 |
9,186 |
-53% |
|
Soybeans |
14,476 |
10,489 |
14,203 |
12,253 |
3,145 |
-74% |
|
Cotton |
1,111 |
859 |
554 |
978 |
924 |
-6% |
|
Sorghum |
1,466 |
2,115 |
1,030 |
839 |
530 |
-37% |
|
Tobacco |
216 |
197 |
172 |
162 |
158 |
-3% |
|
Wheat |
194 |
160 |
205 |
351 |
105 |
-70% |
|
Corn |
84 |
163 |
40 |
142 |
50 |
-65% |
|
Pulses |
29 |
24 |
26 |
25 |
11 |
-56% |
|
Oilseeds (excluding soybean) |
5 |
2 |
3 |
5 |
1 |
-81% |
|
Pork & Pork Products |
474 |
427 |
713 |
662 |
571 |
-14% |
|
Dairy Products |
695 |
451 |
386 |
577 |
500 |
-13% |
|
Fresh Fruit |
102 |
137 |
186 |
226 |
177 |
-22% |
|
Processed Fruit |
69 |
95 |
100 |
134 |
116 |
-14% |
|
Wine & Beer |
80 |
63 |
91 |
86 |
68 |
-21% |
|
Breakfast Cereals |
11 |
29 |
32 |
30 |
21 |
-29% |
|
Hides & Skins |
1,497 |
1,268 |
948 |
945 |
607 |
-36% |
|
Hay |
255 |
331 |
355 |
341 |
274 |
-19% |
|
Feeds & Fodders, not elsewhere otherwise indicated |
366 |
377 |
379 |
267 |
232 |
-13% |
|
Distillers Grains |
1,247 |
1,632 |
470 |
62 |
44 |
-29% |
|
Soybean Oil |
132 |
13 |
104 |
24 |
2 |
-93% |
Source: U.S. Census Bureau trade data, Product Group BICO-HS10, accessed June 17, 2019, https://apps.fas.usda.gov/gats/default.aspx.
Notes: Products are selected for illustrative purpose based on the value of U.S. exports or the percentage change in trade between 2017 and 2018. The table is not comprehensive. Data are provided in calendar years, January through December. The table does not cover almost 700 food and agricultural HS lines with retaliatory tariffs in place since April 2018, nor does it cover over 200 fishery and seafood product HS lines and about 100 forest products HS lines. Note that while fishery and seafood products and forest products are eligible for USDA's export promotion programs, both the USDA and the WTO do not define seafood and forest products as agricultural products.
a. Total reported U.S. agricultural exports to China may not match with Chinese reported U.S. agricultural imports. The reasons for possible discrepancies are explained in Box 4, "Differences in Comparing U.S. Exports Data with Chinese Imports Data."
The Brazilian soybean price started to fall in late October in anticipation of a record-high South American soybean harvest. U.S. soybean prices started to climb at the same time, partly due to farmers' willingness to hold stocks and in response to larger exports to non-Chinese destinations.55 Anticipation of Chinese purchases also contributed to rebounding of U.S. prices. As Chinese purchases did not materialize, Brazilian and U.S. soybean prices started to diverge again in May 2019.
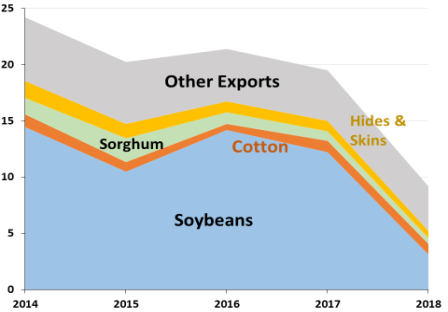
Although soybeans have been the agricultural commodity most affected by retaliatory tariffs (largely due to China's dominant role in the global soybean market), nearly all U.S. agricultural exports to China declined in 2018 relative to 2017 (see Table 3).
Key Competitors for China's Agricultural Market56
|
Box 4. Differences in Comparing U.S. Exports Data with Chinese Imports Data Among others, the following factors contribute to differences between U.S. exports data and Chinese imports data.
For more on this issue see, CRS Report RS22640, What's the Difference?—Comparing U.S. and Chinese Trade Data. |
With retaliatory tariffs making U.S. agricultural products more expensive for Chinese buyers, exports from other countries to China increased during 2018. Some studies suggest that Brazil could become China's primary soybean supplier.57 Another study concludes that U.S.-China tariff escalation would make suppliers in the rest of the world more competitive relative to U.S. and Chinese suppliers.58 Russia also contends that it may become a major U.S. competitor for China's agricultural import market,59 although market watchers expect Russia will need years to become a major agricultural supplier to China.60 To explore these assertions, CRS examined Chinese import data to identify foreign sources that may have partially replaced some of the 2018 U.S. agricultural exports to China. Note that various factors can result in data differences between U.S. exports from the U.S. Census Bureau and imports from Chinese customs data (Box 4).61
China's Total Annual Agricultural Imports
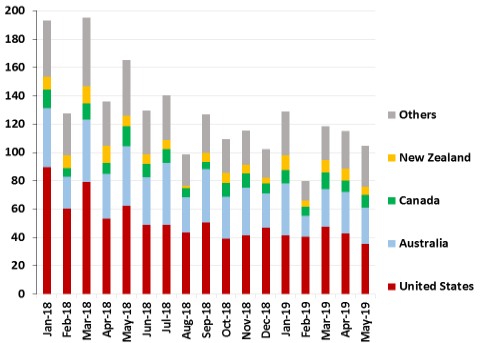
According to Chinese customs data, China's imports of agricultural products were $117 billion in 2014 as compared to $127 billion in 2018, in nominal terms (Figure 5). In 2014, the United States was the largest source of Chinese agricultural imports, accounting for nearly a quarter, or $28 billion, of China's total imports. Since 2017, Brazil and several other countries increased their shares of China's total imports, with Brazil overtaking the United States as China's largest agricultural supplier in 2017. Since the imposition of the retaliatory tariffs on U.S. imports in 2018, U.S. agricultural shipments to China declined to $15 billion, compared to $23 billion in 2017, even as overall Chinese imports increased to $127 billion. It is noteworthy that in 2016, when China's total agricultural imports were at the lowest point between 2014 and 2018, at $105 billion, U.S. market share was 21%, compared with 2018, when China's total agricultural imports were at $127 billion but U.S. market share was 12%. During the same period, Brazil's market share grew from 18% in 2016 to 26% in 2018. Additionally, China's imports from other countries increased, as indicated in Figure 5.
Brazil appears to be the primary beneficiary of Chinese retaliatory tariffs on U.S. imports, with increased exports to China in 2018 of soybeans, cotton, tobacco, pork, and oilseeds. Australia also registered growth in import market shares for cotton, sorghum, pulses, fruit and nuts, dairy, and hides and skins. Canada increased its exports to China of feed and fodder products, hides and skins, and wheat. New Zealand's share of China's import market saw gains in dairy, and hides and skins. Thailand increased its export shipments of fruit, nuts and starches, and malt to China, while increased shipments from Indonesia were largely fats and oils.
Additionally, Russia has stated that it is ready to step in to fill in the gaps created by reductions in U.S. food and agricultural exports to China, according to various news media reports,62 although market watchers expect Russia will need years to become a major agricultural supplier to China.63 In July 2018, Chinese Commerce Minister Zhong Shan agreed with his Russian counterparts to "deepen trade in soybeans and other agricultural products."64 China's imports of food and agricultural products from Russia increased 61%, from $679 million to nearly $1.1 billion, between 2017 and 2018, with strong import growth in oilseeds, wheat, fats and oils, cocoa and related products, beer, and animal products.
Various other countries from Central Asia, South and Southeast Asia, and Africa increased their exports of food and agricultural products to China during 2018 compared with 2017. Notably, China's wheat imports from Kazakhstan grew 34% and corn imports from Ukraine rose 20%. U.S. agricultural interests have reported concerns that the U.S.-China trade war in the form of tariffs and tariff retaliation could escalate further, potentially resulting in widespread, long-term damage, particularly for firms with complex international supply chains.65 For American farmers, the escalating conflict with China has contributed to declining soybean and related agricultural commodity prices in the short run, but studies indicate that the long-term consequences could be complex and have long-lasting impacts.66
The following section examines how major U.S. agricultural product market shares fared in the Chinese import market during 2018. It also presents China's imports of selected agricultural commodities on a monthly basis starting in January 2018, through the first trimester of 2019 when the different retaliatory tariffs became effective.
China's Imports of Soybeans
According to Census data, China has been the top export market for U.S. soybeans since 2000. China imported $12 billion worth (32 million metric tons) of U.S. soybeans in 2017, accounting for 57% of the total value and volume of all U.S. soybean exports that year. With higher tariffs on U.S. soybeans, China has been purchasing more soybeans from Brazil and other countries to meet its demand.67 Consequently, U.S. soybean exports to China declined to $3 billion (8 million metric tons) in 2018. Based on Census trade data, China was still the top destination for U.S. soybeans in 2018, followed by Mexico—which imported $1.8 billion worth of U.S. soybeans.
According to China's monthly customs data, China's import of U.S. soybeans in January 2018 was $2.5 billion (Figure 6).68 China's monthly imports of U.S. soybeans started to decline after China announced retaliatory tariffs in response to U.S. Section 232 tariffs in April 2018, which did not include U.S. soybeans. By the time China imposed retaliatory tariffs in response to U.S. Section 301 tariffs (which included U.S. soybeans) in July 2018, China's import of U.S. soybeans had decreased to about $140 million for that month (from $2.5 billion in January 2018). U.S. soybean shipments to China continued to decline until November 2018, when China did not import any U.S. soybeans. In December 2018, the White House announced that China had committed to purchase a "very substantial amount of agricultural" goods. Following this and other announcements, China purchased U.S. soybeans during the first trimester of 2019. The largest of these purchases, worth $700 million, occurred in April 2019. However, China's imports of U.S. soybeans declined in May 2019, coincident with the continued escalation of the U.S.-China trade dispute and the imposition of an increase in the third round of U.S. Section 301 tariffs on Chinese imports in May 2019.
During this tariff dispute, China has turned increasingly to Brazil to meet its demand for soybeans. In January 2018—prior to the tariff dispute—Chinese imports of Brazilian soybeans totaled less than $900 million, before increasing in May and June of 2018, when shipments of newly harvested soybeans from the Southern Hemisphere to China increased. By July 2018, Brazilian shipments were on the decline when China imposed 25% retaliatory tariffs on U.S. soybeans. Normally, newly harvested U.S. soybean shipments to China would have increased in the fall of 2018, whereas Chinese purchases of U.S. soybeans slowed to almost nil and were outpaced by Brazilian shipments to China. From February to May 2019, China expanded its purchases of U.S. soybeans, while also buying soybeans from Brazil, and increasing its soybean imports from Argentina, Russia, and Central Asian countries.
China's Imports of Cotton
According to Census trade data, U.S. cotton exports to China totaled over $1 billion in 2014.69 From 2017 to 2018, U.S. cotton exports to China declined 6%, from $978 million to $924 million.
Monthly Chinese customs data indicate that China's imports of U.S. cotton have decreased since the imposition of retaliatory tariffs in July 2018 (Figure 7). During January 2018, China's cotton imports from the United States totaled $140 million. Following the announcement of retaliatory tariffs on some U.S. imports (in response to U.S. Section 232 action) in April 2018, China's imports of U.S. cotton shrank to $27 million in October 2018. While Chinese imports from the United States declined, China's imports from other countries have increased. Cotton shipments from Brazil and Australia posted the largest increases, followed by imports from India and Uzbekistan. Additionally China's imports of cotton from other Central Asian and West African countries have risen since June 2018 (Figure 7). On July 26, 2019, China reportedly approved some domestic textile mills to buy 50,000 metric tons of U.S. cotton without being subject to retaliatory tariffs.70 However, since President Trump's announcement to levy 10% Section 301 tariffs on the remaining Chinese imports that were not subject to Section 301 tariffs, China responded in August 2019 by asking its state-owned enterprises to halt purchases of U.S. agricultural goods.71
|
Figure 7. China's Monthly Imports of Cotton In Millions of U.S. Dollars, Since January 2018 |
 |
|
Source: China Customs Data accessed from Global Trade Atlas, July 2019. |
China's Imports of Wheat
In 2016, the United States supplied 26% of China's wheat imports. This share increased to 40% in 2017, but declined to 14% in 2018. Canadian wheat exports have largely replaced U.S. wheat shipments to the Chinese market, with Canada's share of China's wheat imports rising from 27% in 2016 to 54% in 2018. Kazakhstan and Russia also have increased their wheat exports to China in the wake of 25% Chinese retaliatory tariffs on U.S. wheat imports, which have been in effect since July 2018.
From January to June 2018, the United States shipped a total of $113 million of wheat to China (Figure 8), compared with $256 million of U.S. wheat shipped during the same period in 2017.72 After China levied retaliatory tariffs on U.S. wheat in July 2018, U.S. wheat shipments to China were nil for the rest of the year. China imported $208 million of U.S. wheat in 2016 and $390 million of U.S. wheat in 2017.73 In March 2019, China imported $12 million of U.S. wheat. According to Chinese customs data, there have been no additional U.S. wheat shipments to China as of May 2019.
China's Imports of Sorghum
The United States accounted for nearly 90% of China's total sorghum imports in 2016 and 2017.74 The value of U.S. shipments of sorghum declined 24%, from close to $1 billion in 2017 to $726 million in 2018. China's monthly imports of U.S. sorghum have been negligible since China implemented retaliatory tariffs on them in July 2018 (Figure 9). U.S. imports started to decline after May 2018, following China's imposition of retaliatory tariffs on some agricultural products in response to U.S. Section 232 tariffs in April 2018.75 Later, China imposed a 25% retaliatory tariff on U.S. sorghum in July 2018, leading to declines in U.S. sorghum shipments to China.
China's imports of U.S. sorghum declined after retaliatory tariffs were imposed, but China continued to import limited quantities from Australia, Myanmar, and Argentina. However, in the absence of Chinese purchases of U.S. sorghum, China's total sorghum imports since October 2018 have been negligible (Figure 9). Therefore, despite the retaliatory tariffs, U.S. market share in 2018 was about 85% of China's total sorghum imports for the year.
On July 26, 2019, China reportedly allowed several domestic companies to buy U.S. sorghum without being subject to retaliatory tariffs.76 However, since President Trump's announcement to levy 10% Section 301 tariffs on remaining Chinese imports that do not yet have any Section 301 tariffs imposed on them, China responded in August 2019 by asking its state-owned enterprises to halt purchases of U.S. agricultural goods.77
China's Imports of Pork and Pork Products
The United States supplied 13% of China's total pork imports in 2016 ($400 million) and 2017 ($286 million).78 In 2018, U.S. pork shipments to China declined to $130 million and accounted for 6% of China's total pork imports. U.S. pork shipments to China began to decline in April 2018 following China's imposition of 25% retaliatory tariffs on U.S. pork (HS 0203 lines) in response to U.S. Section 232 tariffs on U.S. imports of Chinese steel and aluminum products (Figure 10). In July 2018, these HS lines were subject to an additional 25% retaliatory tariff. This coincided with a further decline in Chinese imports of U.S. pork products from July through December 2018.
Unlike the case of sorghum, China has continued to import some U.S. pork products, and import volumes generally increased from January through May 2019. Since the summer of 2018, China has suffered from a serious outbreak of African Swine Fever (ASF).79 Between September 2018 and May 2019, China reported over 2 million culled hogs. In March 2019, USDA reported that despite the retaliatory tariffs, because of ASF, U.S. pork products are entering China and USDA expects China's imports of U.S. pork to climb in 2019 due to the liquidation of some of China's hogs in an effort to control ASF. However, USDA reported that U.S. pork products still face Chinese retaliatory tariffs, which makes U.S. products relatively more expensive compared with pork from other countries.80 On July 26, 2019, China reportedly approved requests from several domestic companies to buy U.S. pork products without being subject to retaliatory tariffs.81 However, since President Trump's August 2019 announcement to levy 10% Section 301 tariffs on remaining Chinese imports that do not yet have any Section 301 tariffs levied on them, China responded by asking its state-owned enterprises to halt purchases of U.S. agricultural goods.82 On August 23, 2019, China imposed additional 10% tariffs on certain U.S. pork products, effective September 1, 2019, in response to new U.S. Section 301 tariffs on U.S. imports from China.83
China's Imports of Dairy Products
Since 2016, the United States has been the third-largest supplier of dairy products to China ($1.3 billion in 2018), among over 140 suppliers, behind New Zealand ($4.2 billion) and the Netherlands ($2 billion). China is a growing market for dairy products. Chinese imports of dairy products increased over 50% from $10 billion in 2016 to $15 billion in 2018.84 Given the diversity of dairy product tariff lines and the varying rates of Chinese retaliatory tariffs levied on them, the trade effects on the aggregate group are not as clear as they are for other individual commodities. Figure 11 presents China's monthly imports of U.S. dairy products, since the large number of suppliers and differences in market shares across the suppliers are difficult to present in a single chart.
China imposed retaliatory tariffs on U.S. dairy products in July 2018. Given the diversity of dairy tariff lines, there is no clear trend in China's monthly imports of U.S. dairy products during the second half of 2018 and early 2019 (Figure 11). Instead, annual U.S. dairy shipments to China increased 15% from $1.2 billion in 2017 to $1.3 billion in 2018.85 However, in China's growing market, imports from competitor countries grew faster from 2017 to 2018, with New Zealand's shipments increasing 15% from $3.7 billion to $4.2 billion; the Netherlands' shipments increasing 35% from $1.5 billion to $2 billion; and Australia's shipments increasing 32% from $1 billion to $1.3 billion. Although U.S. dairy shipments to China do not show any clear trend since January 2018, the retaliatory tariffs are likely contributing to faster market share growths for U.S. competitors in China than for the U.S. dairy sector, particularly since some dairy products are levied additional 5% retaliatory tariffs effective September 1, 2019.86
China's Imports of Hides and Skins
The United States is the largest supplier of hides and skins to China, accounting for about 41% of China's total imports from 2016 to 2018. In 2017, shipments of U.S. hides and skins to China amounted to $918 million. After the imposition of retaliatory tariffs in July 2018, Chinese imports of U.S. hides and skins declined, with China's 2018 U.S. hides and skins imports totaling $664 million.87
|
Figure 12. China's Monthly Imports of Hides and Skins In Million U.S. Dollars, Since January 2018 |
 |
|
Source: China Customs Data accessed from Global Trade Atlas, July 2019. |
Major U.S. competitors in China's hides and skins import market are Australia, Canada and New Zealand (Figure 12). These countries have not been able to fill the gap created by the decline in U.S. shipments of hides and skins to China. Consequently, China's total hides and skins imports fell 25% in 2018, to $1.6 billion from $2.2 billion in 2017. U.S. shipments of hides and skins to China declined 28% during the same period. Notwithstanding the tariffs on U.S.-origin hides and skins, the decline in U.S. shipments largely mirrored the overall decline in China's imports, with the result that the United States continued to supply about 41% of China's total hides and skins imports in 2018, the same share as in the previous two years. U.S. shipments of hides and skins to China may further drop with the additional 10% retaliatory tariff on U.S. imports that became effective September 1, 2019.88
Retaliatory Partner Imports of Other Agricultural Products
Analysis conducted by economists from University of California, Davis (UC Davis) found that Chinese retaliatory tariffs decreased U.S. alfalfa exports to China in 2018 compared to the previous two years.89 From 2016 to 2018, the United States supplied the largest share of China's alfalfa imports, accounting for about 79% of China's total alfalfa import market share in 2016 ($417 million) and 72% ($534 million) in 2018.90 In January 2018, China purchased U.S. alfalfa valued at $40 million. Following the imposition of retaliatory tariffs, U.S. monthly shipments of alfalfa to China started to decline in the summer of 2018. In November 2018, China's monthly imports of U.S. alfalfa amounted to $16 million and totaled $17 million in December 2018.
Another study from UC Davis indicates that U.S. pistachio exports also declined due to retaliatory tariffs from China and Turkey.91 A third study from UC Davis estimated a combined short-run export loss for 2018 of $2.64 billion for almonds, apples, pistachios, walnuts, pecans, sweet cherries, oranges, table grapes, raisins, and sour cherries in four major import markets (China including Hong Kong, India, Mexico, and Turkey).92
It stands to reason that Chinese retaliatory tariffs may have also affected U.S. exports of certain other field crops, livestock and animal products, other specialty crops, and processed food products that are not covered in this report.
Economic Impact of Retaliatory Tariffs
U.S. agriculture, as a whole, is subject to intense competition, in both domestic and international markets. As a result, most commodity sectors operate with thin profit margins, making international sales an important component of revenue. Tariffs, by design, raise the cost of imported products (see Box 3).93 In general, an increase in import prices due to higher tariffs leads to a decrease in quantities purchased of the affected products as importers switch to other foreign suppliers or to alternate products within the domestic market. Thus, the trade impact of such a price increase will depend in large part on the number of available alternate foreign suppliers and the availability of substitutes within the domestic market. Furthermore, a decrease in exports will have an economy-wide effect as the supporting infrastructure—including farms, marketing cooperatives, warehousing and processing facilities, and transportation networks, for example—all lose business and revenues. This loss ripples further through the general economy and can cause decreases in employment and local, state, and federal tax revenues. This section of the report examines the short-term market impacts and selected economic analyses of longer-term impacts of the retaliatory tariffs.
|
Given the broad, multifaceted nature of markets, any economic analysis of the impact of a shock or unexpected event (such as new tariffs or other trade barriers) generally uses a number of simplifying assumptions to control for several of the moving market pieces. Thus, economic models of a market equilibrium—that is, where supply and demand of a commodity are in balance, and determine the price of a commodity—build certain limiting features into their structure. Two such features are the time frame being evaluated and the extent of overlap and feedback from other economic sectors. Time Frame: Short versus Long Run In evaluating a shock to a market equilibrium, the primary difference between the short run and the long run is the extent to which resources are allowed to adjust to the shock and provide feedback to the economic system being evaluated. This difference is fairly distinct for agricultural markets because producers of most temperate crops such as corn and soybeans are only able to produce a single crop each year. Thus, the time between the harvest of the current crop and the planting and harvesting of a new crop is the short run. All market adjustments that occur within this time frame—whether measured as a price change or a shift in domestic use or trade—are based on the existing supply of a commodity. In the long run, enough time has passed to provide producers the opportunity to make new crop production choices in response to the market shock, thus changing the supply of commodities in the market being studied. To produce long-run estimates, the underlying model and economic analysis assumes that the shock—if in the form of tariffs or trade barriers—is permanent and that no further shocks occur to the market. Cross-Sector: Partial versus General Equilibrium Analysis A partial equilibrium model examines a single market or sector—in isolation from other sectors of the economy—for its response to a shock. Thus, the partial equilibrium analysis considers the effects of a trade shock on an individual agricultural commodity, group of commodities, or the entire agricultural sector, but it does not consider other sectors of the economy. In contrast, general equilibrium (GE) models examine several sectors of the economy simultaneously for their interdependencies and interrelations to understand how the economy as a whole responds to a shock. Thus, GE analysis is able to evaluate the link between agricultural markets and nonagricultural markets in response to a trade shock. Scale of Impact: Local, National, Regional versus Global A price shock to major traded commodities such as U.S. agricultural products not only affects the economic well-being of producers, processors, and sellers of these commodities, but through multiplier effects also affects the well-being of U.S. rural communities. The length, breadth, and depth of shocks determines the ripple effects into the national economy. Given the dominant role of U.S. agricultural trade in the global market, the U.S. impacts of trade wars can influence agricultural production, consumption, and trade of other nations, leading to changes in foreign national strategies and investments affecting resources used. |
Short-Run Impacts
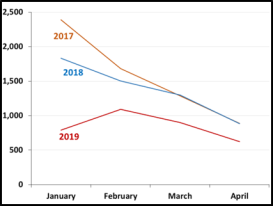
In the short run (see Box 5), retaliatory tariffs resulted in lower 2018 purchases of U.S. agricultural products by countries implementing these tariffs. The prospects for U.S. agricultural exports to China in 2019 appear to be along the same trajectory. As discussed earlier (Figure 2), U.S. food and agricultural imports by the EU and Turkey during the first quarter of 2019 were below the level of imports during the same period in 2017 and 2018.
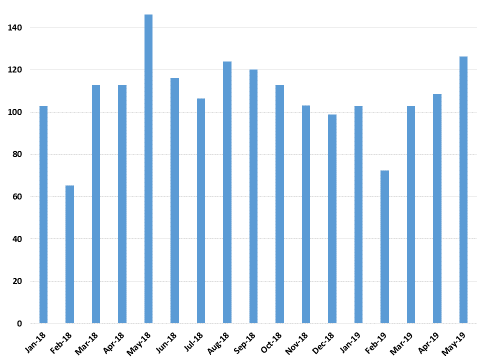
Similarly, an examination of U.S. monthly exports to China from January to April 2019 demonstrates that the first quarter 2019 agricultural export levels have been below the export levels during the same period in 2017 and 2018 (Figure 13). Generally, fall harvested crops are exported during late fall and early winter months, and export levels decline during the spring.94
Note that no retaliatory tariffs were in effect during 2017 or the first quarter of 2018. China levied the first round of retaliatory tariffs on U.S. imports in April 2018, in response to U.S. Section 232 tariffs. Other retaliating countries followed China's action with retaliatory tariffs in June 2018. Additionally, China expanded the range of affected U.S. imports and increased tariffs in additional rounds of retaliatory actions during the summer and fall of 2018, in response to U.S. Section 301 tariffs. With the continuation of existing retaliatory tariffs on almost all U.S. agricultural HS lines, China's proclamation that its state-owned enterprises will halt purchases of U.S. agricultural goods,95 and the 5% or 10% additional increase in retaliatory tariffs effective September and December 2019,96 U.S. exports of agricultural products affected by retaliatory tariffs could potentially continue to lose some market share in China.
In addition to export losses, U.S. agriculture is facing other challenges in 2019. Abundant domestic and international supplies of grains and oilseeds in 2018 contributed to a fourth straight year of relatively weak agricultural commodity prices compared to previous years.97 U.S. soybean output and stocks were at record highs during 2018, putting downward pressure on soybean prices. Lower soybean prices contributed to lower corn prices during fall of 2018, as markets speculated that farmers would switch soybean acres to corn in 2019 (Figure 14).
|
Figure 14. U.S. Soybean Farm Prices In Nominal U.S. Dollars Per Bushels, January 2007-June 2019 |
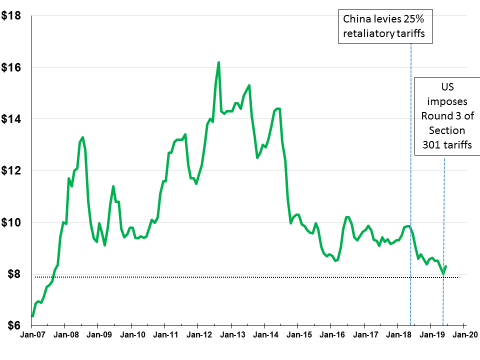 |
|
Source: USDA, National Agricultural Statistics Service (NASS), August 2019. |
On December 1, 2018, the White House released a statement saying that China had agreed to purchase "substantial amount of agricultural" goods, among other goods.98 This statement was followed by press reports at different times stating that China had announced it would buy additional U.S. soybeans.99 The reported Chinese commitments to purchase U.S. soybeans did not materialize, and soybean prices, which had been on a downward trajectory since early 2018, declined further in early 2019. Soybean farm prices reached a 12-year low point in May 2019 at $8.02 per bushel. This coincided with President Trump's threat to raise Section 301 tariffs, on U.S. imports from China, from 10% to 25% and to impose additional tariffs on all remaining imports from China not currently covered by Sections 301 measures. The tariff increases from 10% to 25% were effective May 10, 2019.100 The Trump Administration announced its intent to impose additional tariff increases of 10% on all other products currently not covered by Section 301 tariffs.101 China responded by asking its state-owned enterprises to halt purchases of U.S. agricultural goods,102 and by levying two additional sets of tariffs: 5% or 10% tariffs on U.S. imports, including 695 different U.S. agricultural tariff lines effective September 1, 2019; and another 5% or 10% tariffs on U.S. imports including 184 different U.S. agricultural tariff lines effective December 15, 2019.103
In 2018, the U.S. farm sector faced the challenge of declining exports and commodity prices for certain major field crops, in addition to rising operational costs. Various studies predicted that the imposition of U.S. Sector 232 tariffs on steel and aluminum, in tandem with the domestic content provisions of the USMCA, could increase the cost of production for U.S. farmers.104 A report released by the Association of Equipment Manufacturers states that the Trump Administration's Section 232 and Section 301 tariffs could hurt the U.S. economy by increasing consumer prices, including a 6% increase in the cost of manufacturing agricultural and construction equipment.105 U.S. agro-chemical manufacturers have also stated that cost increases, resulting from escalating tariffs, "of pesticide products for crop and turf protection products ultimately will be passed on to American growers and businesses."106
In a sector with relatively thin profit margins, small increases in costs associated with tariffs can sometimes lead to postponed equipment purchases, causing a ripple effect through the farm input sector. In 2019, several agricultural commodity prices remain under pressure from a record soybean and near-record corn harvest in 2018, diminished export prospects due to the ongoing trade dispute with China, and high levels of carryover stocks from the previous year.107
Potential Long-Run Implications
A shift in trade patterns can become permanent if trade disruptions lead to new trade alliances or stimulate production in retaliating domestic markets or other competing foreign regions, thus increasing supplies from new sources. An example of such long-term impact of a disruption in trade on U.S. farm exports is the 1980 U.S. embargo on grain exports to the Soviet Union, which resulted in declines in U.S. commodity prices and export sales.108 A significant effect of the embargo was that the United States lost market share in sales to the Soviet Union.109
Additionally, during the early 1970s, the United States imposed a partial embargo on the exports of soybeans, cottonseed, and certain other products as an inflation fighting measure. The U.S. soybean export embargo and high prices during this period reportedly prompted greater Japanese investments in Brazil's soybean industry, which has since become the U.S. soybean industry's major export competitor.110
As discussed in the section "Key Competitors for China's Agricultural Market," major agricultural exporters such as Brazil, Canada, Australia, and the EU have recently increased their farm exports to China. Additionally, countries such as Russia, Ukraine, some Central Asian countries, some Southeast Asian countries, and some African countries are seeking to establish and expand footholds in the Chinese market. For the latter group of countries, a prolonged U.S.-China trade war could facilitate their agricultural development and their share of global exports.
Assuming the continuation of retaliatory tariffs on U.S. soybeans, a USDA 10-year projection predicts that China's soybean imports would resume growing, but the volume of future soybean trade would be less than previously projected—122.8 million metric tons of Chinese imports from all origins with retaliatory tariffs in 2027 compared with 143 million metric tons of imports without retaliatory tariffs.111 With U.S. soybeans taxed by retaliatory tariffs, USDA projects that Brazil would likely account for two-thirds of the growth in global soybean exports to China. In comparison, the United States accounted for 35% of China's total soybean imports in 2017 and 18.5% in 2018, while Brazil accounted for 53% of China's total soybean imports in 2017 and 76% in 2018.112 For U.S. exporters, lower U.S. prices may stimulate additional demand by a number of countries, but these markets are not likely to absorb the entire volume displaced from China. The USDA report concludes that alternative export markets for U.S. soybeans can only absorb a fraction of the soybeans exported to China before trade tensions began, with imports in these countries growing by less than half of the reduction projected for Chinese soybean imports in 2027.
China is also investing in agricultural production in U.S. competitor markets and is improving access for products from these countries. Russia has pledged land to Chinese farmers and has made a commitment to increase its exports of agricultural products to China.113 While these commitments are still speculative, during the last two decades, Russian agriculture has moved toward greater product specialization and strategic investments have been made based on agro-ecological characteristics. As a result, Russian regional agricultural productivity growth has increased between 25% and 75%, with higher productivity growths in parts of southern Russia.114
According to Chinese import data, Russia made inroads into China's food and agricultural market in 2018, with market share increases compared to 2017 of 14% for soybean oil; 4% for wheat; 1% for corn; 0.3% for soybeans; 2% for oilseeds; and some increases in hay market shares, among others. China's imports of food and agricultural products from Russia increased 61% between 2017 and 2018 (Figure 15). China's imports of Russian cereals increased almost 400% during the same period, while oilseed imports grew 78%, fats and oils 72%, cocoa and related products 181%, beer 109%, and animal products 48%. While Russia's agricultural exports to China increased in 2018, the value of its shipments represented less than 1% of China's total agricultural product imports of $127 billion that year. Market watchers expect Russia will need years to become a major agricultural supplier to China.115
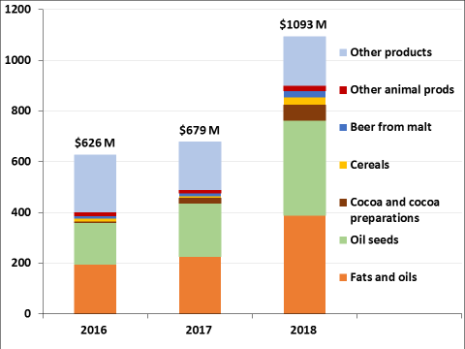
Globally, a USDA study reports that over 1,300 Chinese enterprises had overseas investments in agriculture, forestry, and fisheries valued at $26 billion in 2016.116 The investments include crop and livestock farming, fishing, processing, farm machinery, inputs, seeds, and logistics in over 100 countries. Most of China's foreign agricultural projects involve relatively small companies investing in neighboring countries in Southeast Asia, Russia's Far East, and Africa that have unexploited land and are often receptive to Chinese investment. China's agricultural investment decisions are linked to its "One Belt, One Road" initiative.117 Additionally, Chinese companies seeking sources of dairy, beef, and lamb imports have focused their investments and partnerships with New Zealand and Australia.
Since 2018, China has taken additional actions to reduce import-export taxes and duties to facilitate agricultural imports from non-U.S. sources, particularly for non-U.S. oilseeds and products (Box 6).118 Effective April 2019, value added taxes (VAT) on agricultural products were reduced to 9% from the original 11% or 17%. Starting January 1, 2019, reductions in customs duties, including MFN tariffs and temporary duty rates, were implemented for certain imported goods in order to boost imports and meet domestic demand. The temporary duty rates, which are even lower than the MFN tariffs, are in effect on 706 imported commodities, including some agricultural products.119 With retaliatory tariffs in place, U.S. agricultural exporters are unable to take full advantage of these improved terms of market access.
Estimated Economic Impacts
The following section provides examples of estimated economic impacts associated with retaliatory tariffs imposed on U.S. agricultural products by U.S. trading partners. These impacts are estimated at different scales by different studies, or are derived from market data. The examples are illustrative; they are not meant to be comprehensive.
Commodity Level
Various studies have estimated potential economic impacts arising from retaliatory tariffs on specific U.S. commodities (see Box 5 for general assumptions regarding these studies). For example, one study of short-term120 effects predicted U.S. farm prices would decrease in response to China's retaliatory tariffs, the value of U.S. exports to China would decline and U.S. farmers would reduce acreage planted the following year to soybeans, cotton, sorghum, and would reduce pork production, ultimately resulting in revenue declines for U.S. producers.121
A similar short-term impact analysis conducted by the Center for North American studies at Texas A&M University examined the impact on U.S. dairy of a 25% retaliatory tariff levied by Mexico on U.S. cheese imports and a 25% retaliatory tariff imposed by China on imports of U.S. dairy products.122 The study estimated export losses and pointed out that U.S. dairy exports are supported by a large infrastructure, including dairy farms, marketing cooperatives, and warehousing and processing facilities. Thus, the study concluded that any significant change in exports is likely to ripple through the supporting infrastructure and affect the general economy. In the case of Mexican tariffs on U.S. cheese, which Mexico removed in May 2019, the study estimated that U.S. economy-wide economic losses would be $991 million per year with nearly 5,000 lost jobs. In the case of Chinese tariffs on U.S. dairy imports, the study suggested that the economy-wide losses could total $2.8 billion per year and lead to over 13,000 jobs lost.
State Level
In September 2018, the Center for Agricultural and Rural Development (CARD) at Iowa State University estimated the short-run effects of the 2018 trade disruptions on the Iowa economy.123 This study incorporated the potential offsetting effects from USDA's trade-aid package.124 The study focused on the impact of foreign retaliatory tariffs125 on U.S. corn, soybean, hog, and ethanol markets along with labor and government revenue impacts from changes in these markets.126 It used a number of different modeling approaches that resulted in the following estimates of annual impact.
- The study estimated that Iowa's soybean industry would lose $159 million to $891 million, with an average revenue loss across all models of $545 million (Iowa soybeans are a $5.2 billion industry).
- The study estimated that Iowa's corn industry would lose $90 million to $579 million, with an average revenue loss across all models of $333 million (Iowa corn is an $8.5 billion industry).
- The study estimated that Iowa's pork/hog industry would lose $558 million to $955 million, with an average revenue loss across all models of $776 million (the Iowa pork/hog industry is a $7.1 billion industry).
- The study estimated that ethanol prices would drop 2%, resulting in approximately $105 million in lost revenues to Iowa ethanol producers (investors in the ethanol industry). The study points out that by mid-August 2018, corn prices retreated nearly 9% and ethanol prices receded by roughly 4%. Over the same period, corn futures for the 2018 crop declined 9% and ethanol futures declined 8%.
In the longer term (see Box 5 for definition), according to the Iowa State University study, revenue losses in these industries would translate into additional lost labor income across the state. The study estimates that labor income declines from the impacts to the corn, soybean, and hog industries would range from $366 million to $484 million without federal offsets from the trade-aid package, and $245 million to $364 million with federal offsets. Iowa tax revenue losses (personal income and sales taxes) would range from $111 million to $146 million annually. Federal offsets would reduce tax losses to $75 million to $110 million. The study estimates overall losses in Iowa's gross state product of $1 billion to $2 billion annually (out of a total of $190 billion).
Similarly, a study commissioned by the Nebraska Farm Bureau on the short-run economic costs in 2018 for the state from the retaliatory tariffs concluded that Nebraska's general economy would incur costs between $164 million and $242 million in lost labor income, along with the loss of 4,100 to 6,000 jobs.127 In total, together with the direct agriculture-related costs, Nebraska's overall economic loss in 2018 was estimated at $859 million to $1.2 billion. Retaliatory tariffs in 2018 (on corn, soybeans, and hogs from all retaliating countries) were expected to reduce corn prices by $0.14 to $0.21 per bushel, soybean prices by $0.95 to $1.54 per bushel, and hog prices by $17.81 to $18.80 per head. These estimated price declines would translate into farm revenue losses for each commodity of corn ($257 million to $327 million); soybeans ($384 million to $531 million); and pork ($111 million).
The Nebraska Farm Bureau updated its analysis in 2019 and concluded that the ongoing retaliatory tariffs imposed by countries on U.S. agricultural exports would cost Nebraska producers $943 million in lost revenues in 2019.128 The methodology used for the analysis borrowed USDA's estimates of gross damages that were used in calculating USDA's trade-aid payments. The estimated loss calculation did not take into consideration trade-aid payments that Nebraska farmers may receive in 2019.
Economists from University of California, Davis, found the short-run effects of the retaliatory tariffs on the 2018 crop for 10 selected specialty crops in four export markets—China, Mexico, Turkey, and India—to be $2.64 billion of lost export value and $3.34 billion of combined U.S. revenue losses.129 The crops considered are almonds, pecans, pistachios, walnuts, apples, oranges, raisins, sour cherries, sweet cherries, and table grapes. Mexico had retaliatory tariffs on apples and prepared fruit in 2018, but removed them in May 2019. India had identified apples, almonds, and walnuts for retaliatory tariffs in 2018 but did not implement these until June 2019.
National-Level Effects of Retaliatory Tariffs
|
Box 7. Global Trade Analysis Project (GTAP) Model Globally, most of the national and regional economic studies use a general equilibrium (GE) model, often the Global Trade Analysis Project (GTAP) model, and nearly all use the GTAP database—which is calibrated to the 2014 base period. Simulations made with GTAP determine changes in demand and supply of all goods and services and their prices in each region; changes in bilateral trade among all trading partners for all goods and services; changes in allocation of resources; and country-by-country changes in economic gains or losses among other outputs. This modeling framework assumes each trade policy scenario would remain in place for at least three to five years or until the market equilibrium stabilizes following the initial policy shock; thus, these are not short-run impacts. Analysis conducted at the national level examines U.S. import price shocks embedded in a multicountry, multisectoral model, which undergoes simulation until a new "market equilibrium" (where total supplies are equal to total demand) is reached. Since the analysis is embedded within a global model, the results can provide information on U.S. trading partners. Results from GE analyses are sensitive to the degree of price responsiveness displayed by import markets to substitute the source of an imported product (for example, the propensity of Chinese importers to substitute away from U.S. soybeans when the U.S. soybean price rises relative to prices from other potential sources, such as domestically produced Chinese soybeans or imports from other countries). The greater the responsiveness, the greater the change in market outcomes. When the parameter used to represent the propensity to substitute is changed, the size of the estimated impact can change. For more on the GTAP global consortium, model, data, and publications, see https://www.gtap.agecon.purdue.edu/. |
|
Economic welfare provides an estimation of how well individuals in an economy are doing. This takes into consideration the well-being of both the producers and the consumers. Economic welfare is considered to be optimized when competitive markets are in equilibrium, with supply meeting consumer demand. Competitive market conditions include transparent, easily accessible knowledge of market conditions by all participants; no barriers to entry or exit; relatively homogeneous goods; a large number of market participants, all of which behave rationally and are price takers; no externalities; and the absence of intrusive government regulation. For more on this topic see, Paul Krugman and Robin Wells, Microeconomics, 2nd ed. (New York: Worth Publishers, 2009). |
Two studies conducted by researchers at Purdue University, using the Global Trade Analysis Project (GTAP) model (see Box 7), examined the potential long-run impacts of retaliatory tariffs on U.S. agriculture and the U.S. economy at the national level. As discussed in the box "Key Economic Terms," the long-run effects are estimated assuming that the shock to the market, such as tariff increases, remains in place for a few years and sufficient time has passed to provide producers the opportunity to make changes in response to this shock. The studies discussed below assume that the retaliatory tariffs remain in place for three to five years.
The first study estimated the long-run effects (defined in Box 7 as 3-5 years) of a 25% tariff imposed by China on soybeans and other selected U.S. agricultural products—wheat, corn, sorghum, rice, rapeseed, and beef.130 This study concluded that U.S. soybean market losses in China would, over the years, benefit Brazil. Given the U.S. soybean industry's large share of China's import market prior to the retaliatory tariffs, the study estimated large price declines and export losses for U.S. soybeans. Other commodities in the study appeared less dependent on the Chinese market, and the estimated losses are relatively smaller. The study predicted that overall economic welfare (see Box 8) for both the United States and China would decline, while economic welfare for Brazil would increase.
The second study examined a scenario in which the USMCA would be implemented but the retaliatory tariffs related to Section 232 steel and aluminum tariffs would also exist.131 The study looked at two separate cases for retaliatory tariffs: (1) retaliatory tariffs were considered only for Mexico and Canada; and (2) retaliatory tariffs from all countries were considered.
This study estimated, in 2014 dollars, a net increase in annual U.S. agricultural exports of $450 million under USMCA, which is equal to about 1% of U.S. agricultural exports under NAFTA—$41 billion in 2014. It projected the export losses from the retaliatory tariffs imposed by Canada and Mexico to be $1.8 billion per year (in 2014 dollars), which would more than offset the projected export gain of $450 million from USMCA. When retaliatory tariffs from all countries were considered, export losses were estimated at around $8 billion. Note that both Canada and Mexico have removed their retaliatory tariffs since May 2019.
A study conducted by economists at Iowa State University examines the national-level effects of retaliatory tariffs imposed on U.S. pork, soybeans, corn, and wheat by China and Mexico during 2018.132 Note that Mexico removed the retaliatory tariffs in May 2019. The study simulates multiyear projections over a period of nine years. The study indicates that if the retaliatory tariffs were to continue, U.S. annual exports would decline by 30% for pork and corn, 15% for soybeans, and 1.5% for wheat compared with a baseline scenario that considers the average of the past three-year period. The study estimated that in the short run (which the paper defines as first three years with retaliatory tariffs), trade losses would translate to 26,000 job reductions on average annually in the United States and a decline in labor income of $1.5 billion due to a $5.3 billion reduction in national annual output. In the long run (defined by the paper as year seven through year nine with retaliatory tariffs), the annual impacts were estimated to grow to nearly 60,000 fewer jobs, $3.1 billion less labor income, and a loss of almost $12 billion in national output.
Global-Level Effects
The United Nations Conference on Trade and Development (UNCTAD) performed a global analysis of the U.S. Section 232 and Section 301 tariffs and the resulting retaliatory tariffs, including retaliatory tariffs on U.S. agricultural products.133 The analysis mainly focused on U.S.-China tariff escalation. Regarding agriculture, the study points out that China accounts for more than half of the global imports of soybeans and that the United States is the world's largest soybean producer. The study states that the Chinese tariffs on U.S. soybeans have substantially disrupted world trade of this commodity and observes that increased Chinese demand has resulted in higher prices for Brazilian soybeans. It cautions that while higher price premiums could be beneficial in the short run to Brazilian producers, they may hamper Brazilian procurers' long-run competitiveness. In a situation where the size and amount of the tariffs and their duration are unclear, Brazilian producers may be reluctant to make investment decisions that may turn unprofitable if tariffs are removed. Moreover, Brazilian firms using soybeans as inputs (e.g., feed for livestock) may lose competitiveness because of higher input prices.
A USDA study released in 2019 found that the United States and Brazil are among the lowest-cost producers of soybeans.134 While land rental costs and labor costs are higher in the United States, poor soils and tropical ecology require Brazil to use higher levels of agrochemicals. Moreover, the United States has a transportation advantage over Brazil in exporting agricultural products to China. Specifically, the study concluded that transporting soybeans by truck from northern Mato Grosso to Brazil's primary soybean export port of Paranaguá cost $93 per metric ton (MT) in 2017. During the same period, transporting soybeans from Davenport, Iowa, to the Gulf of Mexico by truck, rail, and barge cost $65 per MT. Shipping soybeans by truck and rail from Sioux Falls, South Dakota, to the U.S. Pacific Northwest cost $68 per MT.135 The United States, therefore, has lower transportation costs and greater production efficiency (requiring less agrochemicals) compared with Brazil in producing and shipping agricultural products to Asian markets. According to the study, the current trade dispute and retaliatory tariffs may, in the long run, lead to inefficient allocation of resources and exploitation of less-productive lands than those in the United States.
Some Possible Benefits to U.S. Agriculture
Based on economic principles, if the price of an input such as soybeans or feed corn declines, the livestock sector would be expected to benefit. USDA's Economic Research Service's production expenses report states that the cost of livestock feed declined 1% between 2017 and 2018; however, it is expected to increase 4.5% in 2019.136 Additionally, the U.S. livestock sector is also facing retaliatory tariffs. Similarly, many processed food products that use raw agricultural products as inputs face Chinese retaliatory tariffs.
Some sectors may nevertheless benefit from retaliatory tariffs. For example, the Coalition for a Prosperous America (CPA) released a study stating that a permanent across-the-board 25% tariff on all imports from China would stimulate GDP growth and jobs in the U.S. economy.137 The study uses data from Boston Consulting Group that are not publicly available, and the publicly available working paper does not describe the Regional Economic Models, Inc. (REMI model) or the assumptions underlying the model.138 Regarding agriculture, the study states that when the USDA trade-aid programs are incorporated "into the model, the additional government spending fully offsets the negative impact of the Chinese retaliation on US GDP."
In addition to the CPA study, there have been anecdotal reports in the media that organic and small-holder farmers are benefiting from China's retaliatory tariffs.139
U.S. Stakeholder Views on Retaliatory Tariffs
In May 2019, American Farm Bureau Federation President Zippy Duvall stated that, "Retaliatory tariffs are a drag on American farmers and ranchers at a time when they are suffering more economic difficulty than many can remember," and urged negotiators to continue their work toward reopening markets with the European Union, China, and Japan.140 The president of the National Farmers Union (NFU) echoed the same sentiment, stating that the retaliatory tariffs "could not come at a worse time for family farmers and ranchers, who are already coping with depressed commodity prices, environmental disasters, and chronic oversupply." The NFU president further stated that although temporary relief is appreciated, "temporary solutions are not sufficient to address the permanent damage the trade war has inflicted on agricultural export markets."141
Various U.S. agricultural commodity groups have voiced similar concerns. For example, the American Soybean Association expressed "extreme disappointment" over USTR's escalating tariffs on China that led to retaliatory tariffs on soybeans.142 The National Pork Producers Council (NPPC) stated that the retaliatory tariffs are "threatening the livelihoods of thousands of U.S. pig farmers."143 Due to African Swine Fever (ASF), China normally would have turned to the United States to meet its pork demand.144 With retaliatory tariffs in place, U.S. pork is more expensive than products from other sources in the Chinese market. NPPC Vice President Nick Giordano stated that from a U.S. farmer's perspective, China's increased demand for imported pork resulting from ASF in Chinese hogs would have been "the single greatest sales opportunity in our industry's history." According to a report in the South China Morning Post, Iowa State University economist Dermot Hayes estimates that the trade dispute with China has cost American pig farmers $8 per animal, or $1 billion in total losses.145 The U.S. Dairy Export Council, in turn, stated in 2018 that the retaliatory tariffs that China and Mexico imposed could result in billions of dollars of lost sales for U.S. dairy producers.146
A study released by the Association of Equipment Manufacturers states that tariffs on steel and aluminum have increased cost of agricultural production due to rising prices of farm equipment and their parts.147 In a comment filed with USTR, CropLife America and a specialty chemical trade group, Responsible Industry for a Sound Environment (RISE), state that cost increases, resulting from escalating tariffs, "of pesticide products for crop and turf protection products ultimately will be passed on to American growers and businesses."148
Dozens of stakeholder panels provided testimony to the USTR during hearings in June 2019 regarding a proposed notice to begin imposing additional tariffs of 25% to virtually all remaining imports from China.149 Hundreds of U.S. companies and industry groups, including some of the largest companies argued that, "both sides will lose" in a protracted trade war. "Tariffs are taxes paid directly by U.S. companies, including those listed below—not China," stated a letter signed by more than 600 companies, including the Association of Equipment Manufacturers, American Bakers Association, Grocery Manufacturers Association, Juice Products Association, Distilled Spirits Council of the United States, and many other food retailers and associations related to the food industry.150
On June 21, 2019, hundreds of domestic producers and four manufacturing and labor groups sent a letter to President Trump urging him to maintain his hardline approach to China. The letter was signed by the Coalition for a Prosperous America, which includes mainly nonagricultural manufacturing companies and some food- and agriculture-related small companies like the Platt Cattle Company of Arizona and Johanna Foods of New Jersey.151
To help alleviate the losses from the retaliatory tariffs, USDA announced a second round of trade aid in 2019.152 Most industry groups welcomed this package but indicated their preference for trade rather than aid.153 American Farm Bureau Federation President Zippy Duvall stated, "It is critically important to restore agricultural markets and mutually beneficial relationships with our trading partners around the world."154 Similar sentiments were expressed by a number of other major agricultural trade associations, such as the National Council of Farmer Cooperatives, the American Soybean Association, the National Cotton Council, the National Milk Producers Federation, and the National Pork Producers Council. For its part, the National Association of Wheat Growers stated that the trade-aid package "is a Band-Aid when we really need a long-term fix."155
Issues for Congress
In May 2019, President Trump proposed levying additional tariff increases on imports from China,156 but they were held in abeyance following a meeting between President Trump and Chinese President Xi Jinping at the G-20 summit in June 2019.157 However, President Trump stated on August 2019 that he would impose a tariff hike increase on all other Chinese products currently not covered by Section 301 tariffs. China responded by asking its state-owned enterprises to halt purchases of U.S. agricultural goods.158 On August 13, 2019, USTR released the remaining list of Chinese products that would be levied a 10% Section 301 tariff effective September 1, 2019, and another list of products that would be levied 10% Section 301 tariffs effective December 15, 2019.159 China in turn has retaliated by levying additional two sets of tariffs: 5% or 10% tariffs on U.S. imports, including 695 different U.S. agricultural tariff lines effective September 1, 2019; and another 5% or 10% tariffs on U.S. imports including 184 different U.S. agricultural tariff lines effective December 15, 2019.160
Given the length of the trade dispute over Section 232 and Section 301 actions and the expanding list of U.S. exports affected by the retaliatory tariffs, the list of affected sectors is also expanding. A June 2019 USTR hearing for Section 301 tariffs included a diversity of witnesses across 55 panels over a seven-day period.161 As such, an issue for congressional consideration may be whether compensation for the losses arising from the various trade disputes should extend beyond those producers of agricultural commodities identified in the Administration's trade-aid initiative. USDA, using its authority under the CCC, is administering this assistance. Retaliatory tariffs have arguably affected businesses beyond the farm gate, including agricultural exporters, input suppliers, agricultural shippers, and others, potentially raising the question of whether these industries merit government compensation for tariff-related losses.
Separately, some agricultural stakeholders have questioned the equity of the distribution of the 2018 trade aid payments. Once the formula became public, several commodity groups questioned the rationale for determining payments based on "trade damage" rather than the broader "market loss" measure.162 Similar questions163 have emerged about the 2019 trade-aid package.164 These questions concern the methodology used to calculate the payment rates, commodity coverage of the direct payments, and the equity of payments across regions and commodity sectors.
The provision of trade aid has also raised questions regarding U.S. commitments under the WTO and other international agreements. Several WTO members, including the EU, Canada, Australia, New Zealand, India, and Ukraine, have asked for more details regarding USDA's trade-aid package to ascertain whether it could be considered market-distorting under U.S. WTO commitments.165
Given the growth of investments directed to increase agricultural productivity in many countries including Russia, and the recent gains that Russia, Brazil, and other countries have made in China's import market for agricultural products, it may be of interest to Congress to consider whether current policies are sufficient for U.S. agriculture to continue to expand its overseas markets.
As other countries expand their agricultural production to meet China's import demand, studies by environmental groups caution that this agricultural expansion may occur at the expense of tropical forest and fragile habitats that are essential to maintain global biodiversity.166 The United States is one of the most efficient and lowest-cost producers of food and agricultural products.167 Congress may want to consider whether the current trade dispute could have long-term environmental costs as less productive or more environmentally vulnerable areas are cultivated for agricultural production in lieu of more efficient and less environmentally sensitive U.S. production.168
Appendix.
|
|
|
Tariff Rate |
||
|
Product |
Tariff line |
MFNa |
Sept.-2018b |
June-2019c |
|
Corn |
10059000 |
1% in-quota, |
26% in-quota, |
26% in-quota, |
|
Soybeans |
12019010 and 12019020 |
3% |
28% |
28% |
|
Wheat |
10011900 and 10019900 |
1% in-quota, |
26% in-quota, |
26% in-quota, |
|
Rice |
100610 (all grain types) |
1% in-quota, |
26% in-quota, |
26% in-quota, |
|
Sorghum |
10079000 |
2% |
27% |
27% |
|
Oats |
11041200 |
20% |
30% |
40% |
|
Barley |
100390 |
3% |
3% |
3% |
|
Cotton |
52010 |
1% in-quota, |
26% in-quota, |
26% in-quota, |
|
Peanut (in shell and shelled) |
12024100, and 12024200 |
15% |
20% and 25% |
25% and 35% |
|
Dairy |
Ch. 4 HS, except honey |
Range 2-20%, |
Range 25-40%, |
Range 25-40%, |
|
Honey (and products) |
040900 |
15% (and 20%) |
40% (and 45%) |
40% (and 45%) |
|
Beef and products |
02011-02023 |
Range 12-25%, Average 15.5% |
Range 37-50%, |
Range 37-50%, |
|
Pork and products |
02031 and 02032 |
Range 12-22%, Average 16% |
Range 37-70%, |
Range 37-70%, |
|
Poultry and products |
0207 all HS lines |
Range 3-20%, |
Range 28-45%, |
Range 28-45%, |
|
Other animal products |
All Ch. 5 |
Range 2-20%, |
Range 12-45%, |
Range 20-45%, |
|
Live trees, plants and cut flowers |
HS lines in Ch. 6 |
Range 10-23%, Average 14% |
Range 20-33%, |
Range 30-48%, |
|
Vegetables, roots and tubersd |
HS lines in Ch. 7 |
Range 0-13%, |
Range 25-38%, |
Range 25-38%, |
|
Fruit and nuts |
HS lines in Ch. 8 |
Range 0-30%, |
Range 25-70%, |
Range 25-70%, |
|
Coffee, tea and spices |
HS lines in Ch. 9 |
Range 5-20%, |
Range 15-30%, |
Range 20-45%, |
|
Other oil seeds and oleaginous fruits |
HS 12 except peanuts, soybeans |
Range 0-30%, |
Range 11-40%, |
Range 20-55%, |
|
Plant saps and extracts |
HS lines in Ch. 13 |
Range 0-20%, |
Range 10-30%, |
Range 18-45%, |
|
Vegetable plaiting material |
HS lines in Ch. 14 |
Range 4-15%, |
Range 20-29%, |
Range 29-35%, |
|
Fats and oils |
HS lines in Ch. 15 |
Range 5-30%, |
Range 15-40%, |
Range 20-55%, |
|
Prepared meat, fish and seafood |
HS lines in Ch. 16 |
5% |
Range 15-25%, |
Range 15-30%, |
|
Sugars |
HS 1701 lines |
15% in-quota, |
20-25% in-quota, |
25-40% in-quota, |
|
Sugar confectionery |
Other HS lines in Ch. 17 |
Range 8-30%, |
Range 15-40%, |
Range 20-55%, |
|
Cocoa and preparations |
HS lines in Ch. 18 |
Range 2-22%, |
Range 12-32%, |
Range 20-47%, |
|
Cereal, flour, starch, milk preparations |
HS lines in Ch. 19 |
Range 2-10%, |
Range 7-35%, |
Range 12-35%, |
|
Vegetables, fruit and nuts preparations |
HS lines in Ch. 20 |
Range 5-30%, |
Range 15-55%, |
Range 15-55%, |
|
Miscellaneous edible preparations |
HS lines in Ch. 21 |
Range 10-25%, Average 14% |
Range 15-37%, |
Range 20-50%, |
|
Nonalcoholic beverages |
HS lines 2201 and 2202 |
5% |
Range 20-30%, |
Range 25-30%, |
|
Food residues and feed |
HS lines in Ch. 23 |
Range 0-5%, |
Range 7-30%, |
Range 12-30%, |
|
Essential Oils |
HS lines in Ch.33 |
Range 5-20%, |
Range 15-30%, |
Range 15-30%, |
|
Hides and skins |
4101, 4102 and 4103 |
Range 5-9%, |
Range 10-17%, |
Range 10-30%, |
|
Wool |
51011100 and 51031010 |
1% in-quota, 38% over-quota |
11% in-quota, |
26% in-quota, |
|
Animal hair |
HS 5103 lines |
9% |
Range 9-34%, |
34% |
|
Cotton waste |
HS 5202 lines |
10% |
35% |
35% |
Source: CRS calculation based on USDA, Foreign Agricultural Service (FAS), "China Raises Tariffs on U.S. Agricultural Products," GAIN Report Number: CH19030, May 17, 2019; American Farm Bureau Federation, "China Tariff List," May 9, 2019, based on several FAS GAIN reports; and data from Market Access Map (MAcMAp), International Trade Center, https://marketanalysis.intracen.org/loc/Default.aspx.
Notes: HS refer to Harmonized Standard tariff code, and Ch. refers to a chapter from the U.S. Harmonized Tariff Schedule. Average tariffs are reported in simple averages, and not in trade-weighted averages. Note that on August 23, 2019, China further retaliated by levying additional two sets of tariffs: 5% or 10% tariffs on U.S. imports, including 695 different U.S. agricultural tariff lines effective September 1, 2019, and another 5% or 10% tariffs on U.S. imports including 184 different U.S. agricultural tariff lines effective December 15, 2019.
a. MFN tariff rates are tariff rates that WTO members levy on imports from other WTO members, excluding those with whom a preferential trade agreement may exist.
b. Applied tariff rates on U.S. products as of September 2018 include MFN tariff plus any existing retaliatory tariffs as a result of U.S. Section 301 and Section 232 tariffs on U.S. imports of Chinese products.
c. Applied tariffs rate on U.S. products as of June 2019 include the total existing applied tariffs as of September 2018 plus any additional tariffs China levied in retaliation for U.S. implementation of increases in Section 301 tariffs announced on May 10, 2019, from 10% tariff to 25% on a range of Chinese imports of goods.
d. Many tariff lines saw 5% or 10% tariff increases in June 2019 from existing retaliatory tariffs in September 2018. Thus while the range did not change in June 2019, the average tariff levels changed. For example, the categories: "Vegetables, roots and tubers," "Fruit and nuts," and "Vegetables, fruit and nut preparations."
Author Contact Information
Footnotes
| 1. |
For more information, see CRS Insight IN10943, Escalating U.S. Tariffs: Timeline; and CRS Insight IN10971, Escalating U.S. Tariffs: Affected Trade. |
| 2. |
For more information, see CRS Report R45249, Section 232 Investigations: Overview and Issues for Congress. |
| 3. |
Section 301 of the Trade Act of 1974 allows the United States Trade Representative (USTR) to suspend trade concessions or impose restrictions if it determines a U.S. trading partner is violating trade commitments or engaging in discriminatory or unreasonable practices that burden or restrict U.S. commerce. CRS Insight IN10943, Escalating U.S. Tariffs: Timeline. |
| 4. |
Office of U.S. Trade Representative (USTR), "Notice of Modification of Section 301 Action: China's Acts, Policies, and Practices Related to Technology Transfer, Intellectual Property, and Innovation," May 9, 2019. |
| 5. |
USTR, "USTR Announces Next Steps on Proposed 10 Percent Tariff on Imports from China," August 13, 2019. |
| 6. |
Yang, Y. and A. Zang, "China Tells Companies to Stop Buying U.S. Agricultural Goods," Financial Times, August 5, 2019. |
| 7. |
USDA, FAS, "China Announces Increases to Additional Tariffs," GAIN Report Number: CH19051, August 28, 2019. |
| 8. |
India, Immediate Notification Under Article 12.5 of the Agreement on Safeguards to the Council for Trade in Goods of Proposed Suspension of Concessions and other Obligations Referred to in Paragraph 2 of Article 8 of the Agreement on Safeguards, World Trade Organization (WTO) May 18, 2018. |
| 9. |
84 Federal Register 26323, May 31, 2019. |
| 10. |
Palmer, D. "Trump Ends Trade Benefits for India, Raising Tariffs on Billions in Imports," Politico, May 31, 2019. |
| 11. |
The Government of India, The Gazette of India, Part II, Section 3, Number 357, Customs Notification No. 16/2019, June 15, 2019. |
| 12. |
USTR, "United States Announces Deal with Canada and Mexico to Lift Retaliatory Tariffs," Press Release, May 17, 2019. |
| 13. |
USDA, Foreign Agricultural Service (FAS), "Turkey Reduces Additional Levies on U.S. Products," GAIN Report Number: TR9012, May 22, 2019. On June 1, 2018, the United States began applying 25% steel and 10% aluminum tariffs on Turkish imports under Section 232. These tariffs were doubled on August 10, 2018. In response to U.S. action, Turkey had increased its retaliatory tariffs, which it halved when the United States reduced its tariffs in May 2019. See CRS In Focus IF10961, U.S.-Turkey Trade Relations. |
| 14. |
Rada et al. "Productivity Growth and the Revival of Russian Agriculture," ERR Number 228, USDA, Economic Research Service (ERS), April 2017; and Wang, S. et al., "China's Regional Agricultural Productivity Growth in 1985-2007: A Multilateral Comparison," Agricultural Economics, March 2013, no. 44, 2013, pp. 241-251. |
| 15. |
Gooch and Gale, "China's Foreign Agriculture Investments," Economic Information Bulletin, Number 192, USDA, ERS, April 2018; and Chen et al., China-Africa Agricultural Modernization Cooperation: Situation, Challenges and the Path Ahead, International Food Policy Research Institute, 2018. |
| 16. |
Unless otherwise identified, agricultural and food products considered for the retaliatory tariffs include most of chapters 1 to 24 of the U.S. Harmonized Tariff Schedule (HTS), which cover meat, grains, animal feed, dairy, horticultural products, processed foods, unprocessed tobacco, seafood, and alcoholic beverages; and also include essential oils in chapter 33; animal hides and skins in chapters 41 and 43; and silk, cotton, and wool in chapters 50, 51, and 52. Fishery products (chapters 3 and parts of 16) and forest products (chapter 44) are not included in this report. |
| 17. |
United States International Trade Commission (USITC), Official Harmonized Tariff Schedule, 2019, https://www.usitc.gov/tata/hts/index.htm. |
| 18. |
Note that the Chinese retaliatory tariffs discussed in this report covers those that were levied from April 2018 through June 2019. Additional retaliatory tariffs of 5% or 10% are effective September 1, 2019, on U.S. imports, including 695 different U.S. agricultural tariff lines; and another 5% or 10% tariffs on U.S. imports will become effective December 15, 2019, including 184 different U.S. agricultural tariff lines. For more see, USDA, FAS, "China Announces Increases to Additional Tariffs," GAIN Report Number: CH19051, August 28, 2019. |
| 19. |
USDA, FAS, "China Responds to U.S. 301 Announcement with Revised Product List," GAIN Report Number: CH 18034, June 21, 2018. |
| 20. |
Ibid. |
| 21. |
USDA, FAS, "China Implements Supplemental Imports Tariffs on U.S. Products Exported to China," GAIN Report Number: CH18061, September 25, 2018. |
| 22. |
USDA, FAS, "Revised: China Raises Tariffs on U.S. Agricultural Products," GAIN Report Number: CH19030, May 17, 2019. |
| 23. |
Staring September 1, 2019, China will increase retaliatory tariffs on some agricultural products. See, Zumbrun, J. "Latest Round in Trade War Set to Hit U.S. Vehicles, Agriculture," Wall Street Journal, August 23, 2019. |
| 24. |
USDA, FAS, "The Phasing In Of Mexican Retaliatory Tariffs," GAIN Report Number: MX8028, July 11, 2018. |
| 25. |
USDA, FAS, "Canada Announces Final List of Ag Products in Response to U.S. Tariffs," GAIN Report Number: CA18046, June 29, 2018. |
| 26. |
For more information on this issue, see CRS Report R45661, Agricultural Provisions of the U.S.-Mexico-Canada Agreement. |
| 27. |
USTR, "United States Announces Deal with Canada and Mexico to Lift Retaliatory Tariffs," Press Release, May 17, 2019. |
| 28. |
USDA, FAS, "EU Imposes Additional Tariffs on U.S. Products," GAIN Report Number: E18045, June 21, 2018. |
| 29. |
USDA, FAS, "Turkey Introduces New Additional Levy on U.S. Products," GAIN Report Number: TR8018, June 28, 2019. |
| 30. |
White House, "Presidential Proclamation Adjusting Imports of Steel Into the United States," August 10, 2018. For more information, also see CRS In Focus IF10961, U.S.-Turkey Trade Relations. |
| 31. |
USDA, FAS, "Turkey Announces Second Round of Additional Levies on U.S. Products," GAIN Report Number: TR8024, August 15, 2018. |
| 32. |
USDA, FAS, "Turkey Reduces Additional Levies on U.S. Products," GAIN Report Number: TR9012, May 22, 2019. |
| 33. |
India, Immediate Notification Under Article 12.5 of the Agreement on Safeguards to the Council for Trade in Goods of Proposed Suspension of Concessions and other Obligations Referred to in Paragraph 2 of Article 8 of the Agreement on Safeguards, WTO, May 18, 2018. |
| 34. |
China has also imposed retaliatory tariffs, ranging between 5%-25%, on U.S. fishery and forestry products. U.S. fishery and forestry exports are not covered in this report. |
| 35. |
All trade statistics in this reported are provided on a calendar-year basis, January-December. |
| 36. |
China Customs Statistics, http://english.customs.gov.cn/Statistics/Statistics?ColumnId=7. |
| 37. |
Government of Canada, Statistics Canada, https://www.ic.gc.ca/eic/site/tdo-dcd.nsf/eng/Home. |
| 38. |
Data from Mexico National Institute of Statistics. |
| 39. |
Data from EuroStat, https://ec.europa.eu/eurostat/data/database. |
| 40. |
Data from Turkey Statistical Institute, http://www.turkstat.gov.tr/Start.do. |
| 41. |
USDA, FAS, "Turkey Reduces Additional Levies on U.S. Products," GAIN Report Number: TR9012, May 22, 2019. |
| 42. |
The Government of India, The Gazette of India, Part II, Section 3, Number 357, Customs Notification No. 16/2019, June 15, 2019. |
| 43. |
Government of India, Department of Commerce, Export Import Data Bank, https://commerce-app.gov.in/eidb/icomq.asp. |
| 44. |
The data in Table 2 does not include alcoholic beverages, inclusion of which could alter the percentage change in U.S. exports between 2017 and 2018 to the retaliatory countries. |
| 45. |
All U.S. agricultural export data discussed in this section are from the U.S. Census Trade Data. |
| 46. |
Chinese customs data, accessed via Global Trade Atlas, August 2019. |
| 47. |
U.S. Census Bureau Trade data, accessed June 5, 2019, at https://apps.fas.usda.gov/gats/default.aspx. |
| 48. |
K. Plume, "U.S. Soybean Exports Scrapped as China Shifts to Brazilian Beans," Reuters, May 18, 2018. |
| 49. |
Marchant, M.A., and H.H. Wang, 2018, "Theme Overview: U.S.–China Trade Dispute and Potential Impacts on Agriculture," Choices, Quarter 2, http://www.choicesmagazine.org/choices-magazine/theme-articles/us-china-trade-dispute-and-potential-impacts-to-agriculture/theme-overview-uschina-trade-dispute-and-potential-impacts-on-agriculture. |
| 50. |
Zhou et al., "Evaluating Potential Long-Run Impacts of Chinese Tariff on U.S. Soybeans," Farmdoc Daily, (8):79, September 26, 2018. |
| 51. |
White House, "Statement from the Press Secretary Regarding the President's Working Dinner with China," Press Release, December 1, 2018. |
| 52. |
Ibid. |
| 53. |
Gale et al., "Interdependence of China, United States, and Brazil in Soybean Trade," OCS-19F-01, Figure 19, page 32, USDA, ERS, June 2019. |
| 54. |
Free on Board (FOB) prices include the cost of getting the good to the nearest port and loading onto the ship. |
| 55. |
Gale et al., "Interdependence of China, United States, and Brazil in Soybean Trade," OCS-19F-01, USDA, ERS, June 2019. |
| 56. |
The data discussed in this section are China Customs Data accessed from Global Trade Atlas, July 2019. |
| 57. |
Gale et al., "Interdependence of China, United States, and Brazil in Soybean Trade," OCS-19F-01, USDA, ERS, June 2019; and Fuchs et al, "U.S.-China Trade War Imperils Amazon Rainforest," Nature, Vol. 567 March 28, 2019, pp. 451-454. |
| 58. |
United Nations Conference on Trade and Development (UNCTAD), Key Statistics and Trends in Trade Policy, 2018, https://news.un.org/en/story/2019/02/1031921; Fuchs et al., "U.S.-China Trade War Imperils Amazon Rainforest," Nature, Vol. 567, pp. 451-454. |
| 59. |
F. Bermingham, "China and Russia Vow To 'Deepen Trade In Soybeans' After Tariff War Kills U.S. Crop Exports," South China Morning Post, July 18, 2019; S. Zheng, "Russia offers 2.5 million acres of land to Chinese farmers, but will it ease Beijing's soybean shortage?" South China Morning Post, August 15, 2018; RT, "Russia to double global food exports, ready to replace US agricultural products in China," June 7, 2019; A. Medetsky and M, Durisin, "China Turns to Russia in Search to Replace U.S. Soybeans," Bloomberg, November 7, 2018. |
| 60. |
Kitanaka, A. and J. Rogers "Russia Can't Satisfy China's Soybean Needs Amid U.S. Trade War," Bloomberg News, August 19, 2019; and Rappeport, A. and K, Bradsher, "As U.S, China Trade War Escalates, American Farm Goods are Targeted Again," Farm Policy News, August 25, 2019. |
| 61. |
U.S. Census trade data provide U.S. exports to and imports from other countries, but data on China's trade with countries other than the United States are available from Chinese customs data. For more on this issue, see CRS Report RS22640, What's the Difference?—Comparing U.S. and Chinese Trade Data. |
| 62. |
For example, T. Grove and Kurmanaev, A., "A Surprise Winner From the U.S.-China Trade Spat: Russian Soybean farmers," Wall Street Journal, February 21, 2019; S. Zheng, "Russia offers 2.5 million acres of land to Chinese farmers, but will it ease Beijing's soybean shortage?" South China Morning Post, August 15, 2018; RT, "Russia To Double Global Food Exports, Ready To Replace US Agricultural Products In China," June 7, 2019. |
| 63. |
Kitanaka, A. and J. Rogers "Russia Can't Satisfy China's Soybean Needs Amid U.S. Trade War," Bloomberg News, August 19, 2019; and Rappeport, A. and K, Bradsher, "As U.S, China Trade War Escalates, American Farm Goods are Targeted Again," Farm Policy News, August 25, 2019. |
| 64. |
F. Bermingham, "China and Russia Vow To 'Deepen Trade In Soybeans' After Tariff War Kills U.S. Crop Exports," South China Morning Post, July 18, 2019. |
| 65. |
Zhou et al., "Dispatches from the Trade Wars," Farmdoc Daily, (8):162, August 29, 2018. |
| 66. |
For example, Gale et al, Interdependence of China, United States, and Brazil in Soybean Trade, OCS-19F-01, USDA, ERS, June 2019; Zheng et al.,"Predicting Potential Impacts of China's Retaliatory Tariffs on the U.S. Farm Sector," Choices, Quarter 2, 2018; http://www.choicesmagazine.org/choices-magazine/theme-articles/us-china-trade-dispute-and-potential-impacts-to-agriculture/predicting-potential-impacts-of-chinas-retaliatory-tariffs-on-the-us-farm-sector; Ribera et al., "Estimated Economic Impacts of Retaliatory Tariffs by China and Mexico on U.S. Dairy Products," CNAS Report 2018-3, September 2018; http://cnas.tamu.edu/; Balistreri et al., "The Impact of the 2018 Trade Disruptions on the Iowa Economy," CARD Policy Briefs, 18-PB 25, CARD, Iowa State University, September 2018, https://www.card.iastate.edu/products/publications/synopsis/?p=1281; Rempe, Jay, Whittney Kelley, and Oscar Díaz, "Nebraska Agriculture & International Trade," Nebraska Farm Bureau, December 3, 2018, https://www.nefb.org/; and Sumner, D. A. and T. M. Hanon, "Economic Impacts of Increased Tariffs that have Reduced Import Access for U.S. Fruit and Tree Nuts Exports to Important Markets," University of California Agricultural Issues Center and Department of Agricultural and Resource Economics, UC Davis, August 1, 2018, https://aic.ucdavis.edu/2018/08/08/new-tariffs-tax-economic-prospects-of-tree-nut-and-fruit-industries. |
| 67. |
K. Plume, "U.S. Soybean Exports Scrapped as China Shifts to Brazilian Beans," Reuters, May 18, 2018; and Gale et al, Interdependence of China, United States, and Brazil in Soybean Trade, OCS-19F-01, USDA, ERS, June 2019. |
| 68. |
As discussed in Box 4, U.S agricultural exports data reported by the U.S. Census Bureau and China's imports of U.S. agricultural products reported by Chinese customs data do not generally match. For example, total U.S. soybean exports to China in 2018 were $3 billion based on U.S. Census trade data, which is lower than the total Chinese soybean imports of $7 billion based on Chinese customs data. Note that the Chinese customs data reports $2 billion ($5.7 billion) less imports for the period September to December 2017 than reported in U.S. exports by the U.S. Census data ($7.7 billion). This difference could partly be the result of shipments that had not yet reached China, and partly because the two countries value shipments differently as explained in Box 4. |
| 69. |
In nominal, inflation un-adjusted, dollars. Based on U.S. Census trade data. |
| 70. |
Bloomberg News, "China Allows Some Tariff-Free U.S. Cotton, Pork Purchases," July 26, 2019. |
| 71. |
Yang, Y. and A. Zang, "China Tells Companies to Stop Buying U.S. Agricultural Goods," Financial Times, August 5, 2019. |
| 72. |
CRS calculation using Chinese customs data accessed via Global Trade Atlas, August 2019. |
| 73. |
Chinese customs data accessed via Global Trade Atlas, August 2019. |
| 74. |
Ibid. |
| 75. |
Note, the lag in decline in Chinese imports staring in June 2018 could be the result of shipments that were already underway when China announced its retaliatory tariffs in response to U.S. Section 232 tariffs in April 2018. |
| 76. |
Bloomberg News, "China Allows Some Tariff-Free U.S. Cotton, Pork Purchases," July 26, 2019. |
| 77. |
Yang, Y. and A. Zang, "China Tells Companies to Stop Buying U.S. Agricultural Goods," Financial Times, August 5, 2019. |
| 78. |
USDA's definition of pork includes HS codes 020311, 020312, 020319, 020321, 020322, 020329, 021011, 021012, 021019, 160241, 160242, and 160249. |
| 79. |
For more on this issue, see CRS In Focus IF11215, African Swine Fever (ASF). |
| 80. |
USDA, FAS, "China Livestock and Products Semi-annual Specter of African Swine Fever Casts Pall Over Year of the Pig; Beef Imports Benefit," GAIN Report Number: CH19006, March 11, 2019. |
| 81. |
Shuping, N. and S.Yang, "China Allows Some Tariff-Free U.S. Cotton, Pork Purchases," Bloomberg News, July 26, 2019. |
| 82. |
Yang, Y. and A. Zang, "China Tells Companies to Stop Buying U.S. Agricultural Goods," Financial Times, August 5, 2019. |
| 83. |
USDA, FAS, "China Announces Increases to Additional Tariffs," GAIN Report Number: CH19051, August 28, 2019. |
| 84. |
China Customs Data accessed from Global Trade Atlas, September 2019. According to National Milk Producers Federation the dairy category includes HS lines in 0401, 0402, 0403, 0404, 0405, 0406, 170211, 170219, 190110, 190190, 210500, 350110, 350190, 350220, 151790, 170490, 180620, 180632, 180690, 190110, 190120, 190190, 210690, 220290, 230990, and 350400. |
| 85. |
China Customs Data accessed from Global Trade Atlas, September 2019. |
| 86. |
USDA, FAS, "China Announces Increases to Additional Tariffs," GAIN Report Number:CH19051, August 28, 2019. |
| 87. |
Chinese customs data, accessed via Global Trade Atlas, August 2019. |
| 88. |
Ibid. |
| 89. |
Sumner, D.A. and W.A. Mathews, "International Trade Prospects and Potential Impact on Forage Crops, Including the Farm Bill," University of California, Davis, November 13, 2018. |
| 90. |
Chinese customs data, accessed from Global Trade Atlas in August 2019. Data includes HS codes 12141000 and 12149000. |
| 91. |
Sumner, D.A. et al., "Losses for Pistachios from Retaliatory Tariffs and Related Measures," University of California, Davis, October 17, 2018. |
| 92. |
Sumner, D. A. and T. M. Hanon, "Economic Impacts of Increased Tariffs that have Reduced Import Access for U.S. Fruit and Tree Nuts Exports to Important Markets," University of California Agricultural Issues Center and Department of Agricultural and Resource Economics, UC Davis, August 1, 2018, https://aic.ucdavis.edu/2018/08/08/new-tariffs-tax-economic-prospects-of-tree-nut-and-fruit-industries. |
| 93. |
Houck, J. P., Elements of Agricultural Trade Policies, 1992, Waveland Press Inc, Prospect Heights, Illinois. |
| 94. |
CRS analysis of monthly U.S. soybean exports, using U.S. Census Data, from January 2014 to April 2019 indicate this pattern. |
| 95. |
Yang, Y. and A. Zang, "China Tells Companies to Stop Buying U.S. Agricultural Goods," Financial Times, August 5, 2019. |
| 96. |
USDA, FAS, "China Announces Increases to Additional Tariffs," GAIN Report Number: CH19051, August 28, 2019. |
| 97. |
For more on this issue, see CRS Report R45697, U.S. Farm Income Outlook for 2019. |
| 98. |
White House, "Statement from the Press Secretary Regarding the President's Working Dinner with China," December 1, 2018. |
| 99. |
Jared, G. "Statement From the Press Secretary Regarding the President's Working Dinner with China," Talk Business and Politics, February 25, 2019; and Tausche, K., "Trump Wants China to 'Double or Triple' Its Offer to Buy US Goods in Trade Negotiations, Sources Say," CNBC, March 21, 2019. |
| 100. |
USTR, "Statement by U.S. Trade Representative Robert Lighthizer on Section 301 Action," Press Release, May 10, 2019; for more information also see CRS Insight IN10943, Escalating U.S. Tariffs: Timeline. |
| 101. |
USTR, "USTR Announces Next Steps on Proposed 10 Percent Tariff on Imports from China," Press Release, August 13, 2019. |
| 102. |
Yang, Y. and A. Zang, "China Tells Companies to Stop Buying U.S. Agricultural Goods," Financial Times, August 5, 2019. |
| 103. |
USDA, FAS, "China Announces Increases to Additional Tariffs," GAIN Report Number: CH19051, August 28, 2019. |
| 104. |
For example, Burfisher et al., NAFTA to USMCA: What is Gained?, IMF Working Paper, WP/19/73, March 2019; Joseph W. Glauber, The Emperor's New NAFTA, FARE Share Newsletter, February 2019; Jeffrey J. Schott, PIIE, October 2, 2018, https://piie.com/blogs/trade-investment-policy-watch/mexico-canada-and-united-states-step-backwards-trade-and investment. |
| 105. |
IHS Markit, "The Economic and Industry Impact of Protectionism Tariffs on the Off-Highway Equipment Sector," March 2019. |
| 106. |
CropLife America and Rise, Comments Filed with the U.S. Trade Representative (USTR) Regarding 84 Federal Register 22564, June 17, 2019, http://www.croplifeamerica.org/public-comments. |
| 107. |
For a discussion of what declining commodity prices, rising input costs, and weakening export prospects mean for U.S. farm income, see CRS Report R45697, U.S. Farm Income Outlook for 2019. |
| 108. |
For more information on this issue, see CRS Report No. 80-14 ENR, The U.S. Embargo of Agricultural Exports to the Soviet Union: Agricultural Impact, November 21, 1980. |
| 109. |
USDA, ERS, Embargoes, Surplus Disposal, and U.S. Agriculture: A Summary, Agriculture Information Bulletin No. 503, November 1986, p. 1. |
| 110. |
Morgan, D. The Merchants of Grain, 1979, Viking Press. |
| 111. |
Gale et al, Interdependence of China, United States, and Brazil in Soybean Trade, OCS-19F-01, USDA, ERS, June 2019. |
| 112. |
Chinese customs data accessed via Global Trade Atlas, August 2019. |
| 113. |
S. Zheng, "Russia Offers 2.5 Million Acres of Land to Chinese Farmers, but Will It Ease Beijing's Soybean Shortage?" South China Morning Post, August 15, 2018; Yap, C. "China, Russia Prepare $2 Billion Agricultural Investment Fund," Wall Street Journal, May 8, 2015; and Grove, T. and A. Kurmanaev, "A Surprise Winner From the U.S.-China Trade Spat: Russian Soybean Farmers," Wall Street Journal, February 21, 2019. |
| 114. |
Rada et al, "Agricultural Recovery in Russia and the Rise of Its South," Amber Waves, USDA, ERS, April 25, 2017. |
| 115. |
Kitanaka, A. and J. Rogers "Russia Can't Satisfy China's Soybean Needs Amid U.S. Trade War," Bloomberg News, August 19, 2019; and Rappeport, A. and K, Bradsher, "As U.S, China Trade War Escalates, American Farm Goods are Targeted Again," Farm Policy News, August 25, 2019. |
| 116. |
Gooch and Gale, "China's Foreign Agriculture Investments," Economic Information Bulletin, Number 192, USDA, ERS, April 2018. |
| 117. |
China's "One Belt, One Road" initiative is its foreign policy and economic strategy to connect Asia with Africa and Europe via land and maritime networks along six corridors with the aim of improving regional integration, increasing trade and stimulating economic growth. For more information on this issue, see CRS In Focus IF10273, China's "One Belt, One Road". |
| 118. |
Dezan, Shira and Associates, "Import-Export Taxes and Duties in China," China briefing, June 11, 2019. While the United States is not excluded from the general benefits associated with most of the reductions in China's market access barriers, the existence of retaliatory tariffs are a disadvantage to U.S. agricultural exports. |
| 119. |
This includes products from HTS chapters 4, 5, 8, 12, 13, 14, 15, 18, 19, 21, 22, 23, 24, 52 and 53, accessed at http://gss.mof.gov.cn/zhengwuxinxi/zhengcefabu/201812/P020181221619891346040.pdf. |
| 120. |
As defined in Box 5, short-tern effects generally indicate effects related to a single crop year. |
| 121. |
Zheng et al., "Predicting Potential Impacts of China's Retaliatory Tariffs on the U.S. Farm Sector," Choices, Quarter 2, 2018; http://www.choicesmagazine.org/choices-magazine/theme-articles/us-china-trade-dispute-and-potential-impacts-to-agriculture/predicting-potential-impacts-of-chinas-retaliatory-tariffs-on-the-us-farm-sector. |
| 122. |
Ribera et al., "Estimated Economic Impacts of Retaliatory Tariffs by China and Mexico on U.S. Dairy Products," CNAS Report 2018-3, September 2018; http://cnas.tamu.edu/. |
| 123. |
Balistreri et al., "The Impact of the 2018 Trade Disruptions on the Iowa Economy," CARD Policy Briefs, 18-PB 25, CARD, Iowa State University, September 2018; https://www.card.iastate.edu/products/publications/synopsis/?p=1281. |
| 124. |
For more information on this issue, see CRS Insight IN11126, New Round of Farm Trade Aid Proposed by Administration for 2019. |
| 125. |
The study includes all retaliatory tariffs existing in 2018. Note that the retaliatory tariffs implemented by Mexico and Canada were removed in May 2019. |
| 126. |
The CARD study used a general equilibrium input-output modeling system (IMPLAN). The model controls for the effects of 2018's large corn and soybean harvests before estimating the effects of the tariffs on commodity prices. |
| 127. |
Nebraska Farm Bureau, "A Path Forward on Trade Retaliatory Tariffs and Nebraska Agriculture," December 6, 2018, https://www.nefb.org/newsroom/news-releases/1391-report-finds-1-billion-hit-to-nebraska-from-retaliatory-tariffs-farm-bureau-offers-path-forward-on-trade. This study used a general equilibrium model (IMPLAN, similar to the CARD model of footnote 123) of the Nebraska economy focusing on the impact of retaliatory tariffs on corn, soybeans, and hogs. Beef and ethanol—two major agricultural products of Nebraska—were not included. The model controls for the effects of 2018's large corn and soybean harvests before estimating the effects of the tariffs on commodity prices. |
| 128. |
Nebraska Farm Bureau, "Farm Bureau Estimates Tariff Related Losses Cost Nebraska Farmers Nearly $1 Billion in 2019," September 3, 2019, https://nefb.org/newsroom/news-releases/1902-farm-bureau-estimates-tariff-related-losses-cost-nebraska-farmers-nearly-1-billion-in-2019. |
| 129. |
Sumner, D. A. and T. M. Hanon, "Economic Impacts of Increased Tariffs that have Reduced Import Access for U.S. Fruit and Tree Nuts Exports to Important Markets," University of California Agricultural Issues Center and Department of Agricultural and Resource Economics, UC Davis, August 1, 2018; https://aic.ucdavis.edu/2018/08/08/new-tariffs-tax-economic-prospects-of-tree-nut-and-fruit-industries. |
| 130. |
Taheripour, F. and W. Tyner, "Impacts of Possible Chinese Protection of 25 Percent on U.S. Soybeans and Other Agricultural Commodities," supported by U.S. Soybean Export Council, GTAP Working Paper No. 83, Purdue University, Department of Agricultural Economics, April 2018. |
| 131. |
Chepeliev et al., "How U.S. Agriculture Will Fare Under the USMCA and Retaliatory Tariffs," commissioned by the Farm Foundation, GTAP Working Paper No. 84, Purdue University, Department of Agricultural Economics, October 2018. |
| 132. |
Elobeid, A. et al., "Analysis of the Effects of Chinese and Mexican Retaliatory Tariffs on Select U.S. Agricultural Commodities on U.S. and Global Markets," Selected Paper prepared for presentation at the 2019 Agricultural & Applied Economics Association, Annual Meeting, Atlanta, GA, July 21–July 23, 2019. This uses the IMPLAN model and not the GTAP model. |
| 133. |
United Nations Conference on Trade and Development (UNCTAD), Key Statistics and Trends in Trade Policy: 2018, UNCTAD/DITC/TAB/2019/1, 2019. |
| 134. |
Gale et al, Interdependence of China, United States, and Brazil in Soybean Trade, OCS-19F-01, USDA, ERS, June 2019. |
| 135. |
Ibid. Also note that U.S. grain and oilseed exporters have a $25 to $28 per MT advantage in moving produce from farm to port. With respect to ocean freight rates, the Pacific Northwest has a small advantage ($27.50 per MT) over both Brazil ($33 per MT.) and the U.S. Gulf ($42 per MT). |
| 136. |
USDA, ERS, "Farm Income and Wealth Statistics, Production Expenses," August 2019, https://data.ers.usda.gov/reports.aspx?ID=17834. |
| 137. |
Ferry, J., "Update: Across-the-Board Tariffs on China with Retaliation and Federal Spending Create Over 1 Million Jobs in Five Years, Working Paper, August 14, 2019. |
| 138. |
Note that the other models discussed in the report such as GTAP or IMPLAN use data and models that are extensively documented and accessible to the public. |
| 139. |
For example, Reuters, "America's Garlic Capital on Trade War: 'We'd Love The Tariffs to Stay For Ever'," May 21, 2019. |
| 140. |
American Farm Bureau Federation, "Farm Bureau Statement on Lifting of Agricultural Tariffs," May 17, 2019. |
| 141. |
Moritz-Rabson, "Farm Union President Calls Trump's Proposed $15 Billion Subsidy an Insufficient, 'Temporary' Solution," Newsweek, May 13, 2019. |
| 142. |
ASA, "Soy Growers Disappointed in Additional Tariffs, Continue to Seek Export Stability with Largest Customer," press release, July 12, 2018. |
| 143. |
NPPC, "China Tariffs on U.S. Pork Now Tops 60 Percent; American Pork Producers Face Financial Crisis," Press Release, July 6, 2018. |
| 144. |
For more information on this issue, see CRS In Focus IF11215, African Swine Fever (ASF). |
| 145. |
L. Crampton with K. Elmer, "Trump Tariffs Crush U.S. Pig Farmers," South China Morning Post, June 19, 2019. |
| 146. |
U.S. Dairy Export Council, "Chinese and Mexican Tariffs Will Cost Dairy Industry Billions If Left Unchecked," Press Release, August 27, 2018. |
| 147. |
IHS Markit Economics and Country Risk, " The Economic and Industry Impact of Protectionism Tariffs on the Off-Highway Equipment Sector," released by the Association of Equipment Manufacturers, March 21, 2019; and Burfisher et al., NAFTA to USMCA: What is Gained? IMF Working Paper, WP/19/73, March 2019. |
| 148. |
CropLife America and Rise, Comments Filed with the U.S. Trade Representative (USTR) Regarding 84 Federal Register 22564, June 17, 2019, http://www.croplifeamerica.org/public-comments. |
| 149. |
USTR, Public Hearings on Proposed Section 301 Tariff List, Press Release, June 14, 2019; and D. Palmer and A. Kimbel-Sannit, "Companies Plead with Trump against New China Tariffs," Politico, June 17, 2019. |
| 150. |
Tariffs Hurt The Heartland, "661 U.S. Companies and Associations Urge Administration to Avoid Tariff Escalation, Reach Resolution with China," June 13, 2019, https://tariffshurt.com/news/661-u-s-companies-and-associations-urge-administration-to-avoid-tariff-escalation-reach-resolution-with-china. |
| 151. |
Coalition for a Prosperous America, "Country First Letter," June 21, 2019, https://www.prosperousamerica.org/more_than_600_u_s_companies_sign_letter_in_support_of_trump_s_tariffs. |
| 152. |
For more on this see, CRS Report R45865, Farm Policy: USDA's 2019 Trade Aid Package; and also see USDA, "USDA Announces Support for Farmers Impacted by Unjustified Retaliation and Trade Disruption," Press Release, May 23, 2019. |
| 153. |
The Hagstrom Report, "Farm Groups Praise Trade Aid With Some Caveats," Vol. 9, No. 153, July 26, 2019. |
| 154. |
American Farm Bureau Federation, "Farm Bureau Welcomes Trade Assistance, Urges Return to Open Markets," July 25, 2019. |
| 155. |
National Association of Wheat Growers, "NAWG Responds to USDA's Announcement on Another Round of MFP Payments for Farmers," Press Release, July 25, 2019. https://www.wheatworld.org/release-nawg-responds-to-usdas-announcement-on-another-round-of-mfp-payments-for-farmers/; and The Hagstrom Report, "Farm Groups Praise Trade Aid With Some Caveats," Vol. 9, No. 153, July 26, 2019. |
| 156. |
For more on this issue, see CRS Insight IN10971, Escalating U.S. Tariffs: Affected Trade. |
| 157. |
D. J. Lynch and D. Paletta, "U.S. and China Agree to Restart Trade Negotiations Following Meeting Between Trump and Xi at Group of 20 Summit," Washington Post, June 29, 2019. |
| 158. |
Yang, Y. and A. Zang, "China Tells Companies to Stop Buying U.S. Agricultural Goods," Financial Times, August 5, 2019. |
| 159. |
USTR, "USTR Announces Next Steps on Proposed 10 Percent Tariff on Imports from China," August 13, 2019. |
| 160. |
USDA, FAS, "China Announces Increases to Additional Tariffs," GAIN Report Number: CH19051, August 28, 2019. |
| 161. |
USTR, "Public Hearings on Proposed Section 301 Tariff List," Press Release, June 14, 2019. |
| 162. |
For more information on this issue, see CRS Report R45310, Farm Policy: USDA's 2018 Trade Aid Package. |
| 163. |
For examples, see CRS Report R45865, Farm Policy: USDA's 2019 Trade Aid Package. |
| 164. |
USDA, "USDA Announces Details of Support Package for Farmers," Press Release No. 0114.19, July 25, 2019. |
| 165. |
National Grain and Feed Association, "WTO Nations Question Legality of U.S. Disaster Aid and Trade-Disruption Assistance Payments," Agricultural Policy Newsletter, June 20, 2019. |
| 166. |
PBS, "How the U.S.-China Trade War Could Damage the Amazon Rainforest," March 27, 2019; Mangan, E., "Forests Could Be Casualties in a U.S.-China Trade War," World Resources Institute, March 14, 2018. |
| 167. |
Meade et al., "Corn and Soybean Production Costs and Export Competitiveness in Argentina, Brazil, and the United States," Economic Information Bulletin No. 154, USDA, ERS, June 2016; and Ikerd J.E., "Sustaining the Profitability of Agriculture," In Economist's Role in the Agricultural Sustainability Paradigm, University of Missouri, 1996, http://web.missouri.edu/ikerdj/papers/AAE-SASA.htm. |
| 168. |
Fuchs et al., "U.S.-China Trade War Imperils Amazon Rainforest," Nature, Vol. 567, pp. 451-454. |