China’s Retaliatory Tariffs on U.S. Agriculture: In Brief
From 2010 through 2016, China was the top destination for U.S. agricultural exports based on value. In 2017, Canada became the top destination for U.S. agricultural products, and China and Mexico tied for second. However, starting in early 2018 the United States undertook several trade actions against China (and other countries) that precipitated retaliatory trade actions between the two countries. The result of this trade war was a decline in trade between the United States and China. In 2018, U.S. agricultural exports to China declined 53% in value to $9 billion from $19 billion in calendar year 2017. By mid-2019, China’s market had shrunk to become the fourth-largest destination for U.S. agricultural exports behind Canada, Mexico, and Japan.
The U.S.-China trade dispute started in March 2018, when President Trump announced tariffs of 25% on steel and 10% on aluminum imports (with some flexibility on the application of tariffs by country) using presidential powers granted under Section 232 of the Trade Expansion Act of 1962. In July 2018, citing concerns over China’s policies on intellectual property, technology, and innovation, the Trump Administration imposed tariffs of 25% on $34 billion of selected imports from China using authority delegated by Section 301 of the Trade Act of 1974. Since then, the United States has expanded the coverage of Section 301 tariffs to $550 billion of imports from China.
Contents
- Overview
- China's Retaliatory Tariffs on U.S. Agricultural Imports
- Effects of Retaliatory Tariffs on U.S. Agriculture
- Issues for Congress
Figures
Overview
From 2010 through 2016, China was the top destination for U.S. agricultural exports based on value.1 In 2017, Canada became the top destination for U.S. agricultural products, and China and Mexico tied for second. However, starting in early 2018 the United States undertook several trade actions against China (and other countries) that precipitated retaliatory trade actions between the two countries.2 The result of this trade war was a decline in trade between the United States and China. In 2018, U.S. agricultural exports to China declined 53% in value to $9 billion from $19 billion in calendar year 2017. By mid-2019, China's market had shrunk to become the fourth-largest destination for U.S. agricultural exports behind Canada, Mexico, and Japan.
The U.S.-China trade dispute started in March 2018, when President Trump announced tariffs of 25% on steel and 10% on aluminum imports (with some flexibility on the application of tariffs by country) using presidential powers granted under Section 232 of the Trade Expansion Act of 1962.3 In July 2018, citing concerns over China's policies on intellectual property, technology, and innovation, the Trump Administration imposed tariffs of 25% on $34 billion of selected imports from China using authority delegated by Section 301 of the Trade Act of 1974.4 Since then, the United States has expanded the coverage of Section 301 tariffs to $550 billion of imports from China.5
|
Types of Import Restrictions Tariff is a customs duty levied on imported goods and services. Quota is a restriction on the total allowable amount of imports based on the quantity or value of goods imported. Tariff-rate quota involves a two-tiered tariff scheme in which imports within an established quota are levied lower rates of tariffs, and imports beyond the quota face higher over-quota tariff rates. |
China has retaliated with tariffs on a wide range of U.S. imports, including agricultural products. In April 2018, China levied retaliatory tariffs of 15% or 25% on imports from the United States, including 94 different U.S. food and agricultural tariff lines. These tariff lines mostly included pork, fruit, and tree nuts. In July 2018, China expanded the 25% retaliatory tariffs to 697 tariff lines in total. By September 1, 2019, the number of U.S. agricultural tariff lines with Chinese retaliatory tariffs increased to 1,053. China has proposed expanding and increasing tariffs on December 15, 2019, which would bring the total to 1,084.6
During 2018 and 2019, the United States and China have taken a number of actions to escalate the trade dispute. This report provides a timeline of U.S. action and Chinese retaliation on U.S. agricultural products (Table 1). It also provides a broad overview of Chinese retaliatory tariffs on U.S. agricultural products as of September 2019 and the proposed additional Chinese tariffs that may be in effect by December 2019. It concludes with key issues for Congress to consider.
|
Date |
Trade Action |
|
March 2018 |
|
|
April 2018 |
|
|
July 2018 |
|
|
August 2018 |
|
|
September 2018 |
|
|
May 2019 |
|
|
June 2019 |
|
|
August 2019 |
|
|
September 2019 |
|
Source: See CRS Insight IN10943, Escalating U.S. Tariffs: Timeline; U.S. Department of Agriculture, Foreign Agricultural Service, GAIN Report Numbers: CH19051, CH18018, CH18034, CH18047, CH18052, CH18061, CH18070, and CH19030; USTR, "USTR Statement on Section 301 Tariff Action Regarding China," press release, August 23, 2018; Government of China, "Notice of the Customs Tariff Commission of the State Council on the Trial Implementation of the Exclusion of Customs and Tariffs for the United States and Canada," announcement of the Taxation Committee (2019) No. 2, September 11, 2019; D. J. Lynch and A. Fifield, "Trump Delays Increase in Tariffs on Chinese Goods by Two Weeks as a Gesture of Good Will," Washington Post, September 11, 2019; Z. Xin, "China to Exempt U.S. Pork and Soybeans from Additional Trade War Duties, in Response to Trump's Tariff Delay," South China Morning Post, September 13, 2019.
Notes: China had levied retaliatory tariffs on 697 agricultural tariff lines by July 2018 and on 1,053 agricultural tariff lines by September 1, 2019.
a. As of September 19, 2019, CRS communication with U.S. the American Soybean Association (ASA) and the U.S. Meat Export Federation (USMEF) indicate that China's process of exempting retaliatory tariffs on U.S. imports is "murky." Industry representatives do not have a clear knowledge of which Chinese company is involved in purchasing U.S. products and to what extent the retaliatory tariffs will be waived. There are some questions about whether "U.S. exporters may be reimbursed for the retaliatory tariffs," but there is uncertainty regarding whether the exemption applies to additional retaliatory tariffs or all retaliatory tariffs. Both ASA and USMEF point out that the Chinese retaliatory tariffs have not been officially removed.
China's Retaliatory Tariffs on U.S. Agricultural Imports
When merchandise enters a U.S. port of entry, it is classified, and tariffs are assessed using the U.S. Harmonized Tariff Schedule (HTS), a compendium of tariff rates based on a globally standardized nomenclature.7 At the global level, the Harmonized System (HS), established by the World Customs Organization, is the standardized nomenclature for the classification of products. It allows participating countries to classify traded goods on a common basis for customs purposes. The HS codes are standard up to six digits, the most detailed level that can be compared internationally. Beyond six digits, countries can introduce national distinctions for tariffs and for other purposes. The U.S. HTS code agrees with the HS code at the six-digit level but may vary from other countries at eight-digit levels or higher.
The first two digits of the HS code denote a product chapter. The World Trade Organization (WTO) defines agricultural products comprised of tariff lines in chapters 1-24 (excluding chapter 3 and parts of chapter 16 that comprise fish products) and some tariff lines of chapters 29, 33, 35, 38, 41, 43, 50, 51, 52 and 53 (Table 2).8
Table 2. World Trade Organization (WTO) Definition of Agriculture
Harmonized System (HS) Chapters (CH.) and Their Descriptions
|
Chapter |
Description |
Chapter |
Description |
|
CH.1 |
Live animals |
CH. 20 |
Preparations of vegetables, fruit, and nuts |
|
CH. 2 |
Meat, edible offals |
CH. 21 |
Miscellaneous edible preparations |
|
CH. 4 |
Dairy, eggs and honey |
CH. 22 |
Beverages, spirits and vinegar |
|
CH. 5 |
Other animal products |
CH. 23 |
Residues and waste from the food industries |
|
CH. 6 |
Live trees, plants, planting material, flowers |
CH. 24 |
Tobacco and manufactured tobacco substitutes |
|
CH. 7 |
Vegetables, roots and tubers |
CH. 29* |
Mannitol and sorbitol |
|
CH. 8 |
Fruit and tree nuts |
CH. 33* |
Essential oils |
|
CH. 9 |
Coffee, tea, maté and spices |
CH. 35* |
Albuminoidal substances, modified starches, glues |
|
CH. 10 |
Cereals, grains |
CH. 38* |
Dyes and sorbitol |
|
CH. 11 |
Products of milling industry |
CH. 41* |
Hides and skins |
|
CH. 12 |
Oil seeds and oleaginous fruits |
CH. 43* |
Raw fur |
|
CH. 13 |
Lac, gums, resins, saps, and extracts |
CH. 50* |
Raw silk and silk waste |
|
CH. 14 |
Vegetable plaiting materials |
CH. 51* |
Wool and animal hair |
|
CH. 15 |
Animal or vegetable fats and oils |
CH. 41* |
Hides and skins |
|
CH. 16* |
Preparation of meats (excludes fish, seafood) |
CH. 52* |
Cotton |
|
CH. 17 |
Sugars and sugar confectionery |
CH. 52* |
Cotton |
|
CH. 18 |
Cocoa and cocoa preparations |
CH. 53* |
Flax and hemp |
|
CH. 19 |
Preparations of cereals |
|
|
Source: WTO, Analytical Index, Agreement on Agriculture, Article 2, Annex 1, 1995.
Notes: * denotes that only a portion of the chapter is defined as agricultural products. Chapter 3 and parts of chapter 16 are fish products and are not included in agricultural products.
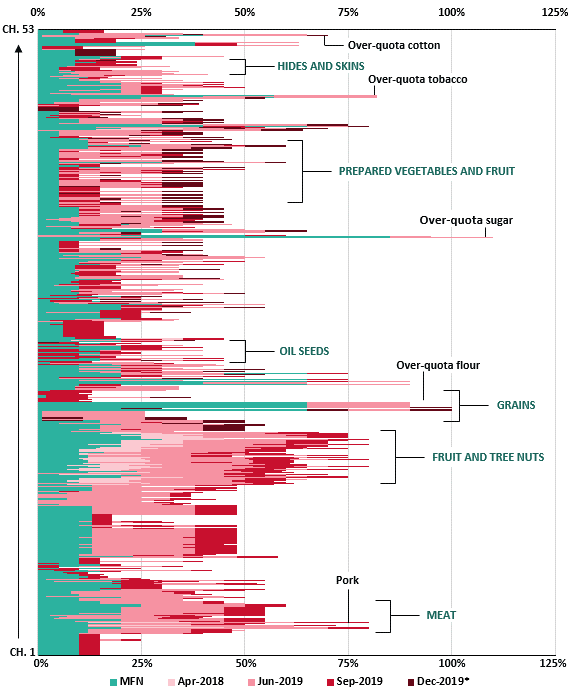
Figure 1 presents a snapshot of Chinese retaliatory tariffs on all U.S. agricultural products, including the 1,053 tariff lines as of September 2019. WTO most-favored nation (MFN) tariffs (teal in Figure 1) are the tariff rates that WTO members levy on imports from other WTO members, excluding those with whom a preferential trade agreement may exist. In Figure 1, HS chapters are along the vertical axis with chapter 1 on the bottom and chapter 53 on top of the chart. The chapters are distributed unevenly along the axis. For example, chapter 1 (live animals) includes 39 tariff lines, chapter 2 (meat products) 51 tariff lines, and chapter 7 (vegetables) 120 tariff lines, contrasted with 7 tariff lines from chapter 52 (cotton).
|
Figure 1. Chinese Retaliatory Tariffs on U.S. Agriculture 1,084 Tariff Lines Effective September 2019 and Proposed for December 2019 |
 |
|
Source: FAS, "China Announces Increases to Additional Tariffs," August 28, 2019. Notes: U.S. agricultural products include the WTO definition of agriculture as presented in Table 2; CH = chapter; MFN = most-favored nation tariff rates that WTO members levy on imports from other WTO members, excluding those with whom a preferential trade agreement may exist; Apr-2018 = retaliatory tariffs imposed in response to U.S. Section 232 action in April 2018 covering 94 tariff lines; Jun-2019 = summation of retaliatory tariffs imposed in July 2018, September 2018, and June 2019 (covering 1,053 tariff lines); Sep-2019 = includes all existing tariffs as of June 2019 and additional tariffs imposed in September 2019; Dec-2019* = tariffs proposed by China on U.S. agricultural imports to be implemented on December 15, 2019. Labels are intended to capture general categories of agricultural products. Placement may not be exact. |
The retaliatory tariffs that China has levied on U.S. agricultural products starting in April 2018 (pink and red) are increases to MFN tariff rates. The additional retaliatory tariffs on 184 tariff lines proposed to become effective on December 15, 2019, are brown. The total number of agricultural tariff lines with retaliatory tariffs could be 1,084 in December 2019.
A few spikes noted on the retaliatory tariffs are on over-quota tariff rates on products for which China maintains tariff-rate quotas (TRQs).9 These products have high levels of MFN tariffs. With the exception of these products with TRQs, products on which tariffs were levied both in April 2018 (light pink) and since July 2018 (dark pink) are higher than for other products. Chinese retaliatory tariffs levied in September are in red. As seen in Figure 1, pork products and fruit and tree nuts face the highest levels of retaliatory tariffs. China originally levied retaliatory tariffs on these products in April 2018 in response to U.S. Section 232 action. China levied retaliatory tariffs on these products again in response to U.S. Section 301 actions starting in July 2018.
Effects of Retaliatory Tariffs on U.S. Agriculture
Since 2018, several international trade disputes—the most impactful being the one with China—have affected the U.S. agricultural sector's trade outlook.10 The U.S. Department of Agriculture (USDA) projects total U.S. agricultural exports at $134 billion in FY2019, down 6.2% from $143.4 billion in FY2018.11 According to USDA, China's imports of U.S. agricultural products were $16 billion in FY2018 and are forecast to decline to $7.3 billion in FY2019 as a result of the U.S.-China trade dispute.12 The forecast decline in China's imports accounts for most of the reduction in FY2019 total U.S. agricultural exports. In FY2019, U.S. agricultural imports are projected at $129.3 billion, an increase of 1.4%. This would result in an agricultural trade surplus of $5.2 billion, which would be the lowest since 2006.13
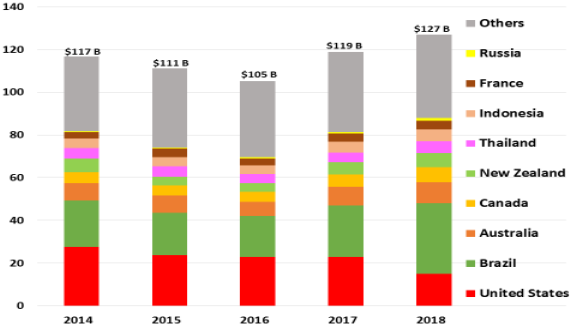
According to Chinese customs data (reported on a calendar basis), China's imports of agricultural products rose, in nominal terms, from $117 billion in 2014 to $127 billion in 2018. The share from the United States declined from 24% in 2014 to 12% in 2018 (Figure 2).14 Key information from Figure 2 is presented below.
- In 2014, the United States was the largest source of Chinese agricultural imports, accounting for nearly a quarter, or $28 billion, of China's total imports.
- Since 2017, Brazil overtook the United States as China's largest agricultural supplier.
- Since the imposition of the retaliatory tariffs on U.S. imports in 2018, U.S. agricultural shipments to China declined to $15 billion as overall Chinese imports increased to $127 billion.15
|
Figure 2. China's Imports of Agricultural Products, 2014-2018 In Nominal Billions (B) of U.S. Dollars |
 |
|
Source: Chinese customs data accessed from Global Trade Atlas, July 2019. Notes: The chart uses WTO's definition of agriculture. See Table 2. Import values are not adjusted for inflation. |
- In 2016, when China's total agricultural imports were $105 billion—the lowest point between 2014 and 2018—U.S. market share was 21%. In 2018, when China's total agricultural imports were at $127 billion, U.S. market share was 12%. During the same period, Brazil's market share grew from 18% in 2016 to 26% in 2018.
- In 2018, the following countries increased their exports to China:
- Brazil increased its shipments of soybeans, cotton, tobacco, pork, and certain oilseeds.
- Australia increased its shipments of cotton, sorghum, pulses, fruit and nuts, dairy, and hides and skins.
- Canada increased its shipments of feed and fodder products, hides and skins, and wheat.
- New Zealand increased its shipments of dairy and hides and skins.
- Thailand increased its shipments of fruit, nuts, and starches and malt.
- Indonesia increased its shipments of fats and oils.
- Other countries—such as Russia, Ukraine, and countries from Central Asia, South and Southeast Asia, and Africa—increased their exports of food and agricultural products to China during 2018 compared with 2017. China's wheat imports from Kazakhstan grew 34%, and corn imports from Ukraine rose 20%.
Lower U.S. exports combined with abundant domestic and international supplies of grains and oilseeds suggest a fifth straight year of relatively weak U.S. agricultural commodity prices in 2019.16 These factors, coupled with the continuation of U.S.-China trade dispute, have contributed to uncertainties regarding farm income in the short run,17 which triggered a second round of USDA trade aid package to the farm sector in 2019.18
In the long run,19 a shift in trade patterns can become permanent if trade disruptions lead to new trade alliances or stimulate production in retaliating domestic markets or other competing foreign regions, thus increasing supplies from new sources. China has been investing in agricultural production in U.S. competitor markets and is improving access for products from these countries.20 Globally, a USDA study reports that over 1,300 Chinese enterprises had overseas investments in agriculture, forestry, and fisheries valued at $26 billion in 2016.21 The investments include crop and livestock farming, fishing, processing, farm machinery, inputs, seeds, and logistics in over 100 countries.
Issues for Congress
Trade disputes have disrupted global markets and increased costs along many supply chains that run through China, thus raising uncertainty in the farm input and output sectors. Potential long-run benefits of the ongoing trade negotiations driving the tariff actions remain unclear, but in the short run, additional U.S. tariffs on imports from China may add to production costs, while Chinese retaliatory tariffs have dampened demand for U.S. agricultural exports. The resulting downward pressure on U.S. farm incomes has triggered increased federal assistance, trade aid, for the farm sector.22 Congress may use its oversight authority to monitor the implementation of the trade aid and the direction and status of other ongoing trade negotiations.23
In the long run, other countries may respond by expanding agricultural production, potentially displacing U.S. agricultural exports, to become larger food and agricultural suppliers to China. As one of the world's largest trading countries—for both agricultural and nonagricultural products—the United States has a major stake in the current trade dispute. The U.S. Congress may seek to use its legislative authority to influence and monitor ongoing trade disputes. For example, Senator Portman and Representative Kind have separately sponsored the Trade Security Act of 2019 to change the process by which Section 232 tariffs can be levied on U.S. imports.24
Author Contact Information
Footnotes
| 1. |
U.S. Census Bureau Trade data, accessed via U.S. Department of Agriculture (USDA), Foreign Agricultural Service (FAS), https://apps.fas.usda.gov/gats/ExpressQuery1.aspx, September 2019. For example, in 2017, the Chinese market accounted for about 57% of U.S. soybean exports to international markets, 17% of U.S. cotton exports, 80% of U.S. sorghum exports, 11% of U.S. dairy exports, 10% of U.S. pork exports, 6% of U.S. wheat exports, and 5% of U.S. fruit exports. |
| 2. |
For more on this issue, see CRS Report R45903, Retaliatory Tariffs and U.S. Agriculture. |
| 3. |
Procl. 9705, Adjusting Imports of Steel Into the United States, 83 Federal Register 11625 (March 8, 2018); Procl. 9704, Adjusting Imports of Aluminum Into the United States, 83 Federal Register 11619 (March 8, 2018). Both orders were effective as of March 23, 2018. For more information, see CRS Report R45249, Section 232 Investigations: Overview and Issues for Congress. Section 232 authorizes the President to impose restrictions on certain imports based on an affirmative determination by the Department of Commerce that the targeted import products threaten national security. P.L. 87-794 (October 11, 1962), §232, codified as amended at 19 U.S.C. §1862. |
| 4. |
P.L. 93-618 (January 3, 1975), §301, codified as amended at 19 U.S.C. §2411. Section 301 of the Trade Act of 1974 allows the Office of the U.S. Trade Representative to suspend trade concessions or impose restrictions if it determines that a U.S. trading partner is violating trade commitments or engaging in discriminatory or unreasonable practices that burden or restrict U.S. commerce. Also see CRS Insight IN10943, Escalating U.S. Tariffs: Timeline. |
| 5. |
For more on this issue, see CRS Insight IN10943, Escalating U.S. Tariffs: Timeline. |
| 6. |
FAS, "China Announces Increases to Additional Tariffs," August 28, 2019. |
| 7. |
For more on this issue, see CRS In Focus IF11030, U.S. Tariff Policy: Overview; and CRS Report R45903, Retaliatory Tariffs and U.S. Agriculture. |
| 8. |
WTO, Analytical Index, Agreement on Agriculture, Article 2, Annex 1. Note that this definition differs from the USDA definition, which considers agricultural products to be chapters 1-24 (except for fishery products in chapters 3 and 16, manufactured tobacco products such as cigarettes and cigars in chapter 24, and spirits in chapter 22) but includes essential oils (chapter 33), raw rubber (chapter 40), raw animal hides and skins (chapter 41), and wool and cotton (chapters 51-52). USDA also excludes chapter 29 chemicals from its definition of agriculture. |
| 9. |
A TRQ involves a two-tiered tariff scheme in which imports within an established quota are levied lower rates of tariffs, and imports beyond the quota face higher over-quota tariff rates. |
| 10. |
For broader coverage of this issue, see CRS Report R45903, Retaliatory Tariffs and U.S. Agriculture. |
| 11. |
For more on this issue, see USDA, Economic Research Service (ERS), Outlook for U.S. Agricultural Trade, August 29, 2019. |
| 12. |
Note that FY2018 started in October 2017 and included U.S. new-harvest crops exports to China from October to December 2017. This could account for the difference in U.S. agricultural exports to China in FY2018 of $16 billion compared with calendar year 2018 of $9 billion. |
| 13. |
For more on this issue see ERS, Outlook for U.S. Agricultural Trade, August 29, 2019. |
| 14. |
For more on this issue, see CRS Report R45903, Retaliatory Tariffs and U.S. Agriculture. |
| 15. |
U.S agricultural exports data reported by the U.S. Census Bureau and China's imports of U.S. agricultural products reported by Chinese customs data do not generally match. This difference can partly be the result of shipments that have not yet reached China and partly because the two countries value shipments differently. For more on this issue, see CRS Report R45903, Retaliatory Tariffs and U.S. Agriculture. |
| 16. |
For more information on this issue, see CRS Report R45924, U.S. Farm Income Outlook: August 2019 Forecast. |
| 17. |
Generally, short run is defined as the time between the harvest of the current crop and the planting and harvesting of a new crop. All market adjustments that occur within this time frame—whether measured as a price change or a shift in domestic use or trade—are based on the existing supply of a commodity. |
| 18. |
For more on this issue, see CRS Report R45865, Farm Policy: USDA's 2019 Trade Aid Package; and CRS Report R45924, U.S. Farm Income Outlook: August 2019 Forecast. |
| 19. |
Long run is defined as the time required to allow producers the opportunity to make new crop production choices in response to a given market shock, such as tariffs, thus changing the supply of commodities in the market being studied. |
| 20. |
Gale et al, Interdependence of China, United States, and Brazil in Soybean Trade, ERS, June 2019; Rada et al, "Agricultural Recovery in Russia and the Rise of Its South," ERS, April 25, 2017. See also CRS Report R45903, Retaliatory Tariffs and U.S. Agriculture. |
| 21. |
Gooch and Gale, "China's Foreign Agriculture Investments," ERS, April 2018. |
| 22. |
For more on this issue, see CRS Report R45865, Farm Policy: USDA's 2019 Trade Aid Package; and CRS Report R45310, Farm Policy: USDA's 2018 Trade Aid Package. |
| 23. |
For example, Senate hearing on "The President's 2019 Trade Policy Agenda and the United States-Mexico-Canada Agreement," June 18, 2019. |
| 24. |