U.S. Trade Trends and Developments
Summary
The United States is the world’s biggest economy (in nominal dollars), leading trading nation (goods and services), and largest source of and destination for foreign direct investment. The U.S. output of goods and services, or gross domestic product (GDP), totaled $19.5 trillion in 2017. That is almost the combined GDP in nominal dollars of the next three largest economies. All told, the United States, with close to 5% of the world’s population, accounted for almost 25% of the world’s output and more than 16% of its growth in 2017. While the United States is the world’s largest exporter (goods and services combined), U.S. exports are overshadowed by the large U.S. demand for imported products. However, the level of both U.S. exports and imports of goods and services depends on many interrelated domestic and international macroeconomic factors, including the value of the U.S. dollar relative to other currencies, global demand for other dollar-denominated assets—including U.S. Treasury securities, and the relative strength of the U.S. and world economies. While the United States is still by far the dominant economy in the world, its relative position has shifted in the past two decades.
The changing dynamics and composition of U.S. trade have been important to Congress because they can affect the overall health of the U.S. economy and specific industries, the success of U.S. businesses and workers, and the U.S. standard of living. They also have implications for U.S. geopolitical interests. Conversely, geopolitical tensions, risks, and opportunities can have major impacts on U.S. trade flows. These issues are complex and at times controversial, and developments in the global economy often make policymaking more challenging, as it involves balancing many competing interests. Congress is in a unique position to address these and other issues, particularly given its constitutional authority for legislating and overseeing international trade and financial policy.
Key Trade and Economic Developments in 2017
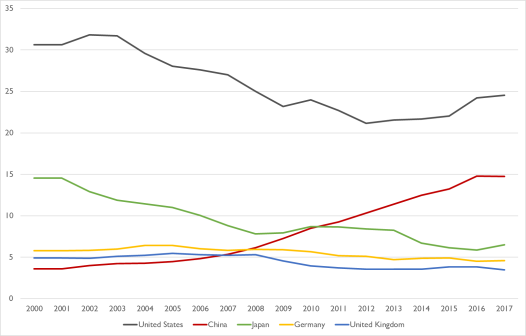
World Economic Developments. World economic growth rose from 3.3% in 2016 to 3.7% in 2017. Advanced economies grew 2.3%, while emerging market and developing economies grew 4.7%—partly due to the moderate slowdown in China’s GDP growth over the past few years (from 10.6% in 2010 to 6.7% in 2017). In 2017, the United States accounted for 24.5% of global GDP (down from 30.6% in 2000), China for 14.7% (up from 3.6% in 2000), Japan for 6.5% (down from 14.6% in 2000), and Germany for 4.6% (down from 5.8% in 2000). In addition, world merchandise trade recorded its largest increase since 2011. In nominal terms, world merchandise exports expanded 10.6% in 2017, after two years of declines, reaching $17.5 trillion. World merchandise imports also grew considerably in 2017, up 11.3%, after declining 3.2% in 2016. In addition, world exports and imports of services increased in value considerably in 2017, up 7.7% and 6.9%, respectively.
U.S. Goods Trade. U.S. merchandise exports totaled $1.6 trillion in 2017, a 6.6% increase from the 2016 level. The value of U.S. merchandise imports was $2.4 trillion over the same period, up 6.9% from the 2016 level. U.S. imports increased more than U.S. exports, leading to a $56.4 billion (7.5%) increase in the U.S. merchandise trade deficit, which reached $807.5 billion in 2017. In 2017, the European Union (EU) was the United States’ top trading partner in terms of two-way (exports plus imports) merchandise trade (accounting for 22.5% of total U.S. merchandise trade), while China was the largest single-country trading partner (accounting for 16.3% of total U.S. merchandise trade).
U.S. Services Trade. U.S. two-way (exports and imports) trade in services grew 5.6% between 2016 and 2017. During that period, U.S. exports of services increased 5.1%, from $758.9 billion to $797.7 billion, while U.S. services imports grew 6.4%, from $509.8 billion to $542.5 billion. The United States maintained a services trade surplus with every major services trading partner except Hong Kong, India, and France in 2017. The overall services trade surplus increased 2.5% ($6.1 billion) to $255.2 billion. The EU was the United States’ top trading partner in terms of two-way (exports plus imports) services trade in 2017, while the largest single-country trading partners were the United Kingdom, Canada, Japan, China, and Germany.
U.S. Total Trade. In 2017, U.S. exports of goods and services totaled $2.4 trillion, while U.S. imports totaled $2.9 trillion, resulting in a deficit of $552.3 billion, up slightly from 2016, but down from the all-time high level registered in 2006 ($761.7 billion).
Issues for Congress
International trade is one of several important drivers of economic growth. A number of questions regarding recent and future trends in U.S exports and imports could arise as the Trump Administration renegotiates U.S. free trade agreements (FTAs) and pursues news ones, and takes a more forceful stance to reduce U.S. bilateral trade deficits, enforce U.S. trade laws and agreements, and promote what it considers to be “free,” “fair,” and “reciprocal” trade. One question pertains to the impact of renegotiating or pursuing new FTAs on the U.S. economy. As with any trade liberalizing measure, an FTA can have net positive overall effects on some sectors and adverse effects on others. An FTA may create export and import opportunities in one sector of the U.S. economy but divert trade away from others. Members of Congress weigh these effects on various industries and on their constituencies, while also considering the overall impact on the United States and other trading partners. Because trade relations can differ significantly from one trade partner to another, the evaluation will likely differ in each case. Furthermore, Members may take into account not only the immediate static effects of greater global economic integration efforts, but also the long-term, dynamic effects, which could play an important role in evaluating their contribution to the U.S. economy. Finally, other issues for Congress raised by the changing patterns in U.S. trade and the global landscape could include contemplating the future direction of the global trading system, as well as assessing the quality and availability of data on trade and what, if any, additional resources should be devoted to collecting trade data and analyzing the role of trade in the U.S. economy.
U.S. Trade Trends and Developments
Jump to Main Text of Report
Contents
- Introduction
- Recent World and U.S. Economic Trends
- World Economic Trends
- World Trade Trends
- U.S. Economic Trends
- Current Account Trends
- U.S. Trade in Goods
- Trade in Goods by Category
- Exports
- Imports
- Energy Trade
- Trade in Goods with Leading Partners
- Trade in Goods with Free Trade Agreement Partners
- U.S. Trade in Services
- Trade in Services by Category
- Exports
- Imports
- Trade in Services with Leading Partners
- U.S. Total Trade in Goods and Services
- Issues for Congress
Figures
- Figure 1. Trade as a Percent of GDP
- Figure 2. Destination and Source of U.S. Merchandise Trade in 2000 and 2017
- Figure 3. Top Five Destinations and Sources of U.S. Trade in 2000 and 2017
- Figure 4. Economic Growth in the United States and Its Major Trading Partners
- Figure 5. Major Economies' GDP Shares in the World Economy
- Figure 6. World Trade Volume Growth
- Figure 7. World Exports and Imports
- Figure 8. U.S. Real GDP Growth
- Figure 9. Contributions of Exports to Percent Change in Real U.S. GDP
- Figure 10. U.S. Current Account
- Figure 11. Annual Growth in U.S. Merchandise Trade
- Figure 12. U.S. Share of World Merchandise Exports and Imports
- Figure 13. U.S. Merchandise Exports by Category
- Figure 14. U.S. Merchandise Imports by Category
- Figure 15. U.S. Exports of Coal, Natural Gas, Nuclear Fuel, and Electric Energy
- Figure 16. U.S. Exports of Petroleum and Petroleum Products
- Figure 17. U.S. Share of World Services Exports and Imports
- Figure 18. Annual Growth in U.S. Trade in Services
- Figure 19. U.S. Services Exports by Category
- Figure 20. U.S. Services Imports by Category
- Figure 21. U.S. Trade as a Share of GDP
- Figure 22. U.S. Trade Balance
Tables
- Table 1. U.S. Merchandise Trade by Category
- Table 2. GDP Growth by Country Groups
- Table 3. U.S. Merchandise Trade
- Table 4. U.S. Merchandise Exports by Product Category
- Table 5. U.S. Merchandise Imports by Product Category
- Table 6. U.S. Merchandise Trade with Major Trading Partners
- Table 7. U.S. Merchandise Trade with Free Trade Agreement Partners
- Table 8. U.S. Trade in Services
- Table 9. U.S. Services Exports by Category
- Table 10. U.S. Services Imports by Category
- Table 11. U.S. Trade in Services with Major Trading Partners
- Table 12. U.S. Total Goods and Services Trade
- Table 13. Trade as a Share of GDP for Select Economies
Appendixes
Summary
Summary
The United States is the world's biggest economy (in nominal dollars), leading trading nation (goods and services), and largest source of and destination for foreign direct investment. The U.S. output of goods and services, or gross domestic product (GDP), totaled $19.5 trillion in 2017. That is almost the combined GDP in nominal dollars of the next three largest economies. All told, the United States, with close to 5% of the world's population, accounted for almost 25% of the world's output and more than 16% of its growth in 2017. While the United States is the world's largest exporter (goods and services combined), U.S. exports are overshadowed by the large U.S. demand for imported products. However, the level of both U.S. exports and imports of goods and services depends on many interrelated domestic and international macroeconomic factors, including the value of the U.S. dollar relative to other currencies, global demand for other dollar-denominated assets—including U.S. Treasury securities, and the relative strength of the U.S. and world economies. While the United States is still by far the dominant economy in the world, its relative position has shifted in the past two decades.
The changing dynamics and composition of U.S. trade have been important to Congress because they can affect the overall health of the U.S. economy and specific industries, the success of U.S. businesses and workers, and the U.S. standard of living. They also have implications for U.S. geopolitical interests. Conversely, geopolitical tensions, risks, and opportunities can have major impacts on U.S. trade flows. These issues are complex and at times controversial, and developments in the global economy often make policymaking more challenging, as it involves balancing many competing interests. Congress is in a unique position to address these and other issues, particularly given its constitutional authority for legislating and overseeing international trade and financial policy.
Key Trade and Economic Developments in 2017
World Economic Developments. World economic growth rose from 3.3% in 2016 to 3.7% in 2017. Advanced economies grew 2.3%, while emerging market and developing economies grew 4.7%—partly due to the moderate slowdown in China's GDP growth over the past few years (from 10.6% in 2010 to 6.7% in 2017). In 2017, the United States accounted for 24.5% of global GDP (down from 30.6% in 2000), China for 14.7% (up from 3.6% in 2000), Japan for 6.5% (down from 14.6% in 2000), and Germany for 4.6% (down from 5.8% in 2000). In addition, world merchandise trade recorded its largest increase since 2011. In nominal terms, world merchandise exports expanded 10.6% in 2017, after two years of declines, reaching $17.5 trillion. World merchandise imports also grew considerably in 2017, up 11.3%, after declining 3.2% in 2016. In addition, world exports and imports of services increased in value considerably in 2017, up 7.7% and 6.9%, respectively.
U.S. Goods Trade. U.S. merchandise exports totaled $1.6 trillion in 2017, a 6.6% increase from the 2016 level. The value of U.S. merchandise imports was $2.4 trillion over the same period, up 6.9% from the 2016 level. U.S. imports increased more than U.S. exports, leading to a $56.4 billion (7.5%) increase in the U.S. merchandise trade deficit, which reached $807.5 billion in 2017. In 2017, the European Union (EU) was the United States' top trading partner in terms of two-way (exports plus imports) merchandise trade (accounting for 22.5% of total U.S. merchandise trade), while China was the largest single-country trading partner (accounting for 16.3% of total U.S. merchandise trade).
U.S. Services Trade. U.S. two-way (exports and imports) trade in services grew 5.6% between 2016 and 2017. During that period, U.S. exports of services increased 5.1%, from $758.9 billion to $797.7 billion, while U.S. services imports grew 6.4%, from $509.8 billion to $542.5 billion. The United States maintained a services trade surplus with every major services trading partner except Hong Kong, India, and France in 2017. The overall services trade surplus increased 2.5% ($6.1 billion) to $255.2 billion. The EU was the United States' top trading partner in terms of two-way (exports plus imports) services trade in 2017, while the largest single-country trading partners were the United Kingdom, Canada, Japan, China, and Germany.
U.S. Total Trade. In 2017, U.S. exports of goods and services totaled $2.4 trillion, while U.S. imports totaled $2.9 trillion, resulting in a deficit of $552.3 billion, up slightly from 2016, but down from the all-time high level registered in 2006 ($761.7 billion).
Issues for Congress
International trade is one of several important drivers of economic growth. A number of questions regarding recent and future trends in U.S exports and imports could arise as the Trump Administration renegotiates U.S. free trade agreements (FTAs) and pursues news ones, and takes a more forceful stance to reduce U.S. bilateral trade deficits, enforce U.S. trade laws and agreements, and promote what it considers to be "free," "fair," and "reciprocal" trade. One question pertains to the impact of renegotiating or pursuing new FTAs on the U.S. economy. As with any trade liberalizing measure, an FTA can have net positive overall effects on some sectors and adverse effects on others. An FTA may create export and import opportunities in one sector of the U.S. economy but divert trade away from others. Members of Congress weigh these effects on various industries and on their constituencies, while also considering the overall impact on the United States and other trading partners. Because trade relations can differ significantly from one trade partner to another, the evaluation will likely differ in each case. Furthermore, Members may take into account not only the immediate static effects of greater global economic integration efforts, but also the long-term, dynamic effects, which could play an important role in evaluating their contribution to the U.S. economy. Finally, other issues for Congress raised by the changing patterns in U.S. trade and the global landscape could include contemplating the future direction of the global trading system, as well as assessing the quality and availability of data on trade and what, if any, additional resources should be devoted to collecting trade data and analyzing the role of trade in the U.S. economy.
Introduction
Overview
The United States is the world's biggest economy (in nominal dollars), leading trading nation (goods and services), and largest source of and destination for foreign direct investment. The U.S. output of goods and services, or gross domestic product (GDP), totaled $19.5 trillion in 2017. That is almost the combined GDP of the next three largest economies.1 All told, the United States, with close to 5% of the world's population, accounted for almost 25% of the world's output and more than 16% of its growth in 2017.2 While the United States is the world's largest exporter (goods and services combined), U.S. exports are overshadowed by the large U.S. demand for imported products. However, the level of both U.S. exports and imports of goods and services depends on many interrelated domestic and international factors, including the value of the U.S. dollar relative to other currencies, global demand for other dollar-denominated assets—including U.S. Treasury securities, and the relative strength of the U.S. and world economies. While the United States is still by far the dominant economy in the world, its relative position has shifted in the past two decades.
Changes in U.S. trade patterns pose both opportunities and challenges for U.S. international trade relations. These developments have intensified congressional interest in U.S. trade policy and demand for information and analysis of U.S. trade flows. In coming months, Congress may face issues such as shaping U.S. trade policy to reflect this changing composition of trade; enhancing the competitive position of U.S. firms, workers, and industries, promoting access to new foreign market opportunities for U.S. businesses, and addressing tensions, trade barriers and issues raised by the growing role of emerging economies in the global economy. In addition, questions affecting U.S. trade trends could also arise as the Trump Administration renegotiates FTAs and pursues new ones, and Congress debates and potentially ratifies them.
Recent Developments in International Trade
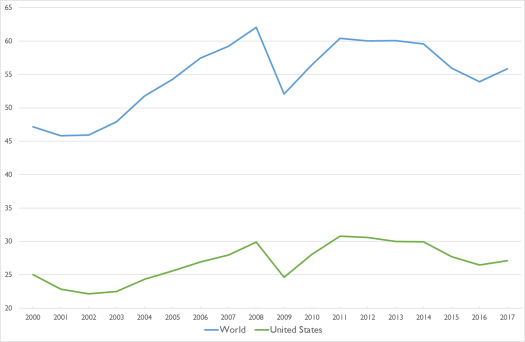
International trade is an important engine not only of the U.S. economy, but of the global economy. Total trade (exports plus imports) as a share of global GDP has risen from 25% in 1960 to 56% in 2017 (Figure 1). Greater openness to trade and trade reforms worldwide have been linked to higher growth in productivity and real incomes, as well as to reduced poverty worldwide.3 For decades since World War II, annual real global trade growth outpaced GDP growth, growing on average 1.5 times faster. This trend has not held in recent years as the global economy recovered from the global financial and economic crisis. Real growth in the volume of world merchandise trade slowed to 2.0% in 2016—the slowest pace of growth since 2009. Trade growth has seen some rebound, increasing to 5.4% in 2017—the strongest growth rate since 2011, driven mainly by cyclical factors, particularly higher investment and consumption expenditure.4
Overall, analysts attribute the trend of weakened international trade growth in previous years to several factors, including weak import demand, exchange rate fluctuations, and falling commodity prices.5 The slowdown in world investment and China's rebalancing toward a consumption-driven economy are seen by some as major structural factors, while others consider growing trade protectionism to be equally important.6 With the improving global economic outlook, a rebound in trade growth had been projected for 2018 and 2019 by the International Monetary Fund (IMF) and the World Trade Organization (WTO). However, amid several downside risks, including rising trade tensions between major economies like the United States and China, and heightened trade policy uncertainty, the IMF and WTO now expect global trade growth to slow.7 Recently introduced restrictive trade policy measures by the United States and some of its major trading partners may already be affecting trade flows and prices in targeted sectors. Analysts claim that some recent policy announcements have also harmed business outlooks and investment plans, due to concern about possible disruption to supply chains as well as the risk that the restrictions may intensify.8 The Organization for Economic Cooperation and Development (OECD) projects that a further rise in trade tensions may have additional adverse effects on global investment and jobs.9
 |
|
Source: CRS calculations with data from the World Bank, World Development Indicators, and the U.S. Department of Commerce, Bureau of Economic Analysis. Notes: For the world, sum of world exports and imports of goods and services as a share of world GDP; for the United States, sum of U.S. exports and imports of goods and services as a share of U.S. GDP. |
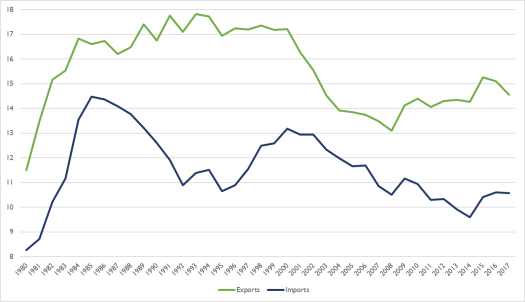
U.S. world trade has grown steadily over the past decade. In 2017, the United States exported $2.4 trillion in goods and services and imported $2.9 trillion.10 Since 2009, when trade flows declined sharply in the midst of the international financial and economic crisis, U.S. exports grew 48.5%, while U.S. imports grew 47.6% in nominal terms. More broadly, since 1960, trade relative to GDP has risen markedly. U.S. exports as a percentage of GDP expanded from 5% in 1960 to over 12% of GDP in 2017, while U.S. imports expanded from 4% to over 15% of GDP.
Changing Patterns in U.S. Trade
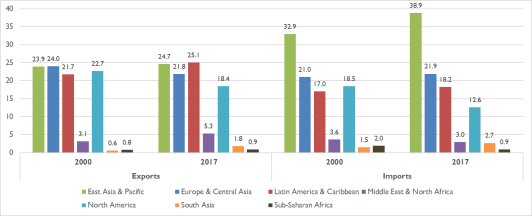
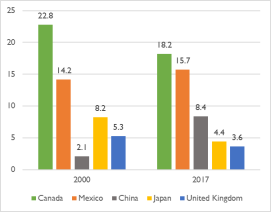
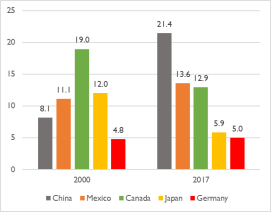
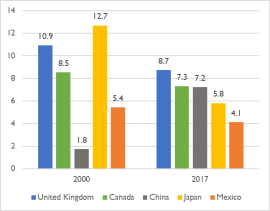
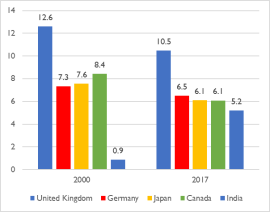
Over the past several decades, the process of globalization has introduced fundamental changes to the U.S. economy. The growing economic weight of emerging market and developing economies is contributing to a realignment of the distribution of power within the global economy and to changes in the direction and composition of U.S trade. Traditionally, the United States and other advanced economies, such as European Union members and Japan, have been the primary sources of world trade flows. While most of the United States' largest trading partners remain advanced economies, U.S. trade with emerging market and developing economies—although comparatively low—accounts for a growing share of total U.S. trade (Figure 2 and Figure 3).
The share of U.S. exports to the Middle East and North Africa increased from 3.1% in 2000 to 5.3% in 2017, while the share to South Asia increased from 0.6% to 1.8% during the same time period. The share of U.S. imports from East Asia and the Pacific also grew significantly, from 32.9% in 2000 to 38.9% in 2017. Among the emerging economies, U.S. trade with China has grown the fastest. In 2000, China accounted for about 2.1% of U.S. merchandise exports and 8.1% of U.S. merchandise imports. By 2017, China represented 8.4% of U.S. merchandise exports and 21.4% of merchandise imports. The growing importance of emerging economies is also reflected in U.S. trade in services. Between 2000 and 2017, the share of U.S. services exports to the United Kingdom, Canada, Japan, and Mexico all decreased, while that of China and India increased. During the same time period, the share of U.S. services imports from India grew from 0.9% to 5.2%. In addition, the composition of U.S. trade has also changed since 2000. U.S. exports of petroleum and coal products, oil and gas, and aerospace products and parts have increased, while exports of semiconductors, computer equipment, and motor vehicle parts have decreased significantly (Table 1).
Global Value Chains
International trade has become increasingly complex, and the changing dynamics of U.S. trade pose both opportunities and challenges for the United States. In the past, U.S. firms tended to source most or all of their production in the United States, using inputs that were largely made domestically. U.S. production, trade, and investments are increasingly organized within so-called global value chains (GVCs) where the different stages of the production process are located across different countries. GVCs mean that products are often traded across borders multiple times. This international fragmentation of U.S. and other countries' production has raised the level of trade associated with a particular final product, as well as trade with both developing and developed countries.
Lower global trade barriers and technological advances help to facilitate the growth of GVCs, making international transport faster and accelerating the flow of information across borders. These linkages have blurred the distinction between exports and imports as strictly domestic or foreign activities. This in turn has made it increasingly difficult to understand who benefits and loses from global trade. It also complicates the interpretation of bilateral trade balances. Trade in intermediates means that imports have become essential inputs into the production of exports. As a result, policies that affect a nation's imports ultimately affect its exports and vice versa.
|
Exports |
2000 |
2017 |
Imports |
2000 |
2017 |
|
Aerospace Products and Parts |
6.9 |
8.7 |
Motor Vehicles |
10.4 |
8.8 |
|
Petroleum and Coal Products |
1.2 |
5.4 |
Oil and Gas |
8.6 |
6.1 |
|
Motor Vehicles |
3.2 |
4.1 |
Communications Equipment |
2.6 |
5.3 |
|
Basic Chemicals |
3.7 |
3.9 |
Motor Vehicle Parts |
4.2 |
4.9 |
|
Semiconductors and Other Electronic Components |
10.7 |
3.8 |
Pharmaceuticals and Medicines |
2.4 |
4.8 |
|
Motor Vehicle Parts |
5.7 |
3.8 |
Computer Equipment |
5.6 |
4.1 |
|
Pharmaceuticals and Medicines |
2.1 |
3.6 |
Semiconductors and Other Electronic Components |
8.1 |
3.5 |
|
Instruments (Navigational, Measuring, Medical, and Control) |
3.7 |
3.2 |
Apparel |
4.8 |
3.3 |
|
Computer Equipment |
7.0 |
3.0 |
Instruments (Navigational, Measuring, Medical, and Control) |
1.8 |
2.3 |
|
Oil and Gas |
0.2 |
2.9 |
Aerospace Products and Parts |
2.2 |
2.2 |
|
Communications Equipment |
2.8 |
2.6 |
Basic Chemicals |
1.9 |
2.1 |
Source: CRS calculations with data from the U.S. International Trade Commission, DataWeb.
Notes: North American Industry Classification System Codes (NAIC-4).
More than half of global manufacturing imports are intermediate goods traveling within supply chains, while over 75% of global services imports are intermediate services.11 The latest data from the OECD suggests that, on average, over 25% of the value of national exports included foreign content in the form of imported inputs.12 For the United States, the foreign value-added share in U.S. exports has increased in most industries, particularly since the mid-1990s.
The Limitations of Trade Data
The growth in global production chains, intra-firm trade, and trade in intermediate goods means that traditional accounting methods may distort trade data and not fully reflect the source of resources that are used in producing goods and services. This makes it increasingly difficult to understand and interpret the implications of trade data for the U.S. economy. Thus, it is important to note that the conventional trade data that drives policy discussions, and that is used throughout this report, may underestimate U.S. trade, particularly in services, as the data are not measured on a value-added basis and do not attribute any portion of the traded value of manufactured and agricultural products to services inputs. Intermediate services embedded within a value chain as inputs include not only transportation and distribution to help move goods along, but also research and development (R&D), design and engineering, and business services.
China is an example of this phenomenon. Since initiating free market reforms in 1979 and opening up its economy to global trade and investment, China has emerged as a major center for global supply chains. Because of China's large pool of low-cost labor, many export-oriented multinational corporations have moved production from other countries (primarily in Asia) to China. In many cases, products that are "made in China" are actually products that are "assembled in China," using imported inputs (such as components) that are designed and produced globally. The value added that occurs in China is often quite small relative to the total value of the finished product when it is imported into the United States and elsewhere, and a significant level of the profits from the sale of the product is estimated to accrue to the multinational company that owns the brand.
To illustrate, when the United States imports such products as iPhones and iPads, it attributes the full value of those imports as occurring in China, even though the value added that occurred there is quite small. Apple Inc., the U.S. firm that developed these products, is the largest beneficiary in terms of the profits generated by the sale of its products, and most of its product design, software development, product management, marketing, and other high-wage functions and employment occur in the United States. In other words, U.S. trade data may show where products are being imported from, but they often do not reflect who ultimately benefits from that trade. In many instances, U.S. imports from China are really imports from many countries. Yet, the full value of the final imported product is attributed to China, which results in what one might consider to be an inflated trade deficit figure. A joint study by the OECD and the WTO estimated that the U.S trade deficit with China in 2009 would have been reduced by 25% if bilateral trade flows were measured according to the value-added that occurred in each country before it was exported.13 Additionally, another study estimated that 24.7% of U.S. imports from Canada, and 39.8% of U.S. final merchandise imports from Mexico, consist of value added from the United States.14
Sources
This report relies heavily on resources from the U.S. Department of Commerce's Bureau of Economic Analysis and Census Bureau, and from the U.S. International Trade Commission—the main sources of U.S. trade data—for information and statistics presented throughout the report. It is also based on primary and secondary source materials, including publications and news releases by the U.S. International Trade Commission, the Office of the U.S. Trade Representative, U.S. Energy Information Agency, U.S. Federal Reserve System, the International Monetary Fund, the World Bank, and the World Trade Organization. Much of the trade data used in the report, including U.S. goods and services trade data, are revised throughout the year.
The main purpose of this report is to provide an overview of U.S. exports, imports, and trade balances in 2017—the most recent year for which yearly U.S. trade data are available. It is intended primarily as a reference, and it focuses on what has happened with U.S. trade in recent years—not why it happened or what the changes imply. Developments in international trade have intensified congressional interest in U.S. trade policy and demand for comparative analysis of U.S. trade flows. Therefore, this report presents current data and statistics on U.S. trade in a way that is accessible and understandable—through charts, tables, and brief explanations—to help inform policy discussions. Given the linkages between U.S. and world economic activity, it begins by providing an overview of world economic and trade developments. The bulk of the report then focuses on the major trends in trade between the United States and the rest of the world. A comprehensive overview of trade concepts, data on key U.S. trade and investment trends, and the trade and investment policy tools used to advance U.S. objectives is provided in CRS Report R45148, U.S. Trade Policy Primer: Frequently Asked Questions, coordinated by [author name scrubbed].
Recent World and U.S. Economic Trends
World Economic Trends
Real global GDP rose from 3.27% in 2016 to 3.74% in 2017 (Figure 4). Advanced economies grew faster in 2017 (2.34%) than in 2016 (1.71%) (Table 2).15 The change in the growth rate of emerging market and developing economies was small—0.33 percentage point (p.p.)16— with growth rising from 4.39% in 2016 to 4.72% in 2017, partly due to the moderate slowdown in China's economic growth over the past few years (from 10.60% in 2010 to 6.86% in 2017). Among the United States' top trading partners, only India and Mexico experienced slower growth in 2017 than in 2016. In 2017, the United States accounted for 24.5% of world GDP (down from 30.6% in 2000), China for 14.7% (up from 3.6% in 2000), Japan for 6.5% (down from 14.6% in 2000, but up from 5.9% in 2016), and Germany for 4.6% (down from 5.8% in 2000) (Figure 5).
|
Figure 4. Economic Growth in the United States and Its Major Trading Partners (percent change from preceding year) |
 |
|
Source: CRS with data from the International Monetary Fund, World Economic Outlook Database. |
|
2014 |
2015 |
2016 |
2017 |
|
|
World |
3.58 |
3.45 |
3.27 |
3.74 |
|
Advanced Economies |
2.07 |
2.31 |
1.71 |
2.34 |
|
European Union |
1.88 |
2.41 |
2.04 |
2.66 |
|
Euro Area |
1.42 |
2.05 |
1.89 |
2.39 |
|
Emerging Market and Developing Economies |
4.72 |
4.30 |
4.39 |
4.72 |
|
Commonwealth of Independent States |
1.05 |
-1.95 |
0.42 |
2.14 |
|
Emerging and Developing Asia |
6.81 |
6.80 |
6.46 |
6.54 |
|
Emerging and Developing Europe |
3.91 |
4.73 |
3.27 |
5.98 |
|
Latin America and the Caribbean |
1.35 |
0.33 |
-0.64 |
1.27 |
|
Middle East, North Africa, Afghanistan, and Pakistan |
2.88 |
2.55 |
5.10 |
2.19 |
|
Sub-Saharan Africa |
5.14 |
3.27 |
1.40 |
2.75 |
|
Figure 5. Major Economies' GDP Shares in the World Economy (as a percent of world GDP) |
 |
|
Source: CRS calculations with data from the World Bank, World Development Indicators. |
The growth performance of major U.S. trading partners diverged widely in 2017, affecting both their bilateral trade with the United States and their exchange rates against the U.S. dollar. According to the most recent estimates by the IMF, worldwide growth can be attributed in large part to the strengthening of domestic demand in advanced economies and in China.17 The Eurozone grew 2.39% in 2017, up from 1.89% in 2016—its highest growth rate since the 2008 global financial and economic crisis, reflecting strong consumption, investment, and exports.18 Canada more than doubled its real GDP growth rate, from 1.41% in 2016 to 3.05% in 2017. In addition, France's growth rate rose from 1.10% in 2016 to 2.34% in 2017.
On the other hand, India's economy slowed, with growth decreasing from 7.11% in 2016 to 6.68% in 2017. India, however, is projected to grow 7.30% in 2018 and 7.44% in 2019, lifted by continued implementation of structural reforms, strong private consumption, and fading transitory effects of recent economic reform, such as a currency exchange initiative and implementation of the national goods and services tax, which was introduced in mid-2017. China's economy continued to grow modestly, with its growth rate increasing from 6.72% in 2016 to 6.86% in 2017. Despite this increase, China's growth rate is expected to slow in the coming years—to 6.60% in 2018 and 6.18% in 2019—as the economy continues to rebalance away from investment toward private consumption and from industry to services. The rise in China's nonfinancial debt as a share of GDP is expected to contribute to this downward trend.
The IMF forecasts improved performance in the short-term both from advanced economies— 2.36% for 2018 and 2.13% for 2019—as well as from emerging market and developing economies—4.68% in both 2018 and 2019. This growth is projected to slow in the medium term, however, as output gaps close and advanced economies return to their potential output paths.19 Beyond the short term, growth rates are expected to fall below pre-recession levels, as the aging populations and shrinking labor forces in advanced economies will act as a drag on expansion. Fiscal policy is expected to remain expansionary in 2018 and 2019, but begin to turn contractionary by 2020. Monetary policy will likely remain supportive in the Eurozone and Japan, but may tighten faster than projected in the United States. More broadly, global financial conditions are expected to remain generally accommodative.
Growth in emerging and developing Asia is expected to continue to exceed global growth, growing 6.52% in 2018 and 6.31% in 2019.20 The IMF also projects emerging and developing Europe to slow to 3.77 % in 2018 (down from 5.98% in 2017) and to 1.98% in 2019, as strong demand for exports from its Eurozone neighbors and favorable financial conditions continue to support economic activity in the short term. Recovery in commodity prices is projected to help Latin American and the Caribbean grow 1.20% in 2018 (down from 1.27% in 2017) and 2.19% in 2019. Economic growth in the Middle East and North Africa is expected to be 2.44% in 2018 (up from 2.19% in 2017) and 2.72% in 2019. Growth in sub-Saharan Africa is also projected to increase to 3.07% in 2018 (up from 2.75% in 2017) and to 3.76% in 2019, with higher commodity prices important to the region's growth prospects.
World Trade Trends
Given the impact of commodity and energy prices and fluctuations in exchange rates on trade, among other factors, this section discusses trends in both the volume and value of exports and imports.
Volume of Goods and Services
In 2017, world trade volumes recorded their largest increases since 2011. This trade expansion followed a contraction in 2016, when trade growth lagged growth in real world output. According to the WTO, this large acceleration in trade growth was due to stronger than expected economic growth across the globe, with higher investment and private consumption, and supportive fiscal as well as financial conditions.21
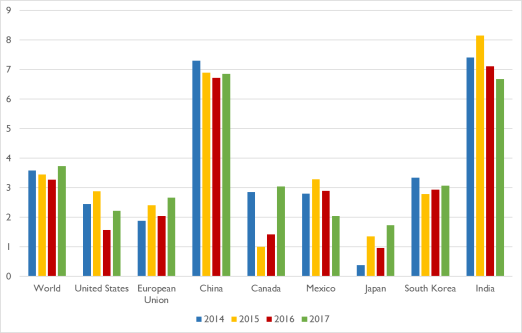
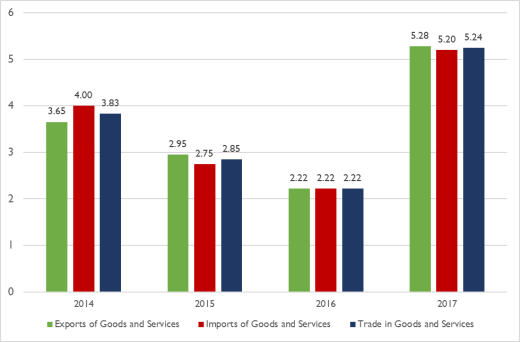
Overall, world trade volume of goods and services increased 5.24% in 2017, compared to a 2.22% increase in 2016 (Figure 6). Both advanced and emerging market and developing economies saw increased growth rates in exports and imports in 2017, but the latter group's trade flows grew at a higher rate, more than tripling the growth rate registered in 2016—from 2.17% to 6.41%. This was in large part driven by China, whose volume of exports of goods and services grew 9.31%, while its volume of imports rose 7.13% in 2017.
|
Figure 6. World Trade Volume Growth (percent change from preceding year) |
 |
|
Source: CRS with data from the International Monetary Fund, World Economic Outlook Database. |
The recovery in export trade volumes was broad across the world's regions in 2017. Exports from all regions except the Middle East and North Africa achieved higher growth rates in 2016 than in 2017. In 2017, exports from emerging market and developing economies grew 6.94%, up from 2.95% in 2016. This compares to 4.37% for advanced economies (up from 1.80% in 2016). Emerging and developing Asia was the leader, with exports up 9.68%, followed by emerging and developing Europe, with 8.91%. The Eurozone's exports also increased considerably, from 2.63% in 2016 to 5.19% in 2017.
The dynamics of trade growth also differed among these groups. While emerging market and developing economies achieved higher overall import growth, it was the developed economies that had more momentum at the end of 2017, as these countries began to experience higher economic growth. The largest trade volume gains in 2017 were recorded on the import side in emerging market and developing economies, with real import volume growth of 7.03%, up from 1.83% in 2016. Meanwhile, advanced economies' real imports grew 4.19% in 2017, up from 2.45% the year before. Emerging and developing Asia led with 9.06% import volume growth, followed by emerging and developing Europe (up 8.76%) and Latin America and the Caribbean (up 4.82%).
Value
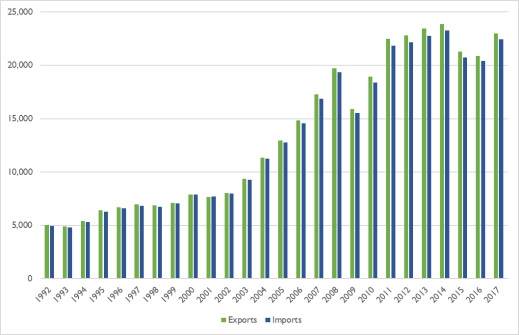
In nominal terms, world merchandise exports expanded 10.56% in 2017, after two years of declines, reaching $17,478.8 billion (Figure 7). World merchandise imports also grew considerably in 2017, up 11.25%, after declining 3.23% in 2016. The EU remained the largest trading bloc in the world, with $11,346.5 billion in total trade. China accounted for 12.68% of world exports, up from 1.78% in 2000, while U.S. exports represented 8.87%, down from 12.55% in 2000. The stability of the U.S. dollar versus a broad basket of currencies, in spite of the commodity price increases, is believed to have contributed to this increase. The United States was the largest merchandise importer in 2017, accounting for 13.79% of world imports, followed by China (10.16%), Germany (6.62%), and Japan (3.76%). World exports and imports of services also increased in value considerably in 2017, up 7.74% and 6.93%, respectively. Despite increases in recent years, the U.S. share of world services imports is lower today than in 2000, whereas the U.S. share of world services exports has fluctuated in recent years but stands close to the 2000 level.
|
Figure 7. World Exports and Imports (in billions of current U.S. dollars) |
 |
|
Source: CRS with data from the World Bank, World Development Indicators. Notes: Exports and imports of goods and services. |
The WTO forecasts a gradual moderation in merchandise trade growth in 2018 and 2019. There are significant uncertainty to the medium-term forecast, as the heightened trade tensions and uncertainty about the major economies' commitment to existing rules-based architecture could begin to threaten business confidence, affect investment decisions, and undermine the robustness of current global economic growth. If the current GDP growth forecasts are realized, world exports of goods and services are projected to expand by 3.84% and imports by 4.52% in 2018. Advanced economies are expected to see export growth of 3.35% and import growth of 3.67%, while emerging market and developing economies are expected to expand their exports by 4.70% and their imports by 6.01%.
U.S. Economic Trends
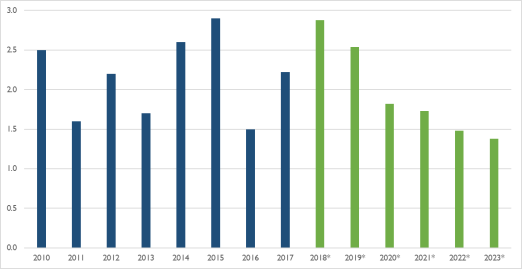
The levels and growth of U.S. exports and imports of goods and services are determined by a wide range of domestic and international factors, including the relative strength of the U.S. and world economies. The United States had a $19.5 trillion economy in 2017. The U.S. economy grew faster in 2017 than in 2016: U.S. real GDP increased 2.2% in 2017, up from 1.5% in 2016, but down from 2.9% in 2015 (Figure 8). The largest contributions to the 2017 growth rate figure came from five industries: professional and business services (0.42 percentage points, p.p.), finance, insurance, real estate, rental, and leasing (0.32 p.p.), manufacturing (0.22 p.p.), educational services, health care, and social services (0.22 p.p.), and retail trade (0.20 p.p.).22
|
Figure 8. U.S. Real GDP Growth (percent change from preceding year) |
 |
|
Source: CRS with data from the U.S. Department of Commerce, Bureau of Economic Analysis, and the International Monetary Fund, World Economic Outlook Database. Notes: (*) denotes forecasts for 2018-2023 (International Monetary Fund Staff Estimates). |
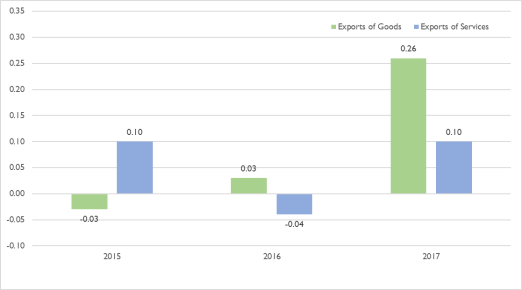
The contribution to U.S. GDP growth from net exports was negative again in 2017 (-0.31 p.p.), about the same as in 2016. Exports of goods and services contributed 0.26 and 0.11 p.p. to growth, respectively (Figure 9). The contribution to growth from federal and state and local government spending was near zero as both federal and state and local expenditures contracted marginally in 2017.
The latest U.S. data show signs of continuing strong performance in 2018, with the IMF forecasting 2.9% growth and the U.S. Federal Reserve estimating growth between 2.9% and 3.2%.23 Most cyclical indicators suggest that growth will stop accelerating by 2019 due to higher projected commodity prices, upward pressure on inflation, faster monetary policy tightening by the U.S. Federal Reserve, and global risks. Labor market data indicate that the United States is at—or close to—full employment, as the jobless rate reached 4.1% at the end of 2017 and projected to fall below 4.0% in 2018.
|
Figure 9. Contributions of Exports to Percent Change in Real U.S. GDP (percentage points) |
 |
|
Source: CRS with data from the U.S. Department of Commerce, Bureau of Economic Analysis. Notes: Data are seasonally adjusted at annual rates. |
Current Account Trends
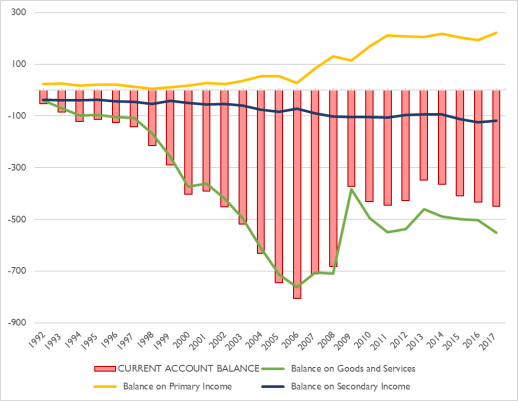
The U.S. current-account deficit—the combined balances of trade in goods and services, income, and net unilateral current transfers—increased 3.76% in 2017 to $449.1 billion, from $432.9 billion in 2016 (Figure 10). The deficit amounted to 2.43% and 2.40% of current-dollar GDP in 2016 and 2017, respectively. The increase in the current-account deficit was due primarily to a rise in the merchandise trade deficit (up 7.52%). This trend offset increased surpluses in services trade (up 2.48%) and primary income (investment income, income payments to foreigners, and compensation of employees) (up 14.89%). The deficit in secondary income (government transfers abroad) declined 4.28%.
The U.S. trade deficit for goods and services increased 10.02%, from $502.0 billion in 2016 to $552.3 billion in 2017. The deficit on goods increased to $807.5 billion in 2017 from $751.1 billion in 2016, though it remained well below the annual record deficit of $837.3 billion registered in 2006. U.S. exports of goods rose from $1.46 trillion in 2016 to $1.55 trillion in 2017, reflecting growth in exports of capital goods, consumer goods, and, in particular, petroleum and petroleum products. Imports of goods increased to $2.36 trillion in 2017, from $2.21 trillion in 2016, reflecting increases in most sectors, particularly crude products (up 30.49% in 2017, compared to a decline of 19.21% in 2016).
The U.S. trade surplus for services grew to $255.2 billion in 2017, from $249.1 billion in 2016. This represented an increase of 2.48% from 2016, but it was still down 3.08% from the annual record surplus of $263.3 billion in 2015. U.S. services exports rose from $758.9 billion to $797.7 billion during this period. The largest increases in U.S. services exports occurred in the categories of financial services (10.32%) and telecommunications, computers, and information services (9.52%). At the same time, services imports also increased, rising from $509.8 billion in 2016 to $542.5 billion in 2017. The largest increase in U.S. services imports occurred in financial services (12.34%) and charges for the use of intellectual property (10.11%).
|
Figure 10. U.S. Current Account (in billions of current U.S. dollars) |
 |
|
Source: CRS with data from the U.S. Department of Commerce, Bureau of Economic Analysis. |
U.S. Trade in Goods
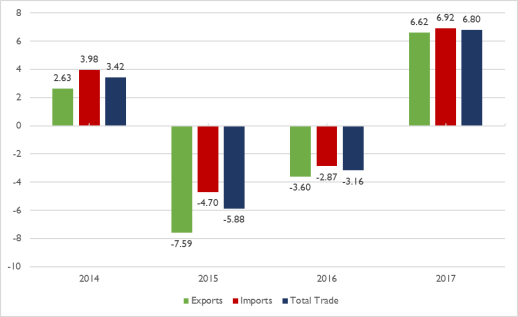
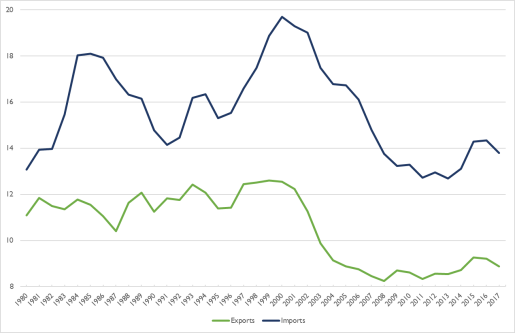
U.S merchandise exports totaled $1.55 trillion in 2017, a 6.62% ($96.4 billion) increase from the 2016 level (Figure 11 and Table 3). The value of U.S. merchandise imports was $2.36 trillion over the same period, up 6.92% ($152.9 billion) from 2016. U.S. imports increased more than U.S. exports, leading to a $56.4 billion (7.52%) increase in the U.S. merchandise trade deficit to $807.5 billion in 2017. The relative decline in the U.S. share of world merchandise exports and imports is shown in Figure 12.
The United States experienced trade surpluses in two merchandise categories in 2017: agricultural foods, feed, and beverages (exported $15.8 billion in excess of imports) and agricultural industrial supplies and materials (exported $6.9 billion in excess of imports). Energy-related products had the largest absolute and relative (percentage) increase in both exports and imports: exports rose 42.86% in 2017, while imports increased by 22.52% over the same period.
|
Figure 11. Annual Growth in U.S. Merchandise Trade (percent change from preceding year) |
 |
|
Source: CRS calculations with data from the U.S. Department of Commerce, Bureau of Economic Analysis. Notes: Nominal growth. Balance of Payments basis. |
|
Figure 12. U.S. Share of World Merchandise Exports and Imports (as a percent of world trade) |
 |
|
Source: CRS calculations with data from the International Monetary Fund, Balance of Payments Statistics Yearbook (September 2018). Notes: Balance of Payments basis. |
|
Calendar Year |
Exports |
Imports |
Balance |
|
1992 |
439.6 |
536.5 |
-96.9 |
|
1993 |
456.9 |
589.4 |
-132.5 |
|
1994 |
502.9 |
668.7 |
-165.8 |
|
1995 |
575.2 |
749.4 |
-174.2 |
|
1996 |
612.1 |
803.1 |
-191.0 |
|
1997 |
678.4 |
876.8 |
-198.4 |
|
1998 |
670.4 |
918.6 |
-248.2 |
|
1999 |
698.5 |
1,035.6 |
-337.1 |
|
2000 |
784.9 |
1,231.7 |
-446.8 |
|
2001 |
731.3 |
1,153.7 |
-422.4 |
|
2002 |
698.0 |
1,173.3 |
-475.2 |
|
2003 |
730.4 |
1,272.1 |
-541.6 |
|
2004 |
823.6 |
1,488.3 |
-664.8 |
|
2005 |
913.0 |
1,695.8 |
-782.8 |
|
2006 |
1,040.9 |
1,878.2 |
-837.3 |
|
2007 |
1,165.2 |
1,986.3 |
-821.2 |
|
2008 |
1,308.8 |
2,141.3 |
-832.5 |
|
2009 |
1,070.3 |
1,580.0 |
-509.7 |
|
2010 |
1,290.3 |
1,939.0 |
-648.7 |
|
2011 |
1,498.9 |
2,239.9 |
-741.0 |
|
2012 |
1,562.6 |
2,303.7 |
-741.1 |
|
2013 |
1,593.7 |
2,294.2 |
-700.5 |
|
2014 |
1,635.6 |
2,385.5 |
-749.9 |
|
2015 |
1,511.4 |
2,273.2 |
-761.9 |
|
2016 |
1,457.0 |
2,208.0 |
-751.1 |
|
2017 |
1,553.4 |
2,360.9 |
-807.5 |
Source: CRS with data from the U.S. Department of Commerce, Bureau of Economic Analysis.
Notes: Balance of Payments basis.
Trade in Goods by Category
Exports
Capital goods (not including automotive) was the largest U.S. export category in 2017, accounting for 34.35% of all U.S. exports (Figure 13 and Table 4). It was followed by industrial supplies and materials (29.37% of exports), consumer goods, not including food and automotive (12.69%), automotive vehicles, parts, and engines (10.15%), and foods, feeds, and beverages (8.55%). The top ten exports in 2017 were the same as in 2016: (1) petroleum and petroleum products; (2) chemicals; (3) metals; (4) automotive engines; (5) civilian aircraft; (6) electric-generating machinery; (7) passenger cars; (8) medicinal, dental, and pharmaceutical products; (9) semiconductors; and (10) scientific, hospital, and medical equipment.
|
Figure 13. U.S. Merchandise Exports by Category (percent of total exports) |
 |
|
Source: CRS calculations with data from the U.S. Department of Commerce, Bureau of Economic Analysis. |
U.S. exports in all merchandise categories increased in 2017. The largest increase in both value and percentage terms occurred in the industrial supply and materials category (up 17.77% or $68.8 billion). It was followed by automotive vehicles, parts, and engines (up 4.88% or $7.3 billion) and capital goods (up 2.63% or $2.63 billion).
At the product level, there were both increases and decreases in exports. The largest increases at the product level were in crude oil (up 142.24% or $13.2 billion), coal and coal products (up 78.79% or $6.1 billion), natural gas (up 76.14% or $3.5 billion), raw cotton (up 47.33% or $1.9 billion), truck, buses, and special purpose vehicles (up 26.70% or $2.6 billion), and automotive engines and parts (up 24.8% or $2.3 billion). The largest declines were in civilian aircraft (down 7.65%), telecommunications equipment (down 7.09%), soybeans (down 5.91%), and medicinal, dental, and pharmaceutical products (down 3.74%). The smallest increases in exports between 2016 and 2017 were in textile supplies (up 1.06%) and computer accessories (up 1.20%).
|
Product Category |
2016 |
2017 |
||||||
|
Value |
Value Change 2016/15 |
% Change 2016/15 |
% Share of Exports |
Value |
Value Change 2017/16 |
% Change 2017/16 |
% Share of Exports |
|
|
EXPORTS OF GOODS |
1,457.0 |
-54.4 |
-3.60 |
100.00 |
1,553.4 |
96.4 |
6.62 |
100.00 |
|
Capital Goods (Not Including Automotive) |
519.9 |
-19.9 |
-3.69 |
35.68 |
533.6 |
13.7 |
2.63 |
34.35 |
|
Engines and parts |
60.3 |
4.1 |
7.36 |
4.14 |
65.0 |
4.7 |
7.80 |
4.18 |
|
Civilian aircraft, complete, all types |
60.7 |
-2.7 |
-4.24 |
4.16 |
56.0 |
-4.6 |
-7.65 |
3.61 |
|
Electric-generating machinery, electric apparatus, and parts |
53.6 |
-1.8 |
-3.19 |
3.68 |
55.0 |
1.3 |
2.50 |
3.54 |
|
Semiconductors |
44.3 |
1.5 |
3.58 |
3.04 |
48.0 |
3.6 |
8.17 |
3.09 |
|
Scientific, hospital, and medical equipment and parts |
45.8 |
0.3 |
0.77 |
3.14 |
46.7 |
0.9 |
1.99 |
3.01 |
|
Telecommunications equipment |
41.2 |
-0.7 |
-1.65 |
2.83 |
38.2 |
-2.9 |
-7.09 |
2.46 |
|
Computer accessories, peripherals, and parts |
30.3 |
-0.6 |
-1.90 |
2.08 |
30.7 |
0.4 |
1.20 |
1.97 |
|
Industrial engines, pumps, and compressors |
26.0 |
-2.3 |
-8.23 |
1.78 |
25.2 |
-0.7 |
-2.88 |
1.63 |
|
Measuring, testing, and control instruments |
23.1 |
-0.9 |
-3.84 |
1.58 |
23.6 |
0.6 |
2.40 |
1.52 |
|
Oil-drilling, mining, and construction machinery |
16.9 |
-6.2 |
-26.84 |
1.16 |
17.9 |
1.0 |
5.87 |
1.15 |
|
Industrial Supplies and Materials |
387.4 |
-30.8 |
-7.36 |
26.59 |
456.2 |
68.8 |
17.77 |
29.37 |
|
Energy products |
112.5 |
-13.1 |
-10.42 |
7.72 |
160.7 |
48.2 |
42.86 |
10.35 |
|
Petroleum and products |
99.0 |
-11.0 |
-10.01 |
6.80 |
137.5 |
38.4 |
38.82 |
8.85 |
|
Coal and related products |
7.7 |
-1.1 |
-12.73 |
0.53 |
13.8 |
6.1 |
78.79 |
0.89 |
|
Natural gas |
4.6 |
-0.2 |
-3.37 |
0.32 |
8.1 |
3.5 |
76.14 |
0.52 |
|
Chemicals except medicinal |
103.8 |
-7.5 |
-6.70 |
7.12 |
112.0 |
8.2 |
7.91 |
7.21 |
|
Metals and nonmetallic products |
72.1 |
-5.8 |
-7.49 |
4.95 |
78.4 |
6.3 |
8.78 |
5.05 |
|
Paper |
20.8 |
-0.9 |
-4.21 |
1.43 |
22.1 |
1.2 |
5.89 |
1.42 |
|
Consumer Goods (Not Including Food and Automotive) |
193.3 |
-4.1 |
-2.06 |
13.26 |
197.1 |
3.9 |
2.01 |
12.69 |
|
Medicinal, dental, and pharmaceutical products |
53.1 |
-1.8 |
-3.19 |
3.65 |
51.2 |
-2.0 |
-3.74 |
3.29 |
|
Household and kitchen appliances and other household goods |
38.4 |
-1.3 |
-3.23 |
2.63 |
41.1 |
2.8 |
7.19 |
2.65 |
|
Jewelry and collectibles |
23.3 |
-0.2 |
-0.74 |
1.60 |
24.4 |
1.1 |
4.62 |
1.57 |
|
Gem diamonds and other gemstones |
21.1 |
0.9 |
4.33 |
1.45 |
21.0 |
0.0 |
-0.21 |
1.35 |
|
Automotive Vehicles, Parts, and Engines |
150.3 |
-1.6 |
-1.04 |
10.32 |
157.6 |
7.3 |
4.88 |
10.15 |
|
Passenger cars, new and used |
53.2 |
-1.4 |
-3.8 |
3.6 |
52.4 |
-0.7 |
-1.3 |
3.4 |
|
Trucks, buses, and special purpose vehicles |
18.0 |
0.1 |
-3.8 |
1.2 |
20.6 |
2.6 |
26.7 |
1.3 |
|
Engines and engine parts |
17.8 |
0.8 |
14.7 |
1.2 |
20.0 |
2.3 |
24.8 |
1.3 |
|
Foods, Feeds, and Beverages |
130.5 |
2.8 |
2.19 |
8.96 |
132.7 |
2.2 |
1.70 |
8.55 |
|
Grains and preparations |
27.9 |
-0.4 |
-1.41 |
1.92 |
27.6 |
-0.3 |
-1.23 |
1.77 |
|
Vegetables, fruits, nuts, and preparations |
24.5 |
-0.4 |
-1.71 |
1.68 |
25.1 |
0.6 |
2.64 |
1.62 |
|
Soybeans |
23.6 |
3.9 |
19.53 |
1.62 |
22.2 |
-1.4 |
-5.91 |
1.43 |
|
Meat products and poultry |
16.9 |
0.3 |
1.55 |
1.16 |
18.8 |
2.0 |
11.58 |
1.21 |
Source: CRS with data from the U.S. Department of Commerce, Bureau of Economic Analysis.
Notes: Select U.S. export categories and products. Details may not equal totals due to rounding.
Imports
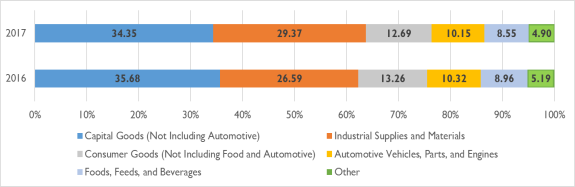
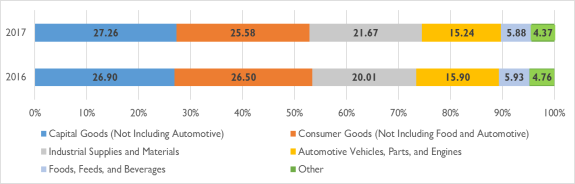
As with exports, capital goods (not including automotive) was also the largest U.S. import category in 2017, accounting for 27.26% of all U.S. imports (Figure 14 and Table 5). It was followed by consumer goods (25.58% of exports), industrial supplies and materials (21.67%), automotive vehicles, parts, and engines (15.24%), and foods, feeds, and beverages (5.88%). The top ten imports in 2017, as in 2016, continued to be: (1) household and kitchen goods; (2) passenger cars; (3) apparel and footwear; (4) crude; (5) metals; (6) medicinal, dental, and pharmaceutical products; (7) electric-generating machinery; (8) chemicals; (9) telecommunications equipment; and (10) computers.
|
Figure 14. U.S. Merchandise Imports by Category (percent of total imports) |
 |
|
Source: CRS calculations with data from the U.S. Department of Commerce, Bureau of Economic Analysis. |
U.S. imports in all merchandise categories increased in 2017. The largest increase in both value and percentage terms occurred in the industrial supply category (up 15.78% or $69.7 billion). It was followed by capital goods (up 8.38% or $49.8 billion) and foods, feeds, and beverages (up 5.94% or $7.8 billion).
At the product level, there were mostly increases in imports. The largest increases were in oil-drilling, mining, and construction machinery (up 34.55% or $5.1 billion), crude (up 30.49% or $31.7 billion), metals (up 19.92% or $18.5 billion), trucks, buses, and special purpose vehicles (up 19.7% or $2.9 billion), computers (up 13.36% or $8.1 billion), and fish and shellfish (up 10.77% or $2.1 billion). The largest declines in imports by product were in engines and engine parts (down 4.5%) and medicinal, dental, and pharmaceutical products (down 1.46%). The smallest increases in imports between 2016 and 2017 were in apparel and footwear (up 0.65% or $0.9 billion) and passenger cars (up 1.6% or $5.7 billion).
|
Product Category |
2016 |
2017 |
||||||
|
Value |
Value Change 2016/15 |
% Change 2016/15 |
% Share of Exports |
Value |
Value Change 2017/16 |
% Change 2017/16 |
% Share of Exports |
|
|
IMPORTS OF GOODS |
2,208.0 |
-65.2 |
-2.87 |
100.00 |
2,360.9 |
152.9 |
6.92 |
100.00 |
|
Capital Goods (Not Including Automotive) |
593.9 |
-13.3 |
-2.19 |
26.90 |
643.6 |
49.8 |
8.38 |
27.26 |
|
Electric-generating machinery, electric apparatus and parts |
70.6 |
-1.2 |
-1.64 |
3.20 |
76.1 |
5.5 |
7.78 |
3.22 |
|
Telecommunications equipment |
71.9 |
5.6 |
8.45 |
3.26 |
74.3 |
2.4 |
3.34 |
3.15 |
|
Computers |
60.9 |
-2.4 |
-3.77 |
2.76 |
69.0 |
8.1 |
13.36 |
2.92 |
|
Computer accessories, peripherals, and parts |
53.7 |
-3.3 |
-5.80 |
2.43 |
59.5 |
5.8 |
10.77 |
2.52 |
|
Semiconductors |
51.8 |
5.5 |
11.97 |
2.35 |
54.2 |
2.4 |
4.58 |
2.29 |
|
Scientific, hospital, and medical equipment and parts |
43.5 |
1.8 |
4.27 |
1.97 |
45.9 |
2.4 |
5.52 |
1.94 |
|
Engines and parts |
36.2 |
-0.8 |
-2.13 |
1.64 |
37.7 |
1.5 |
4.11 |
1.59 |
|
Industrial engines, pumps, and compressors |
22.5 |
-1.9 |
-7.64 |
1.02 |
24.7 |
2.2 |
9.71 |
1.04 |
|
Oil-drilling, mining, and construction machinery |
14.7 |
-6.4 |
-30.24 |
0.67 |
19.8 |
5.1 |
34.55 |
0.84 |
|
Consumer Goods (Not Including Food and Automotive) |
585.2 |
-11.2 |
-1.88 |
26.50 |
603.9 |
18.7 |
3.20 |
25.58 |
|
Household and kitchen appliances and other household goods |
172.6 |
0.2 |
0.13 |
7.82 |
187.8 |
15.2 |
8.78 |
7.95 |
|
Apparel, footwear, and household goods |
136.0 |
-8.1 |
-5.63 |
6.16 |
136.9 |
0.9 |
0.65 |
5.80 |
|
Medicinal, dental, and pharmaceutical products |
111.7 |
3.4 |
3.13 |
5.06 |
110.1 |
-1.6 |
-1.46 |
4.66 |
|
Toys and sporting goods, including bicycles |
36.8 |
-1.1 |
-2.90 |
1.67 |
39.0 |
2.3 |
6.13 |
1.65 |
|
Televisions, video receivers, and other video equipment |
24.1 |
-4.3 |
-15.12 |
1.09 |
25.7 |
1.6 |
6.74 |
1.09 |
|
Industrial Supplies and Materials |
441.8 |
-50.6 |
-10.28 |
20.01 |
511.6 |
69.7 |
15.78 |
21.67 |
|
Crude |
103.9 |
-24.7 |
-19.21 |
4.71 |
135.6 |
31.7 |
30.49 |
5.74 |
|
Metals and nonmetallic products |
92.9 |
-8.8 |
-8.62 |
4.21 |
111.4 |
18.5 |
19.92 |
4.72 |
|
Chemicals except medicinal |
69.9 |
-3.7 |
-5.04 |
3.17 |
74.7 |
4.8 |
6.88 |
3.17 |
|
Building materials except metals |
32.4 |
2.5 |
8.43 |
1.47 |
35.2 |
2.9 |
8.83 |
1.49 |
|
Automotive Vehicles, Parts, and Engines |
351.1 |
1.0 |
0.29 |
15.90 |
359.8 |
8.8 |
2.50 |
15.24 |
|
Passenger cars, new and used |
170.3 |
3.9 |
7.8 |
7.7 |
176.0 |
5.7 |
1.6 |
7.5 |
|
Other parts and accessories |
118.3 |
-0.7 |
-4.6 |
5.4 |
118.4 |
0.1 |
-3.2 |
5.0 |
|
Trucks, buses, and special purpose vehicles |
34.0 |
-1.2 |
-4.5 |
1.5 |
36.9 |
2.9 |
19.7 |
1.6 |
|
Engines and engine parts |
28.4 |
-1.1 |
-5.2 |
1.3 |
28.6 |
0.1 |
-4.5 |
1.2 |
|
Foods, Feeds, and Beverages |
131.0 |
2.3 |
1.76 |
5.93 |
138.8 |
7.8 |
5.94 |
5.88 |
|
Vegetables, fruits, nuts, and preparations |
33.0 |
2.6 |
8.38 |
1.50 |
34.9 |
1.9 |
5.70 |
1.48 |
|
Fish and shellfish |
19.5 |
0.8 |
4.14 |
0.88 |
21.6 |
2.1 |
10.77 |
0.91 |
|
Meat products and poultry |
10.8 |
-2.1 |
-15.98 |
0.49 |
11.1 |
0.3 |
2.48 |
0.47 |
Source: CRS with data from the U.S. Department of Commerce, Bureau of Economic Analysis.
Notes: Select U.S. import categories and products. Details may not equal totals due to rounding.
Energy Trade
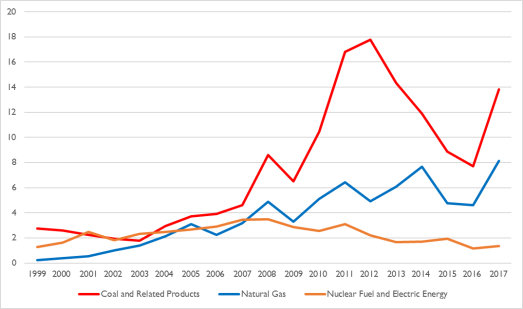
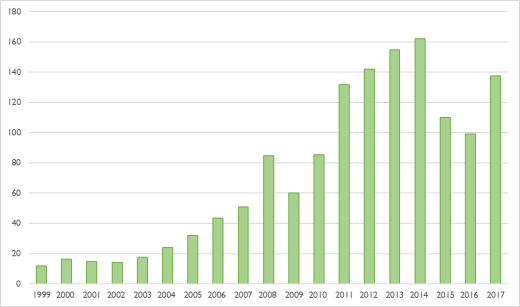
In 2017, U.S. exports of all categories of energy products rose sharply, up 42.86% compared to a decline of 10.42% in 2016. The removal of the U.S. government ban on most exports of U.S. crude (to countries other than Canada) in December 2015 is thought to be a contributing factor. U.S. exports that rose in 2017 include petroleum and petroleum products (38.82%), coal and coal products (78.79%), and natural gas (76.14%) (Table 4, Figure 15, and Figure 16). According to the U.S. Energy Information Administration (EIA), annual average U.S. crude oil production reached 9.3 million barrels per day in 2017, an increase of 464,000 barrels per day (5.25%) from 2016 levels, after declining by 551,000 barrels per days in 2016.24 In November 2017, monthly U.S. crude oil production reached 10.07 million barrels per day, the highest monthly level of crude oil production in U.S. history. U.S. crude oil production has increased significantly over the past 10 years, driven largely by production from tight rock formations using horizontal drilling and hydraulic fracturing. EIA projects that U.S. crude oil production will continue to grow in 2018 and 2019, averaging 10.7 and 11.3 million barrels per day, respectively.
Over the same period, the United States exported 97.0 million short tons of coal, a 61% (36.7 million short tons) increase from the 2016 level.25 Exports to Asia more than doubled in 2017, although Europe continues to be the largest recipient of U.S. coal exports. Steam coal, which is used to generate electricity, accounted for most of the increase in coal exports in 2017. The Netherlands, South Korea, India, Mexico, and Japan were the top recipients of U.S. steam coal exports. India imported nearly three times as much steam coal in 2017 as it did in 2016—mainly to fuel growing electricity capacity in the country.
|
Figure 15. U.S. Exports of Coal, Natural Gas, Nuclear Fuel, and Electric Energy (in billions of current U.S. dollars) |
 |
|
Source: CRS with data from the U.S. Department of Commerce, Bureau of Economic Analysis. |
|
Figure 16. U.S. Exports of Petroleum and Petroleum Products (in billions of current U.S. dollars) |
 |
|
Source: CRS with data from the U.S. Department of Commerce, Bureau of Economic Analysis. |
Trade in Goods with Leading Partners
In 2017, the EU was the United States' top trading partner in terms of two-way merchandise trade, followed by China, Canada, and Mexico (Table 6). Ranked by exports, the EU was the leading market for U.S. exports, which totaled $284.8 billion (18.33% of all U.S. exports). Canada was the second largest export market ($282.9 billion worth of U.S. exports or 18.21% of all U.S. exports), followed by Mexico and China. In terms of imports, China was the leading source of U.S. imports ($506.3 billion or 21.44% of all U.S. imports), followed by the EU ($437.4 billion or 18.53% of all U.S. imports), Mexico, and Canada.
U.S. merchandise exports to all six top trading partners increased from 2016 to 2017. The largest increase in value was a $15.63 billion increase in U.S. exports to Canada, which totaled $282.9 billion in 2017, compared to $267.2 billion in 2016. It was followed by a $14.4 billion increase in exports to China, from $115.9 billion in 2016 to $130.4 billion in 2017. In percentage terms, the largest increases in U.S. exports in 2017 were to South Korea (14.65%) and China (12.45%).
U.S. merchandise imports from all six top trading partners also increased in 2017. The largest rise in value was a $43.0 billion (9.30%) increase in imports from China, a $21.9 billion (7.73%) increase in imports from Canada, and a $19.7 billion (6.55%) increase in imports from Mexico.
|
Trading Partner |
Total Trade |
Exports |
Imports |
Trade Balance |
|||
|
2017 |
2017 |
% Change 2017/16 |
2017 |
% Change 2017/16 |
2017 |
% Change 2017/16 |
|
|
World |
3,914.3 |
1,553.4 |
6.62 |
2,360.9 |
6.92 |
-807.5 |
7.52 |
|
European Union |
722.2 |
284.8 |
5.11 |
437.4 |
4.37 |
-152.6 |
3.01 |
|
China |
636.7 |
130.4 |
12.45 |
506.3 |
9.30 |
-375.9 |
8.25 |
|
Canada |
588.4 |
282.9 |
5.85 |
305.5 |
7.73 |
-22.7 |
38.46 |
|
Mexico |
563.8 |
243.8 |
5.85 |
320.0 |
6.55 |
-76.1 |
8.86 |
|
Japan |
206.6 |
68.3 |
7.10 |
138.3 |
3.06 |
-70.0 |
-0.60 |
|
Germany |
171.8 |
53.9 |
9.09 |
118.0 |
2.94 |
-64.1 |
-1.72 |
|
South Korea |
121.1 |
49.3 |
14.65 |
71.8 |
2.05 |
-22.6 |
-17.69 |
|
United Kingdom |
110.3 |
56.6 |
1.94 |
53.7 |
-2.28 |
2.9 |
427.29 |
|
France |
83.0 |
33.7 |
7.77 |
49.3 |
4.70 |
-15.5 |
-1.40 |
|
India |
74.4 |
25.7 |
18.65 |
48.7 |
5.59 |
-23.0 |
-6.00 |
|
Taiwan |
68.8 |
26.3 |
-0.88 |
42.5 |
8.32 |
-16.2 |
27.56 |
|
Italy |
68.6 |
18.5 |
10.19 |
50.1 |
10.22 |
-31.7 |
10.24 |
|
Brazil |
64.9 |
37.1 |
23.48 |
27.8 |
12.93 |
9.3 |
71.66 |
|
Singapore |
48.8 |
29.5 |
11.37 |
19.3 |
8.65 |
10.1 |
16.93 |
|
Hong Kong |
48.5 |
40.7 |
14.54 |
7.8 |
-0.06 |
32.9 |
18.65 |
|
Saudi Arabia |
35.2 |
16.3 |
-9.67 |
19.0 |
11.57 |
-2.7 |
-362.01 |
Source: CRS calculations with data from the U.S. Department of Commerce, Bureau of Economic Analysis.
Notes: Total trade, or two-way trade, is the sum of exports and imports.
Trade in Goods with Free Trade Agreement Partners26
U.S. two-way (exports plus imports) merchandise trade between the United States and its 20 FTA partners was $1,517.2 billion in 2017 countries.27 It accounted for 38.76% of total U.S. merchandise trade with the world. The value of U.S. exports to FTA partners totaled $720.3 billion, a 6.55% ($44.3 billion) increase from $676.0 billion in 2016. The value of U.S. exports to most FTA partners increased in 2017; the exceptions were exports to Bahrain and Israel, which declined 0.15% ($1.3 million) and 4.91% ($647 million), respectively (Table 7). U.S. imports from FTA partners were valued at $796.8 billion, a 6.5% ($48.6 billion) increase from $748.2 billion in 2016. The U.S. merchandise trade deficit with all FTA partners increased 5.98% ($4.3 billion) to $76.5 billion in 2017.
Table 7. U.S. Merchandise Trade with Free Trade Agreement Partners
(in millions of current U.S. dollars)
|
FTA Partner |
2016 |
2017 |
||||
|
Exports |
Imports |
Balance |
Exports |
Imports |
Balance |
|
|
Australia |
22,149.3 |
9,509.0 |
12,640.2 |
24,526.8 |
10,045.3 |
14,481.5 |
|
Bahrain |
899.5 |
768.3 |
131.3 |
898.2 |
995.7 |
-97.6 |
|
Canada |
266,734.5 |
277,782.3 |
-11,047.8 |
282,265.1 |
299,319.4 |
-17,054.3 |
|
Chile |
12,936.5 |
8,796.9 |
4,139.6 |
13,605.3 |
10,551.0 |
3,054.3 |
|
Colombia |
13,047.3 |
13,798.3 |
-751.0 |
13,312.1 |
13,556.6 |
-244.5 |
|
Costa Rica |
5,869.6 |
4,330.8 |
1,538.8 |
6,169.6 |
4,563.8 |
1,605.8 |
|
Dominican Republic |
7,751.0 |
4,679.1 |
3,071.9 |
7,827.5 |
4,746.2 |
3,081.3 |
|
El Salvador |
2,918.7 |
2,495.9 |
422.8 |
3,057.9 |
2,470.5 |
587.4 |
|
Guatemala |
5,835.2 |
3,937.6 |
1,897.6 |
6,895.3 |
4,014.7 |
2,880.6 |
|
Honduras |
4,827.5 |
4,617.6 |
209.9 |
5,079.7 |
4,581.2 |
498.4 |
|
Israel |
13,197.7 |
22,217.6 |
-9,019.9 |
12,550.1 |
21,944.6 |
-9,394.5 |
|
Jordan |
1,459.1 |
1,554.7 |
-95.6 |
1,920.9 |
1,687.3 |
233.6 |
|
South Korea |
42,312.7 |
69,895.3 |
-27,582.7 |
48,326.4 |
71,444.2 |
-23,117.8 |
|
Mexico |
230,051.2 |
293,923.9 |
-63,872.8 |
243,314.4 |
314,267.3 |
-70,952.9 |
|
Morocco |
1,932.7 |
1,021.1 |
911.6 |
2,219.7 |
1,232.7 |
986.9 |
|
Nicaragua |
1,480.0 |
3,293.6 |
-1,813.6 |
1,589.4 |
3,262.6 |
-1,673.2 |
|
Oman |
1,804.1 |
1,125.4 |
678.7 |
1,985.0 |
1,067.3 |
917.7 |
|
Panama |
6,069.3 |
410.1 |
5,659.2 |
6,301.3 |
442.5 |
5,858.8 |
|
Peru |
7,927.0 |
6,253.4 |
1,673.6 |
8,662.6 |
7,282.8 |
1,379.8 |
|
Singapore |
26,831.6 |
17,832.3 |
8,999.3 |
29,805.9 |
19,367.5 |
10,438.4 |
Source: CRS calculations with data from the U.S. Department of Commerce, Census Bureau.
Notes: Census basis.
The value of U.S. imports entering into the United States under the preferential terms of an FTA—or subject to the FTA tariff scheme—was $385.6 billion in 2017, a 2.83% ($10.6 billion) increase from the 2016 value of $375.0 billion. These imports accounted for nearly half (48.39%) of total imports from FTA partners in 2017 and for 16.47% of total U.S. imports from the world. FTA imports from Chile grew 26.59% ($1.3 billion), which represented the largest percent increase. Imports under FTAs from Peru and Bahrain increased 24.42% ($650 million) and 16.68% ($83.0 million), respectively, albeit from smaller baselines. Combined imports from the NAFTA partners (Canada and Mexico) rose 3.54% ($10.7 billion). U.S. imports under an FTA declined the most from Oman (down 13.81% or 113.0 million), followed by Colombia (down 7.00% or 377.0 million), and South Korea (down 5.62% or 2.0 billion).
U.S. Trade in Services
The United States remains highly competitive in the global services market. As the world's top exporter of services, the United States accounted for $780.9 billion, or 14.55%, of world services exports in 2017 (Figure 17).28 Other top exporters included the UK ($360.6 billion or 6.72% share), Germany ($308.7 billion or 5.75%), France ($265.7 billion or 4.95%), and China ($206.5 billion or 3.85%). Most of the world's top 10 services exporters in 2017 were developed countries. However, China (currently the fifth largest services exporter) and India (currently the seventh largest services exporter) have been among the top 10 since the mid-2000s. Overall, the top 10 exporting countries together accounted for 52.14% of world services exports in 2017.
The United States also remains the world's largest importer of services ($538.1 billion or 10.57% of total world services imports), followed by China ($71.9 billion or 9.27%), Germany ($327.1 billion or 6.42%), France ($244.7 or 4.81%), and the UK ($222.6 billion or 4.37%). The top 10 importer countries together accounted for 52.04% of world services imports in 2017.
U.S. two-way (exports and imports) trade in services grew 5.63% between 2016 and 2017 (Figure 18). During that period, U.S. exports of services increased 5.11% ($38 billion), from $758.9 billion to $797.7 billion, while U.S. services imports grew 6.40% ($32.6 billion), from $509.8 billion to $542.5 billion (Table 8). The U.S. surplus in services trade increased 2.45% ($6.1 billion) to $255.2 billion. U.S. exports in all nine services export categories grew in 2017. The services export categories with the highest growth rates in 2017 included: financial services (10.32%), telecommunications, computers, and information services (9.52%), and insurance services (5.74%). U.S. imports of services grew in all but one of the services import categories (maintenance and repair services).
|
Figure 17. U.S. Share of World Services Exports and Imports (as a percentage of world trade) |
 |
|
Source: CRS calculations with data from the International Monetary Fund, Balance of Payments Statistics Yearbook (September 2018). Notes: Balance of Payments basis. |
|
Figure 18. Annual Growth in U.S. Trade in Services (percent change from preceding year) |
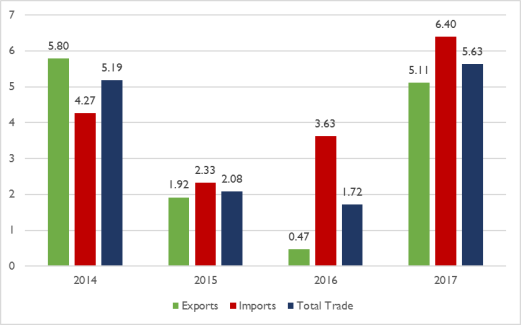 |
|
Source: CRS calculations with data from the U.S. Department of Commerce, Bureau of Economic Analysis. Notes: Nominal growth. Balance of Payments basis. |
|
Calendar Year |
Exports |
Imports |
Balance |
|
1992 |
177.3 |
119.6 |
57.7 |
|
1993 |
185.9 |
123.8 |
62.1 |
|
1994 |
200.4 |
133.1 |
67.3 |
|
1995 |
219.2 |
141.4 |
77.8 |
|
1996 |
239.5 |
152.6 |
86.9 |
|
1997 |
256.1 |
165.9 |
90.2 |
|
1998 |
262.8 |
180.7 |
82.1 |
|
1999 |
271.3 |
192.9 |
78.5 |
|
2000 |
290.4 |
216.1 |
74.3 |
|
2001 |
274.3 |
213.5 |
60.9 |
|
2002 |
280.7 |
224.4 |
56.3 |
|
2003 |
290.0 |
242.2 |
47.8 |
|
2004 |
338.0 |
283.1 |
54.9 |
|
2005 |
373.0 |
304.4 |
68.6 |
|
2006 |
416.7 |
341.2 |
75.6 |
|
2007 |
488.4 |
372.6 |
115.8 |
|
2008 |
532.8 |
409.1 |
123.8 |
|
2009 |
512.7 |
386.8 |
125.9 |
|
2010 |
562.8 |
409.3 |
153.4 |
|
2011 |
627.1 |
435.8 |
191.3 |
|
2012 |
655.7 |
452.0 |
203.7 |
|
2013 |
700.5 |
461.1 |
239.4 |
|
2014 |
741.1 |
480.8 |
260.3 |
|
2015 |
755.3 |
492.0 |
263.3 |
|
2016 |
758.9 |
509.8 |
249.1 |
|
2017 |
797.7 |
542.5 |
255.2 |
Trade in Services by Category
Exports
U.S. travel services exports, valued at $210.7 billion in 2017, accounted for the largest share (26.42%) of total U.S. services exports in 2017 (Figure 19 and Table 9). Other large U.S. services export categories included: charges for the use of intellectual property ($128.4 billion or 16.09% of all U.S. exports), financial services ($109.6 billion or 13.74%), and transport ($88.6 billion or 11.11%). After growing 0.47% in 2016, total U.S. services exports were up 5.11% in 2017. In all services categories, exports increased in 2017, following decreases in several categories in 2016. These included transport (up 4.63% in 2017, compared to a decline of 3.47% in 2016), financial services (up 10.32% in 2017, compared to a decline of 2.98% in 2016), charges for the use of intellectual property (up 2.91% in 2017, compared to a decline of 0.03% in 2016), and travel (up 5.11% in 2017, compared to a decline of 0.02% in 2016).
|
Figure 19. U.S. Services Exports by Category (percent of total exports) |
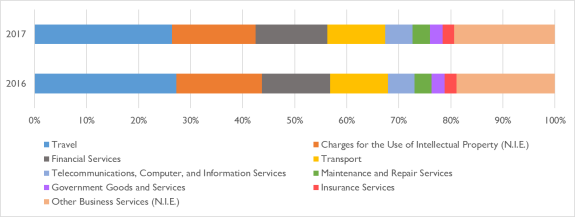 |
|
Source: CRS calculations with data from the U.S. Department of Commerce, Bureau of Economic Analysis. Notes: N.I.E.: not included elsewhere. |
|
Product Category |
2016 |
2017 |
||||||
|
Value |
Value Change 2016/15 |
% Change 2016/15 |
% Share of Exports |
Value |
Value Change 2017/16 |
% Change 2017/16 |
% Share of Exports |
|
|
EXPORTS OF SERVICES |
758.9 |
3.6 |
0.47 |
100.00 |
797.7 |
38.8 |
5.11 |
100.00 |
|
Travel |
206.9 |
-0.03 |
-0.02 |
27.26 |
210.7 |
3.8 |
1.86 |
26.42 |
|
Charges for the Use of Intellectual Property (N.I.E.)* |
124.7 |
-0.04 |
-0.03 |
16.44 |
128.4 |
3.6 |
2.91 |
16.09 |
|
Financial Services |
99.4 |
-3.1 |
-2.98 |
13.10 |
109.6 |
10.3 |
10.32 |
13.74 |
|
Transport |
84.7 |
-3.0 |
-3.47 |
11.16 |
88.6 |
3.9 |
4.63 |
11.11 |
|
Telecommunications, Computer, and Information Services |
38.5 |
2.0 |
5.39 |
5.08 |
42.2 |
3.7 |
9.52 |
5.29 |
|
Maintenance and Repair Services |
25.0 |
1.6 |
6.93 |
3.29 |
26.4 |
1.4 |
5.70 |
3.31 |
|
Government Goods and Services |
18.8 |
-1.3 |
-6.40 |
2.48 |
19.3 |
0.5 |
2.81 |
2.42 |
|
Insurance Services |
17.1 |
0.8 |
5.04 |
2.25 |
18.0 |
1.0 |
5.74 |
2.26 |
|
Business Services (N.I.E.)* |
143.8 |
6.6 |
4.83 |
18.94 |
154.3 |
10.5 |
7.33 |
19.34 |
Source: CRS with data from the U.S. Department of Commerce, Bureau of Economic Analysis.
Notes: *N.I.E.: not included elsewhere. Details may not equal totals due to rounding.
Imports
Categories that accounted for the largest shares of U.S. services imports in 2017 included travel services (with $135.0 billion or 24.89% of all U.S. imports), transport ($101.7 billion or 18.76%), charges for the use of intellectual property ($51.3 billion or 9.45%), insurance services ($50.7 or 9.34%), telecommunications, computers, and information services ($40.1 billion or 7.38%), and financial services ($28.9 billion or 5.33%) (Figure 20 and Table 10). All but one of the nine services import categories experienced positive growth in 2017. These include financial services (up 12.34%, following a 0.07% decline in 2016), charges for the use of intellectual property rights (up 10.11%, following a 14.70% increase in 2016), travel (up 9.27%, following a 7.88% increase in 2016), and telecommunications, computers, and information services (up 7.12%, following a 1.87% increase in 2016). Imports of maintenance and repair services declined 4.51% in 2017, following a 3.13% decline in 2016.
|
Figure 20. U.S. Services Imports by Category (percent of total imports) |
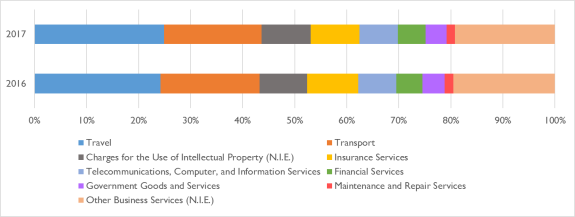 |
|
Source: CRS calculations with data from the U.S. Department of Commerce, Bureau of Economic Analysis. Notes: N.I.E.: not included elsewhere. |
|
Product Category |
2016 |
2017 |
||||||
|
Value |
Value Change 2016/15 |
% Change 2016/15 |
% Share of Exports |
Value |
Value Change 2017/16 |
% Change 2017/16 |
% Share of Exports |
|
|
IMPORTS OF SERVICES |
509.8 |
17.9 |
3.63 |
100.00 |
542.5 |
32.6 |
6.40 |
100.00 |
|
Travel |
123.6 |
9.0 |
7.88 |
24.24 |
135.0 |
11.5 |
9.27 |
24.89 |
|
Transport |
96.9 |
-0.1 |
-0.07 |
19.01 |
101.7 |
4.8 |
4.96 |
18.76 |
|
Charges for the Use of Intellectual Property |
46.6 |
6.0 |
14.70 |
9.14 |
51.3 |
4.7 |
10.11 |
9.45 |
|
Insurance Services |
49.9 |
2.5 |
5.23 |
9.79 |
50.7 |
0.8 |
1.53 |
9.34 |
|
Telecommunications, Computer, and Information Services |
37.4 |
0.7 |
1.87 |
7.33 |
40.1 |
2.7 |
7.12 |
7.38 |
|
Financial Services |
25.8 |
0.0 |
-0.07 |
5.05 |
28.9 |
3.2 |
12.34 |
5.33 |
|
Government Goods and Services |
21.5 |
0.0 |
-0.13 |
4.22 |
22.0 |
0.5 |
2.53 |
4.06 |
|
Maintenance and Repair Services |
8.7 |
-0.3 |
-3.13 |
1.71 |
8.3 |
-0.4 |
-4.51 |
1.54 |
|
Business Services (N.I.E)* |
99.5 |
0.1 |
0.11 |
19.51 |
104.4 |
4.9 |
4.93 |
19.24 |
Source: CRS with data from the U.S. Department of Commerce, Bureau of Economic Analysis.
Notes: *N.I.E.: not included elsewhere. Details may not equal totals due to rounding.
Trade in Services with Leading Partners
In 2017, the EU—as a single entity—was the United States' top trading partner in terms of two-way (exports plus imports) services trade, while the largest single-country trading partners were the UK, Canada, Japan, China, and Germany (Table 11). The EU was the largest export market for U.S. services in 2017, as well as the largest foreign supplier of U.S. services imports. The EU accounted for $243.4 billion (30.51%) of total U.S. services exports and $192.0 billion (35.39%) of total U.S. services imports. After the EU, the top markets for U.S. services exports were the UK, Canada, China, and Japan, while the top sources of U.S. services imports were the UK, Germany, Japan, and Canada. In 2017, the United States maintained a services trade surplus with every major services trading partner except with Hong Kong ($4.4 billion deficit), India ($3.1 billion deficit), and France ($2.7 billion deficit).
U.S. services exports to nearly all leading trading partners increased from 2016 to 2017. Exports declined to Taiwan (down $1.8 billion or 15.18%), France (down $552 million or 2.79%), and Saudi Arabia (down $155.0 billion or 1.66%). The largest increase in value was a $4.1 billion increase in U.S. services exports to Canada, followed by a $3.1 billion increase to India and a $2.8 billion increase to the UK. In percentage terms, the largest increases in U.S. services exports between 2016 and 2017 were to Hong Kong (19.15%), India (15.19%), South Korea (11.24%), and Brazil (10.57%).
U.S. services imports from all but two of the major trading partners increased in 2017. Imports from both Brazil and South Korea fell last year, down 6.90% ($534 million) and 0.18% ($20 million), respectively. The largest increases in value were a $4.6 billion increase in U.S. services imports from the UK (up 8.77%), a $2.4 billion increase in imports from Canada (up 7.98%), and a $2.3 billion increase in imports from India (up 8.98%). In percentage terms, the largest increase in U.S. services imports between 2016 and 2017 was from Hong Kong (up 10.11%), followed by Singapore (up 9.31%) and Italy (up 9.22%).
|
Trading Partner |
Total Trade |
Exports |
Imports |
Trade Balance |
|||
|
2017 |
2017 |
% Change 2017/16 |
2017 |
% Change 2017/16 |
2017 |
% Change 2017/16 |
|
|
World |
1340.2 |
797.7 |
5.11 |
542.5 |
6.40 |
255.2 |
2.48 |
|
European Union |
435.4 |
243.4 |
3.47 |
192.0 |
7.15 |
1.7 |
-47.06 |
|
United Kingdom |
126.6 |
69.6 |
4.14 |
56.9 |
8.77 |
51.4 |
-8.28 |
|
Canada |
91.5 |
58.4 |
7.52 |
33.0 |
7.97 |
25.4 |
6.93 |
|
Japan |
79.5 |
46.4 |
3.07 |
33.1 |
6.43 |
13.3 |
22.74 |
|
China |
75.0 |
57.6 |
4.89 |
17.4 |
8.65 |
40.2 |
3.35 |
|
Germany |
68.1 |
32.7 |
2.55 |
35.4 |
4.70 |
2.1 |
91.87 |
|
Mexico |
58.4 |
32.9 |
3.84 |
25.5 |
5.79 |
8.0 |
-2.24 |
|
India |
51.9 |
23.7 |
15.19 |
28.1 |
8.98 |
-3.1 |
24.29 |
|
France |
36.8 |
19.2 |
-2.79 |
17.5 |
5.85 |
-2.7 |
40.93 |
|
South Korea |
35.0 |
24.2 |
11.24 |
10.9 |
-0.18 |
7.4 |
-2.35 |
|
Brazil |
33.6 |
26.4 |
10.57 |
7.2 |
-6.90 |
19.2 |
18.92 |
|
Singapore |
25.9 |
18.0 |
6.64 |
7.9 |
9.31 |
1.8 |
-53.95 |
|
Hong Kong |
21.7 |
11.9 |
19.15 |
9.8 |
10.11 |
-4.4 |
-15.65 |
|
Italy |
21.7 |
9.3 |
4.99 |
12.4 |
9.22 |
13.4 |
-4.39 |
|
Taiwan |
18.0 |
9.9 |
-15.18 |
8.1 |
4.32 |
12.7 |
-12.56 |
|
Saudi Arabia |
10.4 |
9.2 |
-1.66 |
1.2 |
2.37 |
10.2 |
4.65 |
Source: CRS calculations with data from the U.S. Department of Commerce, Bureau of Economic Analysis.
Notes: Total trade, or two-way trade, is the sum of services exports and imports.
U.S. Total Trade in Goods and Services
Since the United States runs a surplus in trade in services and a deficit in trade in goods, the combined trade deficit on goods and services is lower (less negative) than the deficit on goods alone. In 2017, exports of goods and services totaled $2,351.1 billion and imports totaled $2,903.3 billion, resulting in a deficit of $552.3 billion, up slightly from 2016 but down from the all-time high level registered in 2006 ($761.7 billion) (Table 12).
Trade in goods and services has risen in importance in the U.S. economy over the past two decades. Exports and imports of goods and services, both in U.S. dollars and as a percentage of gross domestic product (GDP), has been on the rise since the 1990s, although these shares still remains significantly lower than those of most major economies (Table 13). In 1990, total U.S. trade (sum of exports and imports of goods and services measured as a share of GDP) was equal to about 19.82% of GDP; it stood at 27.09% in 2017 (Figure 21).
|
Description |
2014 |
2015 |
2016 |
2017 |
% Change 2015/14 |
% Change 2016/15 |
% Change 2017/16 |
|
|
Exports |
2,376.7 |
2,266.7 |
2,215.8 |
2,351.1 |
-4.63 |
-2.24 |
6.10 |
|
|
Imports |
2,866.2 |
2,765.2 |
2,717.8 |
2,903.3 |
-3.52 |
-1.71 |
6.83 |
|
|
Balance |
-489.6 |
-498.5 |
-502.0 |
-552.3 |
1.83 |
0.70 |
10.02 |
|
Source: CRS calculations with data from the U.S. Department of Commerce, Bureau of Economic Analysis.
Note: Balance of Payments basis.
|
Country |
2009 |
2010 |
2011 |
2012 |
2013 |
2014 |
2015 |
2016 |
2017 |
|
Germany |
70.67 |
79.30 |
84.75 |
85.87 |
84.84 |
84.49 |
85.76 |
84.27 |
86.90 |
|
Canada |
58.35 |
60.06 |
62.33 |
62.40 |
61.97 |
64.06 |
65.53 |
64.35 |
64.06 |
|
France |
50.46 |
54.87 |
58.79 |
59.70 |
59.76 |
60.48 |
61.75 |
61.13 |
62.87 |
|
United Kingdom |
54.44 |
59.03 |
62.56 |
61.44 |
61.35 |
58.50 |
56.48 |
58.58 |
62.46 |
|
Italy |
45.61 |
52.35 |
55.58 |
56.18 |
55.47 |
55.76 |
56.92 |
56.35 |
59.51 |
|
India |
46.78 |
49.69 |
55.62 |
55.79 |
53.84 |
48.92 |
41.95 |
40.35 |
40.64 |
|
China |
44.61 |
48.89 |
50.60 |
48.11 |
46.57 |
44.88 |
39.45 |
37.03 |
37.80 |
|
Brazil |
22.11 |
22.52 |
23.70 |
24.77 |
25.56 |
24.69 |
26.95 |
24.57 |
24.12 |
|
Japan |
24.49 |
28.61 |
30.39 |
30.64 |
34.15 |
37.55 |
35.60 |
31.27 |
35.16 |
|
United States |
24.77 |
28.18 |
30.89 |
30.71 |
30.23 |
30.16 |
27.89 |
26.58 |
26.98 |
While total trade has increased, U.S. imports have grown faster than U.S. exports, causing an increase in the trade deficit. However, the deficit is down 22.07% since registering an all-time high of $761.7 billion in 2006. In 2017, the annual trade deficit on goods and services amounted to approximately 2.83% of U.S. GDP, up from 2.68% in 2016 but down from 5.51% in 2006 (Figure 22). A level of 4-5% of GDP for countries is often considered to be cautionary by economists.29 At that level, other countries have experienced problems paying for imports and maintaining the value of their currency.
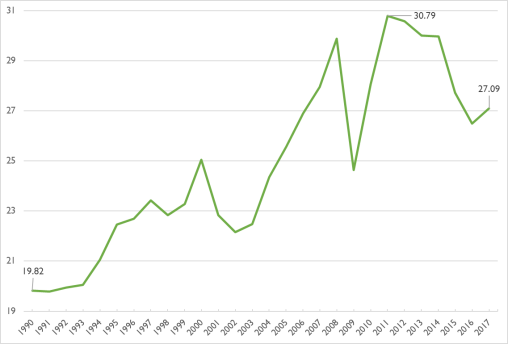 |
|
Source: CRS with data from the U.S. Department of Commerce, Bureau of Economic Analysis. Notes: Sum of exports and imports of goods and services as a share of U.S. GDP. |
|
(as a percent of GDP) |
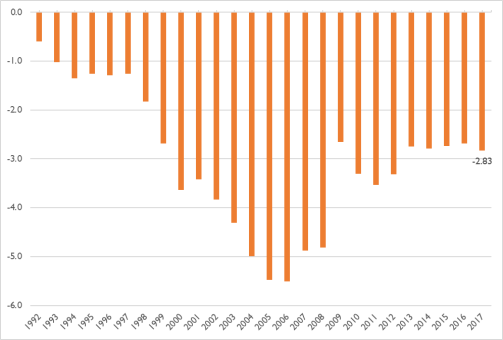 |
|
Source: CRS with data from the U.S. Department of Commerce, Bureau of Economic Analysis. Notes: Trade in goods and services. |
Issues for Congress
Congress plays a major role in shaping U.S. trade policy through its legislative and oversight authority. Article I, Section 8 of the U.S. Constitution grants Congress the power to "regulate Commerce with foreign Nations" and to "lay and collect Taxes, Duties, Imposts, and Excises…." Congress exercises this authority in numerous ways, including the enactment of laws authorizing trade programs and measures to address unfair and other trade practices. Congress also conducts oversight of trade policies, programs, and agreements. These include such areas as U.S. trade agreement negotiations, tariffs and nontariff barriers, trade remedy laws, import and export policies, economic sanctions, and the trade policy functions of the federal government.
Shifts in U.S. trade policy can play a role in shaping U.S. trade patterns and the global trade landscape. The Trump Administration's trade policy, which it characterizes as "Putting America First," has placed questions regarding the role of trade in the U.S. economy, the future of U.S. trade policy, and the U.S. role in the global economy at the forefront of the congressional policy debate. The President's 2018 Trade Policy Agenda represents a shift from the approaches of prior administrations to international trade, in that it questions the benefits of the U.S. leadership role in the rules-based global trading system, while emphasizing concerns over the potential limits that this system may place on U.S. sovereignty.
Political factors and economic conditions affect the current trade policy environment, as well as the composition and direction of U.S. trade. The political factors involve the opinions of the American public and major stakeholders on trade, the preferences and perspectives of the President and Members of Congress, and the tensions between the legislative and executive branches—as they both exercise their respective trade policy functions. The economic forces include global economic developments, the rise of emerging market and developing economies, and the growth of global production networks. Other factors affecting U.S. trade include the proliferation of free trade agreements and other preferential trade arrangements, the inherent limitations of trade policy as a tool of economic policy, the growth of "behind the border" trade barriers, and—according to some analysts—the long-standing U.S. trade deficit.
Currently, U.S. policymakers appear to be at a crossroads on these issues. While the future shape, direction, and content of U.S. trade policy remain uncertain, U.S. trade trends and developments may feature high on Congress' agenda in the coming months. Some of the questions and options that Congress may contemplate with respect to international trade include:
Are the benefits of international trade to the U.S. economy greater than the costs? If so, should the United States continue to promote greater international economic integration—as it has been doing since the 1940s? Greater trade liberalization—whether via unilateral or multilateral trade negotiations and agreements—would promote further U.S. integration with the world economy and with it, according to most economists, a more efficient allocation of resources and higher economic growth. It would also encourage the development and adherence to internationally negotiated rules on trade to promote stability and to prevent the use of protectionist measures. However, it would also expose already vulnerable firms and workers to increased competition, forcing them to make costly adjustments.
Do the costs of international trade outweigh the benefits to the U.S. economy? If so, should the United States suspend or reverse past U.S. efforts to liberalize U.S. and international trade? Members of Congress could reevaluate trade policy as a whole to determine if it has benefitted or harmed U.S. interests, and they could reserve the opportunity to renegotiate trade agreements if trading partners fail to honor their commitments. This approach would aim to protect U.S. national sovereignty over matters pertaining to U.S. economic welfare and national security. Opponents of this approach have argued that it is very difficult, if not impossible, to determine the impact of trade negotiations and agreements on economic trends (e.g. the level of employment, the U.S. trade deficit, etc.), because so many other factors play a role. They also argue that revisiting and renegotiating trade agreements could undermine the credibility of the United States as a trading partner.
Has U.S. trade policy failed to address effectively foreign protectionist practices and enhance reciprocal market access for U.S. firms, workers, and exports? If so, should the United States only support greater international economic integration if it provides for a "level playing field"? Policymakers may want to address what some view as inequities in trade policy by proceeding with trade agreements that require U.S. trade partners to adhere to "fair" trading practices, core labor standards, environmental protection measures, and other provisions to "level the playing field." In so doing, such trade agreements could be acceptable to larger segments of the American public and rebuild a consensus on trade. However, some trading partners have resisted what they consider efforts to impose U.S. values or preferences on them through trade policy.
Other potential issues for Congress raised by changes in U.S. trade patterns and the global landscape include: (1) the future direction of the global trading system, as well as specific policies and issues raised by global economic developments; (2) the impact of the changing dynamics and composition of U.S. trade on the U.S. economy and U.S. relations with trading partners; (3) how to take full advantage of growing markets for U.S. manufacturers, service providers, agricultural producers, and their workers, including preparing for increased competition; and (4) how to assess the quality of data on trade and what, if any, additional resources should be devoted to collecting trade data and analyzing the role of trade in the U.S. economy.
Appendix A. Trade Statistics and Resources
Trade Data
The U.S. government compiles trade data in four different ways. The data on merchandise or goods trade are first compiled on a Census basis. Bilateral trade with countries and sectoral data are reported only on a Census basis. The Census numbers are then adjusted and reported monthly on a balance of payments (BoP) basis that includes adjustments for valuation, coverage, and timing, and excludes military transactions. The data are finally reported in terms of national income and product accounts (NIPA). The NIPA data also can be further adjusted to include correcting for inflation to gauge movement in trade volumes as distinct from trade values. Conceptually, this procedure is analogous to adjusting macroeconomic data from nominal to real values. Specific values can help in understanding the concepts involved.
Valuation methods are very important in trade data evaluation. The Census Bureau also reports imports on a c.i.f. (cost, insurance, and freight) basis, which includes the value of insurance, international shipping, and other charges incurred in bringing merchandise to U.S. ports of entry. The customs (or f.a.s.—free alongside ship) data do not include these supplementary costs. U.S. import data are reported on a customs basis with insurance and freight charges counted in U.S. services trade. Other countries, however, commonly report merchandise import figures that include insurance and freight charges. This tends to overstate their imports and understate their trade surpluses with the United States.
For analysis of specific industries or sectors, the classification system used is also important. The U.S. Harmonized Tariff Schedule (HTS) identifies products by a 10-digit number in order to assign duty rates. Each additional digit adds to the specificity of the classification. For example, the 2-digit level includes broad categories such as aircraft (88), electrical machinery (85), and meat (02). For the purpose of examining trade trends, the broader 2- or 4-digit classification is typically sufficient. There are a number of other classification systems that are also useful for different types of analysis. The North American Industry Classification System (NAICS), for example, is organized by production type (agriculture, manufacturing, retail trade, etc.).
Trade Statistics and Web Resources
Listed below are resources available online for international trade and economic statistics.
U.S. Trade and the Economy
The single most authoritative, comprehensive, and frequently published trade data statistical source for U.S. trade data is the monthly "FT900," titled "U.S. International Trade in Goods and Services." The FT-900 is issued monthly by the U.S. Department of Commerce's Census Bureau and Bureau of Economic Analysis. It provides information on U.S. trade in goods and services (balance, exports, and imports) in specific commodities and end-use categories and with selected countries. The report also provides information on trade in advanced technology, petroleum, and motor vehicle products. The report is available from the U.S. Bureau of Economic Analysis at http://www.bea.gov/newsreleases/rels.htm. Under "International" click on latest news release.
The U.S. Bureau of Economic Analysis' International Trade and Investment Country Facts provides information on U.S. trade in goods and services and foreign direct investment for individual countries and country groupings. Users select a country or region from an interactive world map or a searchable menu. The application generates a country or region factsheet with graphs and tables showing the latest data on U.S. trade and investment with that country or region." It is available at https://apps.bea.gov/international/factsheet/.
Annual and quarterly year-to-date U.S. goods export and import data by individual state or U.S. region for individual countries, trade, and economic groups, or geographic regions, tabulated using NAICS classification (up to 3-digits) is available at https://www.export.gov/State-Trade-Data. State level trade data is also accessible via the U.S. Department of Commerce's Census Bureau at https://www.census.gov/foreign-trade/statistics/state/index.html and at the USA Trade Online database, https://usatrade.census.gov/.30
Information on trade in specific commodities, with particular regions, or for different time periods also can be obtained from the U.S. International Trade Commission at http://dataweb.usitc.gov/. The Commission's publications are available at https://www.usitc.gov/research_and_analysis/332_commission_publication.htm.
Data and analysis on various industries (e.g. aerospace, automotive, e-commerce, metals, etc.) and their international competitiveness are available from the U.S. Department of Commerce's International Trade Administration, at https://www.trade.gov/data.asp.
Historical and current U.S. exchange rate data are available from the Federal Reserve Bank of St. Louis at http://research.stlouisfed.org/fred2/.
Information on foreign country holdings of U.S. Treasury securities are available at http://www.treasury.gov/tic/.
The Office of the U.S. Trade Representative also produces reports throughout the year, including the President's Trade Policy Agenda and Annual Report. They can be accessed at https://ustr.gov/about-us/policy-offices/press-office/reports-and-publications.
International Trade and Economy
- The International Monetary Fund's World Economic Outlook Database contains data on national accounts, inflation, unemployment rates, balance of payments, fiscal indicators, trade for countries and country groups, and commodity prices, available at https://www.imf.org/external/pubs/ft/weo/2018/02/weodata/index.aspx.
- The World Bank's DataBank has a collection of databases on international development indicators, national accounts, inflation, unemployment rates, balance of payments, fiscal indicators, and trade for countries and country groups, available at http://databank.worldbank.org/data/home.aspx.
- The World Trade Organization provides data on trade flows, tariffs, non-tariff measures (NTMs) and trade in value added, available at https://www.wto.org/english/res_e/statis_e/statis_e.htm.
IMF Country Group Classification31
The International Monetary Fund classifies 194 countries or territories into several groups:
Advanced Economies (39 countries)
Australia, Austria, Belgium, Canada, Cyprus, Czech Republic, Denmark, Estonia, Finland, France, Germany, Greece, Hong Kong, Iceland, Ireland, Israel, Italy, Japan, Korea, Latvia, Lithuania, Luxembourg, Macao, Malta, Netherlands, New Zealand, Norway, Portugal, Puerto Rico, San Marino, Singapore, Slovak Republic, Slovenia, Spain, Sweden, Switzerland, Taiwan, United Kingdom, and United States.
European Union (28 countries)
Austria, Belgium, Bulgaria, Croatia, Cyprus, Czech Republic, Denmark, Estonia, Finland, France, Germany, Greece, Hungary, Ireland, Italy, Latvia, Lithuania, Luxembourg, Malta, Netherlands, Poland, Portugal, Slovak Republic, Slovenia, Spain, Sweden, Romania, and United Kingdom.
Euro Area (19 countries)
Austria, Belgium, Cyprus, Estonia, Finland, France, Germany, Greece, Ireland, Italy, Latvia, Lithuania, Luxembourg, Malta, Netherlands, Portugal, Slovak Republic, Slovenia, and Spain.
Emerging Market and Developing Economies (155 countries)
Afghanistan, Albania, Algeria, Angola, Antigua and Barbuda, Argentina, Armenia, Aruba, Azerbaijan, The Bahamas, Bahrain, Bangladesh, Barbados, Belarus, Belize, Benin, Bhutan, Bolivia, Bosnia and Herzegovina, Botswana, Brazil, Brunei Darussalam, Bulgaria, Burkina Faso, Burundi, Cabo Verde, Cambodia, Cameroon, Central African Republic, Chad, Chile, China, Colombia, Comoros, Democratic Republic of the Congo, Republic of Congo, Costa Rica, Côte d'Ivoire, Croatia, Djibouti, Dominica, Dominican Republic, Ecuador, Egypt, El Salvador, Equatorial Guinea, Eritrea, Eswatini, Ethiopia, Fiji, Gabon, The Gambia, Georgia, Ghana, Grenada, Guatemala, Guinea, Guinea-Bissau, Guyana, Haiti, Honduras, Hungary, India, Indonesia, Iran, Iraq, Jamaica, Jordan, Kazakhstan, Kenya, Kiribati, Kosovo, Kuwait, Kyrgyz Republic, Lao P.D.R., Lebanon, Lesotho, Liberia, Libya, FYR Macedonia, Madagascar, Malawi, Malaysia, Maldives, Mali, Marshall Islands, Mauritania, Mauritius, Mexico, Micronesia, Moldova, Mongolia, Montenegro, Morocco, Mozambique, Myanmar, Namibia, Nauru, Nepal, Nicaragua, Niger, Nigeria, Oman, Pakistan, Palau, Panama, Papua New Guinea, Paraguay, Peru, Philippines, Poland, Qatar, Romania, Russia, Rwanda, Samoa, São Tomé and Príncipe, Saudi Arabia, Senegal, Serbia, Seychelles, Sierra Leone, Solomon Islands, Somalia, South Africa, South Sudan, Sri Lanka, St. Kitts and Nevis, St. Lucia, St. Vincent and the Grenadines, Sudan, Suriname, Syria, Tajikistan, Tanzania, Thailand, Timor-Leste, Togo, Tonga, Trinidad and Tobago, Tunisia, Turkey, Turkmenistan, Tuvalu, Uganda, Ukraine, United Arab Emirates, Uruguay, Uzbekistan, Vanuatu, Venezuela, Vietnam, Yemen, Zambia, and Zimbabwe.
Commonwealth of Independent States (12 countries)
Armenia, Azerbaijan, Belarus, Georgia, Kazakhstan, Kyrgyz Republic, Moldova, Russia, Tajikistan, Turkmenistan, Ukraine, and Uzbekistan. Georgia, which is not a member of the Commonwealth of Independent States, is included in this group for reasons of geography and similarities in economic structure.
Emerging and Developing Asia (30 countries)
Bangladesh, Bhutan, Brunei Darussalam, Cambodia, China, Fiji, India, Indonesia, Kiribati, Lao P.D.R., Malaysia, Maldives, Marshall Islands, Micronesia, Mongolia, Myanmar, Nauru, Nepal, Palau, Papua New Guinea, Philippines, Samoa, Solomon Islands, Sri Lanka, Thailand, Timor-Leste, Tonga, Tuvalu, Vanuatu, and Vietnam.
Emerging and Developing Europe (12 countries)
Albania, Bosnia and Herzegovina, Bulgaria, Croatia, Hungary, Kosovo, Macedonia, Montenegro, Poland, Romania, Serbia, and Turkey.
Latin America and the Caribbean (33 countries)
Antigua and Barbuda, Argentina, Aruba, The Bahamas, Barbados, Belize, Bolivia, Brazil, Chile, Colombia, Costa Rica, Dominica, Dominican Republic, Ecuador, El Salvador, Grenada, Guatemala, Guyana, Haiti, Honduras, Jamaica, Mexico, Nicaragua, Panama, Paraguay, Peru, St. Kitts and Nevis, St. Lucia, St. Vincent and the Grenadines, Suriname, Trinidad and Tobago, Uruguay, and Venezuela.
Middle East, North Africa, Afghanistan, and Pakistan (23 countries)
Afghanistan, Algeria, Bahrain, Djibouti, Egypt, Iran, Iraq, Jordan, Kuwait, Lebanon, Libya, Mauritania, Morocco, Oman, Pakistan, Qatar, Saudi Arabia, Somalia, Sudan, Syria, Tunisia, United Arab Emirates, and Yemen.
Sub-Saharan Africa (45 countries)
Angola, Benin, Botswana, Burkina Faso, Burundi, Cabo Verde, Cameroon, Central African Republic, Chad, Comoros, Democratic Republic of the Congo, Republic of Congo, Côte d'Ivoire, Equatorial Guinea, Eritrea, Eswatini, Ethiopia, Gabon, The Gambia, Ghana, Guinea, Guinea-Bissau, Kenya, Lesotho, Liberia, Madagascar, Malawi, Mali, Mauritius, Mozambique, Namibia, Niger, Nigeria, Rwanda, São Tomé and Príncipe, Senegal, Seychelles, Sierra Leone, South Africa, South Sudan, Tanzania, Togo, Uganda, Zambia, and Zimbabwe.
CRS Resources
Below are some recent CRS reports and products related to international trade.
- CRS Report R44717, International Trade and Finance: Overview and Issues for the 115th Congress, coordinated by [author name scrubbed] and [author name scrubbed].
- CRS Report R45148, U.S. Trade Policy Primer: Frequently Asked Questions, coordinated by [author name scrubbed].
- CRS Report R44546, The Economic Effects of Trade: Overview and Policy Challenges, by [author name scrubbed].
- CRS Insight IN10972, Global Trade Imbalances, by [author name scrubbed].
- CRS In Focus IF10619, The U.S. Trade Deficit: An Overview, by [author name scrubbed].
- CRS Report R45243, Trade Deficits and U.S. Trade Policy, by [author name scrubbed].
- CRS Report R44044, U.S. Trade with Free Trade Agreement (FTA) Partners, by [author name scrubbed].
- CRS In Focus IF10161, International Trade Agreements and Job Estimates, by [author name scrubbed].
- CRS In Focus IF10156, U.S. Trade Policy: Background and Current Issues, by [author name scrubbed], [author name scrubbed], and [author name scrubbed].
- CRS Report R45198, Bilateral and Regional Trade Agreements: Issues for Congress, by [author name scrubbed].
- CRS Report R43291, U.S. Trade in Services: Trends and Policy Issues, by [author name scrubbed].
- CRS Report R44565, Digital Trade and U.S. Trade Policy, coordinated by [author name scrubbed].
- CRS In Focus IF10030, U.S.-China Trade Issues, by [author name scrubbed].
- CRS Report RL33536, China-U.S. Trade Issues, by [author name scrubbed].
Author Contact Information
Footnotes
| 1. |
CRS calculation with data from the International Monetary Fund, World Economic Outlook Database. |
| 2. |
CRS calculation with data from the World Bank, World Development Indicators, and the International Monetary Fund, World Economic Outlook Database. |
| 3. |
For more detail, see CRS Report R45148, U.S. Trade Policy Primer: Frequently Asked Questions, coordinated by [author name scrubbed]; International Monetary Fund, World Bank, and World Trade Organization, Making Trade an Engine of Growth for All: The Case for Trade and for Policies to Facilitate Adjustment, April 2017. |
| 4. |
International Monetary Fund, World Economic Outlook Database, and the World Trade Organization (WTO), "Strong trade growth in 2018 rests on policy choices," April 12, 2018. |
| 5. |
WTO, "Falling import demand, lower commodity prices push down trade growth prospects," September 20, 2015. |
| 6. |
For example, see Caroline Freund, "The Global Trade Slowdown and Secular Stagnation," Peterson Institute for International Economics, April 20, 2016, https://piie.com/blogs/trade-investment-policy-watch/global-trade-slowdown-and-secular-stagnation; and Simon J. Evenett and Johannes Fritz, The Tide Turns? Trade, Protectionism and Slowing Global Growth, Centre for Economic Policy Research, 2015. |
| 7. |
World Trade Organization, "World Trade Outlook Indicator signals further loss of momentum in trade growth into Q4," World Trade Outlook Indicator, November 26, 2018; International Monetary Fund, World Economic Outlook, October 2018. |
| 8. |
Organization for Economic Cooperation and Development, "High Uncertainty Weighing on Global Growth," September 20, 2018. |
| 9. |
Ibid. |
| 10. |
U.S. Department of Commerce, Bureau of Economic Analysis. The U.S. government compiles trade data in four different ways. The data on merchandise or goods trade are first compiled on a Census basis. Bilateral trade with countries and sectoral data are reported only on a Census basis. The Census numbers are then adjusted and reported monthly on a balance of payments (BoP) basis that includes adjustments for valuation, coverage, and timing, and excludes military transactions. The data are finally reported in terms of national income and product accounts (NIPA). The NIPA data also can be further adjusted to include correcting for inflation to gauge movement in trade volumes as distinct from trade values. Conceptually, this procedure is analogous to adjusting macroeconomic data from nominal to real values. |
| 11. |
Koen De Backer and Sébastien Miroudot, "Mapping Global Value Chains," OECD Trade Policy Papers, No. 159, December 2013. |
| 12. |
Organisation for Economic Cooperation and Development, "Import Content of Exports" (Indicator). |
| 13. |
Organisation for Economic Cooperation and Development and the World Trade Organization, "Trade in Value-Added (TiVA) Database: China," January 16, 2013. |
| 14. |
Robert Koopman, William Powers, Zhi Wang, and Shang-Jin Wei, "Give Credit Where Credit Is Due: Tracing Value Added in Global Production Chains," National Bureau of Economic Research Working Papers 16426, October 2011. |
| 15. |
The main criteria used by the International Monetary Fund to classify the world into "advanced economies" and "emerging market and developing economies" are (1) per capita income, (2) export diversification, and (3) degree of integration into the global financial system. For more detail, see Appendix A. |
| 16. |
The term percentage point (p.p.) is used to describe differences between percentages (%). One p.p. is one hundredth of a given value. For example, if GDP grew 3.27% in 2016 and 3.74% in 2017, then we can say that GDP growth in 2017 was 0.47 p.p. higher than in 2016. |
| 17. |
International Monetary Fund, World Economic Outlook, October 2018. |
| 18. |
The Eurozone, or Euro Area, consists of 19 member states of the European Union that have adopted the euro as their currency. They include Austria, Belgium, Cyprus, Estonia, Finland, France, Germany, Greece, Ireland, Italy, Latvia, Lithuania, Luxembourg, Malta, Netherlands, Portugal, Slovak Republic, Slovenia, and Spain. |
| 19. |
The output or GDP "gap is an economic measure of the difference between the actual output of an economy and its potential output. Potential output is the maximum amount of goods and services that an economy can turn out when it is most efficient—that is, at full capacity." See Sarwat Jahan and Ahmed Saber Mahmud, "What is the Output Gap," Finance & Development, Back to Basics, International Monetary Fund, September 2013. |
| 20. |
International Monetary Fund, World Economic Outlook, October 2018. |
| 21. |
World Trade Organization, "Strong trade growth in 2018 rests on policy choices," April 12, 2018. |
| 22. |
The term percentage point (p.p.) is used to describe differences between percentages (%). One p.p. is one hundredth of a given value. For example, if GDP grew 3.27% in 2016 and 3.74% in 2017, then we can say that GDP growth in 2017 was 0.47 p.p. higher than in 2016. |
| 23. |
U.S. Federal Reserve, "Economic projections of Federal Reserve Board members and Federal Reserve Bank presidents under their individual assessments of projected appropriate monetary policy," September 2018. |
| 24. |
U.S. Energy Information Agency, "U.S. production of crude oil grew 5% in 2017, likely leading to record 2018 production," April 14, 2018. |
| 25. |
U.S. Energy Information Agency, "U.S. coal exports increased by 61% in 2017 as exports to Asia more than doubled," April 19, 2018. |
| 26. |
For more detail on U.S. trade agreements, see CRS Report R45198, Bilateral and Regional Trade Agreements: Issues for Congress, by [author name scrubbed], CRS Report R44044, U.S. Trade with Free Trade Agreement (FTA) Partners, by [author name scrubbed], CRS In Focus IF10161, International Trade Agreements and Job Estimates, by [author name scrubbed]. |
| 27. |
FTAs in force during 2017 were the U.S.-Panama Trade Promotion Agreement (TPA) (2012); U.S.-Colombia TPA (2012); U.S.-Korea FTA (2012); U.S.-Oman FTA (2009); U.S.-Peru TPA (2009); Dominican Republic–Central America Free Trade Agreement (CAFTA-DR) that includes, in addition to the Dominican Republic, El Salvador, Guatemala, Honduras, and Nicaragua (2006–07) and Costa Rica (2009); U.S.- Bahrain FTA (2006); U.S.-Morocco FTA (2006); U.S.-Australia FTA (2005); U.S.-Chile FTA (2004); U.S.-Singapore FTA (2004); U.S.-Jordan FTA (2001); North America Free Trade Agreement (NAFTA), with Canada and Mexico (1994); and U.S.-Israel FTA (1985). |
| 28. |
For more detail, see U.S. International Trade Commission, Recent Trends in U.S. Services Trade: 2018 Annual Report, Investigation No. 332-345, Publication 4789, June 2018. |
| 29. |
For instance, C. Fred Bergsten argues that "research at both the Federal Reserve Board and the Institute for International Economics reveals that industrial countries, including the United States, enter a danger zone of current account unsustainability when their deficits reach 4–5 percent of GDP... At these levels, corrective forces tend to arise either spontaneously from market forces or by policy action." (C. Fred Bergsten, "Can the United States afford the tax cuts of 2001?" presentation at the annual meeting of the American Economic Association in Atlanta, Georgia, January 5, 2002.) See also Richard H. Clarida, Manuela Goretti, and Mark P. Taylor, "Are There Thresholds of Current Account Adjustment in the G7?" in Richard H. Clarida (Ed.), G7 Current Account Imbalances Sustainability and Adjustment, Chicago, University of Chicago Press, pp. 169-204, 2007. |
| 30. |
State trade data are only available for trade in goods. Export data are based on the origin of movement. For shipments consolidated domestically prior to export or shipped from a distribution center, the origin of movement may reflect the consolidation point rather than the production origin. This has a tendency to overestimate exports for some states (particularly agricultural exports from coastal states), and underestimate for others. Another complication is that the data do not capture value-added production by the state in which it occurs, but rather attribute the entire value of an export to the final state from which it is exported. State import data are based on the state of destination and likewise may reflect a storage or distribution point rather than the final point of consumption. See: https://www.census.gov/foreign-trade/aip/elom.html#limitations. |
| 31. |
International Monetary Fund, World Economic Outlook Database. |