The Impact of the Federal Income Tax Code on Poverty
Changes from October 17, 2019 to October 19, 2020
This page shows textual changes in the document between the two versions indicated in the dates above. Textual matter removed in the later version is indicated with red strikethrough and textual matter added in the later version is indicated with blue.
The Impact of the Federal Income Tax on Poverty: Before and After the 2017 Tax Revision ("TCJA"; P.L. 115-97)
Contents
- Introduction
- Key Concepts, Conventions, and Terms Used in this Report
- How Major Federal Income Tax Provisions Apply to the Poor
- Calculating Income Tax Liability
- Exclusion of Public Assistance
- The Standard Deduction and Personal Exemptions
- Marginal Tax Rates
- Refundable Tax Credits
- The Pre-TCJA Income Tax and Poverty
- Poor Families with Positive, Negative, and Zero Tax Liabilities Under the Pre-TCJA Income Tax
- The Impact of Pre-TCJA Income Tax on Poverty Rates
- The Impact of Pre-TCJA Income Tax on the Poverty Gap
- The Post-TCJA Income Tax and Poverty
- Poor Families with Positive, Negative, and Zero Tax Liabilities Under the Post-TCJA Income Tax
- The Impact of the Post-TCJA Income Tax on Poverty Rates
- The Impact of the Post-TCJA Income Tax on the Poverty Gap
- A Comparison of the Impact of the Post-TCJA Income Tax and Selected Low-Income Assistance Programs on Poverty Rates and the Poverty Gap
- Conclusion
Figures
- Figure 1. Estimated Share of Families with Positive, Zero, and Negative Income Tax Liabilities Under the Pre-TCJA Income Tax by Family After-Tax Poverty Status, 2016
- Figure 2. Estimated Share of Poor Families with Positive, Zero, and Negative Income Tax Liabilities Under the Pre-TCJA Income Tax by Family Type, 2016
- Figure 3. Estimated Before-Tax and After-Tax Poverty Rates Under the Pre-TCJA Income Tax, 2016
- Figure 4. Estimated Share of Families with Positive, Zero, and Negative Income Tax Liabilities Under the Pre- and Post-TCJA Income Tax by After-Tax Family Poverty Status, 2016
- Figure 5. Estimated Share of Poor Families with Positive, Zero, and Negative Income Tax Liabilities Under the Pre- and Post-TCJA Income Tax by Family Type, 2016
- Figure 6. Estimated After-Tax Poverty Rates Under the Pre- and Post-TCJA Income Tax, 2016
- Figure 7. Estimated Percentage-Point Reduction in the Poverty Rate from the Post-TCJA Income Tax and Selected Low-Income Assistance Programs, 2016
- Figure 8. Estimated Dollar Reduction in the Aggregate Poverty Gap from the Post-TCJA Income Tax and Selected Low-Income Assistance Programs, 2016
- Figure C-1. Child Tax Credit Amounts by Income Under the Pre- and Post-TCJA Income Tax for a Married Couple with Two Children, 2018
- Figure C-2. Child Tax Credit Amounts Under the Pre- and Post-TCJA Income Tax and the Difference in These Amounts for Married Couple with Two Children and Less Than $36,000 in Income, 2018
Tables
- Table 1. Estimated Before-Tax and After- Tax Poverty Rates Under the Pre-TCJA Income Tax for Selected Individuals Living in Families With and Without Workers, 2016
- Table 2. Estimated Aggregate Poverty Gap Before and After the Pre-TCJA Income Tax by Family Type, 2016
- Table 3. Estimated Before-Tax and After-Tax Poverty Rates Under the Post-TCJA Income Tax for Selected Individuals Living in Families With and Without Workers, 2016
- Table 4. Estimated Aggregate Poverty Gap Before and After the Pre- and Post-TCJA Income Tax by Family Type, 2016
- Table A-1. Selected Post-TCJA Income Tax Provisions in 2018 and 2016 Dollars
- Table B-1. Estimated Number of Individuals in Poverty Before the Income Tax for Selected Individuals Living in Families With and Without Workers, 2016
- Table B-2. Estimated Number of Families in Poverty Before the Income Tax by Family Type, 2016
- Table C-1. Combined Standard Deduction and Personal Exemption for Hypothetical Taxpayers Under the Pre- and Post- TCJA Income Tax, 2018
- Table C-2. Marginal Tax Rates Under the Pre- and Post-TCJA Income Tax, 2018
- Table C-3. Overview of Changes to the Child Tax Credit Under the TCJA
Summary
The Impact of the Federal Income Tax Code
October 19, 2020
on Poverty
Margot L. Crandall-Hollick
The federal individual income tax is structured so that the poor owe little or no income
Acting Section Research
tax. In addition, the federal individual income tax (hereinafter referred to simply as the income tax
Manager
income tax code or income tax) increases the disposable income of many poor families
via refundable tax credits—primarily the earned income tax credit (EITC) and the
Gene Falk
refundable portion of the child tax credit, referred to as the additional child tax credit, or ACTC
Specialist in Social Policy
(ACTC). These credits are explicitly designed to benefit low-income families with
workers and children and can significantly boost families'’ disposable income, lifting
Jameson A. Carter
many of these families above the poverty line.
Research Assistant
Using the federal government'’s Supplemental Poverty Measure (SPM), CRSthe Congressional Research Service (CRS) estimates that under current law, the income tax
reduced total poverty by 15% (from 14.5% 7% of individuals in poverty to 12.3% 5% of individuals in poverty). The impact of the income tax on the overall poverty rate was larger than the impact of many needs-tested benefits programs targeted toward the poor. In contrast, the income tax'’s ability to lift the poorest Americans out of poverty—to reduce the "“poverty gap"”—was limited in comparison to many needs-tested programs. (The poverty gap is the difference between the poverty threshold and a family'’s disposable income, aggregated over all poor families, and is a measure of the degree of poverty.) CRS estimates that under current law, the income tax reduced the poverty gap by about $13.910.3 billion annually (from $150.8154.0 billion to $136.9$143.6 billion), approximately half the effect of other needs-tested programs.
Virtually all of the poverty reduction from the income tax—both in terms of reducing poverty rates and the poverty gap—was concentrated among families with children and workers. For example, CRS estimates that poverty among children who lived in families with workers fell by almost 40% (from 14.7%15.3% of children in poverty to 8.9%9.4% of children in poverty) as a result of the income tax. For nonaged (i.e., nonelderly) adults in families with children and workers, poverty fell by almostroughly a third (from 12.3% 2% of nonaged adults in poverty to 8.1% of nonaged adults 8.3% in poverty). (In contrast, CRS estimates that the poverty rates among individuals who lived in families with no workers were unchanged by the income tax.) Similarly, all of the estimated $13.910.3 billion in poverty gap reduction from the current income tax occurred among families with children and workers.
.
The current income tax includes the effects of legislative changes made by P.L. 115-97, commonly referred to as the Tax Cuts and Jobs Act (TCJA). The TCJA made numerous changes to the federal income tax system, including many that affect individuals and families. A comparison of the effect of the current income tax (i.e., the post-TCJA income tax) and the pre-TCJA income tax on poverty rates and the poverty gap (assuming all else unchanged) provides one measure of the law'’s impact on poverty. CRS estimates suggestindicate that the TCJA marginally reduced poverty rates and the poverty gap, with the impact of the post-TCJA income tax similar to the impact of the pre-TCJA income tax. This suggests the law provided relatively small benefits to poor families.
Insofar as policymakers are interested in expanding the antipoverty impact of the income tax, they could expand or modify the EITC or ACTC, or create new refundable tax credits targeted toward the poor. However, refundable tax credits are subject to several limitations as a poverty reduction policy: the current credits primarily benefit those who work (and have children), limiting their ability to reduce poverty among those who do not or cannot work; they are received only once a year when income tax returns are filed, limiting their ability to help the poor meet ongoing basic needs; and they are difficult for the IRSInternal Revenue Service (IRS) to administer, subjecting the credits and their recipients to additional scrutiny.
Congressional Research Service
link to page 32 The Impact of the Federal Income Tax Code on Poverty
Overview of the Estimated Antipoverty Impact of the Federal Income Tax
Estimated Before-Tax and After-Tax Poverty Rates for Selected Individuals
After Tax
Current-Law
Prior-Law
Before
Income Tax
Income Tax
Individual by Family Type
Tax
(Post-TCJA)
(Pre-TCJA)
All Individuals Living in Families of All Types
14.7%
12.5%
12.8%
Children
18.2%
12.6%
13.1%
Nonaged Adults in Families with Children
14.3%
10.4%
10.8%
Individuals Living in Families with Workers
10.9%
8.2%
8.5%
Children
15.3%
9.4%
9.9%
the credits and their recipients to additional scrutiny.
Overview of the Estimated Antipoverty Impact of the Federal Income Tax
Estimated Before-Tax and After-Tax Poverty Rates for Selected Individuals | ||||
|
After Tax |
||||
|
Individual by Family Type |
Before Tax |
(Post-TCJA) |
(Pre-TCJA) | |
|
All Individuals Living in Families of All Types |
14.5% |
12.3% |
12.5% |
|
|
Children |
17.5% |
12.0% |
12.3% |
|
|
Nonaged Adults in Families with Children |
14.5% |
10.6% |
10.8% |
|
|
Individuals Living in Families with Workers |
10.8% |
8.1% |
8.3% |
|
|
Children |
14.7% |
8.9% |
9.2% |
|
|
Nonaged Adults in Families with Children |
12.3% |
8.3% |
8.5% |
|
|
Individuals Living in Families with No Workers |
34.7% |
34.7% |
34.7% |
|
|
Children |
64.1% |
64.1% |
64.1% |
|
|
Nonaged Adults in Families with Children |
64.3% |
64.3% |
64.3% |
|
Nonaged Adults in Families with Children
12.2%
8.1%
8.5%
Individuals Living in Families with No Workers
35.1%
35.1%
35.1%
Children
66.2%
66.2%
66.2%
Nonaged Adults in Families with Children
61.6%
61.6%
61.6%
Estimated Before-Tax | ||||
|
After Tax |
||||
|
Family Type |
|
|
| |
|
All Poor Families |
150.8 |
136.9 |
138.1 |
|
|
Poor Families with Children |
52.3 |
38.3 |
39.1 |
|
|
With Workers |
37.8 |
23.9 |
24.7 |
|
|
With No Workers |
14.5 |
14.5 |
14.5 |
|
|
Poor Families with Aged Adults, but no Children |
29.5 |
29.6 |
29.6 |
|
|
Poor Families without Children or Aged Adults |
69.1 |
69.0 |
69.4 |
|
Source: CRS estimates using TRIM3 and the ASEC 2017. For methodology, see Appendix A.
)
(Pre-TCJA)
Family Type
($ in bil ions)
($ in bil ions)
($ in bil ions)
All Poor Families
154.0
143.6
145.1
Poor Families with Children
49.9
39.4
40.4
With Workers
34.7
24.2
25.2
With No Workers
15.3
15.3
15.3
Poor Families with Aged Adults, but no Children
31.1
31.3
31.4
Poor Families without Children or Aged Adults
73.0
72.9
73.3
Source: CRS estimates using TRIM3 and the ASEC 2018. For methodology, see Appendix B. Note: The 2018 parameters of the current-law income tax (post-TCJA) and the prior-law income tax (pre-TCJA) are modeled. Due to data limitations, the impacts of the federal income tax in effect in 2018 (both pre- and post-TCJA) are modeled as if they were in effect in 2016. 2017. Items may not sum to totals due to rounding.
Introduction
Congressional Research Service
link to page 6 link to page 7 link to page 8 link to page 9 link to page 10 link to page 11 link to page 13 link to page 16 link to page 17 link to page 18 link to page 18 link to page 18 link to page 18 link to page 19 link to page 20 link to page 10 link to page 10 link to page 11 link to page 11 link to page 12 link to page 12 link to page 12 link to page 13 link to page 13 link to page 13 link to page 14 link to page 14 link to page 16 link to page 16 link to page 19 link to page 19 link to page 20 link to page 20 link to page 29 link to page 29 link to page 30 link to page 30 link to page 30 The Impact of the Federal Income Tax Code on Poverty
Contents
Introduction ..................................................................................................................................... 1 How Major Provisions of the Income Tax Code Affect the Poor .................................................... 2
Comparison to the Pre-TCJA Income Tax ................................................................................ 3
The Income Tax and Poverty ........................................................................................................... 4
The Share of Families with Positive, Negative, and Zero Tax Liabilities ................................. 5
Comparison to the Pre-TCJA Income Tax .......................................................................... 6
The Impact of the Income Tax on Poverty Rates ...................................................................... 8
Comparison to the Pre-TCJA Income Tax ......................................................................... 11
The Impact of the Income Tax on the Poverty Gap................................................................. 12
Comparison to the Pre-TCJA Income Tax ........................................................................ 13
Impact of the Income Tax on Poverty Compared to Selected Low-Income Assistance
Programs..................................................................................................................................... 13
Poverty Rate ...................................................................................................................... 13 Poverty Gap ...................................................................................................................... 14
Conclusion ..................................................................................................................................... 15
Figures Figure 1. Estimated Share of All Families with Positive, Zero, and Negative Income Tax
Liabilities Under the Current Income Tax by Family After-Tax Poverty Status, 2017 ................ 5
Figure 2. Estimated Share of Poor Families with Positive, Zero, and Negative Income Tax
Liabilities Under the Current Income Tax by Family Type, 2017 ................................................ 6
Figure 3. Estimated Share of Families with Positive, Zero, and Negative Income Tax
Liabilities Under the Current Income Tax and Pre-TCJA Income Tax by Family Poverty Status, 2017 ..................................................................................................................... 7
Figure 4. Estimated Share of Poor Families with Positive, Zero, and Negative Income Tax
Liabilities Under the Current Income Tax and Pre-TCJA Income Tax by Family Type, 2017 .............................................................................................................................................. 8
Figure 5. Estimated Before-Tax and After-Tax Poverty Rates Under the Current Income
Tax, 2017 ...................................................................................................................................... 9
Figure 6. Estimated After-Tax Poverty Rates Under the Current and Pre-TCJA Income
Tax, 2017 ..................................................................................................................................... 11
Figure 7. Estimated Percentage-Point Reduction in the Poverty Rate from the Income Tax
and Selected Low-Income Assistance Programs, 2017 .............................................................. 14
Figure 8. Estimated Dollar Reduction in the Aggregate Poverty Gap from the Income Tax
and Selected Low-Income Assistance Programs, 2017 .............................................................. 15
Figure A-1. Child Tax Credit Amounts by Income Under the Pre- and Post-TCJA Income
Tax for a Married Couple with Two Children, 2018 .................................................................. 24
Figure A-2. Child Tax Credit Amounts Under the Pre- and Post-TCJA Income Tax and
the Difference in These Amounts for Married Couple with Two Children and Less Than $36,000 in Income, 2018 ............................................................................................................ 25
Congressional Research Service
link to page 15 link to page 15 link to page 17 link to page 17 link to page 25 link to page 25 link to page 26 link to page 28 link to page 35 link to page 37 link to page 37 link to page 38 link to page 38 link to page 23 link to page 23 link to page 32 link to page 37 link to page 37 link to page 38 The Impact of the Federal Income Tax Code on Poverty
Tables Table 1. Estimated Before-Tax and After- Tax Poverty Rates for Selected Individuals
Living in Families With and Without Workers, 2017 ................................................................. 10
Table 2. Estimated Aggregate Poverty Gap Before and After the Current and Pre-TCJA
Income Tax by Family Type, 2017 ............................................................................................. 12
Table A-1. Combined Standard Deduction and Personal Exemption for Hypothetical
Taxpayers Under the Pre-TCJA and Current-Law (Post- TCJA) Income Tax, 2018 ................. 20
Table A-2. Marginal Tax Rates Under the Pre- and Post-TCJA Income Tax, 2018 ...................... 21 Table A-3. Overview of Changes to the Child Tax Credit Under the TCJA.................................. 23 Table B-1. Selected Post-TCJA Income Tax Provisions in 2018 and 2017 Dollars ...................... 30 Table C-1. Estimated Number of Individuals in Poverty Before the Income Tax for
Selected Individuals Living in Families With and Without Workers, 2017 ............................... 32
Table C-2. Estimated Number of Families in Poverty Before the Income Tax by Family
Type, 2017 .................................................................................................................................. 33
Appendixes Appendix A. How Major Provisions of the Federal Income Tax Affect the Poor and How
They Were Modified by the TCJA ............................................................................................. 18
Appendix B. Methodology and Data Sources ............................................................................... 27 Appendix C. Estimated Number of Individuals and Families in Poverty Before the
Income Tax, 2017 ....................................................................................................................... 32
Contacts Author Information ........................................................................................................................ 33
Congressional Research Service
The Impact of the Federal Income Tax Code on Poverty
Introduction The federal individual income tax is structured so that the poor owe little or no income tax (although they may pay other federal taxes, like payroll taxes as well as state and local taxes).11 In addition, the federal income tax increases the disposable income of many poor families via refundable tax credits. These tax credits—primarily the earned income tax credit (EITC) and the refundable portion of the child tax credit, called the additional child tax credit (ACTC)—increase the disposable income of many low-income taxpayers who work and have children, and have been shown to reduce poverty.2
2
P.L. 115-97, commonly referred to as the Tax Cuts and Jobs Act3Act3 (TCJA), made numerous temporary changes to the federal income tax systemcode, including many that affect individuals and families.4 Analysesfamilies.4 Preliminary analyses of the TCJA found that the law provides larger benefits to higher-income individuals and families.55 This report'’s analyses findindicate that overall the law had a relatively small impact on poverty compared to. In other words, poverty levels under the current income tax code (i.e., post-TCJA) are similar to those under the pre-TCJA federal individual income tax.
Recent tax
Tax legislation considered in the 116th116th Congress—including the Economic Mobility Act of 2019 ((H.R. 3300)H.R. 3300) ordered reported by the House Ways and Means Committee on June 20, 2019—would target additional tax benefits to lower-income families. H.R. 3300 would temporarily increase the amount of the EITC for "childless" workers,6“childless” workers;6 allow all eligible taxpayers to receive the full amount of the ACTC, irrespective of a taxpayer'’s earned income,7 and make the child and dependent care tax credit refundable. To provide context for the consideration of new tax legislation, this report examines the relationship between the federal individual income tax and poverty. Given some policymakers' continued interest in using the tax system to reduce poverty and boost the incomes of low-income working families with children, understanding the impact of the income tax in reducing poverty—pre- and post-TCJA—may help inform future policy debates and legislative proposals.
This report is structured to first provide a brief overview of the major federal income tax provisions that affect lower-income individuals and families, including a comparison of how these provisions changed under the TCJA. The report then provides an analysis of how the pre-TCJA federal income tax affected poverty, followed by a comparison of how the post-TCJA federal income tax affected poverty. The report concludes with some observations on the benefits and limitations of the federal income tax system and refundable tax credits in reducing poverty.
Key Concepts, Conventions, and Terms Used in this Report
Several major concepts, conventions, and terms used throughout this report are briefly described below. The information in this report provides some insights into how the federal income tax affects families' poverty status, specifically the immediate, short-term impact of the TCJA on poverty. The report does not estimate how the impacts of the TCJA will change over time or how people may change their behavior (e.g., choices between working and not working) in response to the TCJA.
The family is the unit of analysis. While federal income tax provisions affect taxpayers, the impact of these provisions is analyzed in terms of families. A taxpayer is generally composed of all individuals listed on a federal income tax return (IRS Form 1040) and includes an individual, his or her spouse (if married), and any dependents. Descriptions of the tax system pre- and post- TCJA will generally refer to how these changes applied to taxpayers (i.e., the below section titled, "How Major Federal Income Tax Provisions Apply to the Poor"). In contrast, poverty analysis is done at the family level since families can share many resources and expenses. Hence, in this report analyses of the impact of the income tax, pre- and post-TCJA, are generally done at the family level. In this report, a family is composed of people living together related by blood or marriage (the family), cohabiting partners, and foster children. In some cases, like multigenerational families, a family is composed of multiple taxpayers. In these cases, tax liabilities and/or benefits for all taxpayers are aggregated to determine the impact of the income tax on the family's resources. If a family is determined to be poor, all members of that family are counted as poor.
The Supplemental Poverty Measure (SPM) is used to measure the poverty impact of the federal income tax. This report examines the impact of the pre- and post-TCJA federal income tax on poverty, using the federal government's Supplemental Poverty Measure (SPM). Unlike the official poverty measure, the SPM was developed in part to help assess the effects of tax and government benefit policies on the economic well-being of low-income individuals.8 For more information on the SPM, see Appendix A and CRS Report R45031, The Supplemental Poverty Measure: Its Core Concepts, Development, and Use.
The impacts of the federal income tax (pre- and post-TCJA) are estimated using the TRIM3 model and are modeled as if they were in effect in 2016. To estimate the impact of the federal income tax on poverty—in both the pre- and post-TCJA cases—income taxes owed (or the net benefit from refundable credits received) are subtracted from (or added to) the family's other resources, which are then assessed against an SPM poverty threshold. Other taxes that a family may pay—including payroll and excise taxes—are unchanged in these analyses.9 All poverty estimates in this report are calculated using a computer simulation model called the Transfer Income Model, version 3 (TRIM3). TRIM3 uses data from the 2017 Annual Social and Economic Supplement (ASEC) to the Current Population Survey (CPS), representing income received and tax liabilities or benefits accrued during calendar year 2016. As such, the poverty estimates under the old and new income tax systems are estimated as if they were in effect in 2016. Hence, for ease of reading, the estimates in this report are described in the past tense. Details on this methodology, including how the TCJA was modeled in TRIM3, can be found in Appendix A.
How Major Federal Income Tax Provisions Apply to the Poor
The federal income tax can increase or decrease a taxpayer's disposable income, which may affect a family';7 and make
1 The principle that poor families should not owe federal income taxes can be found in the enactment of the Tax Reform Act of 1986 (P.L. 99-514). The Joint Committee on Taxation, in its explanation of the act, stated: “In addition to ensuring that high-income taxpayers pay their share of the Federal tax burden, the Act provides tax relief to low-and middle-income wage earners. To achieve this goal, the Act substantially increases the standard deduction (the prior-law zero bracket amount) and almost doubles the personal exemption. Together with the greatly expanded earned income credit, these provisions relieve approximately six million low-income individuals from income tax liability and ensure that no families below the poverty level will have Federal income tax liability.” Joint Committee on Taxation, General Explanation of the Tax Reform Act of 1986, committee print, 99th Cong., May 4, 1987, JCS-10-87, p. 8.
2 For example, see CRS Report R44057, The Earned Income Tax Credit (EITC): An Economic Analysis. 3 The original title of the law, the Tax Cuts and Jobs Act, was stricken before final passage because it violated what is known as the Byrd rule, a procedural rule that can be raised in the Senate when bills, like the tax bill, are considered under the process of reconciliation. The actual title of the law is “To provide for reconciliation pursuant to titles II and V of the concurrent resolution on the budget for fiscal year 2018.” For more information on the Byrd rule, see CRS Report RL30862, The Budget Reconciliation Process: The Senate’s “Byrd Rule”.
4 Most of the changes that affect individuals are temporary. The temporary changes are generally scheduled to be in effect from 2018 through the end of 2025. For an overview of all changes made in the law, see CRS Report R45092, The 2017 Tax Revision (P.L. 115-97): Comparison to 2017 Tax Law.
5 For example, the Joint Committee on Taxation found in 2019 that on average, the law would reduce income taxes for all taxpayers, although to a greater extent for higher-income taxpayers. See Joint Committee on Taxation, Distributional Effects of the Conference Agreement for H.R. 1, the “Tax Cuts and Jobs Act,” 115th Cong., December 18, 2017. Similarly, the Tax Policy Center found that the TCJA increased after-tax income in 2018 by 0.4% for households in the lowest quintile, compared with 2.9% for those in the top quintile and even more for the top few percent of households. For more information, see Tax Policy Center, Distributional Analysis of the Conference Agreement for the Tax Cuts and Jobs Act, December 18, 2017.
6 The bill would expand the EITC for workers without qualifying children, commonly referred to as the “childless” EITC. While some workers eligible for this credit may indeed have no children, others may have children who do not reside with them for more than half the year, and others may live with children whom for various reasons they cannot claim for the EITC (e.g., an individual living with but not married to a mother with children from another relationship).
7 Under current law, the ACTC phases in for low-income taxpayers based on their earned income, and the maximum amount of the ACTC is $1,400 per qualifying child. Under H.R. 3300, the earned income phase-in of the credit is effectively eliminated in 2019 and 2020, and hence all eligible low-income taxpayers with children would be able to receive $2,000 per qualifying child ($3,000 for a child under four years old) for those years. The $3,000 credit for
Congressional Research Service
1
link to page 23 The Impact of the Federal Income Tax Code on Poverty
the child and dependent care tax credit refundable. Similar tax law changes have been included in the Heroes Act (H.R. 6800), which passed the House on May 15, 2020, and a revised version of the Heroes Act (H.R. 8406), which passed the House on October 1, 2020. To provide context for the consideration of new tax legislation, this report examines the impact of the current federal individual income tax code on poverty. Given some policymakers’ continued interest in using the tax system to reduce poverty and boost the disposable incomes of low-income working families with children, understanding the impact of the income tax in reducing poverty—both under current law and pre-TCJA—may help inform future policy debates and legislative proposals.
This report first provides a brief summary of how the federal income tax affects the poor. The report then provides an analysis of how the current-law federal income tax affects poverty, including comparisons to the pre-TCJA income tax. A brief comparison of the income tax’s antipoverty impact to those of other needs-tested programs is also provided. The report concludes with some observations on the benefits and limitations of the federal income tax system and refundable tax credits in reducing poverty.
How Major Provisions of the Income Tax Code Affect the Poor The federal income tax code can increase or decrease a taxpayer’s disposable income, which in turn affects a family’s poverty status. Broadly, when a taxpayer receives refundable tax credits greater than the income taxes they owe, they have a negative tax liability, and an increase in disposable income, all else being equal.108 Conversely, if a taxpayer owes federal income tax, they have a positive tax liability, and reduced disposable income, all else being equal. (If a taxpayer has zero tax liability, their disposable income is unchanged by the income tax.) Unless otherwise mentioned, the term tax liability will refer to federal income tax liability in this report.
In order to understand how the individual income tax can affect tax liabilities, it can be helpful to broadly understand how income taxes are calculated, and in particular, how major components of the income tax affect poor taxpayers. Importantly, the description below summarizes only the major aspects of the federal income tax calculation that are particularly relevant for poor families. For a more detailed overview of the federal income tax calculation, see CRS Report R45145, Overview of the Federal Tax System in 2018; and CRS Infographic IG10014, The U.S. Individual Income Tax System, 2019.11 For a more detailed description of the tax provisions summarized below, how they affect income tax liability, and how they were modified by the TCJA, see CRS Report R45092, The 2017 Tax Revision (P.L. 115-97): Comparison to 2017 Tax Law.
The TCJA substantially modified the federal tax code, including changing many provisions that affect individuals. Most of these changes are temporary, and are scheduled to expire ("sunset") at the end of 2025. The major changes made by the TCJA that are likely to affect many low-income taxpayers are highlighted below.12
Calculating Income Tax Liability
The first step for taxpayers in calculating their income tax liability is to add up their income from various sources to calculate their gross income.
Exclusion of Public Assistance
The income tax code excludes certain types of income received by lower-income individuals from gross income. For example, public assistance payments (cash assistance from the Supplemental Security Income program or the Temporary Assistance for Needy Families [TANF] Block Grant) and the value of certain noncash benefits (food benefits from the Supplemental Nutrition Assistance Program [SNAP] or the subsidy value of housing benefits) are excluded from gross income under the income tax system, and hence are not taxable. The TCJA did not make any changes to the exclusion of public assistance.
The taxpayer then subtracts from gross income various deductions and exemptions to calculate the amount of income that is taxable—their taxable income. Most low-income taxpayers will subtract from their gross income the standard deduction (and before 2018, personal exemptions) to calculate their taxable income.
The Standard Deduction and Personal Exemptions
The standard deduction is a fixed dollar amount all taxpayers may deduct from their income, with the amount varying by the taxpayer's tax filing status.13 In 2018, before enactment of the TCJA, the standard deduction would have ranged from $6,500 to $13,000, depending on the taxpayer's filing status. The TCJA almost doubled the standard deduction. The personal exemption is a per-person subtraction from gross income for the taxpayer and, if applicable, his or her spouse and dependents. Before enactment of the TCJA, the personal exemption would have equaled $4,150 per person in 2018. The TCJA effectively eliminated the personal exemption (reduced the amount to $0). When combined, the personal exemptions and the standard deduction represent an amount of income that is not subject to income taxation. As a result of these provisions, many low-income taxpayers have little or no taxable income and hence have little or no income tax liability. (Taxable income cannot be reduced below zero.)
After taxpayers have calculated their taxable income, they then apply marginal tax rates to calculate their tax liability before credits.
Marginal Tax Rates
A marginal tax rate is the tax incurred on each additional dollar of taxable income. Marginal tax rates in the individual income tax code are graduated, meaning the rate increases over successive ranges of taxable income. Many low-income taxpayers who do have taxable income pay taxes at the lowest marginal rate of 10%. The ranges of taxable income and their associated rate are often referred to as tax brackets. Taxpayers determine their tax liability before credits by applying marginal tax rates to their taxable income. Then taxpayers can subtract tax credits to determine their final tax liability. The 10% tax bracket (the lowest tax bracket) was unchanged by the TCJA. In general, marginal tax rates above the 10% rate were reduced under the TCJA. See Table C-2.
Refundable Tax Credits
Tax credits reduce the amount a taxpayer owes dollar-for-dollar the value of the credit. Credits can be nonrefundable or refundable. Nonrefundable credits cannot exceed tax liability, and therefore can only reduce tax liability to zero. In other words, "the maximum value of a nonrefundable credit is capped at a taxpayer's tax liability."14 For example, if a taxpayer owes $1,000 in income taxes and is eligible to receive $4,000 in nonrefundable tax credits, the taxpayer will receive only $1,000 in nonrefundable tax credits, reducing their income
Key aspects of the current income tax code that affect the poor are described below. These features tend to result in many poor families not owing income taxes, and receiving a net increase in disposable income from the income tax system. A more in-depth discussion can be found in Appendix A.
Public assistance is not taxed. The income tax code excludes certain types of income received by lower-income individuals from gross income. For example, public assistance payments (cash assistance from the Supplemental Security Income program or the Temporary Assistance for Needy Families [TANF] Block Grant) and the value of certain noncash benefits (food benefits from the Supplemental Nutrition Assistance Program [SNAP] or the subsidy value of housing benefits) are excluded from gross income under the income tax system, and hence are not taxable.
Poor taxpayers often have no taxable income. As a result of the standard deduction, many low-income taxpayers have zero taxable income. The standard deduction is a fixed dollar amount that
children under four years old was added as an amendment during the Ways and Means Committee’s consideration of H.R. 3300. This amendment passed by a roll call vote of 22 yeas to 19 nays in the committee. For more information, see House Committee on Ways and Means, Markup of Tax Legislation, 116th Cong., 1st sess., June 20, 2019, https://waysandmeans.house.gov/legislation/markups/markup-hr-3298-child-care-quality-and-access-act-2019-hr-3299-promoting-respect.
8 By definition, the value of a refundable tax credit received can be greater than a taxpayer’s income tax liability. For example, if a taxpayer has a $1,000 income tax liability, but is eligible to receive $3,000 in refundable tax credits, those credits will first reduce their income tax liability to zero and they will receive a net benefit of $2,000. In other words, the taxpayer will have a negative tax liability of $2,000.
Congressional Research Service
2
link to page 25 The Impact of the Federal Income Tax Code on Poverty
taxpayers can subtract from their total income when determining the amount of their income subject to taxation (i.e., “taxable income”). In 2018 the standard deduction for unmarried single filers, head of household filers (i.e., single parents), and married joint filers was $12,000, $18,000, and $24,000, respectively.9 In other words, taxpayers with income at or below these levels had no taxable income and hence no income tax liability.
Poor taxpayers who do have taxable income are subject to low statutory marginal tax rates. Marginal tax rates in the individual income tax code are graduated, meaning the rate increases over successive ranges of taxable income. Many low-income taxpayers who do have taxable income are subject to the lowest marginal rate of 10%.
Refundable tax credits increase disposable income. Tax credits reduce the amount a taxpayer owes dollar-for-dollar the value of the credit.10 Generally, low-income taxpayers receive refundable tax credits (or the portion that remains after offsetting any income taxes owed) as a tax refund (or an increase in their tax refund, if they are already receiving a refund). The two major refundable tax credits claimed by low-income working taxpayers are the EITC and the additional child tax credit (the ACTC, which is the refundable portion of the child tax credit).11 Combined, these credits can boost incomes of working families with children by several thousand dollars, depending on their earned income, marital status, and number of children.
Comparison to the Pre-TCJA Income Tax The current income tax code includes the legislative changes made by P.L. 115-97, commonly referred to as the Tax Cuts and Jobs Act (TCJA). The TCJA made numerous changes to the federal income tax system, including many that affect individuals and families. The ultimate impact of the TCJA on a particular taxpayer’s tax liability depends on how the taxpayer’s individual circumstances interact with all of these provisions, not just one of them. Most of these changes are temporary, and are scheduled to expire (“sunset”) at the end of 2025.
With respect to provisions of the income tax code that affect the poor, the TCJA made two main changes. First, the amount of income that is not subject to taxation may have changed for some taxpayers. Specifically, the law almost doubled the standard deduction amount to current levels, and effectively eliminated the personal exemption (a fixed dollar amount per person taxpayers subtracted from the income).12 For many taxpayers, these changes do not affect their amount of taxable income. However, for some taxpayers, especially larger families, more of their income may be subject to the federal income tax because of these changes (see Table A-1).13 Second, the law expanded the child tax credit, doubling the maximum amount, increasing the maximum amount of the ACTC, and increasing the income level at which the credit begins to phase out (see
9 These amounts are annually adjusted for inflation. In 2020, these amounts are $24,800 for married joint filers, $12,400 for single filers, and $18,650 for head of household filers. See Internal Revenue Service, Revenue Procedure 2019-44.
10 Credits can be nonrefundable or refundable. Nonrefundable credits cannot exceed tax liability, and therefore can only reduce tax liability to zero. By contrast, refundable credits are not limited by how much a taxpayer owes in income taxes, meaning those with little to no income tax liability, including may poor taxpayers, can receive the full value of the credit.
11 Some low-income taxpayers will receive both the ACTC and the nonrefundable portion of the child tax credit. The sum of the ACTC and the nonrefundable child tax credit cannot exceed the maximum credit per child.
12 The personal exemption is a fixed dollar amount per person listed on a tax return that is subtracted from total income to calculate taxable income. If in effect in 2020, it would have equaled $4,300. While the personal exemption remains in the income tax code under Section 151, the TCJA zeroed it out from 2018 through the end of 2025.
13 Even if these families may have more taxable income, other changes in the law, including a $500 nonrefundable tax credit for non-child credit eligible dependents, may offset any increases in tax liability.
Congressional Research Service
3
link to page 29 link to page 30 link to page 32 link to page 32 The Impact of the Federal Income Tax Code on Poverty
Figure A-1). These changes substantially increased the credit amount for many middle-income and high-income families. Many low-income families were eligible for a relatively modest increase of up to $75 (see Figure A-2).
Key Concepts, Conventions, and Terms Used in this Report
Several major concepts, conventions, and terms used throughout this report are briefly described below. The family is the unit of analysis. Although federal income tax provisions affect taxpayers, the impact of these provisions is analyzed in terms of families. A taxpayer is generally composed of all individuals listed on a federal income tax return (IRS Form 1040) and includes an individual, their spouse (if married), and any dependents. In contrast, poverty analysis is done at the family level because families can share many resources and expenses. Hence, in this report analyses of the impact of the income tax are generally done at the family level. In this report, a family is composed of people living together related by blood or marriage (the family), cohabiting partners, and
foster children. In some cases, like multigenerational families, a family is composed of multiple taxpayers. In these cases, tax liabilities and/or benefits for all taxpayers are aggregated to determine the impact of the income tax on the family’s resources. If a family is determined to be poor, all members of that family are counted as poor. The Supplemental Poverty Measure (SPM) is used to measure the poverty impact of the federal income tax. This report examines the impact of the federal income tax on poverty, using the federal government’s Supplemental Poverty Measure (SPM). Unlike the official poverty measure, the SPM was developed in part to help assess the effects of tax and government benefit policies on the economic well-being of low-income individuals. For more information on the SPM, see Appendix B and CRS Report R45031, The Supplemental Poverty Measure: Its Core Concepts, Development, and Use. The impacts of the federal income tax (under current law and pre-TCJA) are estimated using the TRIM3 model and are modeled as if they were in effect in 2017. To estimate the impact of the federal income tax on poverty—in both the pre- and post-TCJA cases—income taxes owed (or the net benefit from refundable credits received) are subtracted from (or added to) the family’s other resources, which are then assessed against an SPM poverty threshold. Other taxes that a family may pay—including payrol and excise taxes—are unchanged in these analyses.14 Al poverty estimates in this report are calculated using a computer simulation model called the Transfer Income Model, version 3 (TRIM3). TRIM3 uses data from the 2018 Annual Social and Economic Supplement (ASEC) to the Current Population Survey (CPS), representing income received and tax liabilities or benefits accrued during calendar year 2017. As such, the poverty estimates under the old and new income tax systems are estimated as if they were in effect in 2017. Hence, for ease of reading, the estimates in this report are described in the past tense. Details on this methodology, including how the TCJA was modeled in TRIM3, can be found in Appendix B.
Thethe credit. A refundable tax credit provides a net benefit to a taxpayer (i.e., after-tax income is greater than before-tax income) when the amount of the credit is greater than the taxpayer's income tax liability. For example, if a taxpayer owes $1,000 in income taxes but receives $4,000 in refundable tax credits, the taxpayer has a net benefit (and negative tax liability) of $3,000.15
The two major refundable tax credits claimed by low-income working taxpayers are the EITC and the additional child tax credit (the ACTC, which is the refundable portion of the child tax credit).16 The amount of the EITC is based on a taxpayer's earned income, marital status, and number of qualifying children. In 2018, before the TCJA, the maximum amount of the credit would have ranged from $520 to $6,444, depending on the number of qualifying children.17 The TCJA did not alter the EITC itself, though it did change the rules for adjusting it for inflation, which resulted in a slightly smaller EITC under the TCJA than under prior law (a difference of $1 to $13 in 2018, depending on the number of qualifying children claimed by a taxpayer).18 Before the TCJA the child tax credit equaled a maximum $1,000 per child, and up to the full amount ($1,000 per child) could be received as the ACTC. The ACTC was calculated as 15% of earned income over $3,000, not to exceed $1,000 per child. The TCJA increased the maximum child tax credit from $1,000 to $2,000 per child and increased the maximum amount of credit that could be claimed as the ACTC from $1,000 to $1,400 per child. The formula for calculating the ACTC was also modestly changed. Post-TCJA, the ACTC formula now equals 15% of earned income above $2,500, not to exceed $1,400 per child. While many low-income taxpayers did receive a larger benefit as a result of these changes, the poorest taxpayers received a more modest increase of up to $75 (see Figure C-1 and Figure C-2).
Impact of the TCJA on a Taxpayer's Tax Liability
The ultimate impact of the TCJA on a particular taxpayer's tax liability depends on how the taxpayer's individual circumstances interact with all of these provisions, not just one of them. For example, as a result of all the changes made by the TCJA, a taxpayer may have greater taxable income, but that income may be subject to lower marginal tax rates, and the taxpayer may also be eligible for a larger child credit. Hence, even though on average the TCJA lowered tax liabilities, individual taxpayers' tax liabilities may have been unchanged, increased, or decreased as a result of the law.19
The Pre-TCJA Income Tax and Poverty
Under the pre-TCJA income tax, Income Tax and Poverty Under the current income tax—that is, the income tax code as amended by the TCJA—many poor families did not owe federal income taxes (i.e., had zero tax liability), and a significant proportion received a net benefit from refundable credits. As previously discussed, the combination of personal exemptions and the standard deduction—subtracted from gross income to determine income subject to the tax—generally reduced most poor families' taxable income to zero. Additionally, some poor families with little or no income tax liability—particularly those with children and earned income—received refundable tax credits that resulted in their after-tax income being greater than their before-tax income. (CRS estimates that before (i.e., had a negative tax liability) that pushed them above the poverty line. Most of the antipoverty impact of the income tax was concentrated among families with children and workers, who are the major recipients of refundable tax credits.
This impact of the current income code on poverty rates is similar to the impact of the pre-TCJA income tax code. In addition, the current income tax system and the pre-TCJA income tax system had roughly the same impact on the poverty gap. These estimates suggest the TCJA changes to the tax code provided relatively small benefits to poor families.
14 In addition, state income tax liabilities are assumed to be unchanged in the TRIM3 model between the pre- and post-TCJA tax codes. In reality, for some taxpayers, changes made to the federal income tax code by the TCJA may affect their state income tax liabilities. See Richard C. Auxier and Elaine Maag, Post-TCJA, Your State Should Consider a Refundable Child Tax Credit, Tax Policy Center, November 15, 2018, at https://www.taxpolicycenter.org/taxvox/post-tcja-your-state-should-consider-refundable-child-tax-credit.
Congressional Research Service
4
link to page 37 link to page 10 link to page 10 link to page 32
The Impact of the Federal Income Tax Code on Poverty
The Congressional Research Service (CRS) estimates that before the income tax was subtracted from [(or added to, in the case of negative tax liabilities]) a family'’s resources, there were approximately 21.48 million families—equaling an estimated 4647.5 million individuals—in poverty. For more information, see Appendix B.)
PoorC.
The Share of Families with Positive, Negative, and Zero Tax Liabilities Under the Pre-TCJA Income Tax
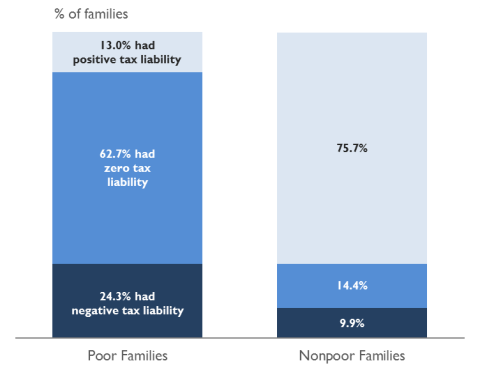
Figure 1 illustratesFigure 1 shows the estimated share of all families who owed income taxes (positive tax liability), owed no income taxes (zero tax liability), or owed no income taxes and received a net benefit from refundable tax credits (negative tax liability) by family poverty status. Under the pre-TCJA income tax, under the current income tax. These estimates of the current income tax are based on tax law in effect beginning in 2018, after the enactment of TCJA. Family poverty status was determined based on family income after applying the income tax code.
As illustrated in Figure 1, under the current income tax, CRS estimates that the majority of nonpoor families (75.774.6%) owed income taxes. In contrast, the majority of poor families (62.765.2%) owed no income taxes, and approximately a quarter (24.323.5%) owed no income taxes and received a net benefit from refundable tax credits.
Figure 1. Estimated Share of All Families with |
 |
2017
Source: CRS estimates using TRIM3 and the ASEC B. Note: Poverty status is determined using the SPM. Estimates under the |
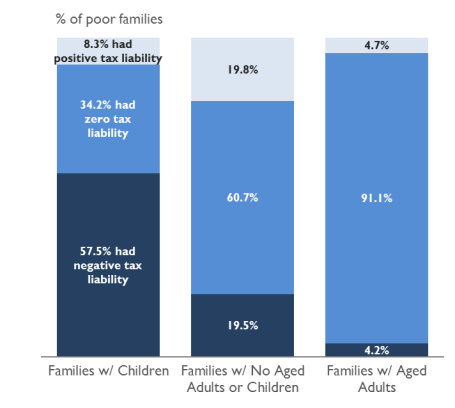
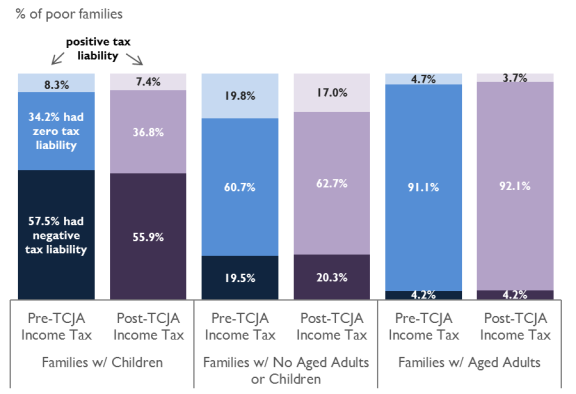
Figure 2 shows the estimated share of poor families with positive, zero, and negative tax liabilities under current law by the presence of children or aged family members. Nearly 6 in 10 poor families with children (57.5%) had a negative tax liability under the pre-TCJAcurrent income tax. In comparison, nearlyalmost 2 in 10 poor families without children or aged adults (19.518.8%) had a negative tax liability.
tax liability.
Figure 2. Estimated Share of Poor Families with |
 |
2017
Source: CRS estimates using TRIM3 and the ASEC B. Notes: Poverty status is determined using the SPM. Estimates under the |
The Impact of Pre-TCJA Income Tax on Poverty Rates
Comparing poverty rates before and after a policy change is one way to assess a policy's impact on poverty. To calculate poverty rates under the pre-TCJA income tax, a family's poverty status must be determined before and after tax. A family's before-tax poverty status is based on the family's available financial resources before federal income tax liabilities are subtracted from (or added to, in the case of negative tax liabilities) their disposable income. In contrast, a family's after-tax poverty status is based on the family's financial resources after the federal income tax is subtracted from (or added to, in the case of negative tax liabilities) disposable income. If the income tax boosts income sufficiently to push a poor family above the poverty threshold, they are then counted as nonpoor as a result of the pre-TCJA income tax. As previously discussed, if a family is determined to be poor, all members of that family are counted as poor. Poverty rates are then calculated based on the number of individuals who are poor before and after the pre-TCJA income tax is applied.
Figure 3 shows the effect of the pre-TCJA income tax system on the poverty rates of individuals based on the types of families in which individuals lived. Overall, the pre-TCJA income tax reduced poverty: the before-tax poverty rate was 14.5%, while the after-tax poverty rate was 12.5%, a net reduction of two percentage points. Figure 3 also indicates that the poverty reduction impact of the income tax was concentrated among individuals who lived in families with children. Specifically, the pre-TCJA income tax reduced child poverty by nearly 30% (from 17.5% in poverty to 12.3% in poverty) and reduced poverty among nonaged (i.e., nonelderly) adults in families with children by a quarter (from 14.5% in poverty to 10.8% in poverty).20 In contrast, the post-tax poverty rate for nonaged adults in families with no children was higher than the pre-tax poverty rate for this group (the poverty rate for individuals in this group rose from 12.8% to 13.1%).
|
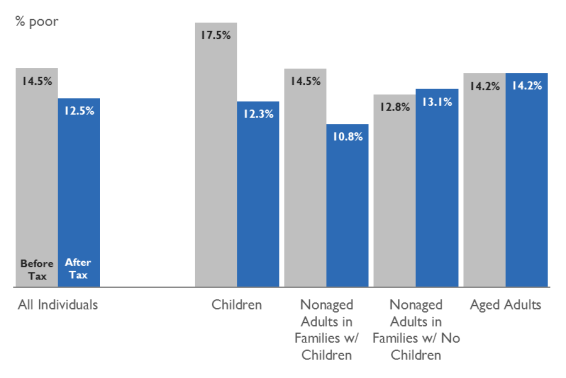 |
Notes: Poverty status is determined using the SPM. Estimates under the pre-TCJA income tax are estimated as if they were in effect in 2016. Children are under 18 years old. Aged adults are 65 years old and older. |
Further examination of the impact of the pre-TCJA income tax on poverty rates indicates that all of the antipoverty effect of the federal income tax went to those individuals who lived in families with workers. As illustrated in Table 1, CRS estimates that among the subset of families who had no workers, poverty rates, including the poverty rates of children and nonaged adults who lived with children, were unchanged by the pre-TCJA income tax. In contrast, among those who lived with a worker, poverty fell by over 20% (from 10.8% in poverty to 8.3% in poverty), with larger reductions for children and nonaged adults who lived in families with children. In other words, the poverty reduction of the pre-TCJA income tax was concentrated among individuals who lived with workers and children.
Table 1. Estimated Before-Tax and After- Tax Poverty RatesUnder the Pre-TCJA Income Tax forSelected Individuals Living in Families With and Without Workers, 2016
|
Individuals by Family Type |
Before Tax |
After Tax |
|
All Individuals Living in Families of All Types |
14.5% |
12.5% |
|
Children |
17.5% |
12.3% |
|
Nonaged Adults in Families with Children |
14.5% |
10.8% |
|
Individuals Living in Families with Workers |
10.8% |
8.3% |
|
Children |
14.7% |
9.2% |
|
Nonaged Adults in Families with Children |
12.3% |
8.5% |
|
Individuals Living in Families with No Workers |
34.7% |
34.7% |
|
Children |
64.1% |
64.1% |
|
Nonaged Adults in Families with Children |
64.3% |
64.3% |
Source: CRS estimates using TRIM3 and the ASEC 2017. See Appendix A.
Notes: Poverty status is determined using the SPM. Estimates under the pre-TCJA income tax are estimated as if they were in effect in 2016. Children are under 18 years old. An aged adult is 65 years old and older. A family with workers is a family that includes at least one worker. Workers are individuals 18 years and older who work at least one week during the year. For estimates of the number of individuals in poverty before the income tax by their family type, see Table B-1.
The Impact of Pre-TCJA Income Tax on the Poverty Gap
The poverty gap is another metric that can be used to understand poverty and to examine the impact of a policy on poverty. The poverty gap is the difference between the poverty threshold (an amount of money below which a family is counted as poor) and a family's disposable income. (The poverty gap for a nonpoor family is $0.) Unlike the poverty rate, which is based on whether a family is below the poverty threshold, the poverty gap provides a way of examining the degree to which a family is below that threshold.
For example, assume there are two poor families who have the same poverty threshold of $25,000. The first family has $20,000 of disposable income, hence their poverty gap is $5,000. The second family has $10,000 of disposable income—they are poorer than the first family—and their poverty gap is $15,000. Hence the larger the poverty gap, the poorer the family.
For this analysis, poverty gaps are summed together across all poor families to determine the aggregate poverty gap. The aggregate poverty gap is calculated both before and after taxes (or refundable credits) are subtracted (or added) to disposable income as calculated under the pre-TCJA income tax. Changes to the aggregate poverty gap from the pre-TCJA income tax measure the degree to which the federal income tax reduced financial hardship among poor families.
Table 2 provides estimates of the aggregate poverty gap before and after the pre-TCJA income tax. The aggregate poverty gap before the pre-TCJA income tax was $150.8 billion. The poverty gap after the pre-TCJA income tax was $138.1 billion. Thus, the pre-TCJA income tax reduced the aggregate poverty gap by $12.7 billion, all of which went to families with children and at least one worker. For families without children (i.e., families with aged adults and families without children or aged adults), the aggregate poverty gap increased slightly as a result of the pre-TCJA income tax.
Table 2. Estimated Aggregate Poverty GapBefore and After the Pre-TCJA Income Tax by Family Type, 2016
|
Family Type |
|
|
|
| ||||||||
|
All Poor Families |
|
|
|
| ||||||||
|
Poor Families with Children |
|
|
|
| ||||||||
|
With Workers |
|
|
|
| ||||||||
|
With No Workers |
|
|
|
| ||||||||
|
Poor Families with Aged Adults, but no Children |
|
|
|
| ||||||||
|
Poor Families without Children or Aged Adults |
|
|
|
|
Source: CRS estimates using TRIM3 and the ASEC 2017. See Appendix A.
Notes: The poverty gap is estimated using the SPM. Estimates under the pre-TCJA income tax are estimated as if they were in effect in 2016. Families with children are families with or without an aged (i.e., elderly, or 65 years old and older) member who have at least one child. Families with no children or an aged member are as described. Families with aged adults are families with aged adults and no children. Children are under 18 years old. A family with workers is a family that includes at least one worker. Workers are individuals 18 years old and older who work at least one week during the year. For estimates of the number of families in poverty before the income tax by family type, see Table B-2. Items may not sum to totals due to rounding.
a. Less than $100 million.
The Post-TCJA Income Tax and Poverty
Under the post-TCJA income tax—similar to the pre-TCJA income tax—many poor families did not owe federal income taxes (i.e., had zero tax liability), and a significant proportion owed no income tax and received a net benefit from refundable credits (i.e., had a negative tax liability). The impact of the post-TCJA income tax system on poverty rates and the poverty gap suggests the TCJA provided relatively small benefits to poor families. (CRS estimates that before the income tax was subtracted from [or added to, in the case of negative tax liabilities] a family's resources, there were approximately 21.4 million families—equaling 46.5 million individuals—in poverty. For more information, see Appendix B.)
Poor Families with Positive, Negative, and Zero Tax Liabilities Under the Post-TCJA Income Tax
As illustrated in Figure 4, CRS analysis indicates that the shares of poor and nonpoor families with positive, negative, and zero income tax liabilities were similar pre- and post-TCJA. For both poor and nonpoor families, there is a relatively small decrease (less than 2 percentage points) in the number of families with a positive tax liability. For both poor and nonpoor families, there is a relatively small increase in the share of families with zero tax liability. The share of poor families with a negative tax liability is effectively unchanged, while the share of nonpoor families with a negative tax liability increased by a relatively small amount.
|
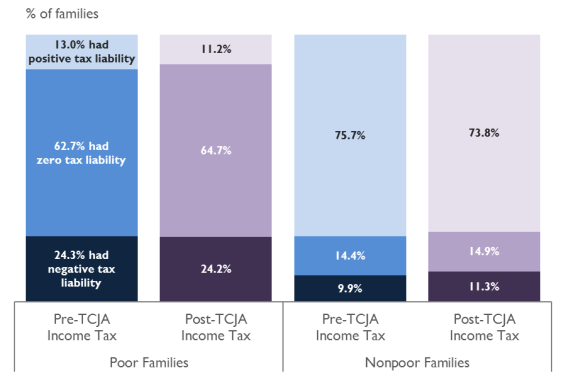 |
Notes: Poverty status is determined using the SPM. Estimates under the pre-TCJA and post-TCJA income tax are estimated as if they were in effect in 2016. Items may not sum to 100% due to rounding. |
Figure 5 compares the estimated share of poor families with positive, zero, and negative income tax liabilities under the pre-TCJA and post-TCJA income tax by family type. This analysis indicates that across all poor family types, the share of poor families that owed taxes (i.e., had positive tax liability) modestly fell as a result of the TCJA.21 Among poor families with children, CRS analysis indicates that share of these families who did not owe income taxes (i.e., had zero tax liability) increased as a result of the TCJA. In contrast, the share of poor families with children who received an increase in their disposable income from refundable tax credits (i.e., had a negative income tax liability) fell as a result of the TCJA.
|
 |
Notes: Poverty status is determined using the SPM. Estimates under the pre-TCJA and post-TCJA income tax are estimated as if they were in effect in 2016. Families with children are families with or without an aged (i.e., elderly, or 65 years old and older) member who have at least one child. Families with no children or an aged member are as described. Families with aged adults are families with aged adults and no children. Children are under 18 years old. Items may not sum to 100% due to rounding. |
The Impact of the Post-TCJA Income Tax on Poverty Rates
Figure 6 compares estimated after-tax poverty rates between the pre- and post-TCJA income tax. The difference in these poverty rates reflects the impact of the TCJA on poverty. These estimates indicate that the TCJA had a relatively small effect on poverty rates. CRS estimates that the TCJA reduced overall poverty by 1.6% (from 12.5% in poverty under the pre-TCJA income tax to 12.3% in poverty under the post-TCJA income tax). The impact of these changes was concentrated among individuals who lived in families with children. Specifically, the TCJA reduced poverty among children and nonaged adults living in families with children by about 2.4% and 1.9%, respectively (from 12.3% to 12.0% in poverty among children and from 10.8% to 10.6% in poverty among nonaged adults living in families with children).
|
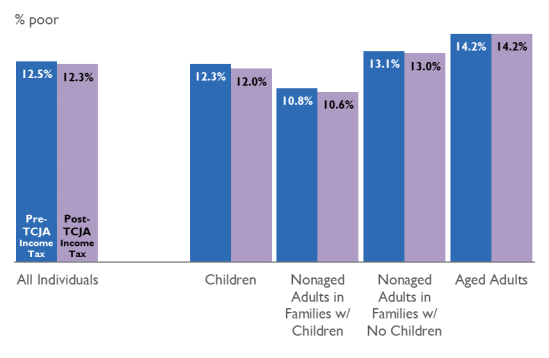 |
Notes: Poverty status is determined using the SPM. Estimates under the pre-TCJA and post-TCJA income tax are estimated as if they were in effect in 2016. Children are under 18 years old. Aged adults are 65 years old and older. |
As with the pre-TCJA income tax, the impact of the post-TCJA income tax on poverty rates was concentrated among those who lived in a family with workers. As illustrated in Table 3, CRS estimates that among the subset of families who had no workers, the poverty rates of children and nonaged adults who lived with children were unchanged by the post-TCJA income tax. In contrast, among those who lived with a worker, poverty fell by nearly 25% (from 10.8% in poverty to 8.1% in poverty), with larger reductions for children and nonaged adults who lived in families with children. As with the pre-TCJA income tax, these estimates suggest that virtually all of the benefits of post-TCJA income tax go to individuals who live with workers and children.
Table 3. Estimated Before-Tax and After-Tax Poverty RatesUnder the Post-TCJA Income Tax forSelected Individuals Living in Families With and Without Workers, 2016
|
Individuals by Family Type |
Before Tax |
After Tax |
|
All Individuals Living in Families of All Types |
14.5% |
12.3% |
|
Children |
17.5% |
12.0% |
|
Nonaged Adults in Families with Children |
14.5% |
10.6% |
|
Individuals Living in Families with Workers |
10.8% |
8.1% |
|
Children |
14.7% |
8.9% |
|
Nonaged Adults in Families with Children |
12.3% |
8.3% |
|
Individuals Living in Families with No Workers |
34.7% |
34.7% |
|
Children |
64.1% |
64.1% |
|
Nonaged Adults in Families with Children |
64.3% |
64.3% |
Source: CRS estimates using TRIM3 and the ASEC 2017. See Appendix A.
Notes: Poverty status is determined using the SPM. Estimates under the pre-TCJA and post-TCJA income tax are estimated as if they were in effect in 2016. Children are under 18 years old. An aged adult is 65 years old and older. A family with workers is a family that includes at least one worker. Workers are individuals 18 years old and older who work at least one week during the year. For estimates of the number of individuals in poverty before the income tax by their family type, see Table B-1.
The Impact of the Post-TCJA Income Tax on the Poverty Gap
The post-TCJA income tax reduced the aggregate poverty gap from $150.8 billion to $136.9 billion. The pre-TCJA income tax reduced the aggregate poverty gap to $138.1 billion. Hence, CRS estimates that the changes made by the TCJA reduced the aggregate poverty gap by an additional $1.2 billion compared to the pre-TCJA income tax. Table 4 breaks down this $1.2 billion reduction by family type and indicates that the majority of the additional reduction in the poverty gap—approximately $800 million of the $1.2 billion—occurred among families with children. Almost all of that $800 million went to families with children and workers.
Table 4. Estimated Aggregate Poverty GapBefore and After the Pre- and Post-TCJA Income Tax by Family Type, 2016
|
Family Type |
|
|
|
| ||||||||
|
All Poor Families |
|
|
|
| ||||||||
|
Poor Families with Children |
|
|
|
| ||||||||
|
With Workers |
|
|
|
| ||||||||
|
With No Workers |
|
|
|
| ||||||||
|
Poor Families with Aged Adults, but no Children |
|
|
|
| ||||||||
|
Poor Families without Children or Aged Adults |
|
|
|
|
Source: CRS estimates using TRIM3 and the ASEC 2017. See Appendix A.
Notes: The poverty gap is estimated using the SPM. Estimates under the pre-TCJA and post-TCJA income tax are estimated. Children are under 18 years old. Aged adults are 65 years old and older.
As previously discussed, these relatively small effects were concentrated among individuals who lived in families with children. Specifically, as illustrated in Table 1, the TCJA reduced poverty among children and nonaged adults living in families with children by about 3.5% and 4.0%, respectively (from 13.1% to 12.6% in poverty among children and from 10.8% to 10.4% in poverty among nonaged adults living in families with children).
Congressional Research Service
11
link to page 18 link to page 32 The Impact of the Federal Income Tax Code on Poverty
The Impact of the Income Tax on the Poverty Gap The poverty gap is another metric that can be used to understand poverty and to examine the impact of a policy on poverty. The poverty gap is the difference between the poverty threshold (an amount of money below which a family is counted as poor) and a family’s disposable income. (The poverty gap for a nonpoor family is $0.) Unlike the poverty rate, which is based on whether a family is below the poverty threshold, the poverty gap provides a way of examining the degree to which a family is below that threshold.
For example, assume there are two poor families who have the same poverty threshold of $25,000. The first family has $20,000 of disposable income; hence their poverty gap is $5,000. The second family has $10,000 of disposable income—they are poorer than the first family—and their poverty gap is $15,000. Hence the larger the poverty gap, the poorer the family.
For this analysis, poverty gaps are summed together across all poor families to determine the aggregate poverty gap. The aggregate poverty gap is calculated both before and after taxes (or refundable credits) are subtracted (or added) to disposable income as calculated under the income tax.
The current income tax reduced the aggregate poverty gap from $154.0 billion to $143.6 billion. Thus, the income tax reduced the aggregate poverty gap by $10.4 billion, all of which went to families with children and at least one worker. For families without children (i.e., families with aged adults and families without children or aged adults), the aggregate poverty gap increased slightly as a result of the income tax.
Table 2. Estimated Aggregate Poverty Gap
Before and After the Current and Pre-TCJA Income Tax by Family Type, 2017
After Tax
Difference
Current-
Between
Law
Current-
Income
and Prior-
Tax
Prior-Law
Law
Income
Before
(Post-
Income
Tax
Tax
TCJA)
Tax
($ in
($ in
(Pre-TCJA)
Systems
Family Type
bil ions)
bil ions)
($ in bil ions) ($ in bil ions)
All Poor Families
154.0
143.6
145.1
-1.5
Poor Families with Children
49.9
39.4
40.4
-1.0
With Workers
34.7
24.2
25.2
-1.0
With No Workers
15.3
15.3
15.3
0.0a
Poor Families with Aged Adults, but no Children
31.1
31.3
31.4
0.0a
Poor Families without Children or Aged Adults
73.0
72.9
73.3
-0.4
Source: CRS estimates using TRIM3 and the ASEC 2018. See Appendix B. Notes: The poverty gap is estimated using the SPM. Estimates under the current income tax code model the tax law in effect beginning in 2018 (i.e., after the enactment of TCJA). However, due to data limitations (i.e., the 2018 ASEC data are for the 2017 calendar year), the current income tax code provisions are modeled as if they
were in effect in 2017. Estimates of the prior-law (pre-TCJA) income tax are also modeled as if they were in effect in 20162017. Families with children are families with or without an aged (i.e., elderly, or 65 years old and older) member who have at least one child. Families with no children or an aged member are as described. Families
Congressional Research Service
12
link to page 17 link to page 19 The Impact of the Federal Income Tax Code on Poverty
with aged adults are families with aged adults and no children. Children are under 18 years old. A family with workers is a family that includes at least one worker. Workers are individuals 18 years old and older who work at least one week during the year. For estimates of the number of families in poverty before the income tax by family type, see Table B-2. C-2. Items may not sum to totals due to rounding.
a.
a. Less than $100 mil ion.
Comparison to the Pre-TCJA Income Tax
Changes to the aggregate poverty gap between the current-law income tax and the prior-law (pre-TCJA) income tax measure the degree to which the federal income tax reduced financial hardship among poor families.
The prior-law income tax reduced the aggregate poverty gap to $145.1 billion. Hence, CRS estimates that the changes made by the TCJA reduced the aggregate poverty gap by an additional $1.5 billion compared to the pre-TCJA income tax. Table 2 breaks down this $1.5 billion reduction by family type and indicates that the majority of the additional reduction in the poverty gap—approximately $1.0 billion of the $1.5 billion—occurred among families with children. Almost all of that $1.0 billion went to families with children and workers.
Impact of the Income Tax on Poverty Compared to Selected Low-Income Assistance Programs Less than $100 million.
A Comparison of the Impact of the Post-TCJA Income Tax and Selected Low-Income Assistance Programs on Poverty Rates and the Poverty Gap
A comparison of estimated antipoverty effects of the post-TCJA income tax and other low-income assistance programs indicates that whilealthough the income tax substantially reduced the poverty rate, it had more limited effects on the aggregate poverty gap.22 17
Poverty Rate
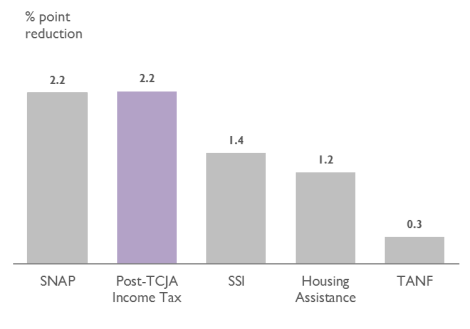
Figure 7 shows the estimated percentage-point reduction in the poverty rate attributable to the post-TCJA income tax and several low-income assistance programs: the Supplemental Nutrition Assistance Program (SNAP); Supplemental Security Income (SSI); assisted housing programs (Section 8 vouchers and public housing); and Temporary Assistance for Needy Families (TANF) block grant cash assistance.2318 Only SNAP resulted in a comparable reduction in the overall poverty rate compared to the post-TCJA income tax.
17 For the purposes of this analysis, the estimated percentage-point reduction in poverty rates is calculated for each benefit program in isolation, assuming all other benefit programs are in effect.
18 For more information on these programs, see CRS Report R42505, Supplemental Nutrition Assistance Program (SNAP): A Primer on Eligibility and Benefits; CRS Report R44948, Social Security Disability Insurance (SSDI) and Supplemental Security Income (SSI): Eligibility, Benefits, and Financing; CRS Report RL34591, Overview of Federal Housing Assistance Programs and Policy; and CRS Report RL32748, The Temporary Assistance for Needy Families (TANF) Block Grant: A Primer on TANF Financing and Federal Requirements.
Congressional Research Service
13
link to page 32 link to page 20
The Impact of the Federal Income Tax Code on Poverty
Figure 7. Estimated Percentage-Point Reduction in the Poverty Rate from
the |
 |
2017
Source: CRS estimates using TRIM3 and the ASEC B. Notes: Poverty status is determined using the SPM. Estimates under the |
Poverty Gap
Estimates of the reduction in the aggregate poverty gap from the post-TCJA income tax compared to selected low-income assistance programs highlight some of the limitations of the income tax in helping the poorest families. As illustrated in Figure 8, threetwo of the four low-income assistance programs reduced the poverty gap by greater amounts than the income tax.2419 This may occur for several reasons. First, these nontax programs tend to aid the very poor, and even though their benefits are not large enough to lift a family above the poverty threshold, they do provide significant financial assistance. Second, the majority of the income tax'’s antipoverty provisions—including the EITC and the ACTC—are available only to families with earned income. Poor families who receive the EITC and the ACTC tend to be "“less poor"” than other families who receive SNAP, SSI, housing assistance, and TANF.20
19 For the purposes of this analysis, the estimated reduction in the aggregate poverty gap is calculated for each benefit program in isolation, assuming all other benefit programs are in effect.
20 Based on annual income measured before taxes and transfers, 13% of EITC and 16% of recipients of the ACTC had incomes of less than half of the SPM poverty threshold in 2017. On the other hand, 43% of TANF recipients, 37% of SSI recipients, 49% of housing assistance recipients, and 32% of SNAP recipients had annual income measured before taxes and transfers of less than half the SPM poverty threshold in 2017.
Congressional Research Service
14
link to page 32
The Impact of the Federal Income Tax Code on Poverty
receive SNAP, SSI, and housing assistance.25
Figure 8. Estimated Dollar Reduction in the Aggregate Poverty Gap from |
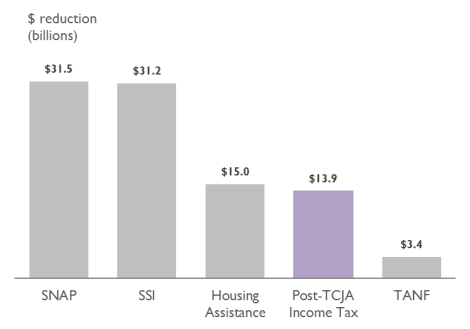 |
2017
Source: CRS estimates using TRIM3 and the ASEC B. Notes: Poverty status is determined using the SPM. Estimates under the |
Conclusion
Conclusion The income tax provides significant monetary benefits to many low-income families. These benefits reduce the overall poverty rate. The analysis in this report suggests, however, that the income tax is less effective, in comparison to many needs-tested programs, in helping the poorest families move out of poverty, as measured by its impact in reducing the aggregate poverty gap. Overall, the impact of the income tax on poverty was marginally changed by the TCJA. SpecificallySpecifically, CRS estimates that before taxes, the poverty rate was 14.57%. After the prior-law (pre-TCJA) income tax, the poverty rate fell to 12.5%, while8%, whereas after the post-TCJA current-law (post-TCJA) income tax it fell to 12.35%. CRS estimates that before taxes, the aggregate poverty gap was $150.8$154.0 billion. After the pre-TCJA income tax it fell to $138145.1 billion, whilewhereas after the post-TCJAcurrent-law income tax it fell to $136.9143.6 billion. These benefits went almost exclusively to individuals who lived in families with workers and children.
This analysis highlights both the importance of the tax system in reducing poverty, and also some of its limitations. As discussed in this report, the main mechanism by which the income tax reduces poverty is through refundable tax credits, primarily the EITC and the refundable portion of the child tax credit, the ACTC. These credits are available only to families who include a worker (and
Congressional Research Service
15
The Impact of the Federal Income Tax Code on Poverty
who generally have children)26 since21 because their value is based in part on a taxpayer'’s earned income. Hence these credits provide little if any benefit to those who do not or cannot work, and who are more likely to be poor.27
22
There are other limitations to using refundable tax credits to reduce poverty that are not discussed in this report. Notably, the EITC and child tax credit are received once a year as part of a taxpayer'taxpayer’s refund after they file their federal income tax return, and are not paid out on a more periodic basis (i.e., monthly) to help families meet their basic needs. Addressing this limitation, the National Academy of Sciences, in its most recent report on reducing child poverty, proposed converting the child tax credit into a monthly child allowance.2823 However, the Internal Revenue Service (IRS) may be ill-equipped to accurately and efficiently pay out tax benefits like the EITC and the child tax credit on a more periodic basis. Even on an annual basis, as they are currently paid out, these credits can be difficult for the IRS to administer and for taxpayers to comply with.2924 The complexity of these tax credits is often cited as the main factor driving their high rate of erroneous claims.30
25
Despite these limitations, and the limitations highlighted in this report, the income tax remains a popular (and near-universal) mechanism to provide aid to the working poor, especially those with children.26 Legislative proposals,27children.31 Recent legislative proposals,32 including the Economic Mobility Act of 2019 (H.R. 3300), would expand refundable tax credits, increasing the size of the EITC for workers without custodial children (the "childless EITC"), and increasing the ACTC to $2,000 ($3,000 for young children) for all low-income taxpayers irrespective of earned income. The stated purpose of this legislation is to help working families with children.33 And yet, by eliminating the phase-in for the ACTC, H.R. 3300 (and the American Family Act of 2019; S. 690/H.R. 1560) also represents a shift in the target population of refundable tax credits, expanding eligibility to poor families with children that do not include a worker. Similarly, the proposed increase in the EITC for taxpayers without custodial children also reflects a shift from providing benefits only to workers with children (although childless EITC recipients may live in families with other children and/or have noncustodial children who do not live with them). Insofar as eligibility and the amount of refundable tax credits are expanded, the antipoverty effects of the income tax may increase.
Appendix A.
Methodology and Data Sources
To examine how the federal individual income tax affects poverty, this report uses estimates from the Transfer Income Model, version 3 (TRIM3) and data from the Census Bureau's Annual Social and Economic Supplement (ASEC) to the Current Population Survey. TRIM3 is a static microsimulation model that estimates federal and state taxes and certain benefit transfer programs. TRIM3 is primarily funded by the U.S. Department of Health and Human Services and maintained by the Urban Institute. The measure of poverty used is the Census Bureau's Supplemental Poverty Measure (SPM).
The Annual Social and Economic (ASEC) Supplement to the Current Population Survey34
The ASEC is a household survey of the noninstitutionalized population conducted by the Census Bureau in March of each year.35 There are approximately 94,000 households in the ASEC.
The ASEC includes questions related to household members' demographic characteristics and family living arrangement at the time of the survey, and work experience and income in the prior year. This report's estimates are based on the 2017 ASEC, which captures information on work experience and income in the prior year—2016. The ASEC is used by the U.S. Census Bureau to estimate both the official poverty measure and SPM poverty in its reports. The sample of the ASEC is large enough to make reliable estimates for the nation as a whole and, sometimes, for some of the larger states. However, the sample is not large enough to make state-level estimates for all states.
Estimates discussed in this report were weighted from the sample information to make the ASEC representative of the population of U.S. households. Since the estimates in this report come from a sample, they are subject to sampling error.36 Additionally, the information on the ASEC is based on respondents' answers to the survey questions, and nonresponse or incorrect responses can result in nonsampling error.37
The ASEC itself does not ask survey respondents about taxes paid or refundable credits received in the prior year. That information—important for determining a family's or an individual's SPM poverty status—must be estimated. This report uses estimates from the TRIM microsimulation model for these estimates. The Census Bureau uses a different microsimulation model in its reports on SPM poverty.38
The TRIM3 Microsimulation Model
Microsimulation models of tax and transfer programs are composed of computer code that mimics the rules of the tax code and benefit programs. The models determine whether an individual, family, or other unit is eligible to be subject to a tax or eligible for a benefit and then estimates the amount of the tax (or benefit). TRIM assumes that all taxpayers fully comply with the requirements and rules of the tax code.
Federal Income Tax Module for 2016
TRIM3 applies policy rules in effect during the year to the population for that year.39 The estimates in this report use information from the TRIM3 federal income tax module for 2016. The 2016 federal income tax module makes "baseline estimates" of the tax code as it existed for 2016. The model uses data from the ASEC's information on family structure at the time of the survey to place individuals into federal tax filing units (e.g., taxpayer and, for those married filing jointly, the spouse). It also identifies "extended" tax filing units, which include dependents, and identifies "qualifying children" for the purpose of the EITC and the child tax credit. TRIM3 creates tax units not only for tax filers, but also for all potential filers. The model then uses information on the earnings and other income sources reported on the ASEC for 2016 to determine a tax filing unit's federal income tax liability.
Additionally, expense and income items not available on the ASEC but required to compute federal income taxes were obtained through a statistical match with the IRS Statistics of Income Public Use File, which is based on a sample of tax returns. TRIM3 estimates of the elderly and disabled tax credit and the child and dependent care tax credit are aligned to target amounts based on IRS data.
In terms of estimating federal income taxes, there are a number of caveats and limitations of the TRIM3 estimates. These limitations are not idiosyncratic to TRIM3 estimates. They generally result from limitations on the underlying ASEC data and are also present in estimates from the Census Bureau. These limitations include the following:
- Estimates are not reliable for very-high-income taxpayers. The estimates of federal income tax liability are not likely to be reliable for very-high-income taxpayers because the ASEC oversamples lower-income populations, rather than higher-income populations. Thus, TRIM3/ASEC estimates are most often used in reports (such as this report) that focus on lower-income populations.
- Amounts of refundable tax credits tend to be underestimated. The estimates from TRIM3 (as well as the Census Bureau's microsimulation model) underestimate refundable tax credits. For example, the TRIM3 estimate of the EITC for 2016 (pre-TCJA) was $39.2 billion. The total amount of the EITC claimed in 2016 according to the IRS was $66.7 billion.40 This discrepancy has long been known by researchers, but has yet to be fully explained. Potential reasons for the discrepancy include the information on the ASEC family structure perhaps not adequately representing that used for filing tax returns; the underreporting of certain forms of earnings (such as self-employment earnings); and the high rates of error made by taxpayers claiming the EITC.41
A Revised Federal Income Tax Module for Estimating Rules under the TCJA
The Urban Institute, in partnership with the Congressional Research Service (CRS), modified TRIM3's federal income tax module to account for the major provisions of the TCJA affecting individual taxpayers. Thus, the information in the model was revised to reflect
- the new tax brackets and marginal tax rates that apply to them,
- the suspension of the personal exemption and the increases in the standard deduction,
- limitations on itemized deductions, including the limitation on the deductibility of state and local taxes (SALT),
- revised rules for the child tax credit, and
- other changes to the federal individual income tax code.
TCJA Changes Not Modeled
A number of changes to the federal income tax were not modeled. These include changes to the treatment of alimony, the mortgage interest deduction, and elimination of the individual mandate for health insurance. The treatment of alimony was not modeled because the changes will apply only to new or revised orders and will not affect many cases in the near term.42 Limits on interest qualifying for the mortgage interest deduction were not modeled since there are no data to inform the impact of these changes.43 Additionally, certain smaller changes are not present in the simulation, such as the elimination of the deduction for bicycle commuting.44
Inflation Adjustment
The post-TCJA tax code parameters were deflated to 2016 dollars to answer the question, "What if the 2018 TCJA parameters were in place in 2016 and 2016 was the first year of their enactment?" The adjustment was done using the chained Consumer Price Index for All Urban Consumers (C-CPI-U), since the TCJA requires the use of that price index rather than the CPI-U for future price adjustments. Specifically, the 2018 amounts were adjusted to 2016 dollars using the chained CPI; see. Hence the estimates in this report reflect the impact of the post-TCJA tax code as if the first year of its enactment were 2016 (it actually went into effect in 2018).
|
| |
| ||
|
Married Filing Jointly |
||
|
*10% |
$0 |
$0 |
|
12% |
19,050 |
18,340 |
|
22% |
77,400 |
74,514 |
|
24% |
165,000 |
158,847 |
|
32% |
315,000 |
303,253 |
|
35% |
400,000 |
385,083 |
|
37% |
600,000 |
577,624 |
|
Head of Household |
||
|
10% |
0 |
0 |
|
12% |
13,600 |
13,093 |
|
22% |
51,800 |
49,868 |
|
24% |
82,500 |
79,423 |
|
32% |
157,500 |
151,626 |
|
35% |
200,000 |
192,541 |
|
37% |
500,000 |
481,354 |
|
Single |
||
|
10% |
0 |
0 |
|
12% |
9,525 |
9,170 |
|
22% |
38,700 |
37,257 |
|
24% |
82,500 |
79,423 |
|
32% |
157,500 |
151,626 |
|
35% |
200,000 |
192,541 |
|
37% |
500,000 |
481,354 |
|
Standard Deduction by Filing Status |
||
|
Married Filing Jointly |
24,000 |
23,105 |
|
Head of Household |
18,000 |
17,329 |
|
Unmarried |
12,000 |
11,552 |
|
Other Major Provisions |
||
|
Child Credit Amount |
2,000 |
1,925 |
|
Maximum ACTC |
1,400 |
1,348 |
|
ACTC Refundability Threshold |
2,500 |
2,407 |
Source: CRS, U.S. Department of Labor, Bureau of Labor Statistics, and the Internal Revenue Code.
a. These adjustments do not reflect the statutory inflation adjustment of these tax provisions. Instead, they reflect the actual 2018 dollars levels' purchasing power in 2016 dollars.
The Supplemental Poverty Measure
The SPM was created to address some of the limitations of the official poverty measure. Particularly relevant for this analysis, the official poverty measure does not take into account taxes (and tax benefits, like refundable credits) and their impact on disposable income. It also does not take into account certain noncash government benefits, such as food benefits from SNAP or the value of housing benefits.
The measure of total income in this analysis is computed similarly to the way the U.S. Census Bureau computes total financial resources, though there are a few differences. This analysis uses the TRIM3 estimates for TANF, SSI, and SNAP, rather than amounts reported on the ASEC, to address the underreporting of these income sources on the ASEC. Additionally, the measure of child care—deducted as a work expense for the SPM—differs. This analysis uses TRIM3's estimate of child care expenses, which includes estimated copayments for families receiving child care subsidies from the Child Care and Development Block Grant (CCDBG). The Census Bureau also caps child care expenses at the earnings of the lower-earning parent when determining net financial resources. This analysis deducts all child care expenses as a work-related expense of the family.
Appendix B.
Estimated Number of Individuals and Families in Poverty Before the Income Tax, 2016
Below are estimates of the number of individuals in poverty before the federal income taxes are subtracted from (or added to) financial resources using the TRIM3 microsimulation model. The individual types used in this table are also found in Table 1 and Table 3 of this report.
Table B-1. Estimated Number of Individuals in Poverty Before the Income Tax for Selected Individuals Living in Families With and Without Workers, 2016
|
Individuals by Family Type |
Number in poverty (millions) |
|
All Individuals Living in Families of All Types |
46.5 |
|
Children |
13.0 |
|
Nonaged Adults in Families with Children |
12.1 |
|
Individuals Living in Families with Workers |
29.0 |
|
Children |
10.3 |
|
Nonaged Adults in Families with Children |
9.9 |
|
Individuals Living in Families with No Workers |
17.4 |
|
Children |
2.7 |
|
Nonaged Adults in Families with Children |
2.2 |
Source: CRS estimates using TRIM3 and the ASEC 2017. See Appendix A.
Notes: Poverty status is determined using the SPM. Children are under 18 years old. An aged adult is 65 years old and older. A family with workers is a family that includes at least one worker. Workers are individuals 18 years and older who work at least one week during the year. Numbers are rounded to the nearest hundred thousand.
Below are estimates of the number of families in poverty before federal income taxes are subtracted from (or added to) financial resources, estimated using the TRIM3 microsimulation model. The family types used in this table are also found in Table 2 and Table 4 of this report.
|
Family Type |
Number in poverty (millions) |
||
|
All Poor Families |
| ||
|
Poor Families with Children |
| ||
|
With Workers |
| ||
|
With No Workers |
| ||
|
Poor Families with Aged Adults |
| ||
|
Poor Families without Children or Aged Adults |
|
Source: CRS estimates using TRIM3 and the ASEC 2017. See Appendix A.
Notes: Poverty status is determined using the SPM. Families with children are families with or without an aged (i.e., elderly, or 65 years old and older) member who have at least one child. Families with no children or an aged member are as described. Families with aged adults are families with aged adults and no children. Children are under 18 years old. A family with workers is a family that includes at least one worker. Workers are individuals 18 years and older who work at least one week during the year. Numbers are rounded to the nearest hundred thousandth.
Appendix C.
How the Major Federal Income Tax Provisions That Affect Low-Income Taxpayers Were Modified by the TCJA
Below are descriptions of how the major federal income tax provisions that affect low-income taxpayers—deductions, exemptions, tax rates, and refundable credits—were changed by the TCJA. Stylized examples included at the end of each section help illustrate the impact of these changes for a hypothetical family.
21 Among children who were poor, two-thirds lived in families with one or more earners. For more information, see CRS Report R44698, Demographic and Social Characteristics of Persons in Poverty: 2015.
22 Among working-aged adults (aged 18 to 64 years old), 11.6% were poor. Among the subset of working-aged adults who worked full or part time, 5.8% were in poverty. Among the subset of working-aged adults who did not or could not work, 30.5% were in poverty. U.S. Census Bureau, Income and Poverty in the United States: 2017, “Table 3. People and Families in Poverty by Selected Characteristics: 2016 and 2017,” September 12, 2018, at https://www.census.gov/library/publications/2018/demo/p60-263.html. Another perspective provides a similar insight. Among working-aged adults in poverty, over 60% of them in 2015 did not or could not work. For more information, see CRS Report R44698, Demographic and Social Characteristics of Persons in Poverty: 2015.
23 The National Academies of Sciences, Engineering, and Medicine, A Roadmap to Reducing Child Poverty, 2019, at https://sites.nationalacademies.org/DBASSE/BCYF/Reducing_Child_Poverty/index.htm.
24 For an overview of these challenges, see CRS Report R43873, The Earned Income Tax Credit (EITC): Administrative and Compliance Challenges; and IRS Taxpayer Advocate Service, Objectives Report to Congress Fiscal Year 2020: Volume 3, Earned Income Tax Credit, at https://taxpayeradvocate.irs.gov/reports/fy-2020-objectives-report-to-congress/volume-3.
25 In its FY2018 Annual Financial Report, the Department of the Treasury stated, “Treasury and IRS analyses, as well as audits by the Government Accountability Office (GAO) and Treasury Inspector General for Tax Administration (TIGTA), have consistently found that payment errors for EITC and other tax credit programs are largely attributable to the statutory design and complexity of the credits within the tax system, and not rooted in internal control weaknesses, financial management or financial reporting deficiencies.” Department of the Treasury, Agency Financial Report Fiscal Year 2018, 2018, p. 150, at https://home.treasury.gov/about/budget-financial-reporting-planning-and-performance/agency-financial-report.
26 In his proposal for a universal EITC, Len Burman discusses some of the political reasons why work-based refundable tax credits remain a popular policy tool. He writes, “Political scientists have found ample evidence that people all over the world categorize people in terms of ‘deservedness.’”… Most people are willing to help someone who is unlucky but are less eager to support someone who they perceive as lazy.… The deservingness heuristic explains why the largest refundable tax credits are tied to work, children, health or schooling, and it helps explain the growing prevalence of work requirements in means-tested transfer programs.” Leonard E. Burman, A Universal EITC: Sharing the Gains from Economic Growth, Encouraging Work, and Supporting Families, Tax Policy Center, May 20, 2019, p. 10, at https://www.taxpolicycenter.org/publications/universal-eitc-sharing-gains-economic-growth-encouraging-work-and-supporting-families/full.
27 Other legislative proposals in the 116th Congress that would increase the amounts of refundable tax credit include H.R. 3507, H.R. 1560, H.R. 1431, and S. 1138.
Congressional Research Service
16
The Impact of the Federal Income Tax Code on Poverty
custodial children (the “childless EITC”), and increasing the ACTC to $2,000 ($3,000 for young children) for all low-income taxpayers irrespective of earned income. The stated purpose of this legislation is to help working families with children.28 And yet, by eliminating the phase-in for the ACTC, H.R. 3300 (and the American Family Act of 2019; S. 690/H.R. 1560) also represents a shift in the target population of refundable tax credits, expanding eligibility to poor families with children that do not include a worker. Similarly, the proposed increase in the EITC for taxpayers without custodial children also reflects a shift from providing benefits only to workers with children (although childless EITC recipients may live in families with other children and/or have noncustodial children who do not live with them). (Similar tax law changes have been included in the Heroes Act [H.R. 6800] which passed the House on May 15, 2020, and a revised version of the Heroes Act [H.R. 8406] which passed the House on October 1, 2020.) Expanding eligibility for refundable tax credits would likely increase the antipoverty effects of the income tax.
28 Chairman Neal’s press release for H.R. 3300 was titled, “Neal introduces pro-worker, pro-family tax legislation” and stated that H.R. 3300 is “legislation that helps families afford child care, encourages work, stimulates local economies, and provides significant tax relief for working- and middle-class families.” Ways and Means Committee, “Neal Introduces Pro-Worker, Pro-Family Tax Relief Legislation,” press release, June 18, 2019, at https://waysandmeans.house.gov/media-center/press-releases/neal-introduces-pro-worker-pro-family-tax-relief-legislation.
Congressional Research Service
17
The Impact of the Federal Income Tax Code on Poverty
Appendix A. How Major Provisions of the Federal Income Tax Affect the Poor and How They Were Modified by the TCJA The description below summarizes only the major aspects of the federal income tax calculation that are particularly relevant for poor families. For a more detailed overview of the federal income tax calculation, see CRS Report R45145, Overview of the Federal Tax System in 2019; and CRS Infographic IG10014, The U.S. Individual Income Tax System, 2019.29 For a more detailed description of the tax provisions summarized below, how they affect income tax liability, and how they were modified by the TCJA, see CRS Report R45092, The 2017 Tax Revision (P.L. 115-97): Comparison to 2017 Tax Law.
The TCJA substantially modified the federal tax code, including changing many provisions that affect individuals. Most of these changes are temporary, and are scheduled to expire (“sunset”) at the end of 2025. The TCJA’s ultimate impact on a particular taxpayer’s tax liability depends on how the taxpayer’s individual circumstances interact with all of these provisions, not just one of them. For example, as a result of all the changes made by the TCJA, a taxpayer may have greater taxable income, but that income may be subject to lower marginal tax rates, and the taxpayer may also be eligible for a larger child credit. Hence, even though on average the TCJA lowered tax liabilities, individual taxpayers’ tax liabilities may have been unchanged, increased, or decreased as a result of the law.30
Below are descriptions of how the major federal income tax provisions affect low-income taxpayers—exclusion, deductions, exemptions, tax rates, and refundable credits. A summary of how these provisions were changed by the TCJA is also included. Stylized examples included at the end of each section help illustrate the impact of these changes for a hypothetical family.
Calculating Income Tax Liability The first step for taxpayers in calculating their income tax liability is to add up their income from various sources to calculate their gross income.
Exclusion of Public Assistance
The income tax code excludes certain types of income received by lower-income individuals from gross income. For example, public assistance payments (cash assistance from the Supplemental Security Income program or the Temporary Assistance for Needy Families [TANF] Block Grant) and the value of certain noncash benefits (food benefits from the Supplemental Nutrition Assistance Program [SNAP] or the subsidy value of housing benefits) are excluded from gross income under the income tax system, and hence are not taxable. The TCJA did not make any changes to the exclusion of public assistance.
29 For an overview of the tax system before the TCJA, see CRS Report R45053, The Federal Tax System for the 2017 Tax Year.
30 For example, the Tax Policy Center estimated that 80.4% of all taxpayers would receive a tax cut in 2018 as a result of the TCJA averaging $2,140. The lowest-income taxpayers receiving a tax cut would see their taxes fall by $130 on average. TPC also estimated that 4.8% of all taxpayers would see their taxes increased under the law in 2018. The lowest-income taxpayers with a tax increase would see their taxes rise by $810 on average. See Table 4 in Tax Policy Center, Distributional Analysis of the Conference Agreement for the Tax Cuts and Jobs Act, December 18, 2017, https://www.taxpolicycenter.org/publications/distributional-analysis-conference-agreement-tax-cuts-and-jobs-act/full.
Congressional Research Service
18
link to page 25 link to page 25 The Impact of the Federal Income Tax Code on Poverty
The taxpayer then subtracts from gross income various deductions and exemptions to calculate the amount of income that is taxable—their taxable income. Most low-income taxpayers will subtract from their gross income the standard deduction (and before 2018, personal exemptions) to calculate their taxable income.
Standard Deduction and Personal Exemptions Standard Deduction and Personal Exemptions
The standard deduction and personal exemption, when combined, represent the minimum amount of income of a tax unit that is not taxed under the federal income tax. The standard deduction is a fixed dollar amount that taxpayers can subtract from their income when determining the amount of their income subject to taxation (e.g., "“taxable income"”). The TCJA nearly doubled the standard deduction. Specifically, in 2018 the standard deduction for unmarried single filers, head of household filers, and married joint filers increased from $6,500, $9,550, and $13,000 to $12,000, $18,000, and $24,000, respectively. The TCJA suspended the personal exemption, effectively reducing it from $4,150 per person in 2018 to $0. These changes are in effect from 2018 through the end of 2025.45
31
The combination of the standard deduction and personal exemption is sometimes referred to as the 0% bracket sincebecause that income is not taxed. It is also referred to as the tax entry point sincebecause every dollar above this amount is generally taxable (and hence considered taxable income).4632 The increase of the standard deduction combined with the effective elimination of the personal exemption result in a similar or higher tax entry point for some families (unmarried individuals with no children, unmarried individuals with one child, and married couples with no children, as illustrated in Table CA-1), whereas, while larger families, including many with children, will have a lower tax entry point under the new tax law. For these families, more of their income will potentially be subject to the federal income tax.
For example, as illustrated in Table CA-1, a married couple with two children would have had a tax entry point in 2018 pre-TCJA of $29,600. If this family had $36,000 of income, only the amount above $29,600—i.e., $6,400—would have been taxable. Post-TCJA this tax entry point is now $24,000 for this same family. Hence, of their $36,000 of income, $12,000 would now be taxable income.
31 The personal exemption is a fixed dollar amount that taxpayers subtract for each individual on their income tax return (so a husband and wife with two kids would generally claim four personal exemptions). Prior to the TCJA, the personal exemption was $4,150 (so a family of four could subtract from their income $16,600).
32 A taxpayer having income above the tax entry point does not necessarily mean that taxpayer will have a positive income tax liability. The taxpayer may also receive tax credits, including the EITC or child tax credit, that offset any tax liability associated with having income above the tax entry point.
Congressional Research Service
19
link to page 26 The Impact of the Federal Income Tax Code on Poverty
Table Aincome.
Table C-1. Combined Standard Deduction and Personal Exemption
for Hypothetical Taxpayers Under the Pre-TCJA and Current-Law (Post- TCJA)
Income Tax, 2018
Tax Unit Structure
Pre-TCJA
Post-TCJA
Unmarried person, no children
$10,700
$12,000
Unmarried parent with 1 child
$17,850
$18,000
Unmarried parent with 2 children
$22,000
$18,000
Unmarried parent with 3 children
$26,150
$18,000
Married couple with no children
$21,300
$24,000
Married parents with 1 child
$25,450
$24,000
Married parents with 2 children
$29,600
$24,000
Married parents with 3 children
$33,750
$24,000
and Post- TCJA Income Tax, 2018
|
Tax Unit Structure |
Pre-TCJA |
Post-TCJA |
|
Unmarried person, no children |
$10,700 |
$12,000 |
|
Unmarried parent with 1 child |
$17,850 |
$18,000 |
|
Unmarried parent with 2 children |
$22,000 |
$18,000 |
|
Unmarried parent with 3 children |
$26,150 |
$18,000 |
|
Married couple with no children |
$21,300 |
$24,000 |
|
Married parents with 1 child |
$25,450 |
$24,000 |
|
Married parents with 2 children |
$29,600 |
$24,000 |
|
Married parents with 3 children |
$33,750 |
$24,000 |
Source: CRS calculations based on IRS Revenue Procedure 2018-18 and Revenue Procedure 2017-58.
Source: CRS calculations based on IRS Revenue Procedure 2018-18 and Revenue Procedure 2017-58. Notes: Unmarried parents are assumed to file their taxes as head of household filers, while married parents are assumed to file their income taxes as married filers filing jointly. Unmarried individuals with no children are assumed to be single filers. Families are assumed to be the same as tax units, and only claim the standard deduction and applicable personal exemptions.
After taxpayers have calculated their taxable income, they then apply marginal tax rates to calculate their tax liability before credits. Marginal Tax Rates/Tax Brackets
A marginal tax rate is the percentage that a taxpayer pays on an additional dollar of taxable income. The federal individual income tax code has seven marginal tax rates ranging from 10% to 37%. The income ranges over which these marginal rates apply, often referred to as tax brackets, differ based on the taxpayer'’s filing status. The federal income tax is considered a progressive tax by economists because as taxable income increases, income above a given bracket threshold is taxed at a higher marginal rate.47
33
Once a tax unit has determined how much—if any—of their income is taxable (i.e., after subtracting the standard deduction from their income post-TCJA), they then apply marginal tax rates to this amount. If poor families have any taxable income, most if not all of it is subject to the lowest marginal tax rate, although some of their income may be subject to the second-lowest bracket (the second-lowest bracket was the 15% bracket pre-TCJA, and is now 12% under the TCJA). The lowest marginal tax rate—10%—was unchanged by the TCJA.4834 Changes to marginal tax rates are presented in Table CA-2. These changes are in effect from 2018 through the end of 2025.
Table C
33 For more information on the mechanics of marginal tax rates, see CRS Insight IN11015, The Federal Income Tax: How Do Marginal Income Tax Rates Work?, by Margot L. Crandall-Hollick.
34 The 10% bracket applies to the first $9,525 of taxable income for unmarried individuals with no dependents, $13,600 for unmarried taxpayers with dependents, and $13,000 for married couples who file jointly. The second-lowest tax rate was 15% prior to TCJA and was reduced to 12% by TCJA. The second-lowest bracket applies to income above $9,525 up to $38,700 for unmarried individuals with no dependents, above $13,600 up to $51,800 for unmarried taxpayers with dependents, and above $19,050 up to $77,400 for married couples who file jointly.
Congressional Research Service
20
The Impact of the Federal Income Tax Code on Poverty
Table A-2. Marginal Tax Rates Under the Pre- and Post-TCJA Income Tax, 2018
Pre-TCJA Marginal
Post-TCJA
Taxable Income Range
Rate
Marginal Rate
Single filers (e.g., unmarried with no children)
$0-$9,525
10%
10%
$9,525-$38,700
15%
12%
$38,700-$82,500
25%
22%
$82,500-$93,700
25%
24%
$93,700-$157,500
28%
24%
$157,500-$194,450
28%
32%
$194,450-$200,000
33%
32%
$200,000-$424,950
33%
35%
$424,950-$426,700
35%
35%
$426,700-$500,000
39.6%
35%
$500,0000+
39.6%
37%
Head of household filers (e.g., unmarried individuals with children)
$0-$13,600
10%
10%
$13,600-$51,800
15%
12%
$51,800-$82,500
25%
22%
$82,500-$133,850
25%
24%
$133,850-$157,500
28%
24%
$157,500-$200,000
28%
32%
$200,000-$216,700
28%
35%
$216,700-$424,950
33%
35%
$424,950-$453,350
35%
35%
$453,350-$500,000
39.6%
35%
$500,000+
39.6%
37%
Married joint filers (married taxpayers with or without children)
$0-$19,050
10%
10%
$19,050-$77,400
15%
12%
$77,400-$156,150
25%
22%
$156,150-$165,000
28%
22%
$165,000-$237,950
28%
24%
$237,950-$315,000
33%
24%
$315,000-$400,000
33%
32%
$400,000-$424,950
33%
35%
$424,950-$480,050
35%
35%
Congressional Research Service
21
The Impact of the Federal Income Tax Code on Poverty
Pre-TCJA Marginal
Post-TCJA
Taxable Income Range
Rate
Marginal Rate
$480,050-$600,000
39.6%
35%
$600,000+
39.6%
37%
-2. Marginal Tax Rates Under the Pre- and Post-TCJA Income Tax, 2018
|
Taxable Income Range |
Pre-TCJA Marginal Rate |
|
|
Single filers (e.g., unmarried with no children) |
||
|
$0-$9,525 |
10% |
10% |
|
$9,525-$38,700 |
15% |
12% |
|
$38,700-$82,500 |
25% |
22% |
|
$82,500-$93,700 |
25% |
24% |
|
$93,700-$157,500 |
28% |
24% |
|
$157,500-$194,450 |
28% |
32% |
|
$194,450-$200,000 |
33% |
32% |
|
$200,000-$424,950 |
33% |
35% |
|
$424,950-$426,700 |
35% |
35% |
|
$426,700-$500,000 |
39.6% |
35% |
|
$500,0000+ |
39.6% |
37% |
|
Head of household filers (e.g., unmarried individuals with children) |
||
|
$0-$13,600 |
10% |
10% |
|
$13,600-$51,800 |
15% |
12% |
|
$51,800-$82,500 |
25% |
22% |
|
$82,500-$133,850 |
25% |
24% |
|
$133,850-$157,500 |
28% |
24% |
|
$157,500-$200,000 |
28% |
32% |
|
$200,000-$216,700 |
28% |
35% |
|
$216,700-$424,950 |
33% |
35% |
|
$424,950-$453,350 |
35% |
35% |
|
$453,350-$500,000 |
39.6% |
35% |
|
$500,000+ |
39.6% |
37% |
|
Married joint filers (married taxpayers with or without children) |
||
|
$0-$19,050 |
10% |
10% |
|
$19,050-$77,400 |
15% |
12% |
|
$77,400-$156,150 |
25% |
22% |
|
$156,150-$165,000 |
28% |
22% |
|
$165,000-$237,950 |
28% |
24% |
|
$237,950-$315,000 |
33% |
24% |
|
$315,000-$400,000 |
33% |
32% |
|
$400,000-$424,950 |
33% |
35% |
|
$424,950-$480,050 |
35% |
35% |
|
$480,050-$600,000 |
39.6% |
35% |
|
$600,000+ |
39.6% |
37% |
Source: IRS Revenue Procedure 2018-18 and Revenue Procedure 2017-58.
Source: IRS Revenue Procedure 2018-18 and Revenue Procedure 2017-58. Notes: These marginal tax rates apply to ordinary income. Different rates are applicable to capital gains and dividends. For a visualization of these rates over different income ranges, seeCRSsee CRS Insight IN11039, The Federal Income Tax: How Did P.L. 115-97 Change Marginal Income Tax Rates?, by Margot L. Crandall-Hollick.
For example, for a married couple with two children and $36,000 in income, their taxable income pre-TCJA would have been $6,400 in 2018. That income would have been subject to a 10% marginal rate, for a tax liability—before accounting for tax credits—of $640. Post-TCJA, this same family would have had $12,000 of taxable income, all subject to the 10% marginal rate, which would result in $1,200 of income tax liability before subtracting any tax credits.
After taxpayers calculate their income tax liability before credits, they can subtract the value of any tax credits for which they may be eligible. Taxpayers with little or no
Refundable Tax Credits Tax credits reduce the amount a taxpayer owes dollar-for-dollar the value of the credit. Credits can be nonrefundable or refundable. Nonrefundable credits cannot exceed tax liability, and therefore can only reduce tax liability to zero. In other words, “the maximum value of a nonrefundable credit is capped at a taxpayer’s tax liability.”35 For example, if a taxpayer owes $1,000 in income taxes and is eligible to receive $4,000 in nonrefundable tax credits, the taxpayer will receive only $1,000 in nonrefundable tax credits, reducing their income tax liability to zero. By contrast, refundable credits are not limited by how much a taxpayer owes in income taxes, meaning those with little to no tax liability, including many poor taxpayers, can receive the full value of the credit. A refundable tax credit provides a net benefit to a taxpayer (i.e., after-tax income is greater than before-tax income) when the amount of the credit is greater than the taxpayer’s income tax liability. For example, if a taxpayer owes $1,000 in income taxes but receives $4,000 in refundable tax credits, the taxpayer has a net benefit (and negative tax liability) of $3,000.36
The two major refundable tax credits claimed by low-income working taxpayers are the EITC and the additional child tax credit (the ACTC, which is the refundable portion of the child tax credit).37
The Child Tax Credit
Many taxpayers with children and with little or no income tax liability—which includes most of the poor—can stillmay receive the refundable credits, including the refundable portion of the child tax credit (the ACTC). The ACTC is calculated as a percentage of earnings (the refundability rate)
35 Tax Policy Center, Tax Policy Center Briefing Book: Key Elements of the U.S. Tax System, “What Is the Difference Between Refundable and Nonrefundable Credits?” 2016, https://www.taxpolicycenter.org/briefing-book/what-difference-between-refundable-and-nonrefundable-credits.
36 Refundable credits are first applied toward any income tax liability, with the remainder received as part of the taxpayer’s refund. 37 Some low-income taxpayers will receive both the ACTC and the nonrefundable portion of the child tax credit. The sum of the ACTC and the nonrefundable child tax credit cannot exceed the maximum credit per child.
Congressional Research Service
22
link to page 28 link to page 28 link to page 29 link to page 30 The Impact of the Federal Income Tax Code on Poverty
above the refundability threshold up to the maximum amount of the refundable portion of the credit. The ACTC plus the amount of the credit that offsets any income tax liability cannot be greater than the maximum credit per child. (Low-income families who do have a positive tax liability will first reduce their income tax liability by the nonrefundable portion of the child tax credit, and then claim the ACTC.)
TCJA made several changes to the child tax credit and ACTC, as outlined inin Table CA-3.
Table A-3.
|
Parameter |
|
Pre-2018/Post-2025 |
|
Maximum Credit per Child |
$2,000 |
$1,000 |
|
Maximum Refundable Credit per Child (ACTC) |
$1,400 |
$1,000 |
|
Refundability Threshold |
$2,500 |
$3,000 |
|
Refundability Rate |
15% |
15% |
|
Phaseout Threshold |
|
|
|
Phaseout Rate |
5% |
5% |
-3. Overview of Changes to the Child Tax Credit Under the TCJA
Current Law (Post-TCJA)
Parameter
2018-2025
Pre-2018/Post-2025
Maximum Credit per Child
$2,000
$1,000
Maximum Refundable Credit per
$1,400
$1,000
Child (ACTC)
Refundability Threshold
$2,500
$3,000
Refundability Rate
15%
15%
Phaseout Threshold
$200,000 unmarried taxpayer
$75,000 unmarried taxpayera
$400,000 married joint return
$110,000 married joint return
Phaseout Rate
5%
5%
Source: Internal Revenue Code, 26 U.S.C. §24. Source: Internal Revenue Code, 26 U.S.C. §24.
Note: The refundable portion of the child tax credit is often referred to as the additional child tax credit, or ACTC.
a. $55,000 married separate return.
ACTC.
In addition to modifying the credit formula, TCJA also enacted a new ID requirement for the credit. Prior to TCJA, taxpayers could provide the taxpayer identification number for the child in order to claim the credit. The most common taxpayer ID is a Social Security number (SSN), but other taxpayer identification IDs included individual taxpayer identification numbers (ITINs).49 38 Post-TCJA, taxpayers will now need to provide the SSN for the child in order to claim the credit. These changes are in effect from 2018 through the end of 2025.
How much a taxpayer'’s child tax credit changed following the TCJA depends on their income level. As a result of the changes made in the TCJA, the child tax credit doubled for many middle-income families. With the higher income phaseout thresholds, middle- and higher-income families became child tax credit eligible, as illustrated inin Figure CA-1. HoweverHowever, many low-income families received a smaller increase, as illustrated inin Figure CA-2.
38 For more information, see CRS Report R44420, Individual Taxpayer Identification Number (ITIN) Filers and the Child Tax Credit: Overview and Legislation.
Congressional Research Service
23
The Impact of the Federal Income Tax Code on Poverty
Figure A-2.
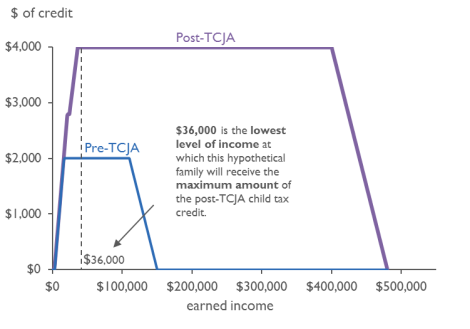
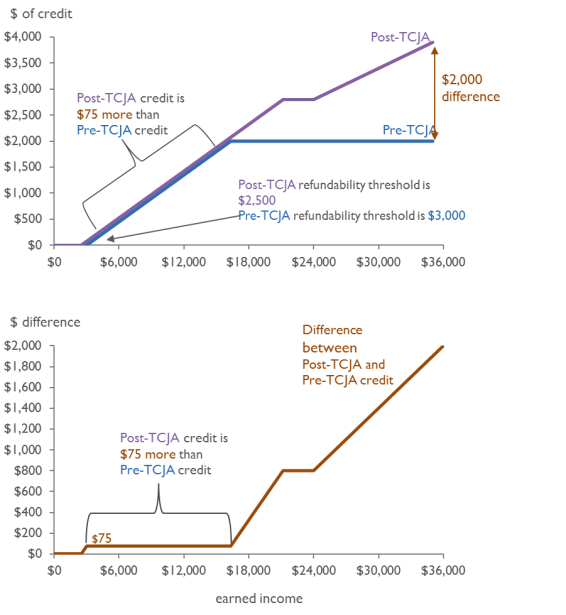
For example, for a married couple with two children and $25,000 of income, their child credit as a result of the TCJA would increase from $2,000 to $2,900 ($800 of the increase from the refundable portion and $100 from the nonrefundable portion). For this family, once income was Congressional Research Service 25 The Impact of the Federal Income Tax Code on Poverty $36,000, their child tax credit would increase from $2,000 to $4,000 (with $800 of that increase from the refundable portion and $1,200 from the nonrefundable portion).
The Earned Income Tax Credit
The law did not directly change the largest antipoverty program in the tax code, the EITC. However, the law did change the measure of inflation used to adjust numerous provisions in the tax code, including the EITC, beginning in 2018. This new inflation index, the C-CPI-U price index, is projected to grow more slowly than the previous inflation index, the CPI-U.50 39 Hence, over time the EITC will grow more slowly. In 2018, the differences in the EITC from the adoption of this new measure will bewere relatively small, reducing the maximum amount of the credit by $1 for recipients with no children, $7 for recipients with one child, $12 for those with two children, and $13 for those with three or more children. However, as the effects of the slower inflation adjustment compound over time, these changes will grow larger.
In addition, the income cutoff points of marginal tax rates will grow more slowly. Over time, if wages grow faster than C-CPI-U, some of the income of low-income taxpayers currently subject to the 10% marginal tax rate may become subject to higher marginal rates.
39 Testimony of Jeffrey Kling, Associate Director for Economic Analysis, Congressional Budget Office, in U.S. Congress, House Committee on Ways and Means, Subcommittee on Social Security, Using the Chained CPI to Index Social Security, Other Federal Programs, and the Tax Code for Inflation, 113th Cong., April 18, 2013.
Congressional Research Service
26
The Impact of the Federal Income Tax Code on Poverty
Appendix B. Methodology and Data Sources40 To examine how the federal individual income tax affects poverty, this report uses estimates from the Transfer Income Model, version 3 (TRIM3) and data from the Census Bureau’s Annual Social and Economic Supplement (ASEC) to the Current Population Survey. TRIM3 is a static microsimulation model that estimates federal and state taxes and certain benefit transfer programs. TRIM3 is primarily funded by the U.S. Department of Health and Human Services and maintained by the Urban Institute. The measure of poverty used is the Census Bureau’s Supplemental Poverty Measure (SPM).
The Annual Social and Economic (ASEC) Supplement to the Current Population Survey41 The ASEC is a household survey of the noninstitutionalized population conducted by the Census Bureau in March of each year.42 There are approximately 94,000 households in the ASEC.
The ASEC includes questions related to household members’ demographic characteristics and family living arrangement at the time of the survey, and work experience and income in the prior year. This report’s estimates are based on the 2018 ASEC, which captures information on work experience and income in the prior year—2017. The ASEC is used by the U.S. Census Bureau to estimate both the official poverty measure and SPM poverty in its reports. The sample of the ASEC is large enough to make reliable estimates for the nation as a whole and, sometimes, for some of the larger states. However, the sample is not large enough to make state-level estimates for all states.
Estimates discussed in this report were weighted from the sample information to make the ASEC representative of the population of U.S. households. Because the estimates in this report come from a sample, they are subject to sampling error.43 Additionally, the information on the ASEC is based on respondents’ answers to the survey questions, and nonresponse or incorrect responses can result in nonsampling error.44
40 The estimates in this version of the report are not necessarily comparable to those in the prior versions because of changes in estimating methods between the two years.
41 The ASEC is a supplement to the monthly Current Population Survey that is used to produce labor force statistics such as monthly labor force participation, employment, and unemployment statistics. The ASEC supplement is conducted on the entire sample interviewed in March of each year, plus one-fourth of the sample interviewed in February and one-fourth of the sample interviewed in April of each year.
42 The noninstitutionalized population excludes those persons residing in institutional group quarters such as adult correctional facilities, juvenile facilities, skilled-nursing facilities, and other institutional facilities such as mental (psychiatric) hospitals and in-patient hospice facilities. The noninstitutionalized population includes members of the Armed Forces living in civilian housing units on a military base or in a household not on a military base.
43 Statistical theory provides a way to quantify the “sampling error” that comes from using information from a sample rather than the entire population. However, Census household surveys also have inherent “nonsampling error” that comes, for example, from respondents not accurately answering certain questions on the survey. Nonsampling error cannot be quantified. Additionally, the use of microsimulation adds to the uncertainty of the estimates. Microsimulation models—like all models—are simplifications and do not account for all the complexity of what they attempt to model. The error, or uncertainty, of the estimates of the microsimulation model cannot be quantified with statistical theory. Thus, because major sources of the uncertainty of the estimates in this report cannot be quantified, this report does not report measures of uncertainty or error (such as standard errors), as they would likely understate the true amount of uncertainty in the estimates.
44 If some respondents to the ASEC answered the questions inaccurately, it would affect the estimates in this report.
Congressional Research Service
27
The Impact of the Federal Income Tax Code on Poverty
The ASEC itself does not ask survey respondents about taxes paid or refundable credits received in the prior year. That information—important for determining a family’s or an individual’s SPM poverty status—must be estimated. This report uses estimates from the TRIM microsimulation model for these estimates. The Census Bureau uses a different microsimulation model in its reports on SPM poverty.45
The TRIM3 Microsimulation Model Microsimulation models of tax and transfer programs are composed of computer code that mimics the rules of the tax code and benefit programs. The models determine whether an individual, family, or other unit is eligible to be subject to a tax or eligible for a benefit and then estimate the amount of the tax (or benefit). TRIM assumes that all taxpayers fully comply with the requirements and rules of the tax code.
Federal Income Tax Module for 2017 TRIM3 applies policy rules in effect during the year to the population for that year.46 The estimates in this report use information from the TRIM3 federal income tax module for 2017. The 2017 federal income tax module makes “baseline estimates” of the tax code as it existed for 2017. The model uses data from the ASEC’s information on family structure at the time of the survey to place individuals into federal tax filing units (e.g., taxpayer and, for those married filing jointly, the spouse). It also identifies “extended” tax filing units, which include dependents, and identifies “qualifying children” for the purpose of the EITC and the child tax credit. TRIM3 creates tax units not only for tax filers, but also for all potential filers. The model then uses information on the earnings and other income sources reported on the ASEC for 2017 to determine a tax filing unit’s federal income tax liability.
Additionally, expense and income items not available on the ASEC but required to compute federal income taxes were obtained through a statistical match with the IRS Statistics of Income Public Use File, which is based on a sample of tax returns. TRIM3 estimates of the elderly and disabled tax credit and the child and dependent care tax credit are aligned to target amounts based on IRS data.
In terms of estimating federal income taxes, there are a number of caveats and limitations of the TRIM3 estimates. These limitations are not idiosyncratic to TRIM3 estimates. They generally result from limitations on the underlying ASEC data and are also present in estimates from the Census Bureau. These limitations include the following:
While ASEC does not ask questions about federal taxes of its respondents, TRIM3 uses respondents’ self-reported information on household and family composition to place people within that household into tax filing units. Misreporting of household and family composition information might affect the accuracy of the tax information estimated from TRIM3. Misreporting of income that is used in the tax calculation would also affect the estimates in this report.
45 For a discussion of different methods of simulating taxes based on ASEC data, see Laura Wheaton and Kathryn Stevens, The Effect of Different Tax Calculators on the Supplemental Poverty Measure, Urban Institute, April 2016.
46 TRIM3 is able to simulate policies affecting in-kind transfer programs such as Supplemental Nutrition for Needy Families (SNAP), cash transfer programs such as Supplemental Security Income (SSI), health insurance programs such as Medicaid, and taxes. For a description of TRIM3, see Urban Institute, “The Transfer Income Model TRIM, at https://www.urban.org/research/data-methods/data-analysis/quantitative-data-analysis/microsimulation/transfer-income-model-trim. See http://trim3.urban.org/T3Welcome.php for the TRIM3 website.
Congressional Research Service
28
The Impact of the Federal Income Tax Code on Poverty
Estimates are not reliable for very-high-income taxpayers. The estimates of
federal income tax liability are not likely to be reliable for very-high-income taxpayers because the ASEC oversamples lower-income populations, rather than higher-income populations. Thus, TRIM3/ASEC estimates are most often used in reports (such as this report) that focus on lower-income populations.
Amounts of refundable tax credits tend to be underestimated. The estimates from
TRIM3 (as well as the Census Bureau’s microsimulation model) underestimate refundable tax credits. For example, the TRIM3 estimate of the EITC for 2017 (pre-TCJA) was $38.9 billion. The total amount of the EITC claimed in 2017 according to the IRS was $66.4 billion.47 This discrepancy has long been known by researchers, but has yet to be fully explained. Potential reasons for the discrepancy include the information on the ASEC family structure perhaps not adequately representing that used for filing tax returns; the underreporting of certain forms of earnings (such as self-employment earnings); and the high rates of error made by taxpayers claiming the EITC.48
A Revised Federal Income Tax Module for Estimating Rules Under the TCJA The Urban Institute, in partnership with the Congressional Research Service (CRS), modified TRIM3’s federal income tax module to account for the major provisions of the TCJA affecting individual taxpayers. Thus, the information in the model was revised to reflect the new tax brackets and marginal tax rates that apply to them, the suspension of the personal exemption and the increases in the standard deduction, limitations on itemized deductions, including the limitation on the deductibility of
state and local taxes (SALT),
revised rules for the child tax credit, and other changes to the federal individual income tax code.
TCJA Changes Not Modeled
A number of changes to the federal income tax were not modeled. These include changes to the treatment of alimony, the mortgage interest deduction, and elimination of the individual mandate for health insurance. The treatment of alimony was not modeled because the changes will apply only to new or revised orders and will not affect many cases in the near term.49 Limits on interest qualifying for the mortgage interest deduction were not modeled because there are no data to inform the impact of these changes.50 Additionally, certain smaller changes are not present in the simulation, such as the elimination of the deduction for bicycle commuting.51
47 See IRS Statistics of Income (SOI) Table 2.5, at https://www.irs.gov/statistics/soi-tax-stats-individual-statistical-tables-by-size-of-adjusted-gross-income.
48 For more information, see Austin Nichols and Jesse Rothstein, “Chapter 2: The Earned Income Tax Credit,” in Economics of Means-Tested Transfer Programs in the United States, ed. Robert A. Moffitt, vol. 1 (2016).
49 Email from Senior Fellow at the Urban Institute, November 14, 2018. 50 Email from Senior Fellow at the Urban Institute, November 14, 2018. 51 Email from Senior Fellow at the Urban Institute, November 14, 2018.
Congressional Research Service
29
link to page 35 link to page 36 The Impact of the Federal Income Tax Code on Poverty
Inflation Adjustment
The post-TCJA tax code parameters were deflated to 2017 dollars to answer the question, “What if the 2018 TCJA parameters were in place in 2017 and 2017 was the first year of their enactment?” The adjustment was done using the chained Consumer Price Index for All Urban Consumers (C-CPI-U), because the TCJA requires the use of that price index rather than the CPI-U for future price adjustments. Specifically, the 2018 amounts were adjusted to 2017 dollars using the chained CPI; see Table B-1. Hence the estimates in this report reflect the impact of the post-TCJA tax code as if the first year of its enactment were 2017 (it actually went into effect in 2018).
Table B-1. Selected Post-TCJA Income Tax Provisions in 2018 and 2017 Dollars
2018 Parameter
2018 Parameter
in 2018 Dollars
in 2017 Dollarsa
Starting Point (Lower Limit) of Marginal Tax Brackets by Tax Filing Status
Married Filing Jointly
10%
$0
$0
12%
19,050
18,632
22%
77,400
75,703
24%
165,000
161,383
32%
315,000
308,096
35%
400,000
391,233
37%
600,000
586,849
Head of Household
10%
0
0
12%
13,600
13,302
22%
51,800
50,665
24%
82,500
80,692
32%
157,500
154,048
35%
200,000
195,616
37%
500,000
489,041
Single
10%
0
0
12%
9,525
9,316
22%
38,700
37,852
24%
82,500
80,692
32%
157,500
154,048
35%
200,000
195,616
37%
500,000
489,041
Standard Deduction by Filing Status
Married Filing Jointly
24,000
23,474
Congressional Research Service
30
link to page 36 The Impact of the Federal Income Tax Code on Poverty
2018 Parameter
2018 Parameter
in 2018 Dollars
in 2017 Dollarsa
Head of Household
18,000
17,605
Single
12,000
11,737
Other Major Provisions
Child Credit Amount
2,000
1,956
Maximum ACTC
1,400
1,369
ACTC Refundability Threshold
2,500
2,445
Source: CRS, U.S. Department of Labor, Bureau of Labor Statistics, and the Internal Revenue Code. a. These adjustments do not reflect the statutory inflation adjustment of these tax provisions. Instead, they
reflect the actual 2018 dol ars levels’ purchasing power in 2017 dol ars.
The Supplemental Poverty Measure The SPM was created to address some of the limitations of the official poverty measure.52 Particularly relevant for this analysis, the official poverty measure does not take into account taxes (and tax benefits, like refundable credits) and their impact on disposable income. It also does not take into account certain noncash government benefits, such as food benefits from SNAP or the value of housing benefits.
The measure of total income in this analysis is computed similarly to the way the U.S. Census Bureau computes total financial resources, though there are a few differences. This analysis uses the TRIM3 estimates for TANF, SSI, and SNAP, rather than amounts reported on the ASEC, to address the underreporting of these income sources on the ASEC. Additionally, the measure of child care—deducted as a work expense for the SPM—differs. This analysis uses TRIM3’s estimate of child care expenses, which includes estimated copayments for families receiving child care subsidies from the Child Care and Development Block Grant (CCDBG). The Census Bureau also caps child care expenses at the earnings of the lower-earning parent when determining net financial resources. This analysis deducts all child care expenses as a work-related expense of the family.
52 The official federal poverty measure and the Supplemental Poverty Measure (SPM) differ in key ways that may affect poverty estimates. Specifically, “[t]he measures differ in their definitions of the following: Need, as it is used in the thresholds (the dollar amounts used to determine poverty status). Unlike the official measure, the SPM’s measure of need is geographically adjusted based on housing costs by metropolitan area or by state for nonmetropolitan areas. Furthermore, three sets of SPM thresholds are computed by the housing status of a family—as homeowners with a mortgage, homeowners without a mortgage, or renters—to reflect differences in housing costs. Thus, while the official poverty measure uses 48 poverty thresholds to represent families’ needs, the SPM uses thousands. Financial resources that are considered relevant for comparing against the measure of need as specified in the thresholds. Financial resources to meet needs, whether in the SPM or the official measure, are based on the sum of income of all family members. While the official measure uses money income before taxes, the SPM makes additional adjustments and considers a wider range of resources [including tax credit and in-kind benefits]. Family, for the purpose of assigning thresholds and counting resources. The SPM uses an updated approach to more explicitly take account of how household members share resources based on their relationships, which the Census Bureau’s definition of ‘family’ (used in the official measure) does not capture completely.” For more information on these differences, see Table 1 in CRS Report R45031, The Supplemental Poverty Measure: Its Core Concepts, Development, and Use.
Congressional Research Service
31
link to page 15 link to page 17 link to page 32 link to page 15 The Impact of the Federal Income Tax Code on Poverty
Appendix C. Estimated Number of Individuals and Families in Poverty Before the Income Tax, 2017 Below are estimates of the number of individuals in poverty before the federal income taxes are subtracted from (or added to) financial resources using the TRIM3 microsimulation model. The individual types used in this table are also found in Table 1 and Table 2 of this report.
Table C-1. Estimated Number of Individuals in Poverty Before the Income Tax for
Selected Individuals Living in Families With and Without Workers, 2017
Number in
poverty
Individuals by Family Type
(mil ions)
All Individuals Living in Families of All Types
47.5
Children
13.5
Nonaged Adults in Families with Children
12.0
Individuals Living in Families with Workers
29.5
Children
10.7
Nonaged Adults in Families with Children
9.8
Individuals Living in Families with No Workers
17.4
Children
2.8
Nonaged Adults in Families with Children
2.2
Source: CRS estimates using TRIM3 and the ASEC 2018. See Appendix B. Notes: Poverty status is determined using the SPM. Children are under 18 years old. An aged adult is 65 years old and older. A family with workers is a family that includes at least one worker. Workers are individuals 18 years and older who work at least one week during the year. Numbers are rounded to the nearest hundred thousand.
Below are estimates of the number of families in poverty before federal income taxes are subtracted from (or added to) financial resources, estimated using the TRIM3 microsimulation model. The family types used in this table are also found in Table 1 of this report.
Congressional Research Service
32
link to page 32 The Impact of the Federal Income Tax Code on Poverty
Table C-2. Estimated Number of Families in Poverty Before the Income Tax by
Family Type, 2017
Number
in
poverty
Family Type
(mil ions)
All Poor Families
21.8
Poor Families with Children
6.4
With Workers
5.0
With No Workers
1.5
Poor Families with Aged Adults
5.6
Poor Families without Children or Aged Adults
9.8
Source: CRS estimates using TRIM3 and the ASEC 2018. See Appendix B. Notes: Poverty status is determined using the SPM. Families with children are families with or without an aged (i.e., elderly, or 65 years old and older) member who have at least one child. Families with no children or an
aged member are as described. Families with aged adults are families with aged adults and no children. Children
are under 18 years old. A family with workers is a family that includes at least one worker. Workers are individuals 18 years and older who work at least one week during the year. Numbers are rounded to the nearest hundred thousand.
Author Information
Margot L. Crandall-Hollick
Jameson A. Carter
Acting Section Research Manager
Research Assistant
Gene Falk
Specialist in Social Policy
Acknowledgments
Molly Sherlock, Specialist in Public Finance, Government and Finance Division, provided invaluable feedback, guidance, and editorial comments on this report.
Congressional Research Service
33
The Impact of the Federal Income Tax Code on Poverty
Disclaimer
This document was prepared by the Congressional Research Service (CRS). CRS serves as nonpartisan shared staff to congressional committees and Members of Congress. It operates solely at the behest of and under the direction of Congress. Information in a CRS Report should not be relied upon for purposes other than public understanding of information that has been provided by CRS to Members of Congress in connection with CRS’s institutional role. CRS Reports, as a work of the United States Government, are not subject to copyright protection in the United States. Any CRS Report may be reproduced and distributed in its entirety without permission from CRS. However, as a CRS Report may include copyrighted images or material from a third party, you may need to obtain the permission of the copyright holder if you wish to copy or otherwise use copyrighted material.
Congressional Research Service
R45971 · VERSION 3 · UPDATED
34 rate may become subject to higher marginal rates.
Author Contact Information
Acknowledgments
Molly Sherlock, Specialist in Public Finance, Government and Finance Division, provided invaluable feedback, guidance, and editorial comments on this report.
Footnotes
| 1. |
The principle that poor families should not owe federal income taxes can be found in the enactment of the Tax Reform Act of 1986 (P.L. 99-514). The Joint Committee on Taxation, in its explanation of the act, stated: "In addition to ensuring that high-income taxpayers pay their share of the Federal tax burden, the Act provides tax relief to low-and middle-income wage earners. To achieve this goal, the Act substantially increases the standard deduction (the prior-law zero bracket amount) and almost doubles the personal exemption. Together with the greatly expanded earned income credit, these provisions relieve approximately six million low-income individuals from income tax liability and ensure that no families below the poverty level will have Federal income tax liability." Joint Committee on Taxation, General Explanation of the Tax Reform Act of 1986, committee print, 99th Cong., May 4, 1987, JCS-10-87, p. 8. |
| 2. |
For example, see CRS Report R44057, The Earned Income Tax Credit (EITC): An Economic Analysis. |
| 3. |
The original title of the law, the Tax Cuts and Jobs Act, was stricken before final passage because it violated what is known as the Byrd rule, a procedural rule that can be raised in the Senate when bills, like the tax bill, are considered under the process of reconciliation. The actual title of the law is "To provide for reconciliation pursuant to titles II and V of the concurrent resolution on the budget for fiscal year 2018." For more information on the Byrd rule, see CRS Report RL30862, The Budget Reconciliation Process: The Senate's "Byrd Rule." |
| 4. |
Most of the changes that affect individuals are temporary. The temporary changes are generally scheduled to be in effect from 2018 through the end of 2025. For an overview of all changes made in the law, see CRS Report R45092, The 2017 Tax Revision (P.L. 115-97): Comparison to 2017 Tax Law. |
| 5. |
For example, the Joint Committee on Taxation found in 2019 that on average, the law would reduce income taxes for all taxpayers, although to a greater extent for higher-income taxpayers. See Joint Committee on Taxation, Distributional Effects of the Conference Agreement for H.R.1, the "Tax Cuts and Jobs Act," 115th Cong., December 18, 2017. Similarly, the Tax Policy Center found that the TCJA increased after-tax income in 2018 by 0.4% for households in the lowest quintile, compared with 2.9% for those in the top quintile and even more for the top few percent of households. For more information, see Tax Policy Center, Distributional Analysis of the Conference Agreement for the Tax Cuts and Jobs Act, December 18, 2017. |
| 6. |
The bill would expand the EITC for workers without qualifying children, commonly referred to as the "childless" EITC. While some workers eligible for this credit may indeed have no children, others may have children that do not reside with them for more than half the year, and others may live with children that for various reasons they cannot claim for the EITC (e.g., an individual living with but not married to a mother with children from another relationship). |
| 7. |
Under current law the ACTC phases in for low-income taxpayers based on their earned income, and the maximum amount of the ACTC is $1,400 per qualifying child. Under H.R. 3300, the earned income phase-in of the credit is effectively eliminated in 2019 and 2020, and hence all eligible low-income taxpayers with children would be able to receive $2,000 per qualifying child ($3,000 for a child under four years old) for those years. The $3,000 credit for children under four years old was added as an amendment during the Ways and Means Committee's consideration of H.R. 3300. This amendment passed by a roll call vote of 22 yeas to 19 nays in the committee. For more information, see House Committee on Ways and Means, Markup of Tax Legislation, 116th Cong., 1st sess., June 20, 2019, https://waysandmeans.house.gov/legislation/markups/markup-hr-3298-child-care-quality-and-access-act-2019-hr-3299-promoting-respect. |
| 8. |
The official federal poverty measure and the Supplemental Poverty Measure (SPM) differ in key ways that may affect poverty estimates. Specifically, "[t]he measures differ in their definitions of the following: Need, as it is used in the thresholds (the dollar amounts used to determine poverty status). Unlike the official measure, the SPM's measure of need is geographically adjusted based on housing costs by metropolitan area or by state for nonmetropolitan areas. Furthermore, three sets of SPM thresholds are computed by the housing status of a family—as homeowners with a mortgage, homeowners without a mortgage, or renters—to reflect differences in housing costs. Thus, while the official poverty measure uses 48 poverty thresholds to represent families' needs, the SPM uses thousands. Financial resources that are considered relevant for comparing against the measure of need as specified in the thresholds. Financial resources to meet needs, whether in the SPM or the official measure, are based on the sum of income of all family members. While the official measure uses money income before taxes, the SPM makes additional adjustments and considers a wider range of resources [including tax credit and in-kind benefits]. Family, for the purpose of assigning thresholds and counting resources. The SPM uses an updated approach to more explicitly take account of how household members share resources based on their relationships, which the Census Bureau's definition of "family" (used in the official measure) does not capture completely." For more information on these differences, see Table 1 in CRS Report R45031, The Supplemental Poverty Measure: Its Core Concepts, Development, and Use. |
| 9. |
In addition, state income tax liabilities are assumed to be unchanged in the TRIM3 model between the pre- and post-TCJA tax codes. In reality, for some taxpayers, changes made to the federal income tax code by the TCJA may affect their state income tax liabilities. See Richard C. Auxier and Elaine Maag, Post-TCJA, Your State Should Consider a Refundable Child Tax Credit, Tax Policy Center, November 15, 2018, at https://www.taxpolicycenter.org/taxvox/post-tcja-your-state-should-consider-refundable-child-tax-credit. |
| 10. |
By definition, the value of a refundable tax credit received can be greater than a taxpayer's income tax liability. For example, if a taxpayer has a $1,000 income tax liability, but is eligible to receive $3,000 in refundable tax credits, those credits will first reduce their income tax liability to zero and they will receive a net benefit of $2,000. In other words, the taxpayer will have a negative tax liability of $2,000. |
| 11. |
For an overview of the tax system before the TCJA, see CRS Report R45053, The Federal Tax System for the 2017 Tax Year. |
| 12. |
For an overview of all the changes in the tax code made by the TCJA, see CRS Report R45092, The 2017 Tax Revision (P.L. 115-97): Comparison to 2017 Tax Law. |
| 13. |
Unmarried taxpayers without any dependent children generally file their federal income taxes as "single"; unmarried taxpayers with dependent children generally file as "head of household"; married taxpayers, irrespective of whether they have children or how many children they have, generally file as "married filing jointly." |
| 14. |
Tax Policy Center, Tax Policy Center Briefing Book: Key Elements of the U.S. Tax System, "What Is the Difference Between Refundable and Nonrefundable Credits?" 2016, https://www.taxpolicycenter.org/briefing-book/what-difference-between-refundable-and-nonrefundable-credits. |
| 15. |
Refundable credits are first applied toward any income tax liability, with the remainder received as part of the taxpayer's refund. |
| 16. |
Some low-income taxpayers will receive both the ACTC and the nonrefundable portion of the child tax credit. The sum of the ACTC and the nonrefundable child tax credit cannot exceed the maximum credit per child. |
| 17. |
See IRS Revenue Procedure 17-58. |
| 18. |
The TCJA changed the price index used to adjust tax provisions for inflation from the Consumer Price Index for All Urban Consumers (CPI-U) to a "chained" version of that price index, the C-CPI-U. This change mostly affects how tax provisions are adjusted for inflation after 2018. However, for the EITC, it also affects how its parameters are adjusted for past inflation. The effect of the change to the C-CPI-U for past inflation in the EITC reduced the 2018 maximum amount of the credit by $1 for recipients with no children, $7 for recipients with one child, $12 for those with two children, and $13 for those with three or more children. See IRS Revenue Procedure 2018-18. |
| 19. |
For example, the Tax Policy Center estimated that 80.4% of all taxpayers would receive a tax cut in 2018 as a result of the TCJA averaging $2,140. The lowest-income taxpayers receiving a tax cut would see their taxes fall by $130 on average. TPC also estimated that 4.8% of all taxpayers would see their taxes increased under the law in 2018. The lowest-income taxpayers with a tax increase would see their taxes rise by $810 on average. See Table 4 in Tax Policy Center, Distributional Analysis of the Conference Agreement for the Tax Cuts and Jobs Act, December 18, 2017, https://www.taxpolicycenter.org/publications/distributional-analysis-conference-agreement-tax-cuts-and-jobs-act/full. |
| 20. |
Mathematically, the percentage reduction in poverty rates equals the percentage reduction in the number of individuals in poverty. An example can help to illustrate this point. Assume there are 100 people and 11 are poor. The poverty rate is 11/100=11%. Assume a policy B reduces poverty so now 7 of the 100 people are poor. In other words, 4 fewer people are poor. The poverty rate is now 7%. The percentage change in the poverty rate is ((7/100)-(11/100))/(11/100)=-36%. This also equals the percentage change in the number of people who are poor since ((7/100)-(11/100))/(11/100)=(7-11)/100 * 100/11=-4/11=-36%. |
| 21. |
The reduction in the share of families with children with a negative income tax liability as a result of the TCJA could have occurred for a variety of reasons, including the new temporary requirement that taxpayers provide the Social Security number (SSN) for the children for whom they claim the child tax credit. Prior to this temporary change enacted under the TCJA, taxpayers claiming the credit were required to provide a taxpayer ID for the child, but the statute did not require that that ID had to be an SSN. Hence, prior to the TCJA, taxpayers with qualifying children that had individual taxpayer identification numbers (ITINs) could also claim the credit for those children. As a result of the SSN requirement enacted as part of the TCJA, families with children who do not have SSNs are not eligible to claim the child tax credit. For more information about ITINs and SSNs as taxpayer ID numbers, see CRS Report R43840, Federal Income Taxes and Noncitizens: Frequently Asked Questions. |
| 22. |
For the purposes of this analysis, the estimated percentage-point reduction in poverty rates is calculated for each benefit program in isolation, assuming all other benefit programs are in effect. |
| 23. |
For more information on these programs, see CRS Report R42505, Supplemental Nutrition Assistance Program (SNAP): A Primer on Eligibility and Benefits; CRS Report R44948, Social Security Disability Insurance (SSDI) and Supplemental Security Income (SSI): Eligibility, Benefits, and Financing; CRS Report RL34591, Overview of Federal Housing Assistance Programs and Policy; and CRS Report RL32748, The Temporary Assistance for Needy Families (TANF) Block Grant: A Primer on TANF Financing and Federal Requirements. |
| 24. |
For the purposes of this analysis, the estimated reduction in the aggregate poverty gap is calculated for each benefit program in isolation, assuming all other benefit programs are in effect. |
| 25. |
Based on annual income measured before taxes and transfers, 13% of EITC and 11% of recipients of the ACTC had incomes of less than half of the SPM poverty threshold in 2016. On the other hand, 47% of TANF recipients, 37% of SSI recipients, 46% of housing assistance recipients, and 30% of SNAP recipients had annual income measured before taxes and transfers of less than half the SPM poverty threshold in 2016. |
| 26. |
Among children who were poor, two-thirds lived in families with one or more earners. For more information, see CRS Report R44698, Demographic and Social Characteristics of Persons in Poverty: 2015. |
| 27. |
Among working-aged adults (aged 18 to 64 years old), 11.6% were poor. Among the subset of working-aged adults who worked full or part time, 5.8% were in poverty. Among the subset of working-aged adults who did not or could not work, 30.5% were in poverty. U.S. Census Bureau, Income and Poverty in the United States: 2017, "Table 3. People and Families in Poverty by Selected Characteristics: 2016 and 2017," September 12, 2018, at https://www.census.gov/library/publications/2018/demo/p60-263.html. Another perspective provides a similar insight. Among working-aged adults in poverty, over 60% of them in 2015 did not or could not work. For more information, see CRS Report R44698, Demographic and Social Characteristics of Persons in Poverty: 2015. |
| 28. |
The National Academies of Sciences, Engineering, and Medicine, A Roadmap to Reducing Child Poverty, 2019, at https://sites.nationalacademies.org/DBASSE/BCYF/Reducing_Child_Poverty/index.htm. |
| 29. |
For an overview of these challenges, see CRS Report R43873, The Earned Income Tax Credit (EITC): Administrative and Compliance Challenges; and IRS Taxpayer Advocate Service, Objectives Report to Congress Fiscal Year 2020: Volume 3, Earned Income Tax Credit, at https://taxpayeradvocate.irs.gov/reports/fy-2020-objectives-report-to-congress/volume-3. |
| 30. |
In its FY2018 Annual Financial Report, the Department of the Treasury stated, "Treasury and IRS analyses, as well as audits by the Government Accountability Office (GAO) and Treasury Inspector General for Tax Administration (TIGTA), have consistently found that payment errors for EITC and other tax credit programs are largely attributable to the statutory design and complexity of the credits within the tax system, and not rooted in internal control weaknesses, financial management or financial reporting deficiencies." Department of the Treasury, Agency Financial Report Fiscal Year 2018, 2018, p. 150, at https://home.treasury.gov/about/budget-financial-reporting-planning-and-performance/agency-financial-report. |
| 31. |
In his proposal for a universal EITC, Len Burman discusses some of the political reasons why work-based refundable tax credits remain a popular policy tool. He writes, "Political scientists have found ample evidence that people all over the world categorize people in terms of 'deservedness.'"… Most people are willing to help someone who is unlucky but are less eager to support someone who they perceive as lazy.… The deservingness heuristic explains why the largest refundable tax credits are tied to work, children, health or schooling, and it helps explain the growing prevalence of work requirements in means-tested transfer programs." Leonard E. Burman, A Universal EITC: Sharing the Gains from Economic Growth, Encouraging Work, and Supporting Families, Tax Policy Center, May 20, 2019, p. 10, at https://www.taxpolicycenter.org/publications/universal-eitc-sharing-gains-economic-growth-encouraging-work-and-supporting-families/full. |
| 32. |
Other legislative proposals in the 116th Congress that would increase the amounts of refundable tax credit include H.R. 3507, H.R. 1560, H.R. 1431, and S. 1138. |
| 33. |
Chairman Neal's press release for H.R. 3300 was titled, "Neal introduces pro-worker, pro-family tax legislation" and stated that H.R. 3300 is "legislation that helps families afford child care, encourages work, stimulates local economies, and provides significant tax relief for working- and middle-class families." Ways and Means Committee, "Neal Introduces Pro-Worker, Pro-Family Tax Relief Legislation," press release, June 18, 2019, at https://waysandmeans.house.gov/media-center/press-releases/neal-introduces-pro-worker-pro-family-tax-relief-legislation. |
| 34. |
The ASEC is a supplement to the monthly Current Population Survey that is used to produce labor force statistics such as monthly labor force participation, employment, and unemployment statistics. The ASEC supplement is conducted on the entire sample interviewed in March of each year, plus one-fourth of the sample interviewed in February and one-fourth of the sample interviewed in April of each year. |
| 35. |
The noninstitutionalized population excludes those persons residing in institutional group quarters such as adult correctional facilities, juvenile facilities, skilled-nursing facilities, and other institutional facilities such as mental (psychiatric) hospitals and in-patient hospice facilities. The noninstitutionalized population includes members of the Armed Forces living in civilian housing units on a military base or in a household not on a military base. |
| 36. |
Statistical theory provides a way to quantify the "sampling error" that comes from using information from a sample rather than the entire population. However, Census household surveys also have inherent "nonsampling error" that comes, for example, from respondents not accurately answering certain questions on the survey. Nonsampling error cannot be quantified. Additionally, the use of microsimulation adds to the uncertainty of the estimates. Microsimulation models—like all models—are simplifications and do not account for all the complexity of what they attempt to model. The error, or uncertainty, of the estimates of the microsimulation model cannot be quantified with statistical theory. Thus, because major sources of the uncertainty of the estimates in this report cannot be quantified, this report does not report measures of uncertainty or error (such as standard errors), as they would likely understate the true amount of uncertainty in the estimates. |
| 37. |
If some respondents to the ASEC answered the questions inaccurately, it would affect the estimates in this report. While ASEC does not ask questions about federal taxes of its respondents, TRIM3 uses respondents' self-reported information on household and family composition to place people within that household into tax filing units. Misreporting of household and family composition information might affect the accuracy of the tax information estimated from TRIM3. Misreporting of income that is used in the tax calculation would also affect the estimates in this report. |
| 38. |
For a discussion of different methods of simulating taxes based on ASEC data, see Laura Wheaton and Kathryn Stevens, The Effect of Different Tax Calculators on the Supplemental Poverty Measure, Urban Institute, April 2016. |
| 39. |
TRIM3 is able to simulate policies affecting in-kind transfer programs such as Supplemental Nutrition for Needy Families (SNAP), cash transfer programs such as Supplemental Security Income (SSI), health insurance programs such as Medicaid, and taxes. For a description of TRIM3, see Urban Institute, "The Transfer Income Model TRIM, at https://www.urban.org/research/data-methods/data-analysis/quantitative-data-analysis/microsimulation/transfer-income-model-trim. See http://trim3.urban.org/T3Welcome.php for the TRIM3 website. |
| 40. |
See IRS Statistics of Income (SOI) Table 2.5, at https://www.irs.gov/statistics/soi-tax-stats-individual-statistical-tables-by-size-of-adjusted-gross-income. |
| 41. |
For more information, see Austin Nichols and Jesse Rothstein, "Chapter 2: The Earned Income Tax Credit," in Economics of Means-Tested Transfer Programs in the United States, ed. Robert A. Moffitt, vol. 1 (2016). |
| 42. |
Email from Senior Fellow at the Urban Institute, November 14, 2018. |
| 43. |
Email from Senior Fellow at the Urban Institute, November 14, 2018. |
| 44. |
Email from Senior Fellow at the Urban Institute, November 14, 2018. |
| 45. |
The personal exemption is a fixed dollar amount that taxpayers subtract for each individual on their income tax return (so a husband and wife with two kids would generally claim four personal exemptions). Prior to the TCJA, the personal exemption was $4,150 (so a family of four could subtract from their income $16,600). |
| 46. |
A taxpayer having income above the tax entry point does not necessarily mean that taxpayer will have a positive income tax liability. The taxpayer may also receive tax credits, including the EITC or child tax credit, that offset any tax liability associated with having income above the tax entry point. |
| 47. |
For more information on the mechanics of marginal tax rates, see CRS Insight IN11015, The Federal Income Tax: How Do Marginal Income Tax Rates Work?, by Margot L. Crandall-Hollick. |
| 48. |
The 10% bracket applies to the first $9,525 of taxable income for unmarried individuals with no dependents, $13,600 for unmarried taxpayers with dependents, and $13,000 for married couples who file jointly. The second-lowest tax rate was 15% prior to TCJA and was reduced to 12% by TCJA. The second-lowest bracket applies to income above $9,525 up to $38,700 for unmarried individuals with no dependents, above $13,600 up to $51,800 for unmarried taxpayers with dependents, and above $19,050 up to $77,400 for married couples who file jointly. |
| 49. |
For more information, see CRS Report R44420, Individual Taxpayer Identification Number (ITIN) Filers and the Child Tax Credit: Overview and Legislation. |
| 50. |
Testimony of Jeffrey Kling, Associate Director for Economic Analysis, Congressional Budget Office, in U.S. Congress, House Committee on Ways and Means, Subcommittee on Social Security, Using the Chained CPI to Index Social Security, Other Federal Programs, and the Tax Code for Inflation, 113th Cong., April 18, 2013. |