Budget Issues That Shaped the 2018 Farm Bill
Changes from December 6, 2018 to February 28, 2019
This page shows textual changes in the document between the two versions indicated in the dates above. Textual matter removed in the later version is indicated with red strikethrough and textual matter added in the later version is indicated with blue.
Contents
- Farm
Bill Status FarmBills from a Budget Perspective- Recent Historical Perspective
- Types of Spending Authorizations
- Summary of Projected Outlays in the 2018 Farm Bill
Importance of Baseline to the Farm Bill- Development of the Baseline
- April 2018 CBO Baseline
- Programs Without Baseline
- Scores of the 2018 Farm Bill
Proposals Summaries of the House- and Senate-Passed BillSummary of Title-Level Scores- Net Increases in Five-Year Outlays Are Followed by Net Decreases
- Section-by-Section Scores for Some Titles Exceed Their Net Scores
- Outcome for the Programs Without Baseline
- Authorizations for Discretionary Appropriation
Figures
- Figure 1.
CBO Baseline for Farm Bill Titles - Figure 2. CBO Baseline for USDA Agriculture Programs
- Figure 3. 2014 Farm Bill Programs Without a Budget Baseline After FY2018
Figure 4. CBO Scores of the House-Passed and Senate-Passed Farm Bills, byProjected Outlays in the Agriculture Improvement Act of 2018, by Title- Figure 2. Projected Agriculture Outlays in the Agriculture Improvement Act of 2018
- Figure 3. CBO Scores of the House, Senate, and Enacted 2018 Farm Bills, by Title
Figure 4. CBO Score of Enacted 2018 Farm Bill, by Period and Title- Figure 5. CBO Score of House-Passed H.R. 2, by Period and Title
- Figure 6. CBO Score of the Senate-Passed Amendment to H.R. 2, by Period and Title
- Figure 7. CBO Score of Enacted 2018 Farm Bill, by Section and Title Figure 8. CBO Score of House-Passed H.R. 2, by Section and Title
- Figure
89. CBO Score of Senate-Passed Amendment to H.R. 2, by Section and Title - Figure 10. Actual and Projected Spending by Major Farm Bill Mandatory Programs
Tables
- Table 1. Budget for
athe 2018 Farm Bill: Baselineand, Scores,by Titleand Projected Outlays
- Table 2. CBO Baseline
forto Develop the 2018 Farm Bill, by Title and Program - Table 3. CBO Score of the Agriculture Improvement Act of 2018, as Enacted, by Section
- Table 4. Projected Outlays Under the Agriculture Improvement Act of 2018, at Enactment, by Title and Program
Table A-1. CBO Score of House-Passed H.R. 2, by Section - Table
4A-2. CBO Score of the Senate-Passed Amendment to H.R. 2, by Section - Table
5B-1. Farm Bill Authorizations That Are Subject to Appropriation
Summary
The farm bill is an omnibus, Budget for the 2018 Farm Bill (dollars in millions, FY2019-FY2023, mandatory outlays) Farm bill titles April 2018 baseline Score of P.L. 115-334 Projected outlays at enactmentmulti-yearmultiyear law that governs an array of agricultural and food programs. The farm bill has typically undergone reauthorization about every five years. The current farm bill—the Agriculture Improvement Act of 2018 (P.L. 115-334), often called the "2018 farm bill"—was enacted in December 2018 and expires in 2023.
law that governs an array of agricultural and food programs. It provides an opportunity for policymakers to periodically address a broad range of agricultural and food issues. The farm bill has typically undergone reauthorization about every five years. The 115th Congress has considered a new farm bill but has not enacted one to date. Both the House and the Senate passed versions of a 2018 farm bill (H.R. 2) in June 2018. Conference proceedings officially began in September 2018 but have not reached agreement.
The farm bill provides an opportunity for Congress to choose how much support, if any, to provide for various agriculture and nutrition programs and how to allocate it among competing constituencies. Under congressional budgeting rules, many programs are assumed to continue beyond the end of a farm bill. From a budgetary perspective, this provides funding to reauthorize programs, reallocate funding to other programs, or be taken for deficit reduction.
Budget for a 2018 Farm Bill (dollars in millions, FY2019-FY2028)
Source: CRS, compiled using the CBO Baseline by Title (unpublished; April 2018), | ||||||||||||||||||||||||||||||||||||||||||||||||||||||||||||||||||||
The farm bill provides an opportunity for Congress to choose how much support, if any, to provide for various agriculture and nutrition programs and how to allocate it among competing constituencies. Under congressional budgeting rules, many programs are assumed to continue beyond the end of a farm bill. From a budgetary perspective, this provides a baseline for comparing future spending reauthorizations, reallocations to other programs, and reductions to projected spending. Since 2000, congressional goals for the farm bill's budget have varied: The 2002 farm bill increased spending over 10 years, the 2008 farm bill was essentially budget neutral, the 2014 farm bill reduced spending, and the 2018 farm bill is budget neutral, according to the Congressional Budget Office (CBO). The farm bill authorizes programs in two spending categories: mandatory spending and discretionary spending. Mandatory spending is not only authorized but also actually provided via budget enforcement rules. Discretionary spending may be authorized in a farm bill but is not actually provided until budget decisions are made in a future annual appropriations act.The farm bill authorizes programs in two spending categories: mandatory spending and discretionary spending. The Congressional Budget Office (CBO)and the CBO cost estimate of the conference agreement for H.R. 2 (December 11, 2018).
scorescore) is measured in relation to the baseline. Changes that increase spending relative to the baseline have a positive score; those that decrease spending relative to the baseline have a negative score. Federal budget rules such as "PayGo" may require budgetary offsets to balance new spending so that there is no increase in the federal deficit. Discretionary spending may be authorized in a farm bill but is not actually provided until budget decisions are made in a future annual appropriations act.
Since 2000, farm bill budgets have varied: The 2002 farm bill increased overall spending, the 2008 farm bill was essentially budget neutral, the 2014 farm bill reduced spending, and the 2018 farm bill is projected to be essentially budget neutral.
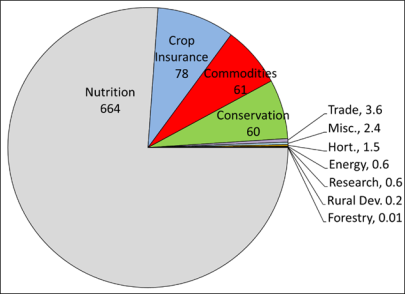
The April 2018 CBO baseline for farm bill programs, used as the official benchmark in 2018, contains $867 billion over FY2019-FY2028—77% of which stems from the nutrition title ($664 billion) and its largest program, the Supplemental Nutrition Assistance Program. The remaining $203 billion baseline is for agricultural programs, mostly in crop insurance, farm commodity programs, and conservation. Other titles of the farm bill contribute about 1% of the baseline, some of which are funded primarily with discretionary spending.
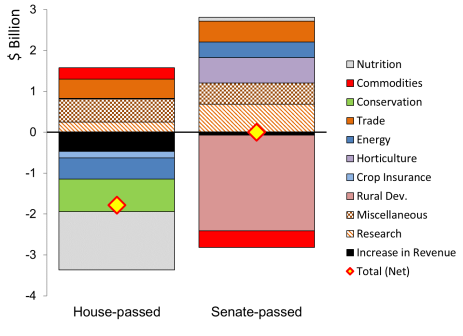
The budgetary impact of the 2018 farm bill proposals are measured relative to the CBO baseline—that is, what the 2014 farm bill (current law) would have spent had it continued. Relative to the baseline, the House-passed bill would reduce federal outlays by $1.8 billion over 10 years (-0.2%), and the Senate-passed bill would remain budget neutral (+0%) over the same 10-year period. These overall relatively small scores are the net result of sometimes relatively larger increases and reductions across individual titles. Some of the overall scores within a single title of the farm bill are the net result of sometimes large changes in individual programs that may reflect changes in the direction of policy.
- The House bill would achieve its overall 10-year net reduction primarily by reducing net outlays in four titles (Nutrition, Conservation, Energy, and Crop Insurance). It would increase spending by less than the total of these reductions across five other titles (Miscellaneous, Trade, Commodities, Research, and Horticulture). The Nutrition title has provisions that sum to a $22 billion reduction over 10 years (including those for work requirements) and provisions that would add to $20.6 billion in increased spending. Similarly, the Conservation title has provisions that sum to a $12.6 billion reduction (including repealing the Conservation Stewardship Program), as well as provisions that add spending totaling $11.8 billion.
- The Senate bill would achieve a budget-neutral outcome by reducing net spending primarily in the Rural Development title but also in the Commodities and Crop Insurance titles. It would increase spending across seven titles (Research, Horticulture, Miscellaneous, Trade, Energy, Nutrition, and Forestry).
For some of the programs without baseline, both the House-passed and the Senate-passed bills would provide continuing funding and, in some cases, permanent baseline.
The farm bill is an omnibus, multi-year law that governs an array of agricultural and food programs. It provides an opportunity for policymakers to periodically address a broad range of agricultural and food issues. The farm bill has typically undergone reauthorization about every five years.1
From its beginning in the 1930s, farm bills have focused primarily on farm commodity programs to support a handful of staple commodities—corn, soybeans, wheat, cotton, rice, dairy, and sugar. In recent decades, farm bills have expanded in scope to include a Nutrition title since 1973 and since then Conservation, Horticulture, Bioenergy, Credit, Research, and Rural Development titles, among others.
Recent farm bills have been subject to various procedural hurdles, such as insufficient votes to pass the House floor, presidential vetoes, or—as in the case of 2008 and 2014 farm bills—short-term extensions.2 The current farm bill (the Agricultural Act of 2014, P.L. 113-79) has many provisions that expire in 2018.3
Farm Bill Status
The 115th Congress has begun but not finished a new farm bill. An initial House vote on H.R. 2 (the Agriculture and Nutrition Act of 2018) in May 2018 failed by vote of 198-213, but floor procedures allowed that vote to be reconsidered, and it passed in June by a second vote of 213-211. The Senate passed its bill as an amendment to H.R. 2 (the Agriculture Improvement Act of 2018) in June 2018 by a vote of 86-11. Conference proceedings officially began on September 5, 2018, but have not reached agreement.4
Farm Bills from a Budget Perspective
The farm bill provides an opportunity for Congress to choose how much support to provide for agriculture and nutrition and how to allocate it among competing constituencies. Generally, farm bills authorize spending in two categories: mandatory and discretionary. From a budgetary perspective, many programs are assumed to continue beyond the end of a farm bill, even though their authorizations may expire. That projection—for certain mandatory programs as explained below—provides funding to reauthorize programs, reallocate funding to other programs, or take offsets for deficit reduction. For new programs, those without baseline, or discretionary programs, funding must come from other means.
|
Types of Spending Authorized in the Farm Bill Mandatory spending. A farm bill authorizes outlays and pays for them with multiyear budget estimates when the law is enacted. Budget enforcement is through "baseline" projections under current law, "scores" of the effect of proposed bills, and "PayGo" budget rules that may prevent deficit increases. (See CRS Report R44763, Present Trends and the Evolution of Mandatory Spending.) Discretionary authorizations. A farm bill establishes parameters for discretionary programs and authorizes them to receive funding in subsequent appropriations acts but does not provide or assure actual funding. Budget enforcement is through future appropriations and budget resolutions. (See CRS Report R42388, The Congressional Appropriations Process: An Introduction.) |
Recent farm bills have faced various budget situations, including spending more under a budget surplus, cutting spending for deficit reduction, and remaining basically budget neutral—with or without offsets. For example
The 2002 farm bill (the Farm Security and Rural Investment Act of 2002, P.L. 107-171) was enacted under a budget surplus that allowed it to make changes that were projected to increase spending by $73 billion over a 10-year budget window,The April 2018 CBO baseline was the official benchmark to measure changes made by the 2018 farm bill. The five-year baseline was $426 billion over FY2019-FY2023 (what the 2014 farm bill would have spent had it been continued). The budgetary impact of the 2018 farm bill is measured relative to that baseline. Among its impacts are these four points:
- 1. The enacted farm bill increases net outlays in the first five years by $1.8 billion, which is offset by the same amount of net reductions in outlays during the second five years. Therefore, over 10 years, the net impact is budget neutral.
- 2. Eight titles in the enacted law have increased outlays over the five-year period, including Farm Commodities, Conservation, Trade, Nutrition, Research, Energy, Horticulture, and Miscellaneous. Two of those titles—Conservation and Nutrition—have reductions in the second five years of the budget window that make them budget neutral over 10 years.
- 3. Most of the budget reductions at the title level that provide offsets for the increases above, especially in the 10-year budget window, are from changes in the rural development title.
- 4. The 2018 farm bill provides continuing funding and, in some cases, permanent baseline, for 23 of the 39 so-called programs without baseline from the 2014 farm bill.
Projected outlays for the 2018 farm bill at enactment are $428 billion over the FY2019-FY2023 five-year life of the act. The Nutrition title and its largest program, the Supplemental Nutrition Assistance Program (SNAP), account for $326 billion (76%) of those projected outlays. The remaining 24%, $102 billion, is for agricultural programs, mostly in crop insurance (8.9%), farm commodity programs (7.3%), and conservation (6.8%). Other titles of the farm bill account for 1% of the mandatory spending, some of which are funded primarily with discretionary spending.
Historical trends in farm bill spending show increased SNAP outlays after the 2009 recession, increased crop insurance outlays based on insurable coverage, farm commodity programs outlays that vary inversely with markets, and steadily increasing conservation program outlays that have leveled off in recent years.
Actual and Projected Spending by Major Farm Bill Mandatory Programs
Source: CRS.
Notes: Darker shades of each color are actual outlays based on USDA data. Lighter shades are CBO data, including estimates for FY2017-FY2018 and CRS analysis of CBO data for projections at enactment of the 2018 farm bill.
The farm bill is an omnibus, multiyear law that governs an array of agricultural and food programs. It provides an opportunity for Congress to choose how much support to provide for agriculture and nutrition and how to allocate it among competing constituencies. The farm bill has typically undergone reauthorization about every five years. The current farm bill—the Agriculture Improvement Act of 2018 (P.L. 115-334, H.R. 2), often called the "2018 farm bill"—was enacted in December 2018 and expires in 2023.1
From its beginning in the 1930s, farm bills have focused primarily on farm commodity programs to support a handful of staple commodities—corn, soybeans, wheat, cotton, rice, dairy, and sugar. In recent decades, farm bills have expanded in scope to include a Nutrition title since 1973 and since then Conservation, Horticulture, Bioenergy, Credit, Research, and Rural Development titles.2
Budget matters increasingly influence the development of the farm bill. While other reports discuss policy issues,3 this report focuses on the budgetary effects across the whole farm bill.
Farm Bills from a Budget PerspectiveOne way to compare the activities covered by a farm bill is by the allocation of federal spending and, more specifically, by how much is spent in total and how a new law changes allocations or policy. Congressional Budget Office (CBO) estimates are the official measures when bills are considered and are grounded in long-standing budget laws and rules.4
Recent Historical PerspectiveRecent farm bills have faced various budget situations, including spending more under a budget surplus, cutting spending for deficit reduction, and remaining budget neutral. For example
The 2002 farm bill (the Farm Security and Rural Investment Act of 2002, P.L. 107-171) was enacted under a budget surplus that allowed it to make changes that were projected to increase spending by $73 billion, or 22%, over a 10-year budget window—more than half of which was for the farm commodity programs.5- The 2008 farm bill (the Food, Conservation, and Energy Act of 2008, P.L. 110-246) was officially budget neutral, though it included $10 billion of offsets over 10 years from tax-related and other provisions that allowed it to increase spending on the Nutrition, Conservation, and Disaster titles.6
- The 2014 farm bill (the Agricultural Act of 2014, P.L. 113-79) was enacted under deficit reduction and budget sequestration that influenced its legislative development. It made changes that projected a net reduction of $
1617 billion, or 1.7%, over 10 years ($23 billion including sequestration).7- The 2018 farm bill (the Agriculture Improvement Act of 2018, P.L. 115-334) was held to a budget-neutral position over its 10-year budget window. Some budget amounts were reallocated across programs within issue areas and across titles of the farm bill, as discussed throughout this report.
Types of Spending AuthorizationsGenerally, farm bills authorize spending in two categories: mandatory and discretionary. From a budgetary perspective, many of the larger programs are assumed to continue beyond the end of a farm bill, even though their authorizations to operate may expire. That projection for mandatory programs, as explained below, provides funding to reauthorize programs, reallocate funding to other programs, or take offsets for deficit reduction. For other programs, funding must come by other means. This includes new programs, those without baseline, or discretionary programs.
The Supplemental Nutrition Assistance Program (SNAP) and crop insurance have their own mandatory spending sources, but most other mandatory outlays are paid through the U.S. Department of Agriculture's (USDA) Commodity Credit Corporation (CCC).8Types of Spending Authorized in the Farm Bill
Mandatory spending. A farm bill authorizes outlays and pays for them with multiyear budget estimates when the law is enacted. Budget enforcement is through "baseline" projections under current law, "scores" of the effect of proposed bills, and "PayGo" budget rules that may prevent deficit increases. (See CRS Report R44763, Present Trends and the Evolution of Mandatory Spending.)
Discretionary authorizations. A farm bill establishes parameters for discretionary programs and authorizes them to receive funding in subsequent appropriations acts but does not provide or assure actual funding. Budget enforcement is through future appropriations and budget resolutions. (See CRS Report R42388, The Congressional Appropriations Process: An Introduction.)
Discretionary spending is authorized throughout the farm bill, including most rural development, credit, and research programs, among others. Some smaller research, bioenergy, and rural development programs are authorized to receive both mandatory and discretionary funding. Most agency operations (salaries and expenses) are financed with discretionary funds. Discretionary appropriations are made separately through an annual agriculture appropriations act.9
While both types of programs are significant, mandatory programs often dominate the farm bill debate. Therefore, the majority of this report focuses on mandatory spending
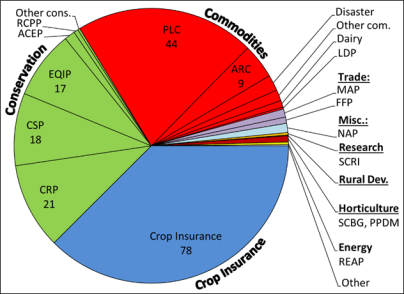
Summary of Projected Outlays in the 2018 Farm Bill Figure 1 illustrates the distribution of the $428 billion five-year total of projected mandatory outlays at enactment for the life of the 2018 farm bill (FY2019-FY2023). Figure 2 shows program-level detail for agriculture-specific programs, particularly the Farm Commodity and Conservation titles. Table 1 presents these outlays (the fifth and 10th columns), and how budgetary resources were reallocated across titles of the farm bill, for both the five- and 10-year budget windows. The terms baseline and score are explained in later sections of this report.Mandatory spending is authorized throughout the farm bill, but four titles presently account for about 99% of the mandatory farm bill spending: Commodities (7.3%), Nutrition (76%), Crop Insurance (8.9%), and Conservation (6.8%).
Figure 1. Projected Outlays in the Agriculture Improvement Act of 2018, by Title(Five-year projected mandatory outlays at enactment, billions of dollars, FY2019-FY2023)
Source: CRS. Compiled from CBO, "Baseline Projections," April 2018; at the title level (unpublished); and CBO cost estimate of the conference agreement, December 11, 2018.
Figure 2. Projected Agriculture Outlays in the Agriculture Improvement Act of 2018(Five-year projected mandatory outlays at enactment, billions of dollars, FY2019-FY2023)
Sources: CRS. Compiled from CBO Baseline for USDA Mandatory Farm Programs, April 2018; at the title level (unpublished); and CBO cost estimate of the conference agreement, December 11, 2018.
Notes: PLC = Price Loss Coverage, ARC = Agricultural Risk Coverage, LDP = Loan Deficiency Payments, EQIP = Environmental Quality Incentives Program, CRP = Conservation Reserve Program, CSP = Conservation Stewardship Program, ACEP = Agricultural Conservation Easement Program, RCPP = Regional Conservation Partnership Program, FFP = Food for Progress, NAP = Noninsured Crop Disaster Assistance Program.
(millions of dollars, 5- and 10-year totals, mandatory spending)
5 years (FY2019-FY2023)
10 years (FY2019-FY2028)
CBO score
CBO score
Farm bill titles
CBO baseline
House passed
Senate passed
Enacted
Projected outlays
CBO baseline
House passed
Senate passed
Enacted
Projected outlays
over 10 years ($23 billion including sequestration).7 The 2018 farm bill—the current bill under consideration (H.R. 2)—is being held to a budget-neutral position, though budget amounts may be reallocated across programs within issue areas and across titles of the farm bill (Table 1).
Mandatory spending is authorized throughout the farm bill, but four titles presently account for about 99% of the mandatory farm bill spending: Commodity, Nutrition, Crop Insurance, and Conservation.8 The Supplemental Nutrition Assistance Program (SNAP) and crop insurance have their own mandatory spending sources, but the farm commodity programs, conservation, and most other mandatory outlays are paid through the U.S. Department of Agriculture's (USDA) Commodity Credit Corporation (CCC).9
Discretionary spending is authorized throughout the farm bill, including most rural development, credit, and research programs, among others. Some smaller research, bioenergy, and rural development programs are authorized to receive both mandatory and discretionary funding. Most agency operations (salaries and expenses) are financed with discretionary funds. Discretionary appropriations are made through the annual Agriculture appropriations act.10
While both types of programs are significant, mandatory programs often dominate the farm bill debate. Therefore, the majority of this report focuses on mandatory spending.
Importance of Baseline to the Farm Bill
The Congressional Budget Office (CBO) baseline is a projection at a particular point in time of future federal spending on mandatory programs under current law. The baseline is the benchmark against which proposed changes in law are measured. The CBO develops the budget baseline under various laws and follows the supervision of the House and Senate Budget Committees.
When a new bill is proposed that would affect mandatory spending, the cost impact (score) is measured in relation to the baseline. Changes that increase spending relative to the baseline have a positive score; those that decrease spending relative to the baseline have a negative score.11
Having a baseline essentially gives programs built-in future funding if policymakers decide that the programs should continue—that is, straightforward reauthorization would not have a scoring effect (budget neutral). However, some programs do not have a continuing baseline beyond the expiration of a farm bill and do not have assured future funding. Their reauthorization would have a positive score that increases the bill's cost.
Development of the Baseline
CBO projects future government spending via its budget baselines and evaluates proposed bills via scoring estimates. The baseline incorporates domestic and international market conditions at the time the baseline is projected, government policies, and expectations for future economic conditions. Generally, a program with estimated mandatory spending in the last year of its authorization may be assumed to continue in the baseline as if there were no change in policy and it did not expire. This is the situation for most of the major, long-standing farm bill provisions such as the farm commodity programs or supplemental nutrition assistance.12 However, some programs may not be assumed to continue in the budget baseline beyond the end of a farm bill because they are either13
- programs with estimated mandatory spending less than a minimum $50 million scoring threshold in the last year of the farm bill, or
- new programs established after 1997 for which the Budget Committees have determined that the mandatory spending shall not extend beyond expiration. This decision may have been made in consultation with the Agriculture Committees for a number of reasons, such as to reduce the program's 10-year cost when a farm bill is written or to prevent the program from having a continuing baseline.
April 2018 CBO Baseline
The baseline for scoring the 2018 farm bill currently under consideration is the CBO baseline that was released in April 2018. This baseline is to be used until a new annual scoring baseline is released in the spring of 2019.
The April 2018 mandatory spending baseline for farm bill programs contains $867 billion over FY2019-FY2028, 77% of which is in the Nutrition title for SNAP ($664 billion). The remaining $203 billion baseline is for agricultural programs, mostly in the Crop Insurance, Farm Commodity Programs, and Conservation titles.14 Other titles contribute about 1% of the baseline because they are funded mostly with discretionary spending.
The April 2018 CBO baseline is the benchmark of available funding from which the House and Senate wrote bills for a new farm bill in 2018. The 5-year and 10-year columns in Table 1 show the CBO baseline for the titles of the 2014 farm bill over the next 10 years. (The score columns will be discussed later in "Scores of the 2018 Farm Bill Proposals".) Figure 1 illustrates the 10-year baseline by title. Table 2 adds details at the program level and with the annual projections, for the Farm Commodity Programs, Conservation, Trade, and Miscellaneous titles. Figure 2 illustrates the 10-year, program-level baseline for agriculture (non-nutrition) programs.15
Table 1. Budget for a 2018 Farm Bill: Baseline and Scores, by Title
(projected outlays in millions of dollars, 5- and 10-year totals)
|
5 years (FY2019-FY2023) |
10 years (FY2019-FY2028) |
|||||||||||
|
Farm Bill Titles |
CBO Baseline |
CBO Score |
CBO Baseline |
CBO Score |
||||||||
|
House-Passed |
Senate-Passed |
House-Passed |
Senate-Passed |
|||||||||
|
Commodities |
31,340 |
+198 |
-23
|
Commodities
|
31,340
|
+198
|
-23
|
+101 31,440 |
61,151 |
+284 |
-408
|
+263 61,414 |
|
Conservation |
28,715 |
+656 |
+290
|
+555 29,270 |
59,754 |
-795 |
+0
|
-6 59,748 |
||||
|
Trade |
1,809 |
+235 |
+258
|
+235 2,044 |
3,624 |
+470 |
+515
|
+470 4,094 |
||||
|
Nutrition |
325,922 |
+862 |
+224 |
+98 326,020 |
-1,426 |
+94 |
+0 |
663,828 |
||||
|
Credit |
-2,205 |
+0 |
+0 |
+0 -2,205 |
+0 |
+0 |
+0 |
-4,558 |
||||
|
Rural Development |
98 |
+0 |
-832 |
-530 -432 |
+0 |
-2,340 |
-2,530 |
-2,362 |
||||
|
Research |
329 |
+168 |
+426
|
+365 694 |
604 |
+250 |
+685
|
+615 1,219 |
||||
|
Forestry |
5 |
+0 |
+5 |
+0 5 |
+0 |
+5 |
+0 |
10 |
||||
|
Energy |
362 |
-267 |
+311 |
+109 471 |
-517 |
+375 |
+125 |
737 |
||||
|
Horticulture |
772 |
+10 |
+323
|
+250 1,022 |
1,547 |
+10 |
+626 |
+500 |
2,047 |
|||
|
Crop Insurance |
38,057 |
-70 |
-1
|
-47 38,010 |
78,037 |
-161 |
-2
|
-104 77,933 |
||||
|
Miscellaneous |
1,259 |
+553 |
+594
|
+685 1,944 |
2,423 |
+566 |
+517 |
+738 |
3,161 |
|||
|
Subtotal |
426,462 |
+2,344 |
+
|
+1,820 428,282 |
867,200 |
-1,320 |
+
|
+70 867,270 |
||||
|
Increase in Revenue |
- |
+115 |
+33 |
+35 35 |
+465 |
+68 |
+70 |
70 |
||||
|
Total |
426,462 |
+2,229 |
+1,540 |
+1,785 428,247 |
-1,785 |
+0 +0 867,200 |
||||||
Source: CRS. Compiled from the CBO Baseline by Title (unpublished; April 2018), based on the CBO baseline; CBO Baseline, April 2018, https://www.cbo.gov/about/products/baseline-projections-selected-programs, April 2018, and the; CBO cost estimates for H.R. 2 as passed by the House of Representatives and the Senate Amendment to H.R. 2 as passed by the Senate, https://www.cbo.gov/publication/54284, July 24, 2018.
Note:
a. The House bill combined rural development and energy provisions into a Rural Infrastructure and Economic Development title. This table retains the separate titles, based on provisions, to maintain consistency with the 2014 farm bill, the CBO baseline, and the Senate bill.
(10-year projected outlays under current law, FY2019-FY2028, billions of dollars) |
 |
|
Note: Baseline for the Credit title is negative because of receipts to the Farm Credit System Insurance Fund. Baseline for the Rural Development "cushion of credit" is accounted for outside of the farm bill. The Congressional Budget Office (CBO) baseline is a projection at a particular point in time of future federal spending on mandatory programs under current law. The baseline is the benchmark against which proposed changes in law are measured. The CBO develops the budget baseline under various laws and follows the supervision of the House and Senate Budget Committees. When a new bill is proposed that would affect mandatory spending, the score (cost impact) is measured in relation to the baseline. Changes that increase spending relative to the baseline have a positive score; those that decrease spending relative to the baseline have a negative score. Having a baseline essentially gives programs built-in future funding if policymakers decide that the programs should continue—that is, straightforward reauthorization would not have a scoring effect (budget neutral). Once a new law is passed, the projected outlays at enactment equal the baseline plus the score. This sum becomes the budget foundation of the new law. CBO periodically projects future government spending via its budget baselines, and evaluates proposed bills via scoring estimates. The baseline incorporates domestic and international economic conditions at the time the baseline is projected. Generally, a program with estimated mandatory spending in the last year of its authorization may be assumed to continue in the baseline as if there were no change in policy and it did not expire. This is the situation for most of the major, long-standing farm bill provisions such as the farm commodity programs or supplemental nutrition assistance.10 However, some programs do not continue in the baseline beyond the end of a farm bill because they are either11 The 2014 farm bill had 39 programs without baseline beyond FY2018 that received $2.824 billion in mandatory funding over five years.12Table 2. CBO Baseline for; and CBO cost estimate of the conference agreement for H.R. 2, https://www.cbo.gov/publication/54880, December 11, 2018.
(projected outlays in millions of dollars, April 2018 baseline)
|
Fiscal year |
5 years |
10 years |
||||||||||
|
2019 |
2020 |
2021 |
2022 |
2023 |
2024 |
2025 |
2026 |
2027 |
2028 |
FY2019-23 |
FY2019-28 |
|
|
||||||||||||
|
|
2, |
2, |
464 |
430 |
479 |
431 |
463 |
482 |
505 |
492 |
6,155 |
8,529 |
|
|
2, |
2, |
5,742 |
5,006 |
4,574 |
4,639 |
4,603 |
4,854 |
4,558 |
4,566 |
20,702 |
43,921 |
|
Marketing Loan Program |
58 |
51 |
51 |
48 |
45 |
44 |
43 |
47 |
48 |
50 |
254 |
486 |
|
Dairy |
186 |
161 |
160 |
177 |
173 |
177 |
191 |
128 |
134 |
137 |
857 |
1,624 |
|
Disaster assistance programs |
364 |
361 |
391 |
390 |
388 |
386 |
389 |
388 |
387 |
425 |
1,893 |
3,868 |
|
Other |
524 |
241 |
228 |
235 |
251 |
252 |
244 |
253 |
255 |
240 |
1,479 |
2,723 |
|
Subtotal, Title I |
6,487 |
5,621 |
7,035 |
6,286 |
5,910 |
5,930 |
5,934 |
6,151 |
5,886 |
5,910 |
31,340 |
61,151 |
|
Title II |
||||||||||||
|
Conservation Reserve Program |
1,819 |
1,999 |
2,042 |
2,083 |
2,126 |
2,169 |
2,209 |
2,223 |
2,213 |
2,214 |
10,069 |
21,097 |
|
Emergency Forestry Conservation Reserve |
1 ,607 |
1 ,822 |
1 ,743 |
1 ,772 |
1 ,820 |
1 ,771 |
1 ,768 |
1 ,810 |
1 ,808 |
1 ,808 |
5 |
10 |
|
CRP Technical Assistance |
100 |
37 |
77 |
72 |
147 |
106 |
169 |
91 |
94 |
85 |
433 |
978 |
|
Conservation Security/Stewardship Program |
1,607 |
1,822 |
1,743 |
1,772 |
1,820 |
1,771 |
1,768 |
1,810 |
1,808 |
1,808 |
8,764 |
17,729 |
|
|
1,509 |
1,545 |
1,600 |
1,640 |
1,674 |
1,729 |
1,750 |
1,750 |
1,750 |
1,750 |
7,968 |
16,697 |
|
Agricultural Conservation Easement Program |
310 |
271 |
266 |
250 |
250 |
250 |
250 |
250 |
250 |
250 |
1,347 |
2,597 |
|
Regional Conservation Partnership Program |
127 |
125 |
121 |
107 |
98 |
100 |
100 |
100 |
100 |
100 |
578 |
1,078 |
|
Agricultural Management Assistance |
9 |
9 |
9 |
10 |
10 |
10 |
10 |
10 |
10 |
10 |
47 |
97 |
|
Programs repealed in 2014 and user fees |
-4 |
-4 |
-4 |
-4 |
-4 |
-4 |
-4 |
-4 |
-4 |
-4 |
-20 |
-40 |
|
Other, incl. announced FY2019 sequestration |
-233 |
-75 |
-75 |
-51 |
-42 |
-27 |
15 |
-1 |
0 |
0 |
-476 |
-489 |
|
Subtotal, Title II |
5,245 |
5,730 |
5,780 |
5,880 |
6,080 |
6,105 |
6,268 |
6,230 |
6,222 |
6,214 |
28,715 |
59,754 |
|
Title III |
||||||||||||
|
Market Access Program |
200 |
200 |
200 |
200 |
200 |
200 |
200 |
200 |
200 |
200 |
1,000 |
2,000 |
|
Food for Progress |
153 |
154 |
154 |
154 |
154 |
155 |
155 |
155 |
155 |
155 |
769 |
1,544 |
|
Emerging Markets Program |
8 |
8 |
8 |
8 |
8 |
8 |
8 |
8 |
8 |
8 |
40 |
80 |
|
Subtotal, Title III |
361 |
362 |
362 |
362 |
362 |
363 |
363 |
363 |
363 |
363 |
1,809 |
3,624 |
|
Title IV |
65,817 |
65,268 |
65,033 |
64,857 |
64,947 |
65,477 |
66,247 |
67,151 |
68,720 |
70,311 |
325,922 |
663,828 |
|
Title V |
-435 |
-437 |
-440 |
-444 |
-449 |
-455 |
-462 |
-471 |
-478 |
-487 |
-2,205 |
-4,558 |
|
Title VI |
35 |
21 |
14 |
14 |
14 |
14 |
14 |
14 |
14 |
14 |
98 |
168 |
|
Title VII |
82 |
78 |
59 |
55 |
55 |
55 |
55 |
55 |
55 |
55 |
329 |
604 |
|
Title VIII |
1 |
1 |
1 |
1 |
1 |
1 |
1 |
1 |
1 |
1 |
5 |
10 |
|
Title IX |
102 |
89 |
70 |
51 |
50 |
50 |
50 |
50 |
50 |
50 |
362 |
612 |
|
Title X |
153 |
154 |
155 |
155 |
155 |
155 |
155 |
155 |
155 |
155 |
772 |
1,547 |
|
Title XI |
7,230 |
7,471 |
7,684 |
7,811 |
7,860 |
7,903 |
7,942 |
8,006 |
8,047 |
8,082 |
38,057 |
78,037 |
|
Title XII |
||||||||||||
|
Noninsured Crop Disaster Assistance Program |
223 |
223 |
223 |
223 |
223 |
223 |
223 |
223 |
223 |
223 |
1,114 |
2,229 |
|
Other |
71 |
37 |
12 |
12 |
12 |
10 |
10 |
10 |
10 |
10 |
145 |
195 |
|
Subtotal, Title XII |
294 |
259 |
235 |
235 |
235 |
233 |
233 |
233 |
233 |
233 |
1,259 |
2,423 |
|
Total |
85,372 |
84,617 |
85,989 |
85,263 |
85,221 |
85,831 |
86,800 |
87,938 |
89,268 |
90,901 |
426,462 |
867,200 |
|
Nutrition (Title IV) |
65,817 |
65,268 |
65,033 |
64,857 |
64,947 |
65,477 |
66,247 |
67,151 |
68,720 |
70,311 |
325,922 |
663,828 |
|
Non-nutrition (other titles) |
19,555 |
19,350 |
20,955 |
20,406 |
20,274 |
20,354 |
20,553 |
20,787 |
20,548 |
20,590 |
100,540 |
203,372 |
Source: CRS, compiled using the CBO Baseline by Title (unpublished; April 2018; in bold), and based on additional details for programs from the CBO baseline
Source: CRS. Compiled using CBO, "Baseline Projections for Selected Programs," April 2018, https://www.cbo.gov/about/products/baseline-projections-selected-programs, April 2018 (in italics).
Note: Near-term amounts may include outlays for programs that expired before FY2019. Among titles without program detail, Nutrition includes SNAP, Credit includes receipts to FCS Insurance Fund. Research includes SCRI. Energy includes REAP, Horticulture includes SCBG, PPDM, and promotion orders, as noted in Figure 2.
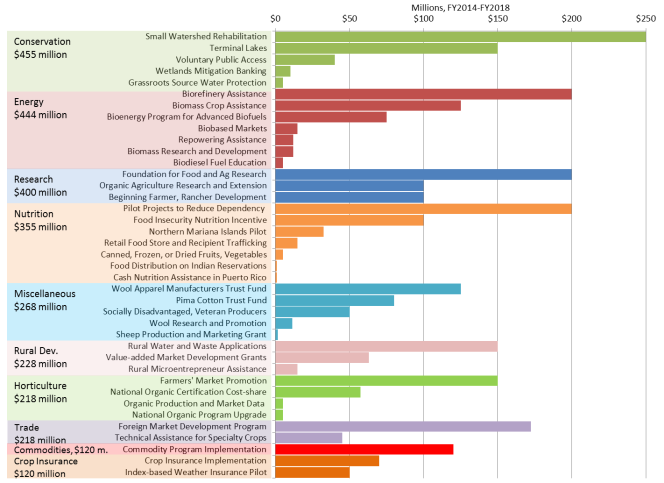
Programs Without Baseline
As explained above, most of the major farm bill provisions are assumed to continue in the baseline. However, some programs may not be assumed to continue, because they had estimated mandatory spending below the minimum scoring threshold of $50 million or the Budget and/or Agriculture Committees determined that mandatory spending should not continue.
The 2014 farm bill contains 39 programs that received mandatory funding that do not have baseline beyond FY2018 (Figure 3). These programs had estimated mandatory spending totaling $2.824 billion over the five-year farm bill.16
Among this group are certain conservation programs; most of the Bioenergy, Rural Development, and Research title programs; various Nutrition title pilot programs and studies; organic agriculture and farmers' market programs; trade promotion; and outreach to farmers.17
|
 |
|
Scores of the 2018 Farm Bill Proposals
The budgetary impact of the 2018 farm bill proposals (House-passed H.R. 2 and the Senate-passed amendment to H.R. 2) are measured relative to the CBO baseline—that is, what the 2014 farm bill (current law) would have spent had it continued. Budget enforcement uses the April 2018 baseline and these scores to follow an array of federal budget rules, such as "PayGo," that require budgetary offsets to balance new spending to avoid increasing the federal deficit.18
Although the farm bill is generally considered a 5-year authorization—the potential 2018 farm bill would cover FY2019-FY2023—budget rules require it to be scored over a 10-year budget window. Thus, when the legislation is discussed during its development, the farm bill may be presented more in terms of its effect over the 10-year budget window than the score of the bill over the intended 5-year duration of the law. Separately, other statements about the total cost of the farm bill may be in terms of its five-year baseline (i.e., projected spending over the five-year life of the farm bill). Both are appropriate measures depending on one's perspective, but the two can be very different in magnitude, so it is important to differentiate between them.
CBO has released several scores of the 2018 farm bill in the various stages of its development. The most recent is an update that was released jointly for both bills on July 24, 2018, for the versions of H.R. 2 as passed by the House and the Senate and is the basis for the analysis here.19
Prior to the July 24 scores, CBO released its analyses of the original House-introduced bill,20 the House-reported bill after it passed the full committee and was initially considered on the floor,21 and the Senate-reported bill.22 The July 24 scores incorporate floor amendments from both chambers' bills that caused the House bill to reduce spending compared with the House-reported bill—particularly in the Nutrition title—and the Senate bill to spend slightly more than the Senate-reported bill in the Nutrition, Farm Commodities, and Miscellaneous titles. Subsequent to the July 24 scores, CBO released a more detailed assessment of payment limit provisions in the House-passed bill that did not change the score but explained it in more detail.23
Summaries of the House- and Senate-Passed Bill Scores
Relative to the 10-year $867 billion baseline (Table 1, Figure 1), the House-passed bill would reduce outlays by $1.8 billion over 10 years (-0.2%), and the Senate-passed bill would remain budget neutral (+0%) over the same 10-year period (as indicated by the diamonds in Figure 4).
The overall relatively small scores are the net result of sometimes relatively larger increases and reductions across titles (indicated by bar segments in Figure 4, Table 1).
- The House-passed bill would achieve its overall net reduction by reducing net outlays in four titles (Nutrition, Conservation, Energy, and Crop insurance) and by raising revenue from fees paid by contractors in the SNAP program. It would increase spending by less than the total of these reductions across five other titles (Miscellaneous, Trade, Commodities, Research, and Horticulture).
- The Senate-passed bill would achieve its budget-neutral outcome by reducing net spending in three titles (Rural Development, Commodities, and Crop insurance) and raising revenue for an oilheat program. It would increase spending across seven titles (Research, Horticulture, Miscellaneous, Trade, Energy, Nutrition, and Forestry).
Note: Near-term amounts may include outlays for programs that expired before FY2019 but still make outlays that have been obligated. For the titles without program detail: Nutrition includes SNAP; Credit includes receipts to Farm Credit System Insurance Fund; Research includes the Specialty Crop Research Initiative; Energy includes the Rural Energy for America Program; Horticulture includes Specialty Crop Block Grants, Plant Pest and Disease Management, and promotion orders. The CBO score measures the budgetary impact of changes made by the 2018 farm bill. It is measured relative to its benchmark—the CBO baseline. Budget enforcement procedures follow an array of federal budget rules, such as "PayGo," which required budgetary offsets to balance new spending to avoid increasing the federal deficit.15 Although the farm bill is a five-year authorization—the 2018 farm bill covers FY2019-FY2023—budget rules required it to be scored over a 10-year budget window. Thus, when the farm bill is discussed during legislative development, it may be more often presented by its effect over the 10-year budget window than the five-year duration of the law. Separately, statements about the total cost of the farm bill may be in terms of its five-year outlays (i.e., projected spending over the five-year life of the farm bill). Both can be accurate measures of the farm bill budget depending on the context. CBO released several interim scores of the 2018 farm bill during the various stages of its development. These include scores of the effects of the Subsequent to the House-passed score, CBO released a more detailed assessment of the farm commodity program payment limit provisions in the House-passed bill. This score did not change the amounts but explained background for the score of those provisions in greater detail.21 The overall relatively small or budget-neutral net scores are the result of sometimes relatively larger increases and reductions across titles.
(projected change in 10-year outlays relative to baseline, FY2019-FY2028) (projected change in 10-year outlays relative to baseline, FY2019-FY2028) |
 |
Note: Does not show amounts less than $50 million that are presented in Table 1. |
Table 3. CBO Score of the Agriculture Improvement Act of 2018, as Enacted, by Section
(projected change in outlays relative to April 2018 baseline, millions of dollars)
Fiscal year
5 years
10 years
2019
2020
2021
2022
2023
2024
2025
2026
2027
2028
2019-23
2019-28
Title I—Commodities
Dairy Risk Management Payments
-19
-15
-26
-11
-15
+20
-39
-49
-39
-64
-86
-257
ARC—Countya
+0
+0
-24
-28
-28
-20
-23
-20
-22
-20
-81
-186
Repeal Dairy Product Donation Program
-5
-5
-6
-6
-6
-5
-6
-6
-5
-5
-28
-54
ARC—Individuala
+0
+0
-1
-1
-1
-1
-1
-1
-1
-1
-2
-5
Tree Assistance Program
+0
+0
+0
+0
+0
+0
+0
+0
+0
+0
+2
+4
Cattle Tick Fever Inspections
+1
+1
+1
+1
+1
+1
+1
+1
+1
+1
+4
+7
Administrative Units for Large Counties
+0
+0
+1
+1
+1
+1
+1
+1
+1
+1
+3
+7
Livestock Indemnity Payments
+1
+1
+1
+1
+1
+1
+1
+1
+1
+1
+4
+8
Modified Sugar Loan Rates
+0
+0
+0
+0
+0
+1
+1
+2
+2
+3
+1
+9
Payment Limitations for Supplemental Disaster
+2
+1
+1
+1
+1
+1
+1
+1
+1
+1
+8
+15
Implementationb
+15
+1
+0
+0
+0
+0
+0
+0
+0
+0
+16
+16
Payment Limitations—Family Definition
+4
+4
+4
+4
+4
+4
+4
+4
+4
+4
+20
+40
Milk Donation Program
+9
+5
+5
+5
+5
+5
+5
+5
+5
+5
+29
+54
Margin Protection Premium Refund Credit 75%
+58
+0
+0
+0
+0
+0
+0
+0
+0
+0
+58
+58
Dairy Risk Management, Livestock Gross Margin
+1
+10
+13
+14
+14
+13
+14
+14
+16
+14
+52
+123
Modified Marketing Assistance Loan Ratesa
+0
+27
+22
+16
+16
+13
+12
+10
+10
+10
+81
+136
PLCa
+0
+0
-65
+23
+38
+26
+26
+26
+36
+28
-4
+137
Annual ARC/PLC Enrollmenta
+0
+0
+0
+0
+25
+25
+26
+26
+25
+26
+25
+153
Subtotal, Title I
+67
+30
-74
+21
+57
+84
+24
+16
+36
+2
+101
+263
Title II—Conservation
Conservation Stewardship Program
-25
-358
-796
-1,103
-1,387
-1,562
-1,768
-1,810
-1,808
-1,808
-3,669
-12,426
Conservation Reserve Program
+38
-52
-110
-80
+15
+119
+33
+37
-0
+1
-189
-0
Grassroots Source Water Protection Programb
+2
+2
+1
+0
+0
+0
+0
+0
+0
+0
+5
+5
Voluntary Public Access and Habitat Incentiveb
+10
+10
+10
+10
+10
+0
+0
+0
+0
+0
+50
+50
Feral Swine Eradication and Control Pilotc
+15
+25
+20
+10
+5
+0
+0
+0
+0
+0
+75
+75
Watershed Rehabilitation/Operationsd
+2
+8
+19
+29
+37
+42
+45
+45
+45
+45
+95
+317
Regional Conservation Partnership Program
+80
+141
+157
+174
+191
+200
+200
+200
+200
+200
+742
+1,742
Agricultural Conservation Easement Program
+73
+151
+177
+187
+198
+197
+198
+199
+199
+200
+786
+1,779
EQIP and CSP
+170
+356
+539
+692
+903
+1,019
+1,100
+1,184
+1,233
+1,257
+2,660
+8,451
Subtotal, Title II
+365
+283
+17
-81
-29
+15
-192
-146
-131
-106
+555
-6
Title III—Trade
Agricultural Trade Promotion and Facilitationd
+47
+47
+47
+47
+47
+47
+47
+47
+47
+47
+235
+470
Subtotal, Title III
+47
+47
+47
+47
+47
+47
+47
+47
+47
+47
+235
+470
Title IV—Nutrition
Interstate Data Matching Multiple Issuances
+0
-6
-25
-40
-60
-75
-90
-90
-95
-95
-131
-576
Quality Control Improvements
-48
-48
-48
-48
-48
-48
-48
-48
-48
-48
-240
-480
Assistance for Community Food Projects
-4
-4
-4
-4
-4
-4
-4
-4
-4
-4
-20
-40
Child Support Enforcement Cooperation
+1
+3
+1
+1
+0
+0
+0
+0
+0
+0
+5
+5
Food Distribution on Indian Reservations
+0
+3
+3
+4
+4
+4
+4
+4
+4
+4
+14
+34
Longitudinal Data for Research
+0
+11
+11
+1
+3
+5
+5
+5
+5
+5
+26
+51
Improvements to EBT System
+0
+3
+8
+14
+21
+15
+8
+1
+2
+2
+46
+74
Simplified Homeless Housing Costs
+3
+8
+8
+8
+8
+8
+8
+8
+8
+8
+35
+75
Emergency Food Assistance Program
+12
+24
+23
+23
+23
+19
+20
+20
+21
+21
+105
+206
Employment and Training for SNAP
+19
+24
+24
+24
+24
+24
+24
+24
+24
+24
+115
+234
Schumacher Nutrition Incentive Programd
+6
+16
+28
+43
+50
+52
+54
+56
+56
+56
+143
+417
Subtotal, Title IV
-12
+33
+29
+26
+21
-0
-19
-24
-27
-27
+98
+0
Title V—Credit
+0
+0
+0
+0
+0
+0
+0
+0
+0
+0
+0
+0
Title VI—Rural Development
Reduction in Interest to Cushion of Credit
-50
-150
-350
-380
-400
-400
-400
-400
-400
-400
-1,330
-3,330
Modify Loans Under Rural Electrification
+800
+0
+0
+0
+0
+0
+0
+0
+0
+0
+800
+800
Subtotal, Title VI
+750
-150
-350
-380
-400
-400
-400
-400
-400
-400
-530
-2,530
Title VII—Research and Extension
Emerging Agricultural Production Researchc
+2
+2
+2
+2
+2
+0
+0
+0
+0
+0
+10
+10
Scholarships for Students at 1890 Institutionsc
+0
+10
+10
+10
+10
+0
+0
+0
+0
+0
+40
+40
Foundation for Food and Agriculture Researchb
+0
+185
+0
+0
+0
+0
+0
+0
+0
+0
+185
+185
Organic Agriculture Research and Extensiond
+17
+19
+23
+29
+43
+50
+50
+50
+50
+50
+130
+380
Subtotal, Title VII
+19
+216
+35
+41
+55
+50
+50
+50
+50
+50
+365
+615
Title VIII—Forestry
+0
+0
+0
+0
+0
+0
+0
+0
+0
+0
+0
+0
Title IX—Energy
Biobased Market Programb
+2
+3
+3
+3
+3
+1
+0
+0
+0
+0
+14
+15
Bioenergy Program for Advanced Biofuelsb
+2
+4
+5
+7
+7
+5
+3
+2
+0
+0
+25
+35
Biorefinery Assistanceb
+0
+10
+20
+23
+18
+5
+0
+0
+0
+0
+70
+75
Subtotal, Title IX
+4
+17
+28
+32
+28
+11
+3
+2
+0
+0
+109
+125
Title X—Horticulture
Multiple Crop and Pesticide Use Surveyc
+0
+0
+0
+0
+0
+0
+0
+0
+0
+0
+1
+1
Organic Production and Market Data Initiativesb
+1
+1
+1
+1
+1
+0
+0
+0
+0
+0
+5
+5
Organic Certification/Trade Tracking and Datab
+1
+1
+1
+1
+1
+0
+0
+0
+0
+0
+5
+5
National Organic Certification Cost Shareb
+0
+0
+8
+8
+8
+0
+0
+0
+0
+0
+24
+24
Local Agriculture Market Programd
+28
+38
+50
+50
+50
+50
+50
+50
+50
+50
+215
+465
Subtotal, Title X
+30
+40
+60
+60
+60
+50
+50
+50
+50
+50
+250
+500
Title XI—Crop Insurance
Increase CAT Coverage Administrative Fee
-1
-12
-14
-14
-14
-14
-14
-14
-14
-14
-55
-125
Funding for Research and Development
-0
-4
-5
-5
-5
-5
-5
-5
-5
-5
-18
-40
Enterprise Units Across County Lines
-0
-3
-3
-3
-3
-3
-3
-3
-3
-3
-12
-27
Program Administration
-0
-2
-2
-2
-2
-2
-2
-2
-2
-2
-8
-18
Crop Production on Native Sod
-0
-0
-1
-1
-1
-1
-1
-1
-1
-1
-2
-4
Submission of Policies and Materials to Board
+0
+0
+1
+1
+1
+1
+1
+1
+1
+1
+3
+8
Research and Development Authority
+0
+1
+2
+2
+2
+2
+2
+2
+2
+2
+6
+13
Treatment of Forage and Grazing
+1
+9
+10
+10
+10
+10
+10
+10
+10
+10
+40
+90
Subtotal, Title XI
-1
-10
-12
-12
-12
-12
-12
-12
-12
-11
-47
-104
Title XII—Miscellaneous
Extension of Merchandise Processing Fee
+0
+0
+0
+0
+0
+0
+0
+0
-371
+0
+0
-371
Sheep Production and Marketing Grantsb
+1
+1
+0
+0
+0
+0
+0
+0
+0
+0
+2
+2
Wool Research and Promotionb
+0
+2
+2
+2
+2
+0
+0
+0
+0
+0
+9
+10
National Oilheat Research Alliance
+7
+7
+7
+7
+7
+7
+7
+7
+7
+7
+35
+70
Pima Agriculture Cotton Trust Fundb
+16
+16
+16
+16
+16
+0
+0
+0
+0
+0
+80
+80
Wool Apparel Manufacturers Trust Fundb
+0
+30
+30
+30
+30
+0
+0
+0
+0
+0
+120
+120
Emergency Citrus Trust Fundc
+25
+25
+25
+25
+25
+0
+0
+0
+0
+0
+125
+125
Animal Disease Prevention and Management
+60
+48
+6
+6
+29
+30
+30
+30
+30
+30
+149
+299
Farming Opportunities Training and Outreachd
+27
+30
+33
+35
+41
+45
+48
+48
+49
+50
+166
+404
Subtotal, Title XII
+136
+159
+119
+122
+149
+82
+85
+85
-285
+87
+685
+738
Total Changes in Direct Spending
+1,406
+664
-101
-124
-25
-73
-365
-333
-672
-307
+1,820
+70
Increases in Revenue: Title XII—Oilheat
+7
+7
+7
+7
+7
+7
+7
+7
+7
+7
+35
+70
Net Effect on the Deficit
+1,399
+657
-108
-131
-32
-80
-372
-340
-679
-314
+1,785
-0
Source: CRS, sorted within titles using the CBO cost estimate of the conference agreement for H.R. 2, https://www.cbo.gov/publication/54880, December 11, 2018.
Notes: + denotes additional spending or, in the case of revenue, additional revenue. – denotes reduced spending.
a. The scoring effect is delayed because the farm commodity programs operate by "crop year" (when the crop is harvested), and some payments are delayed by statute into a later fiscal year. For example, ARC and PLC payments for the 2019 crop year (the first covered by the 2018 farm bill) do not occur by statue until FY2021. Payments under the marketing loan program are delayed generally by one fiscal year.
b. Denotes a 2014 farm bill "program without baseline" that received new funding in the 2018 farm bill over FY2019-FY2023 but not permanent baseline. (The complete list of programs without baseline prior to the farm bill is identified in CRS Report R44758, Farm Bill Programs Without a Budget Baseline Beyond FY2018.)
c. Denotes a new "program without baseline" created in the 2018 farm bill.
d. Denotes a 2014 farm bill "program without baseline" that received new funding in the 2018 farm bill over FY2019-FY2028 and permanent baseline. The six provisions noted here cover nine programs from the list of programs without baseline because of consolidation within (1) trade programs; (2) farmers market, local food, and rural entrepreneurship programs; and (3) beginning farmer and outreach programs.
Net Increases in Five-Year Outlays Are Followed by Net Decreases
When separated into the five- and 10-year budget windows, each version of the 2018 farm bill shows a similar pattern of changes in projected outlays. Figure 4 show the scores for the first five years, the second five years, and the 10-year total for the enacted conference agreement. - The enacted farm bill increases net outlays in the first five years by $1.8 billion, which is offset by the same amount of net reductions in outlays during the second five years. Therefore, the 10-year net score is budget neutral.
- In the enacted law, the Conservation and Nutrition titles—which have increases in outlays over the first five years—have decreases during the second five years. Both titles are budget-neutral over the 10-year period. This may occur because of the time needed to implement changes or to make provisions more appealing in the early years despite having less baseline for a future farm bill.
A similar pattern held for the House-passed bill (Figure 5) and the Senate-passed bill (Figure 6). In both of those versions, the Conservation and Nutrition titles had increases in the first five years followed by decreases in the second five years. The House-passed bill had reductions in the Nutrition title that were not retained in the conference agreement. The Senate-passed bill would have reduced baseline for the Commodities title, whereas the conference agreement is projected to increase it.
Figure 4. CBO Score of Enacted 2018 Farm Bill, by Period and Title
(projected change in five- and 10-year outlays relative to baseline, FY2019-FY2028)
Source: CRS, using the CBO cost estimate of the conference agreement for H.R. 2, December 11, 2018.
Note: Does not show amounts less than $50 million that are indicated in Table 1.
Net Increases in Five-Year Outlays Are Followed by Net Decreases
Fiscal year
5 years
10 years
2019
2020
2021
2022
2023
2024
2025
2026
2027
2028
2019-23
2019-28
Title I—Commodities
Dairy Risk Management Payments
-19
-15
-26
-11
-15
+20
-39
-49
-39
-64
-86
-257
+0
+0
-24
-28
-28
-20
-23
-20
-22
-20
-81
-186
Repeal Dairy Product Donation Program
-5
-5
-6
-6
-6
-5
-6
-6
-5
-5
-28
-54
+0
+0
-1
-1
-1
-1
-1
-1
-1
-1
-2
-5
Tree Assistance Program
+0
+0
+0
+0
+0
+0
+0
+0
+0
+0
+2
+4
Cattle Tick Fever Inspections
+1
+1
+1
+1
+1
+1
+1
+1
+1
+1
+4
+7
Administrative Units for Large Counties
+0
+0
+1
+1
+1
+1
+1
+1
+1
+1
+3
+7
Livestock Indemnity Payments
+1
+1
+1
+1
+1
+1
+1
+1
+1
+1
+4
+8
Modified Sugar Loan Rates
+0
+0
+0
+0
+0
+1
+1
+2
+2
+3
+1
+9
Payment Limitations for Supplemental Disaster
+2
+1
+1
+1
+1
+1
+1
+1
+1
+1
+8
+15
+15
+1
+0
+0
+0
+0
+0
+0
+0
+0
+16
+16
Payment Limitations—Family Definition
+4
+4
+4
+4
+4
+4
+4
+4
+4
+4
+20
+40
Milk Donation Program
+9
+5
+5
+5
+5
+5
+5
+5
+5
+5
+29
+54
Margin Protection Premium Refund Credit 75%
+58
+0
+0
+0
+0
+0
+0
+0
+0
+0
+58
+58
Dairy Risk Management, Livestock Gross Margin
+1
+10
+13
+14
+14
+13
+14
+14
+16
+14
+52
+123
+0
+27
+22
+16
+16
+13
+12
+10
+10
+10
+81
+136
+0
+0
-65
+23
+38
+26
+26
+26
+36
+28
-4
+137
+0
+0
+0
+0
+25
+25
+26
+26
+25
+26
+25
+153
Subtotal, Title I
+67
+30
-74
+21
+57
+84
+24
+16
+36
+2
+101
+263
Title II—Conservation
Conservation Stewardship Program
-25
-358
-796
-1,103
-1,387
-1,562
-1,768
-1,810
-1,808
-1,808
-3,669
-12,426
Conservation Reserve Program
+38
-52
-110
-80
+15
+119
+33
+37
-0
+1
-189
-0
+2
+2
+1
+0
+0
+0
+0
+0
+0
+0
+5
+5
+10
+10
+10
+10
+10
+0
+0
+0
+0
+0
+50
+50
+15
+25
+20
+10
+5
+0
+0
+0
+0
+0
+75
+75
+2
+8
+19
+29
+37
+42
+45
+45
+45
+45
+95
+317
Regional Conservation Partnership Program
+80
+141
+157
+174
+191
+200
+200
+200
+200
+200
+742
+1,742
Agricultural Conservation Easement Program
+73
+151
+177
+187
+198
+197
+198
+199
+199
+200
+786
+1,779
EQIP and CSP
+170
+356
+539
+692
+903
+1,019
+1,100
+1,184
+1,233
+1,257
+2,660
+8,451
Subtotal, Title II
+365
+283
+17
-81
-29
+15
-192
-146
-131
-106
+555
-6
Title III—Trade
+47
+47
+47
+47
+47
+47
+47
+47
+47
+47
+235
+470
Subtotal, Title III
+47
+47
+47
+47
+47
+47
+47
+47
+47
+47
+235
+470
Title IV—Nutrition
Interstate Data Matching Multiple Issuances
+0
-6
-25
-40
-60
-75
-90
-90
-95
-95
-131
-576
Quality Control Improvements
-48
-48
-48
-48
-48
-48
-48
-48
-48
-48
-240
-480
Assistance for Community Food Projects
-4
-4
-4
-4
-4
-4
-4
-4
-4
-4
-20
-40
Child Support Enforcement Cooperation
+1
+3
+1
+1
+0
+0
+0
+0
+0
+0
+5
+5
Food Distribution on Indian Reservations
+0
+3
+3
+4
+4
+4
+4
+4
+4
+4
+14
+34
Longitudinal Data for Research
+0
+11
+11
+1
+3
+5
+5
+5
+5
+5
+26
+51
Improvements to EBT System
+0
+3
+8
+14
+21
+15
+8
+1
+2
+2
+46
+74
Simplified Homeless Housing Costs
+3
+8
+8
+8
+8
+8
+8
+8
+8
+8
+35
+75
Emergency Food Assistance Program
+12
+24
+23
+23
+23
+19
+20
+20
+21
+21
+105
+206
Employment and Training for SNAP
+19
+24
+24
+24
+24
+24
+24
+24
+24
+24
+115
+234
+6
+16
+28
+43
+50
+52
+54
+56
+56
+56
+143
+417
Subtotal, Title IV
-12
+33
+29
+26
+21
-0
-19
-24
-27
-27
+98
+0
Title V—Credit
+0
+0
+0
+0
+0
+0
+0
+0
+0
+0
+0
+0
Title VI—Rural Development
Reduction in Interest to Cushion of Credit
-50
-150
-350
-380
-400
-400
-400
-400
-400
-400
-1,330
-3,330
Modify Loans Under Rural Electrification
+800
+0
+0
+0
+0
+0
+0
+0
+0
+0
+800
+800
Subtotal, Title VI
+750
-150
-350
-380
-400
-400
-400
-400
-400
-400
-530
-2,530
Title VII—Research and Extension
+2
+2
+2
+2
+2
+0
+0
+0
+0
+0
+10
+10
+0
+10
+10
+10
+10
+0
+0
+0
+0
+0
+40
+40
+0
+185
+0
+0
+0
+0
+0
+0
+0
+0
+185
+185
+17
+19
+23
+29
+43
+50
+50
+50
+50
+50
+130
+380
Subtotal, Title VII
+19
+216
+35
+41
+55
+50
+50
+50
+50
+50
+365
+615
Title VIII—Forestry
+0
+0
+0
+0
+0
+0
+0
+0
+0
+0
+0
+0
Title IX—Energy
+2
+3
+3
+3
+3
+1
+0
+0
+0
+0
+14
+15
+2
+4
+5
+7
+7
+5
+3
+2
+0
+0
+25
+35
+0
+10
+20
+23
+18
+5
+0
+0
+0
+0
+70
+75
Subtotal, Title IX
+4
+17
+28
+32
+28
+11
+3
+2
+0
+0
+109
+125
Title X—Horticulture
+0
+0
+0
+0
+0
+0
+0
+0
+0
+0
+1
+1
+1
+1
+1
+1
+1
+0
+0
+0
+0
+0
+5
+5
+1
+1
+1
+1
+1
+0
+0
+0
+0
+0
+5
+5
+0
+0
+8
+8
+8
+0
+0
+0
+0
+0
+24
+24
+28
+38
+50
+50
+50
+50
+50
+50
+50
+50
+215
+465
Subtotal, Title X
+30
+40
+60
+60
+60
+50
+50
+50
+50
+50
+250
+500
Title XI—Crop Insurance
Increase CAT Coverage Administrative Fee
-1
-12
-14
-14
-14
-14
-14
-14
-14
-14
-55
-125
Funding for Research and Development
-0
-4
-5
-5
-5
-5
-5
-5
-5
-5
-18
-40
Enterprise Units Across County Lines
-0
-3
-3
-3
-3
-3
-3
-3
-3
-3
-12
-27
Program Administration
-0
-2
-2
-2
-2
-2
-2
-2
-2
-2
-8
-18
Crop Production on Native Sod
-0
-0
-1
-1
-1
-1
-1
-1
-1
-1
-2
-4
Submission of Policies and Materials to Board
+0
+0
+1
+1
+1
+1
+1
+1
+1
+1
+3
+8
Research and Development Authority
+0
+1
+2
+2
+2
+2
+2
+2
+2
+2
+6
+13
Treatment of Forage and Grazing
+1
+9
+10
+10
+10
+10
+10
+10
+10
+10
+40
+90
Subtotal, Title XI
-1
-10
-12
-12
-12
-12
-12
-12
-12
-11
-47
-104
Title XII—Miscellaneous
Extension of Merchandise Processing Fee
+0
+0
+0
+0
+0
+0
+0
+0
-371
+0
+0
-371
+1
+1
+0
+0
+0
+0
+0
+0
+0
+0
+2
+2
+0
+2
+2
+2
+2
+0
+0
+0
+0
+0
+9
+10
National Oilheat Research Alliance
+7
+7
+7
+7
+7
+7
+7
+7
+7
+7
+35
+70
+16
+16
+16
+16
+16
+0
+0
+0
+0
+0
+80
+80
+0
+30
+30
+30
+30
+0
+0
+0
+0
+0
+120
+120
+25
+25
+25
+25
+25
+0
+0
+0
+0
+0
+125
+125
Animal Disease Prevention and Management
+60
+48
+6
+6
+29
+30
+30
+30
+30
+30
+149
+299
+27
+30
+33
+35
+41
+45
+48
+48
+49
+50
+166
+404
Subtotal, Title XII
+136
+159
+119
+122
+149
+82
+85
+85
-285
+87
+685
+738
Total Changes in Direct Spending
+1,406
+664
-101
-124
-25
-73
-365
-333
-672
-307
+1,820
+70
Increases in Revenue: Title XII—Oilheat
+7
+7
+7
+7
+7
+7
+7
+7
+7
+7
+35
+70
Net Effect on the Deficit
+1,399
+657
-108
-131
-32
-80
-372
-340
-679
-314
+1,785
-0
For the House-passed bill, the net reduction of $1.8 billion over 10 years may be disaggregated into 2 time periods. On a shorter-time-period basis, the five-year score for the authorized life of the bill (FY2019-FY2023) shows a net increase of $2.2 billion over the comparable baseline of $426 billion (Table 1). This projected increase is more than offset by planned reductions that would not be realized until the second five years of the budget window (Figure 5).
For the Senate-passed bill, when the budget-neutral 10-year score is disaggregated, the effect is similar. The five-year FY2019-FY2023 score of the Senate bill shows a net increase of $1.6 billion that is offset by net reductions that would occur during the second five years (Figure 6).
In both bills, some of the titles that have increases in the first five years have decreases in the second five years (e.g., the Nutrition and Conservation titles in both the House- and Senate-passed bills). This may occur because of the time needed to implement changes and may make provisions more appealing in the early years despite having less baseline for a future farm bill.
|
Figure 5. CBO Score of House-Passed H.R. 2, by Period and Title (projected change in |
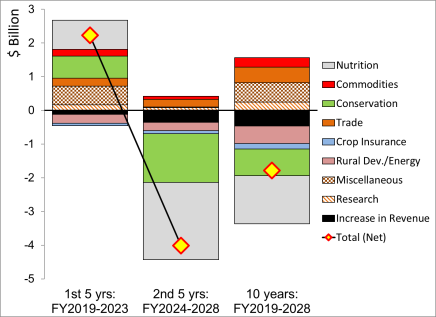 |
|
Source: CRS, using the CBO cost estimates for H.R. 2 as passed by the House, Note: Does not show amounts less than $50 million that are indicated in Table 1. |
|
Figure 6. CBO Score of the Senate-Passed Amendment to H.R. 2, by Period and Title (projected change in |
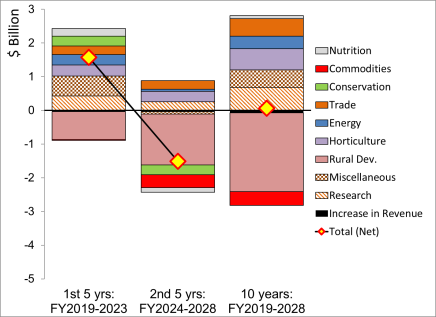 |
|
Source: CRS, using the CBO cost estimates for the Senate Amendment to H.R. 2 Note: |
Section-by-Section Scores for Some Titles Exceed Their Net Scores
Some of the overall scores within a single titlenet scores for single titles presented above are the net result of increases in some sections (provisions) that are offset by reductions in other sectionsand decreases by provisions within the same title. Sometimes, these increases or decreases are relatively large compared to the net title-level effect. These budget effects may reflect the policy preferences of particular constituenciespolicy proposals that may be lessnot be apparent in the net title-level scores that are shown in the previous figures. For example
- In the
House-passed bill, the Nutrition title has six sections that sum to a $22.0enacted law, the Conservation title has one section with a $12.4 billion reduction over 10 years (including those for work requirements) and 18reducing the Conservation Stewardship Program) and seven sections that add to $20.612.4 billion in increased spending—for a relatively small $1.4 billion net decrease in the title-level score. Similarly, the Conservation title has two sections that sum to a $12.6(Figure 7). In the House-passed bill, the Nutrition title had six sections that summed to a $22.0 billion reduction over 10 years (includingrepealing the Conservation Stewardship Program) and eightthose for work requirements) and 18 sections thatadd to $11.8added to $20.6 billion in increased spending—for the relatively small net $0.8 billion decrease (Figure 7,Table 3. Similarly, the Conservation title had two sections that summed to a $12.6 billion reduction and eight sections that added to $11.8 billion in increased spending (Figure 8). - In the Senate-passed bill, none of the titles' section-by-section scores
arewere as large as for the Nutrition and Conservation titles in the House-passedbill. Nonetheless, the section-by-section scores of the Senate-passed billshowshowed both increases and decreaseswithin some titles, such as Conservation, Nutrition, and Commodities (Figure 8,Table 4).
Programs Without Baseline
For some of the programs without baseline, both the House-passed and Senate-passed bills would provide continuing funding and, in some cases, permanent baseline. Permanent baseline for a program may be indicated by the continuation of funding in the FY2024-FY2028 period that is similar to FY2019-FY2023 (Table 3 and Table 4).
- In the House bill, programs that receive permanent baseline include Trade title programs that are combined into a new program ($470 million), and a food insecurity program in the Nutrition title ($472 million). Other affected programs that receive mandatory funding, but not permanent baseline, include organic research and beginning farmer programs in the Research title ($250 million), two organic programs in the Horticulture title ($10 million), and outreach for socially disadvantaged farmers and the wool and cotton trust funds in the Miscellaneous title ($150 million). In the Conservation title, small watershed rehabilitation, wetlands mitigation, voluntary public access, and grassroots source water protection programs receive over $500 million of mandatory funding.
- In the Senate bill, more programs receive permanent baseline than in the House bill, including Trade title programs ($515 million), organic research ($450 million), the beginning farmer program that would be combined with other outreach programs ($466 million), farmers market and value-added promotion programs that are combined ($558 million), and a food insecurity program in the Nutrition title ($401 million). Other affected programs that receive mandatory funding, but not permanent baseline, include an agricultural research foundation ($200 million); various bioenergy programs ($375 million); two other horticulture programs ($63 million); and the Pima cotton, wool, and citrus programs in the Miscellaneous title ($326 million).
(projected change in 10-year outlays relative to baseline, FY2019-FY2028) |
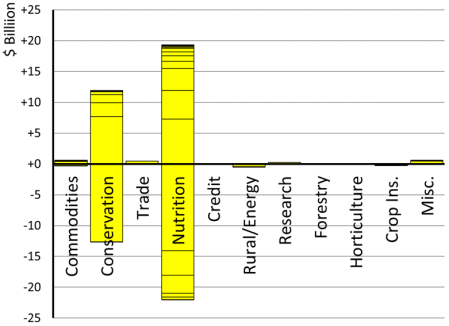 |
Source: CRS, sorted within titles using the CBO cost estimate for H.R. 2 as passed by the House, July 24, 2018.
|
(projected change in 10-year outlays relative to baseline, FY2019-FY2028) |
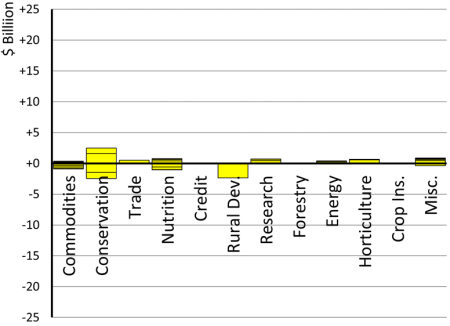 |
Source: CRS, sorted within titles using the CBO cost estimate for H.R. 2 as passed by the Senate, July 24, 2018.
|
(projected change in 10-year outlays relative to baseline, FY2019-FY2028) Source: CRS, sorted within titles using the CBO cost of the conference agreement for H.R. 2, December 11, 2018.
(projected change in 10-year outlays relative to baseline, FY2019-FY2028) Source: CRS, sorted within titles using the CBO cost estimate for H.R. 2 as passed by the House, July 24, 2018.
(projected change in 10-year outlays relative to baseline, FY2019-FY2028) Source: CRS, sorted within titles using the CBO cost estimate for H.R. 2 as passed by the Senate, July 24, 2018. In addition, five provisions in the 2018 farm bill created new programs without baseline for the next farm bill. When a new law is passed, the projected cost at enactment equals the baseline plus the score. This sum becomes the foundation of the new law and may be compared to future CBO baselines as an indicator of how actual costs develop as the law is implemented and conditions change.23
Source: CRS. (projected outlays in millions of dollars) Fiscal year 5 years 10 years 2019 2020 2021 2022 2023 2024 2025 2026 2027 2028 FY2019-23 FY2019-28 Title I—Farm Commodity Programs Price Loss Coverage 2,727 2,653 5,676 5,029 4,637 4,690 4,655 4,906 4,619 4,619 20,722 44,211 Agricultural Risk Coverage 2,627 2,155 439 401 450 410 440 461 482 471 6,073 8,337 Disaster Payments 368 364 394 393 391 390 392 391 390 428 1,910 3,901 Dairy 230 156 146 179 171 210 165 92 112 86 883 1,548 Marketing loans 58 78 73 64 61 57 55 57 58 60 334 622 Other 543 245 233 240 257 258 250 259 262 248 1,518 2,795 Subtotal, Title I 6,554 5,651 6,962 6,307 5,967 6,014 5,957 6,167 5,923 5,912 31,440 61,414 Title II—Conservation Environmental Quality Incentives Program/ Conservation Stewardship Program 1,679 1,901 2,138 2,333 2,577 2,748 2,850 2,934 2,983 3,007 10,627 25,148 Conservation Reserve Program 1,857 1,947 1,932 2,003 2,141 2,288 2,242 2,260 2,213 2,215 9,880 21,097 Conservation Security/Stewardship Program 1,582 1,464 947 669 433 209 0 0 0 0 5,095 5,303 Agricultural Conservation Easement Program 383 422 443 437 448 447 448 449 449 450 2,133 4,376 Regional Conservation Partnership Program 207 266 278 281 289 300 300 300 300 300 1,320 2,820 Other -98 13 58 77 164 128 236 142 146 137 214 1,003 Subtotal: Title II 5,610 6,013 5,797 5,799 6,051 6,120 6,076 6,084 6,091 6,108 29,270 59,748 Title III—Trade Agricultural Trade Promotion and Facilitation 255 255 255 255 255 255 255 255 255 255 1,275 2,550 Food for Progress 153 154 154 154 154 155 155 155 155 155 769 1,544 Subtotal, Title III 408 409 409 409 409 410 410 410 410 410 2,044 4,094 Title IV—Nutrition 65,805 65,301 65,062 64,883 64,968 65,477 66,228 67,127 68,693 70,284 326,020 663,828 Title V—Credit -435 -437 -440 -444 -449 -455 -462 -471 -478 -487 -2,205 -4,558 Title VI—Rural Development 785 -129 -336 -366 -386 -386 -386 -386 -386 -386 -432 -2,362 Title VII—Research 101 294 94 96 110 105 105 105 105 105 694 1,219 Title VIII—Forestry 1 1 1 1 1 1 1 1 1 1 5 10 Title IX—Energy 106 106 98 83 78 61 53 52 50 50 471 737 Title X—Horticulture 183 194 215 215 215 205 205 205 205 205 1,022 2,047 Title XI—Crop Insurance 7,229 7,461 7,672 7,799 7,849 7,892 7,931 7,995 8,035 8,070 38,010 77,933 Title XII—Miscellaneous Noninsured Crop Disaster Assistance Program 223 223 223 223 223 223 223 223 223 223 1,114 2,229 Other, including revenue offset for Oilheat 200 189 124 127 155 85 88 88 -282 90 795 862 Subtotal, Title XII 423 412 347 350 377 307 310 310 -60 313 1,909 3,091 Total 86,770 85,275 85,881 85,132 85,189 85,751 86,428 87,598 88,589 90,586 428,247 867,200 Nutrition (Title IV) 65,805 65,301 65,062 64,883 64,968 65,477 66,228 67,127 68,693 70,284 326,020 663,828 Non-nutrition (other titles) 20,965 19,974 20,819 20,249 20,220 20,274 20,200 20,472 19,896 20,302 102,227 203,372 Note: Near-term amounts may include outlays for programs that expired before FY2019 but still make outlays that have been obligated. The Credit title includes receipts to Farm Credit System Insurance Fund. The Rural Development title includes farm bill changes to the "cushion of credit" account for which baseline exists elsewhere in government and was not included in the original farm bill baseline. Table 3in the Conservation, Nutrition, Commodities and Miscellaneous titles (Figure 9).
Source: CRS. Compiled by adding the CBO score of the 2018 farm bill (Table 3) to the CBO baseline (Table 2).
(projected change in outlays relative to April 2018 baseline, millions of dollars)
|
Fiscal year |
5 years |
10 years |
||||||||||
|
2019 |
2020 |
2021 |
2022 |
2023 |
2024 |
2025 |
2026 |
2027 |
2028 |
2019-23 |
2019-28 |
|
|
Title I—Commodity Programs |
||||||||||||
|
Agriculture Risk Coverage—Individuala |
+0 |
+0 |
-16 |
-17 |
-18 |
-18 |
-17 |
-19 |
-18 |
-20 |
-51 |
-143 |
|
Agriculture Risk Coverage—Countya |
+0 |
+0 |
+23 |
-34 |
-26 |
-17 |
-6 |
-15 |
-25 |
-11 |
-37 |
-111 |
|
Dairy Program |
-45 |
-2 |
+4 |
+3 |
-1 |
-3 |
-6 |
-4 |
+18 |
+17 |
-41 |
-20 |
|
Nonrecourse Marketing Assistance Loansa |
+0 |
+0 |
+0 |
+0 |
+0 |
+0 |
+0 |
+0 |
+0 |
+0 |
+0 |
+0 |
|
Economic Adjustment Assistance Textile Mills |
+2 |
+2 |
+2 |
+2 |
+2 |
+2 |
+2 |
+2 |
+2 |
+2 |
+11 |
+23 |
|
Implementation |
+24 |
+1 |
+0 |
+0 |
+0 |
+0 |
+0 |
+0 |
+0 |
+0 |
+25 |
+25 |
|
Payment Limitationsb |
+4 |
+4 |
+4 |
+4 |
+4 |
+4 |
+4 |
+4 |
+4 |
+4 |
+20 |
+40 |
|
Supplemental Agriculture Disaster Assistance |
+13 |
+6 |
+5 |
+5 |
+5 |
+5 |
+5 |
+5 |
+5 |
+6 |
+35 |
+62 |
|
Price Loss Coveragea |
+0 |
+0 |
+137 |
+55 |
+43 |
+50 |
+134 |
-59 |
-16 |
+64 |
+235 |
+408 |
|
Subtotal, Title I |
-3 |
+12 |
+160 |
+18 |
+10 |
+23 |
+115 |
-85 |
-30 |
+62 |
+198 |
+284 |
|
Title II—Conservation |
||||||||||||
|
Repeal Conservation Stewardship Program |
-28 |
-406 |
-725 |
-1,072 |
-1,422 |
-1,771 |
-1,768 |
-1,810 |
-1,808 |
-1,808 |
-3,653 |
-12,618 |
|
Conservation Reserve Program |
-21 |
+70 |
+98 |
+96 |
+83 |
+73 |
-43 |
-76 |
-137 |
-166 |
+326 |
-23 |
|
Grassroots Source Water Protectionc |
+2 |
+2 |
+1 |
+0 |
+0 |
+0 |
+0 |
+0 |
+0 |
+0 |
+5 |
+5 |
|
Wetlands Mitigation Bankingc |
+2 |
+2 |
+2 |
+2 |
+2 |
+0 |
+0 |
+0 |
+0 |
+0 |
+10 |
+10 |
|
Voluntary Public Access and Habitat Protectionc |
+10 |
+10 |
+10 |
+10 |
+10 |
+0 |
+0 |
+0 |
+0 |
+0 |
+50 |
+50 |
|
Feral Swine Eradication and Control Pilot |
+20 |
+30 |
+25 |
+15 |
+10 |
+0 |
+0 |
+0 |
+0 |
+0 |
+100 |
+100 |
|
Small Watershed Rehabilitation Programc |
+3 |
+16 |
+38 |
+58 |
+74 |
+81 |
+73 |
+52 |
+32 |
+32 |
+189 |
+459 |
|
Regional Conservation Partnership Program |
+60 |
+106 |
+118 |
+131 |
+143 |
+150 |
+150 |
+150 |
+150 |
+150 |
+558 |
+1,308 |
|
Agricultural Conservation Easement Program |
+90 |
+187 |
+221 |
+234 |
+247 |
+247 |
+248 |
+248 |
+249 |
+250 |
+979 |
+2,221 |
|
Environmental Quality Incentives Program |
+55 |
+227 |
+424 |
+608 |
+777 |
+921 |
+1,056 |
+1,164 |
+1,217 |
+1,243 |
+2,092 |
+7,693 |
|
Subtotal, Title II |
+193 |
+244 |
+212 |
+82 |
-76 |
-299 |
-284 |
-272 |
-297 |
-299 |
+656 |
-795 |
|
Title III—Trade |
||||||||||||
|
International Development Programd |
+47 |
+47 |
+47 |
+47 |
+47 |
+47 |
+47 |
+47 |
+47 |
+47 |
+235 |
+470 |
|
Subtotal, Title III |
+47 |
+47 |
+47 |
+47 |
+47 |
+47 |
+47 |
+47 |
+47 |
+47 |
+235 |
+470 |
|
Title IV—Nutrition |
||||||||||||
|
Workforce Solutions: Benefits |
+0 |
-300 |
-1,330 |
-1,350 |
-1,340 |
-1,370 |
-1,560 |
-1,920 |
-2,280 |
-2,650 |
-4,320 |
-14,100 |
|
Update to Categorical Eligibility |
+0 |
+0 |
-200 |
-525 |
-520 |
-530 |
-530 |
-540 |
-555 |
-565 |
-1,245 |
-3,965 |
|
Standard Utility Allowances Based on Receipt |
-130 |
-310 |
-310 |
-310 |
-300 |
-300 |
-310 |
-310 |
-320 |
-330 |
-1,360 |
-2,930 |
|
Duplicative Enrollment Database |
+0 |
-8 |
-25 |
-45 |
-60 |
-80 |
-90 |
-90 |
-95 |
-95 |
-138 |
-588 |
|
State Performance Indicators |
+0 |
-48 |
-48 |
-48 |
-48 |
-48 |
-48 |
-48 |
-48 |
-48 |
-192 |
-432 |
|
Disqualification of Certain Convicted Felons |
* |
* |
* |
-1 |
-2 |
-2 |
-3 |
-4 |
-5 |
-6 |
-3 |
-23 |
|
Benefit Recovery |
* |
* |
* |
* |
* |
* |
* |
* |
* |
* |
* |
* |
|
Tolerance Level for Payment Errors |
* |
* |
* |
* |
* |
* |
* |
* |
* |
* |
* |
* |
|
Administrative Flexibility for States |
* |
* |
* |
* |
* |
* |
* |
* |
* |
* |
* |
* |
|
Multivitamin-Mineral Dietary Supplements |
* |
+0 |
+0 |
+0 |
+0 |
+0 |
+0 |
+0 |
+0 |
+0 |
* |
* |
|
Review of SNAP Operations |
* |
* |
* |
+0 |
+0 |
+0 |
+0 |
+0 |
+0 |
+0 |
* |
* |
|
Mobile Technologies |
+0 |
+1 |
+1 |
+1 |
+1 |
+1 |
+1 |
+2 |
+2 |
+2 |
+4 |
+12 |
|
SNAP Benefit Transfer Data Report |
+4 |
+3 |
+2 |
+3 |
+3 |
+3 |
+3 |
+3 |
+3 |
+3 |
+15 |
+30 |
|
Interactions |
-2 |
-3 |
* |
+2 |
-4 |
-3 |
-2 |
+12 |
+10 |
+25 |
-7 |
+35 |
|
Simplified Homeless Housing Costs |
+4 |
+8 |
+8 |
+8 |
+8 |
+8 |
+8 |
+8 |
+8 |
+8 |
+36 |
+76 |
|
Percent Recovered Funds Retained by States |
+10 |
+10 |
+10 |
+10 |
+10 |
+10 |
+10 |
+10 |
+11 |
+11 |
+50 |
+102 |
|
Basic Allowance for Housing |
+8 |
+11 |
+11 |
+11 |
+11 |
+12 |
+12 |
+13 |
+13 |
+14 |
+52 |
+116 |
|
Implementation Funds |
+128 |
+17 |
+3 |
+3 |
+0 |
+0 |
+0 |
+0 |
+0 |
+0 |
+150 |
+150 |
|
Prohibited Fees |
+0 |
+3 |
+7 |
+13 |
+20 |
+20 |
+20 |
+20 |
+25 |
+25 |
+43 |
+153 |
|
Asset Limits; Vehicle Allowance; Savings |
+1 |
-15 |
+5 |
+30 |
+30 |
+30 |
+30 |
+30 |
+30 |
+30 |
+51 |
+201 |
|
Food Insecurity Nutrition Incentive Programd |
+7 |
+17 |
+30 |
+46 |
+55 |
+59 |
+63 |
+65 |
+65 |
+65 |
+155 |
+472 |
|
Emergency Food Assistance |
+45 |
+46 |
+47 |
+48 |
+49 |
+50 |
+52 |
+53 |
+54 |
+55 |
+235 |
+499 |
|
National Gateway |
+8 |
+10 |
+10 |
+68 |
+70 |
+78 |
+81 |
+90 |
+95 |
+95 |
+165 |
+601 |
|
Nutrition Education |
+57 |
+58 |
+59 |
+61 |
+62 |
+64 |
+65 |
+67 |
+69 |
+70 |
+297 |
+632 |
|
Transitional Benefits |
+75 |
+90 |
+90 |
+90 |
+90 |
+90 |
+90 |
+90 |
+95 |
+95 |
+435 |
+895 |
|
Retailer-Funded Incentives Pilot |
+2 |
+182 |
+180 |
+120 |
+120 |
+120 |
+120 |
+120 |
+120 |
+120 |
+604 |
+1,204 |
|
Cooperation with Child Support Agencies |
+140 |
+304 |
+321 |
+335 |
+345 |
+355 |
+375 |
+396 |
+446 |
+476 |
+1,446 |
+3,494 |
|
Earned Income Deduction |
+350 |
+470 |
+470 |
+470 |
+470 |
+470 |
+470 |
+480 |
+490 |
+500 |
+2,230 |
+4,640 |
|
Workforce Solutions: Administration |
+0 |
+140 |
+600 |
+680 |
+740 |
+810 |
+920 |
+1,020 |
+1,140 |
+1,250 |
+2,160 |
+7,300 |
|
Subtotal, Title IV |
+707 |
+685 |
-59 |
-280 |
-190 |
-153 |
-223 |
-434 |
-628 |
-850 |
+862 |
-1,426 |
|
Title V—Credit |
+0 |
+0 |
+0 |
+0 |
+0 |
+0 |
+0 |
+0 |
+0 |
+0 |
+0 |
+0 |
|
Title VI—Rural Infrastructure and Economic Developmente |
||||||||||||
|
Rural Energy for America Programe |
-10 |
-30 |
-45 |
-50 |
-50 |
-50 |
-50 |
-50 |
-50 |
-50 |
-185 |
-435 |
|
Biorefinery Assistancee |
-35 |
-31 |
-16 |
+0 |
+0 |
+0 |
+0 |
+0 |
+0 |
+0 |
-82 |
-82 |
|
Subtotal, Title VIe |
-45 |
-61 |
-61 |
-50 |
-50 |
-50 |
-50 |
-50 |
-50 |
-50 |
-267 |
-517 |
|
Title VII—Research and Extension |
||||||||||||
|
Beginning Farmer and Rancher Developmentc |
+3 |
+10 |
+15 |
+19 |
+20 |
+17 |
+10 |
+5 |
+1 |
+0 |
+67 |
+100 |
|
Organic Agricultural Research and Extensionc |
+5 |
+15 |
+23 |
+29 |
+30 |
+26 |
+15 |
+8 |
+2 |
+0 |
+101 |
+150 |
|
Subtotal, Title VII |
+8 |
+25 |
+38 |
+48 |
+50 |
+43 |
+25 |
+13 |
+3 |
+0 |
+168 |
+250 |
|
Title VIII—Forestry |
+0 |
+0 |
+0 |
+0 |
+0 |
+0 |
+0 |
+0 |
+0 |
+0 |
+0 |
+0 |
|
Title IX—Horticulture |
||||||||||||
|
National Organic Program Technology Updatec |
+1 |
+1 |
+1 |
+1 |
+1 |
+0 |
+0 |
+0 |
+0 |
+0 |
+5 |
+5 |
|
Organic Production and Market Data Initiativec |
+1 |
+1 |
+1 |
+1 |
+1 |
+0 |
+0 |
+0 |
+0 |
+0 |
+5 |
+5 |
|
Subtotal, Title IX |
+2 |
+2 |
+2 |
+2 |
+2 |
+0 |
+0 |
+0 |
+0 |
+0 |
+10 |
+10 |
|
Title X—Crop Insurance |
||||||||||||
|
Education and Risk Management Assistance |
-1 |
-11 |
-17 |
-13 |
-14 |
-14 |
-15 |
-15 |
-15 |
-15 |
-52 |
-125 |
|
Increase Catastrophic Administration Fee |
-1 |
-7 |
-8 |
-8 |
-8 |
-8 |
-8 |
-8 |
-8 |
-8 |
-32 |
-72 |
|
Research and Development Priorities |
-5 |
-5 |
-5 |
-5 |
-5 |
-5 |
-5 |
-5 |
-5 |
-5 |
-23 |
-45 |
|
Program Administration |
+0 |
-2 |
-2 |
-2 |
-2 |
-2 |
-2 |
-2 |
-2 |
-2 |
-8 |
-18 |
|
Whole Farm Application to Beginning Farmers |
+0 |
+1 |
+1 |
+1 |
+1 |
+1 |
+1 |
+1 |
+1 |
+1 |
+4 |
+9 |
|
Treatment of Forage and Grazing |
+1 |
+9 |
+10 |
+10 |
+10 |
+10 |
+10 |
+10 |
+10 |
+10 |
+40 |
+90 |
|
Subtotal, Title X |
-6 |
-14 |
-16 |
-17 |
-17 |
-18 |
-18 |
-18 |
-18 |
-18 |
-70 |
-161 |
|
Title XI—Miscellaneous |
||||||||||||
|
Noninsured Crop Disaster Assistance |
-4 |
-4 |
-4 |
-4 |
-4 |
-4 |
-4 |
-4 |
-4 |
-4 |
-19 |
-37 |
|
Outreach to Socially Disadvantaged Producersc |
+5 |
+8 |
+10 |
+10 |
+10 |
+5 |
+2 |
+0 |
+0 |
+0 |
+43 |
+50 |
|
Textile Trust Fundc |
+1 |
+26 |
+25 |
+25 |
+25 |
+0 |
+0 |
+0 |
+0 |
+0 |
+103 |
+103 |
|
Animal Disease Preparedness and Response |
+150 |
+125 |
+50 |
+50 |
+50 |
+25 |
+0 |
+0 |
+0 |
+0 |
+425 |
+450 |
|
Subtotal, Title XI |
+152 |
+156 |
+82 |
+82 |
+82 |
+26 |
-2 |
-4 |
-4 |
-4 |
+553 |
+566 |
|
Total Changes in Direct Spending |
+1,055 |
+1,096 |
+406 |
-68 |
-142 |
-381 |
-390 |
-803 |
-977 |
-1,112 |
+2,344 |
-1,320 |
|
Increases in Revenue: Title IV—Nutrition |
+0 |
+0 |
+0 |
+55 |
+60 |
+60 |
+65 |
+70 |
+75 |
+80 |
+115 |
+465 |
|
Net Effect on the Deficit |
+1,055 |
+1,095 |
+405 |
-124 |
-203 |
-441 |
-455 |
-874 |
-1,052 |
-1,192 |
+2,229 |
-1,785 |
Source: CRS, sorted within titles using the CBO cost estimates for H.R. 2 as passed by the House, https://www.cbo.gov/publication/54284, July 24, 2018.
Notes: * denotes score between -$500,000 and +$500,000. + denotes additional spending or, in the case of revenue, additional revenue. – denotes reduced spending.
a. Details by commodity within these programs is available in Table 3 of the original CBO score of the House bill, at https://www.cbo.gov/publication/53760 (April 13, 2018). The total across commodities matches the score of these provisions (ARC, PLC, and marketing loan gains) in both the original CBO estimate and the July 24 score used in this table.
b. Details about CBO's score of the payment limits provision are explained in "Payment Limitations in H.R. 2, the Agriculture and Nutrition Act of 2018," https://www.cbo.gov/publication/54450, September 6, 2018.
c. Denotes a "program without baseline" after FY2018 from the 2014 farm bill (Figure 3) that received new funding in FY2019-2023FY2023 but not permanent baseline.
d. Denotes a "program without baseline" after FY2018 from the 2014 farm bill (Figure 3) that received new funding in FY2019-2028FY2028 and permanent baseline.
e. The House bill combined rural development and energy provisions (e.g., Titles VI and IX in the 2014 farm bill, respectively) into a single title, Title VI—Rural Infrastructure and Economic Development. Elsewhere in this report, such as in Table 1 and the figures, the two House provisions that scored in Title VI are assigned to an Energy title for comparison to the Senate bill and the CBO baseline.
Table 4 Table A-2. CBO Score of the Senate-Passed Amendment to H.R. 2, by Section
(projected change in outlays relative to April 2018 baseline, millions of dollars)
|
Fiscal year |
5 years |
10 years |
||||||||||
|
2019 |
2020 |
2021 |
2022 |
2023 |
2024 |
2025 |
2026 |
2027 |
2028 |
2019-23 |
2019-28 |
|
|
Title I—Commodities |
||||||||||||
|
Economic Adjustment |
+0 |
+0 |
+0 |
-46 |
-46 |
-47 |
-47 |
-47 |
-47 |
-47 |
-92 |
-328 |
|
AGI Limitation of $700,000 |
-2 |
-3 |
-38 |
-33 |
-31 |
-31 |
-31 |
-32 |
-31 |
-31 |
-107 |
-263 |
|
Actively Engaged in Farming Requirement |
+0 |
-2 |
-31 |
-27 |
-25 |
-25 |
-25 |
-26 |
-25 |
-25 |
-85 |
-211 |
|
Dairy Product Donation Program |
-5 |
-5 |
-6 |
-6 |
-5 |
-5 |
-6 |
-5 |
-5 |
-5 |
-27 |
-53 |
|
Producer Election (ARC Default Choice) |
+0 |
+0 |
-2 |
-1 |
-1 |
-1 |
-1 |
-1 |
-1 |
-1 |
-4 |
-9 |
|
Catastrophic Coverage $5.00 with 40% Cap |
+6 |
-3 |
+3 |
+3 |
+3 |
+5 |
-3 |
-5 |
-1 |
-12 |
+13 |
-3 |
|
Supplemental Agriculture Disaster Assistance |
+1 |
+1 |
+1 |
+1 |
+1 |
+1 |
+1 |
+1 |
+1 |
+1 |
+6 |
+11 |
|
Loss of Peach, Blueberry Crops Due to Cold |
+18 |
+0 |
+0 |
+0 |
+0 |
+0 |
+0 |
+0 |
+0 |
+0 |
+18 |
+18 |
|
Additional Assistance for Volcanic Activity |
+27 |
+3 |
+0 |
+0 |
+0 |
+0 |
+0 |
+0 |
+0 |
+0 |
+30 |
+30 |
|
Milk Donation Program |
+8 |
+5 |
+5 |
+5 |
+5 |
+5 |
+5 |
+5 |
+5 |
+5 |
+28 |
+53 |
|
Repayment Dairy Risk Coverage Premiums |
+78 |
+0 |
+0 |
+0 |
+0 |
+0 |
+0 |
+0 |
+0 |
+0 |
+78 |
+78 |
|
Dairy Risk Coverage |
+24 |
+14 |
+9 |
+6 |
+6 |
+7 |
+0 |
-1 |
+16 |
+16 |
+59 |
+97 |
|
Agriculture Risk Coverage (ARC) |
+0 |
+0 |
+23 |
+17 |
+20 |
+21 |
+21 |
+23 |
+22 |
+23 |
+61 |
+172 |
|
Subtotal, Title I |
+155 |
+10 |
-35 |
-81 |
-73 |
-70 |
-85 |
-88 |
-66 |
-76 |
-23 |
-408 |
|
Title II—Conservation |
||||||||||||
|
Environmental Quality Incentives Program |
-61 |
-120 |
-138 |
-149 |
-158 |
-171 |
-187 |
-176 |
-163 |
-158 |
-626 |
-1,481 |
|
Conservation Stewardship Program |
-3 |
-25 |
-46 |
-67 |
-88 |
-112 |
-133 |
-155 |
-175 |
-196 |
-229 |
-1,000 |
|
Conservation Reserve Program |
-11 |
+42 |
+47 |
+49 |
+15 |
+11 |
-22 |
-30 |
-50 |
-51 |
+142 |
+0 |
|
Regional Conservation Partnership Program |
+41 |
+71 |
+79 |
+87 |
+96 |
+100 |
+100 |
+100 |
+100 |
+100 |
+374 |
+874 |
|
Agricultural Conservation Easement Program |
+56 |
+115 |
+134 |
+149 |
+175 |
+188 |
+194 |
+197 |
+199 |
+200 |
+629 |
+1,607 |
|
Subtotal, Title II |
+22 |
+83 |
+76 |
+69 |
+40 |
+16 |
-48 |
-64 |
-89 |
-105 |
+290 |
+0 |
|
Title III—Trade |
||||||||||||
|
Trade Promotion, Development |
+52 |
+52 |
+52 |
+52 |
+52 |
+52 |
+52 |
+52 |
+52 |
+52 |
+258 |
+515 |
|
Subtotal, Title III |
+52 |
+52 |
+52 |
+52 |
+52 |
+52 |
+52 |
+52 |
+52 |
+52 |
+258 |
+515 |
|
Title IV—Nutrition |
||||||||||||
|
Interstate Data Matching/Multiple Issuance |
+0 |
-8 |
-25 |
-45 |
-60 |
-80 |
-90 |
-90 |
-95 |
-95 |
-138 |
-588 |
|
Quality Control |
-42 |
-42 |
-42 |
-42 |
-42 |
-42 |
-42 |
-42 |
-42 |
-42 |
-210 |
-420 |
|
Assistance for Community Food Projects |
-4 |
-4 |
-4 |
-4 |
-4 |
-4 |
-4 |
-4 |
-4 |
-4 |
-20 |
-40 |
|
Interactions |
* |
* |
* |
* |
* |
* |
* |
* |
* |
* |
* |
* |
|
Income Verification |
* |
+2 |
+4 |
+3 |
+1 |
+0 |
+0 |
+0 |
+0 |
+0 |
+10 |
+10 |
|
Harvesting Health Pilot Projects |
+4 |
+4 |
+4 |
+4 |
+4 |
+0 |
+0 |
+0 |
+0 |
+0 |
+20 |
+20 |
|
Improvements to EBT System |
+0 |
+2 |
+5 |
+9 |
+8 |
+4 |
+0 |
+0 |
+0 |
+0 |
+24 |
+28 |
|
Food Distribution on Indian Reservations |
+3 |
+3 |
+3 |
+4 |
+4 |
+4 |
+4 |
+4 |
+4 |
+4 |
+17 |
+37 |
|
Definition of Certification Period |
* |
* |
+5 |
+20 |
+30 |
+30 |
+30 |
+30 |
+30 |
+30 |
+55 |
+205 |
|
Emergency Food Assistance Programs |
+12 |
+24 |
+23 |
+23 |
+23 |
+19 |
+20 |
+20 |
+21 |
+21 |
+105 |
+206 |
|
Work Requirements for SNAP |
+5 |
+40 |
+55 |
+55 |
+55 |
+5 |
+5 |
+5 |
+5 |
+5 |
+210 |
+235 |
|
Food Insecurity Nutrition Incentivea |
+8 |
+18 |
+30 |
+45 |
+50 |
+50 |
+50 |
+50 |
+50 |
+50 |
+151 |
+401 |
|
Subtotal, Title IV |
-14 |
+39 |
+58 |
+72 |
+69 |
-14 |
-27 |
-27 |
-31 |
-31 |
+224 |
+94 |
|
Title V—Credit |
+0 |
+0 |
+0 |
+0 |
+0 |
+0 |
+0 |
+0 |
+0 |
+0 |
+0 |
+0 |
|
Title VI—Rural Development |
||||||||||||
|
Cushion of Credit: No New, Reduce Rate |
-140 |
-140 |
-150 |
-190 |
-220 |
-260 |
-280 |
-300 |
-320 |
-350 |
-840 |
-2,350 |
|
Rural Electric Development Loan and Grants |
+0 |
+0 |
+0 |
+4 |
+4 |
+2 |
+0 |
+0 |
+0 |
+0 |
+8 |
+10 |
|
Subtotal, Title VI |
-140 |
-140 |
-150 |
-186 |
-216 |
-258 |
-280 |
-300 |
-320 |
-350 |
-832 |
-2,340 |
|
Title VII |
||||||||||||
|
Biomass Research and Development |
+0 |
+1 |
+2 |
+3 |
+3 |
+3 |
+2 |
+1 |
+0 |
+0 |
+8 |
+15 |
|
Emerging Agricultural Production Research |
+2 |
+3 |
+4 |
+4 |
+4 |
+2 |
+1 |
+0 |
+0 |
+0 |
+17 |
+20 |
|
Foundation |
+200 |
0 |
0 |
0 |
0 |
0 |
0 |
0 |
0 |
0 |
+200 |
+200 |
|
Organic Agricultural Research and Extension |
+24 |
+36 |
+43 |
+48 |
+50 |
+50 |
+50 |
+50 |
+50 |
+50 |
+200 |
+450 |
|
Subtotal, Title VII |
+226 |
+40 |
+48 |
+54 |
+57 |
+55 |
+53 |
+51 |
+50 |
+50 |
+426 |
+685 |
|
Title VIII—Forestry |
+1 |
+1 |
+1 |
+1 |
+1 |
+0 |
+0 |
+0 |
+0 |
+0 |
+5 |
+5 |
|
Title IX—Energy |
||||||||||||
|
Carbon Utilization Education Program |
+2 |
+2 |
+2 |
+2 |
+2 |
0 |
0 |
0 |
0 |
0 |
+10 |
+10 |
|
Bio-based Market Programb |
+3 |
+3 |
+3 |
+3 |
+3 |
+0 |
+0 |
+0 |
+0 |
+0 |
+15 |
+15 |
|
Bioenergy Program for Advanced Biofuelsb |
+3 |
+9 |
+13 |
+14 |
+15 |
+12 |
+6 |
+2 |
+1 |
+0 |
+54 |
+75 |
|
Biomass Crop Assistance Programb |
+9 |
+16 |
+20 |
+22 |
+25 |
+16 |
+8 |
+5 |
+4 |
+0 |
+92 |
+125 |
|
Bio-refinery Assistanceb |
+0 |
+20 |
+40 |
+45 |
+35 |
+10 |
+0 |
+0 |
+0 |
+0 |
+140 |
+150 |
|
Subtotal, Title IX |
+17 |
+50 |
+78 |
+86 |
+80 |
+38 |
+14 |
+7 |
+5 |
+0 |
+311 |
+375 |
|
Title X—Horticulture |
||||||||||||
|
Organic Production and Market Datab |
+1 |
+1 |
+1 |
+1 |
+1 |
+0 |
+0 |
+0 |
+0 |
+0 |
+5 |
+5 |
|
Organic Certification/Trade Tracking/Data |
+1 |
+1 |
+1 |
+1 |
+1 |
+0 |
+0 |
+0 |
+0 |
+0 |
+5 |
+5 |
|
National Organic Certification Cost Shareb |
+9 |
+12 |
+12 |
+12 |
+12 |
+3 |
0 |
0 |
0 |
0 |
+55 |
+58 |
|
Local Agriculture Market Programa |
+33 |
+45 |
+60 |
+60 |
+60 |
+60 |
+60 |
+60 |
+60 |
+60 |
+258 |
+558 |
|
Subtotal, Title X |
+44 |
+59 |
+74 |
+74 |
+74 |
+63 |
+60 |
+60 |
+60 |
+60 |
+323 |
+626 |
|
Title XI—Crop Insurance |
||||||||||||
|
Enterprise Units Across County Lines |
+0 |
-3 |
-3 |
-3 |
-3 |
-3 |
-3 |
-3 |
-3 |
-3 |
-12 |
-27 |
|
Crop Production on Native Sod |
+0 |
-1 |
-1 |
-1 |
-1 |
-1 |
-1 |
-1 |
-1 |
-1 |
-3 |
-7 |
|
Funding for Information Technology |
+0 |
+1 |
+1 |
+0 |
+0 |
+0 |
+0 |
+0 |
+0 |
+0 |
+2 |
+2 |
|
Submission of Policies and Materials to Board |
+0 |
+0 |
+1 |
+1 |
+1 |
+1 |
+1 |
+1 |
+1 |
+1 |
+3 |
+8 |
|
Whole Farm Revenue Agent Incentives |
+0 |
+1 |
+1 |
+1 |
+1 |
+1 |
+1 |
+1 |
+1 |
+2 |
+3 |
+10 |
|
Pasture, Range, Forage Policy Indian Tribes |
+0 |
+1 |
+1 |
+1 |
+1 |
+1 |
+1 |
+1 |
+1 |
+1 |
+5 |
+12 |
|
Subtotal, Title XI |
+0 |
+0 |
+0 |
-1 |
-1 |
+0 |
+0 |
+0 |
+0 |
+0 |
-1 |
-2 |
|
Title XII—Miscellaneous |
||||||||||||
|
Extension of Merchandise Processing Fee |
+0 |
+0 |
+0 |
+0 |
+0 |
+0 |
+0 |
+0 |
-371 |
+0 |
+0 |
-371 |
|
Direct Operation Microloans |
+1 |
+1 |
+1 |
+1 |
+1 |
+0 |
+0 |
+0 |
+0 |
+0 |
+5 |
+5 |
|
Cattle Tick Inspection Emergency Livestock |
+1 |
+1 |
+1 |
+1 |
+1 |
+1 |
+1 |
+1 |
+1 |
+1 |
+4 |
+7 |
|
Administrative Units |
+0 |
+0 |
+1 |
+1 |
+1 |
+1 |
+1 |
+1 |
+1 |
+1 |
+3 |
+7 |
|
Wool Research and Promotion |
+0 |
+2 |
+2 |
+2 |
+2 |
+0 |
+0 |
+0 |
+0 |
+0 |
+9 |
+10 |
|
National Oilheat Research Alliance |
+5 |
+7 |
+7 |
+7 |
+7 |
+7 |
+7 |
+7 |
+7 |
+7 |
+33 |
+68 |
|
Pima Agriculture Cotton Trust Fundb |
+16 |
+16 |
+16 |
+16 |
+16 |
+0 |
+0 |
+0 |
+0 |
+0 |
+80 |
+80 |
|
|
+0 |
+30 |
+30 |
+30 |
+30 |
+0 |
+0 |
+0 |
+0 |
+0 |
+120 |
+121 |
|
Emergency Citrus Trust Fund |
+25 |
+25 |
+25 |
+25 |
+25 |
+0 |
+0 |
+0 |
+0 |
+0 |
+125 |
+125 |
|
Farming Opportunities Training and Outreacha |
+26 |
+40 |
+50 |
+50 |
+50 |
+50 |
+50 |
+50 |
+50 |
+50 |
+216 |
+466 |
|
Subtotal, Title XII |
+73 |
+122 |
+133 |
+133 |
+133 |
+59 |
+59 |
+59 |
-312 |
+59 |
+594 |
+517 |
|
Total Changes in Direct Spending |
+436 |
+314 |
+334 |
+273 |
+215 |
-61 |
-203 |
-250 |
-651 |
-341 |
+1,573 |
+68 |
|
Increases in Revenue: Title XII—Oilheat |
+5 |
+7 |
+7 |
+7 |
+7 |
+7 |
+7 |
+7 |
+7 |
+7 |
+33 |
+68 |
|
Net Effect on the Deficit |
+431 |
+307 |
+327 |
+266 |
+208 |
-68 |
-210 |
-257 |
-658 |
-348 |
+1,540 |
+0 |
Source: CRS, sorted within titles using the CBO cost estimates for the Senate-passed amendment to H.R. 2, https://www.cbo.gov/publication/54284, July 24, 2018.
Notes: * denotes score between -$500,000 and +$500,000. + denotes additional spending or, in the case of revenue, additional revenue. - denotes reduced spending.
a. Denotes a "program without baseline" after FY2018 from the 2014 farm bill (Figure 3) that received new funding in FY2019-2028 and permanent baseline.
b. Denotes a "program without baseline" after FY2018 from the 2014 farm bill (Figure 3) that received new funding in FY2019-2023 but not permanent baseline.
Authorizations for Appendix B.
Discretionary Appropriation
Authorizations
In addition to theproviding mandatory spending figures above,, various sections of the farm bill authorizes appropriations for a variety of existing and new USDA programs. The CBO scores include an estimate of the discretionary spending that would be needed to implement provisions that have authorizations of appropriations. As discussed before, these authorizations are not actual costs to the score of the farm bill (in terms of mandatory spending baseline and score) because such discretionary spending is ultimately determined in future annual appropriations acts.
Although the score of the farm bill is primarily about mandatory spending, some CBO scoring documents include an estimate of the discretionary spending that would be needed to implement provisions that have authorizations of appropriations. The CBO score of the conference agreement did not address discretionary authorizations. However, earlier CBO scores of the House- and Senate-passed bills did summarize the authorizations for appropriation. Overall, the similarity between the scores of these bills may be an indicator of the authorization levels in the enacted farm bill.For the House-passed farm bill, CBO estimated that implementing the provisions of H.R. 2 that specifyauthorize appropriations that may be provided in future discretionary appropriations acts. Such "authorizations for appropriation" are not actual funding but are essentially an indication from the authorizing committees to the appropriations committees about funding intentions. They are subject to budget enforcement via future appropriations bills.
would bewas slightly smaller at $23.7 billion.28 These projections were for the whole bill and not by title. However, the earlier committee-reported scores did estimate the authorizations by title, as shown in Table B-1.29 Because the totals of the chamber-passed versions remain nearly the same as the committee-reported totals, the earlier title-level estimates may be indicative of the conference agreement.
Three titles account for about 85% of the discretionary authorizations for appropriation in the House and Senate committee-reported farm bill scores: Trade, Research, and Rural Development (Table B-1).
Actual funding in annual Agriculture appropriations acts does not necessarily correlate to the authorization for appropriation in the farm bill. The annual authorization for appropriation provided in the 2018 farm bill is between $2 billion and $6 billion (Table B-1), which for this comparison is broadly similar to nearly $7 billion in authorizations for appropriation that were in the 2014 farm bill.30 However, actual discretionary funding in recent Agricultural appropriations acts total in excess of $20 billion.31
The difference is because not all of the actual appropriations have their authorization in each farm bill. For example, the Agriculture appropriations act includes funding for salaries and expenses of USDA agencies that may be permanently authorized or is not necessarily reauthorized in the farm bill. Also, jurisdiction for appropriations acts may include agencies or programs that are not in the jurisdiction of the farm bill authorizing committees (such as the roughly $6 billion appropriation for the Special Supplemental Nutrition Assistance Program for Women, Infants, and Children that is not in House Agriculture Committee jurisdiction).
Table B-1 slightly smaller at $23.7 billion.24
For both of these estimates of chamber-passed authorized appropriations, the projection is for the total of the bill and is not disaggregated across titles or programs. However, the earlier committee-reported scores of the respective farm bills do estimate amounts by title, as shown in Table 5.25 The committee-reported totals are nearly the same as the chamber-passed totals, thus making the earlier title-level estimates relatively reliable indicators of the distribution across titles for the authorizations of appropriation that are made in each chamber-passed bill.
The title-level CBO estimate of discretionary spending that is authorized in the farm bill is similar between the House and Senate bills. Three titles account for about 85% of the discretionary authorizations: Trade, Research, and Rural Development.
The bill-level estimates that sum to between $2 billion and $6 billion per year do not reflect total annual appropriations for agencies or programs in the roughly $20 billion Agriculture appropriations act.26 Not all of the authorizations of appropriations that are funded in the Agriculture appropriations act are made in the farm bill. For example, the annual Agriculture appropriations act includes funding for (1) agencies or programs that are not in the jurisdiction of the farm bill authorizing committees (e.g., the roughly $6 billion Special Supplemental Nutrition Assistance Program for Women, Infants, and Children is not in the jurisdiction of the House Agriculture Committee or the farm bill) and (2) appropriations for salaries and expenses that may be permanently authorized or not necessarily reauthorized in the farm bill. CBO did not estimate the cost of implementing provisions that do not have a specific authorization amount.
|
Fiscal year |
|
|||||
|
|
2019 |
2020 |
2021 |
2022 |
2023 |
FY2019-23 |
|
House -passed H.R. 2 |
|
|
|
|
|
|
|
Commodities |
na |
na |
na |
na |
na |
na |
|
Conservation |
106 |
144 |
157 |
165 |
165 |
737 |
|
Trade |
874 |
2,130 |
2,417 |
2,533 |
2,578 |
10,532 |
|
Nutrition |
74 |
79 |
80 |
80 |
80 |
393 |
|
Credit |
248 |
257 |
257 |
257 |
257 |
1,274 |
|
Rural Infrastructure and Economic Development |
179 |
490 |
826 |
1,159 |
1,292 |
3,945 |
|
Research |
756 |
1,183 |
1,479 |
1,479 |
1,479 |
6,374 |
|
Forestry |
56 |
81 |
94 |
102 |
105 |
437 |
|
Horticulture |
51 |
62 |
65 |
67 |
69 |
313 |
|
Crop Insurance |
na |
na |
na |
na |
na |
na |
|
Miscellaneous |
34 |
54 |
60 |
60 |
60 |
268 |
|
Subtotal (committee-reported score) |
2,378 |
4,479 |
5,433 |
5,900 |
6,084 |
24,273 |
|
Changes added after floor passage |
37 |
40 |
41 |
41 |
41 |
200 |
|
Total (House-passed score) |
2,415 |
4,519 |
5,474 |
5,941 |
6,125 |
24,473 |
|
Senate -passed amendment to H.R. 2 |
|
|
|
|
|
|
|
Commodities |
na |
na |
na |
na |
na |
na |
|
Conservation |
178 |
259 |
293 |
315 |
315 |
1,359 |
|
Trade |
878 |
2,139 |
2,427 |
2,544 |
2,589 |
10,577 |
|
Nutrition |
7 |
14 |
11 |
10 |
5 |
47 |
|
Credit |
172 |
173 |
173 |
173 |
173 |
862 |
|
Rural Development |
132 |
333 |
520 |
690 |
764 |
2,440 |
|
Research |
864 |
1,278 |
1,566 |
1,559 |
1,559 |
6,826 |
|
Forestry |
-24 |
-14 |
9 |
23 |
31 |
26 |
|
Energy |
31 |
78 |
126 |
159 |
176 |
570 |
|
Horticulture |
37 |
51 |
54 |
56 |
58 |
255 |
|
Crop Insurance |
na |
na |
na |
na |
na |
na |
|
Miscellaneous |
95 |
149 |
157 |
157 |
157 |
713 |
|
Subtotal (committee-reported score) |
2,370 |
4,461 |
5,334 |
5,685 |
5,825 |
23,675 |
|
Changes added after floor passage |
1 |
4 |
4 |
1 |
0 |
10 |
|
Total (Senate-passed score) |
2,371 |
4,465 |
5,338 |
5,686 |
5,825 |
23,685 |
Source: CRS, compiled from (1) title-level amounts in CBO, "H.R. 2, as Reported by the House Agriculture Committee," May 2, 2018; and CBO, S. 3042 as Reported by the Senate Agriculture Committee," June 21, 2018; and (2) the updated total in CBO, "Cost Estimates for H.R. 2 as Passed by the House and as Passed by the Senate," July 24, 2018.
Note: "na" indicates that CBO did not estimate the cost of implementing provisions that do not have a specific authorization amount.
Author Contact Information
Footnotes
| 1. |
CRS | |||||||||||
| 2. | CRS Report R45210, Farm Bills: Major Legislative Actions, 1965-2018. 2.
|
CRS In Focus IF10187, Farm Bill Primer: What Is the Farm Bill? |
||||||||||
| 3. |
CRS Report | |||||||||||
| 4. |
|
|||||||||||
| 5. |
CRS Report RL31704, A New Farm Bill: Comparing the 2002 Law with Previous Law and House and Senate Bills (available from the author). |
|||||||||||
| 6. |
CRS Report RL34696, The 2008 Farm Bill: Major Provisions and Legislative Action. |
|||||||||||
| 7. |
CRS Report R42484, Budget Issues That Shaped the 2014 Farm Bill. For more about continuing sequestration issues for the farm bill, see the Appendix in CRS Report R45230, Agriculture and Related Agencies: FY2019 Appropriations. |
|||||||||||
| 8 |
CRS Report RS22131, What Is the Farm Bill? |
|||||||||||
|
CRS Report R44606, The Commodity Credit Corporation: In Brief. |
||||||||||||
|
For example, see CRS Report R45230, Agriculture and Related Agencies: FY2019 Appropriations. |
||||||||||||
| 11. |
See CRS Report 98-560, Baselines and Scorekeeping in the Federal Budget Process. |
|||||||||||
|
For example, the CBO baselines for the primary farm commodity and nutrition programs remain positive through |
||||||||||||
|
See Section 257 of the Balanced Budget and Emergency Deficit Control Act of 1985 (2 U.S.C. 907), as explained by CBO, The Budget and Economic Outlook: Fiscal Years 2018 to 2028, April 2018, pp. 47 and 54, https://www.cbo.gov/publication/53651. |
||||||||||||
|
|
13.
CRS Report R44758, Farm Bill Programs Without a Budget Baseline Beyond FY2018. See also CRS In Focus IF10780, Farm Bill Primer: Programs Without Baseline Beyond FY2018. |
CBO, "Baseline Projections for Selected Programs," April 2018, |
||||||||||
|
Although the farm bill is | ||||||||||||
| 16. |
CRS Report R44758, Farm Bill Programs Without a Budget Baseline Beyond FY2018. |
|||||||||||
| 17. |
CRS In Focus IF10780, Farm Bill Primer: Programs Without Baseline Beyond FY2018. |
|||||||||||
|
CRS Report RL31943, Budget Enforcement Procedures: The Senate Pay-As-You-Go (PAYGO) Rule. |
||||||||||||
|
CBO, " |
||||||||||||
|
CBO, "H.R. 2, Agriculture and Nutrition Act of 2018, as |
||||||||||||
|
CBO, " |
||||||||||||
|
CBO, " |
||||||||||||
|
CBO, "Payment Limitations in H.R. 2, the Agriculture and Nutrition Act of 2018," https://www.cbo.gov/publication/54450, September 6, 2018. |
||||||||||||
|
|
CRS Report R44758, Farm Bill Programs Without a Budget Baseline Beyond FY2018. See also CRS In Focus IF10780, Farm Bill Primer: Programs Without Baseline Beyond FY2018. 23.
|
|
For example, see CBO, Baseline Projections for Selected Programs, especially for the "USDA Mandatory Farm Programs" and the "Supplemental Nutrition Assistance Program," January 2019, at https://www.cbo.gov/about/products/baseline-projections-selected-programs. 24.
|
|
CRS In Focus IF11087, 2018 Farm Bill Primer: SNAP and Nutrition Title Programs. 25.
|
|
CRS Report R45193, Federal Crop Insurance: Program Overview for the 115th Congress. 26.
|
|
CRS Report R44914, Farm Safety-Net Payments Under the 2014 Farm Bill: Comparison by Program Crop. 27.
|
|
CRS In Focus IF10679, Farm Bill Primer: The Conservation Title. |
CBO, "Cost Estimates for H.R. 2 as Passed by the House of Representatives and as Passed by the Senate |
|
CBO, "H.R. 2, Agriculture and Nutrition Act of 2018, as Reported by the House Agriculture Committee CBO, "S. 954, Agriculture Reform and Risk Management Act of 2013," May 17, 2013; and CBO, "H.R. 1947, Agriculture Reform and Risk Management Act of 2013, June 5, 2013. |
||||||||||||
|
For example, see CRS Report R45230, Agriculture and Related Agencies: FY2019 Appropriations. |