Recent Slower Economic Growth in the United States: Policy Implications
The current economic expansion is the longest in recorded U.S. history, but it has not been characterized by rapid economic growth. From the beginning of the current economic expansion in the third quarter of 2009 to the second quarter of 2017, this expansion had the lowest economic growth rate of any expansion since World War II, averaging 2.2%. For the next five quarters, growth accelerated to 3.1%. However, growth has slowed since, averaging 2.1% over the next four quarters beginning in the fourth quarter of 2018. The slower growth rate has been widespread, but has been particularly concentrated in business investment and exports. Private forecasters expect this slower pace to continue in 2020. A similar growth pattern has not been observed in labor markets, as monthly employment growth was only slightly lower in the slower-growth period than in the faster-growth period.
A number of developments have influenced growth since 2017:
Fiscal policy. The federal budget deficit rose from 3.5% of gross domestic product (GDP) in FY2017 to 3.9% in FY2018. Deficit-financed tax or spending policy changes stimulate overall economic activity in the short run, but stimulus fades over time. The deficit increased partly as a result of P.L. 115-97, which cut taxes beginning in calendar year 2018, with the budgetary effects peaking in FY2019.
Monetary policy. The Federal Reserve raised short-term interest rates gradually from a range of 0.25%-0.5% in December 2016 to a range of 2.25%-2.5% in December 2018. Higher interest rates reduce interest-sensitive spending, such as business investment and consumer durables. Rates were then cut in 2019 to a range of 1.5%-1.75%.
Regulatory policy. The Administration reported that agencies have undertaken 393 deregulatory actions and 52 significant regulatory actions since FY2017, at a net benefit totaling $50.9 billion, based on agency estimates. Deregulatory actions that reduced costs for businesses could boost their output levels.
Trade policy. Since 2017, the Administration has proposed a series of escalating tariffs and other import restrictions on major trading partners, such as China. In response, affected countries have often proposed retaliatory trade restrictions on U.S. exports. Trade restrictions have a mixed direct effect on growth through their impact on U.S. exports and imports. However, they are generally thought to have a negative indirect effect on growth through their impact on real income, financial conditions, and business investment.
Stock market. Stock prices (as measured by the S&P 500 index) rose by 38% between November 4, 2016, and January 26, 2018, with little volatility by historical standards. Since then, volatility has risen. Favorable financial conditions make it easier for firms to finance investment and may lead asset holders to consume more through a wealth effect.
Global growth. Global growth fell from 3.8% in 2017 to 3.6% in 2018 to a projected 3.0% in 2019. This reduces foreign demand for U.S. exports, all else equal.
Over time, economists believe that the economy cannot grow faster than its trend or potential growth rate, which is determined by how quickly labor, the capital stock, and productivity grow. It appears that the growth rate has reverted to its trend growth rate since the fourth quarter of 20s18. Regulatory policy changes and fiscal stimulus may have contributed to the temporary increase in growth, but do not appear to have led to a permanent acceleration in trend growth.
This slower rate of growth would be problematic if growth continued to decelerate toward zero, but most forecasters do not expect this to happen. On the contrary, this slower rate of growth could make a recession less likely because it reduces the probability that the economy will overheat, which has been the cause of some past recessions. It is unusual for fiscal and monetary policy to remain stimulative when the economy has fully recovered from a recession. As a result, there is less remaining headroom than usual for the Federal Reserve to reduce interest rates (monetary stimulus) or Congress to increase the deficit (fiscal stimulus) going forward. Policymakers face a choice between maintaining existing fiscal and monetary stimulus to maintain growth and removing stimulus so that there is more scope to employ stimulus in the next recession.
Recent Slower Economic Growth in the United States: Policy Implications
Jump to Main Text of Report
Contents
- Introduction: Recent Growth Trends
- Growth by Sector
- Actual Growth Rates and Potential Growth Rates
- Factors Affecting Growth Since 2017
- Fiscal Policy
- Monetary Policy
- Regulatory Relief
- Stock Market and the Wealth Effect
- Consumer and Business Confidence
- Trade Policy Uncertainty
- Slowdown in Global Growth and Strong Dollar
- Future Prospects and Policy Implications
Summary
The current economic expansion is the longest in recorded U.S. history, but it has not been characterized by rapid economic growth. From the beginning of the current economic expansion in the third quarter of 2009 to the second quarter of 2017, this expansion had the lowest economic growth rate of any expansion since World War II, averaging 2.2%. For the next five quarters, growth accelerated to 3.1%. However, growth has slowed since, averaging 2.1% over the next four quarters beginning in the fourth quarter of 2018. The slower growth rate has been widespread, but has been particularly concentrated in business investment and exports. Private forecasters expect this slower pace to continue in 2020. A similar growth pattern has not been observed in labor markets, as monthly employment growth was only slightly lower in the slower-growth period than in the faster-growth period.
A number of developments have influenced growth since 2017:
- Fiscal policy. The federal budget deficit rose from 3.5% of gross domestic product (GDP) in FY2017 to 3.9% in FY2018. Deficit-financed tax or spending policy changes stimulate overall economic activity in the short run, but stimulus fades over time. The deficit increased partly as a result of P.L. 115-97, which cut taxes beginning in calendar year 2018, with the budgetary effects peaking in FY2019.
- Monetary policy. The Federal Reserve raised short-term interest rates gradually from a range of 0.25%-0.5% in December 2016 to a range of 2.25%-2.5% in December 2018. Higher interest rates reduce interest-sensitive spending, such as business investment and consumer durables. Rates were then cut in 2019 to a range of 1.5%-1.75%.
- Regulatory policy. The Administration reported that agencies have undertaken 393 deregulatory actions and 52 significant regulatory actions since FY2017, at a net benefit totaling $50.9 billion, based on agency estimates. Deregulatory actions that reduced costs for businesses could boost their output levels.
- Trade policy. Since 2017, the Administration has proposed a series of escalating tariffs and other import restrictions on major trading partners, such as China. In response, affected countries have often proposed retaliatory trade restrictions on U.S. exports. Trade restrictions have a mixed direct effect on growth through their impact on U.S. exports and imports. However, they are generally thought to have a negative indirect effect on growth through their impact on real income, financial conditions, and business investment.
- Stock market. Stock prices (as measured by the S&P 500 index) rose by 38% between November 4, 2016, and January 26, 2018, with little volatility by historical standards. Since then, volatility has risen. Favorable financial conditions make it easier for firms to finance investment and may lead asset holders to consume more through a wealth effect.
- Global growth. Global growth fell from 3.8% in 2017 to 3.6% in 2018 to a projected 3.0% in 2019. This reduces foreign demand for U.S. exports, all else equal.
Over time, economists believe that the economy cannot grow faster than its trend or potential growth rate, which is determined by how quickly labor, the capital stock, and productivity grow. It appears that the growth rate has reverted to its trend growth rate since the fourth quarter of 20s18. Regulatory policy changes and fiscal stimulus may have contributed to the temporary increase in growth, but do not appear to have led to a permanent acceleration in trend growth.
This slower rate of growth would be problematic if growth continued to decelerate toward zero, but most forecasters do not expect this to happen. On the contrary, this slower rate of growth could make a recession less likely because it reduces the probability that the economy will overheat, which has been the cause of some past recessions. It is unusual for fiscal and monetary policy to remain stimulative when the economy has fully recovered from a recession. As a result, there is less remaining headroom than usual for the Federal Reserve to reduce interest rates (monetary stimulus) or Congress to increase the deficit (fiscal stimulus) going forward. Policymakers face a choice between maintaining existing fiscal and monetary stimulus to maintain growth and removing stimulus so that there is more scope to employ stimulus in the next recession.
Introduction: Recent Growth Trends
Economic growth (the percentage change in real gross domestic product [GDP]) is a core measure of economic progress and well-being.1 Over time, the rates of job growth and average income growth closely track economic growth.
A notable feature of the current economic expansion, which started in June 2009 and is now the longest expansion on record, has been its relatively modest economic growth rate.2 Whereas growth has averaged 4.3% in the previous 10 economic expansions, it has averaged 2.3% in this expansion. Some analysts thought a turning point had been achieved when growth accelerated to 3.1% from the third quarter of 2017 through the third quarter of 2018. This was the second-fastest period of sustained growth achieved in this expansion, second only to the 3.8% growth achieved from the second quarter of 2014 through the second quarter of 2015. However, in both of those cases, growth slowed in the following quarters. It has averaged 2.1% over the next four quarters, from the fourth quarter of 2018 to the present—nearly identical to the growth rate in this expansion before the third quarter of 2017. Growth is volatile, difficult to measure, and revised several times after it is initially released. Nevertheless, the pace of activity appears to have noticeably slowed. Growth in three of the past four quarters was 2.1% or lower, and private forecasters expect this slower pace to continue in the fourth quarter of 2019 and through 2020.3 The slower growth has been widespread throughout the country. The only regions not affected by the slowdown were the Southwest, Rocky Mountains, and New England.4
Although economic growth has slowed recently, it has not been negative or close to zero in any quarter since the fourth quarter of 2015. (The lowest growth rate since then was 1.1% in the fourth quarter of 2018.) Thus, the recent story so far is one of a transition to a soft landing (a more moderate rate of growth), not a recession or cessation of growth. In fact, for reasons discussed in this report, it is more likely that the fast-growth period was the aberration.
Economic growth is only one measure of economic performance, and not all measures move in lockstep over short periods of time. The recent slowdown in economic growth was much more pronounced than the slowdown in employment growth—monthly job growth was only slightly lower (191,000) from October 2018 to November 2019 than from July 2017 to September 2018 (203,000). The average monthly job growth rate from October 2010 to the present has been 199,000. In other words, to date, the economic growth slowdown has not made employers significantly less willing to take on additional workers.
Although it is not unusual for economic growth to rise and fall within an expansion, it is nevertheless potentially useful for Congress to consider the reasons why growth rose from the third quarter of 2017 through the third quarter of 2018 (hereinafter, the faster-growth period) and declined since the fourth quarter of 2018 (hereinafter, the slower-growth period) when considering policy options to address growth going forward. These periods are chosen because quarterly growth rates are closely clustered together within those two periods.5 This report analyzes the most commonly discussed reasons.
Growth by Sector
Table 1 breaks GDP down into its component parts to highlight where the growth slowdown has been concentrated. Comparing the faster-growth period from the third quarter of 2017 to the third quarter of 2018 with the slower-growth period from the fourth quarter of 2018 to the third quarter of 2019, the slowdown has been concentrated in fixed business investment spending (specifically, private structures and equipment) and exports. Investment spending on structures, which include office buildings, factories, and power and communication infrastructure, fell from a growth rate of 3.7% in the former period to a 6.5% contraction in the latter period. The decline in structures has been widespread, but has been particularly notable in the category of mining exploration, shafts, and wells—a category of spending that is highly sensitive to commodity prices. The slowdown in equipment spending has been most notable in transportation equipment.
Other components of GDP have not grown rapidly recently, but nevertheless do not explain the slowdown. Growth in personal consumption spending (specifically, services) has slowed, but by less than overall growth has slowed. Residential investment (new house construction) shrank by about 1% in both periods, having no effect on the overall difference between the two. Growth in government purchases was a little higher—thereby boosting growth—in the latter period.6 Import growth was lower in the latter period, which, in national accounting, increased growth.
Table 1. Growth in GDP and Selected Component Parts Since the Third Quarter of 2017
(average annualized percentage change)
|
2017:Q3-2018:Q3 |
2018:Q4-2019:Q3 |
|
|
GDP |
3.1 |
2.1 |
|
Personal Consumption |
3.2 |
2.6 |
|
Fixed Business Investment |
5.9 |
1.5 |
|
Structures |
3.7 |
-6.5 |
|
Equipment |
6.4 |
1.1 |
|
Intellectual Property |
7.1 |
7.7 |
|
Residential Investment |
-1.0 |
-1.0 |
|
Exports |
3.0 |
0.2 |
|
Imports |
5.0 |
1.0 |
|
Government Purchases |
1.8 |
2.3 |
Source: CRS calculations of U.S. Bureau of Economic Analysis data.
Actual Growth Rates and Potential Growth Rates
Although growth fluctuates considerably from quarter to quarter, economists believe that the economy can grow no faster than its internal speed limit—called the potential or trend growth rate—over longer periods of time. Over shorter periods of time, the primary determinant of growth is the business cycle. The business cycle refers to the repeated pattern of recessions (contractions in economic activity) followed by (longer) expansions, which are then followed by another recession, and so on.7 Average growth over an entire business cycle of normal length would be expected to be close to the potential growth rate. After recessions, in which output has fallen considerably, there is scope for a period of rapid catch-up growth that brings unused labor and capital resources back into use. The current economic expansion is already the longest recorded expansion in U.S. history, so at this point it would not be expected that the economy could grow faster than its potential growth rate for a sustained period because there is no scope for catch-up growth—the economy's labor and capital inputs are close to fully employed. In these conditions, growth may temporarily exceed trend growth, but it would be expected to return to trend growth fairly quickly. At this point, the main debates are what the trend growth rate is and whether it can be raised through structural policy changes.
Growth can rise or fall over a period of time for cyclical or structural reasons. Cyclical contributions to growth are mainly demand driven—they are a function of how fast spending in the economy is growing. The government can temporarily influence spending through fiscal and monetary policy. Cyclical effects can have a large influence on growth over a few quarters, but are, by their nature, temporary.
Structural contributions to trend growth are mainly supply driven—they are a function of how quickly the labor force (both its quantity and quality), the capital stock, and productivity (i.e., how much output can be generated with a given set of inputs) are growing. The reason average growth has been low over the course of the expansion is because all three have grown at a slower pace compared to the 1950 to 2007 average, according to the Congressional Budget Office (CBO), as seen in Figure 1.8 The labor force has grown more slowly because of the decline in labor force participation and the aging of the workforce, as the baby boomers have begun to transition to retirement. After stripping out cyclical factors, CBO projects that the labor force grew by 1.4% annually from 1950 to 2018, but will grow by 0.4% annually over the next 10 years—close to the 0.6% growth rate recorded from 2008 to 2018. Average productivity growth declined by more than one-half and investment growth fell by more than one-third in the 2008-2018 period compared to 1950-2007. The reasons for the slowdown in the growth of investment and productivity are less clear and more debated.9
|
Figure 1. Trend Output Growth by Its Sources, 1950-2029 Nonfarm Business Sector |
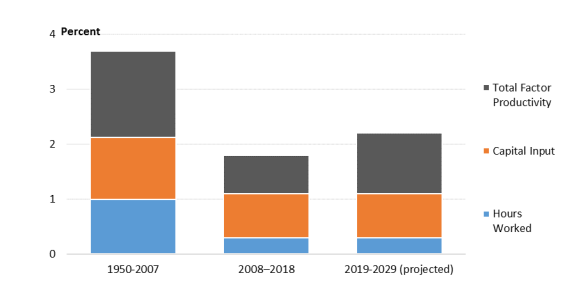 |
|
Source: CRS calculations based on CBO, An Update to the Budget and Economic Outlook, Table 2-5, August 2019. |
The recent faster-growth period was comparable to CBO's estimate of the trend growth rate from 1974 to 2001. If the faster-growth period was driven by an increase in trend growth, it could potentially continue indefinitely. CBO and other economic forecasters do not view this growth acceleration as having been driven by a structural acceleration in trend growth, however.10 CBO expects some improvement in productivity growth over the next 10 years, but projects that overall trend growth will continue to be held back by low growth in the labor force and capital stock. If CBO is correct, the current growth slowdown was inevitable at some point, as it represented growth reverting to trend. The next section describes some of the major economic developments since 2017 that might have boosted growth temporarily above trend, and some subsequent developments that may have contributed to the slowdown.
Factors Affecting Growth Since 2017
Several explanations have been offered as to why growth accelerated beginning in 2017, including fiscal stimulus, regulatory relief, favorable financial conditions, and higher consumer and business confidence. Although these explanations seem to match the growth acceleration well, they have more trouble explaining why growth subsequently slowed, and they do not always match the exact timing of the acceleration.
Several explanations have been offered for why growth decelerated beginning in 2018. The factors discussed below in more detail are a fading of fiscal stimulus, monetary policy tightening, trade policy uncertainty, and a slowdown in global growth. The timing of these factors does not match the timing of the slowdown precisely, which points to the possibility that a return to the trend growth rate was inevitable. The factors discussed below are not comprehensive; other factors that have likely contributed to slower growth in at least one quarter since the fourth quarter of 2018 include the FY2018 government shutdown, the rise in oil prices in 2018 (they have since declined), problems that slowed Boeing's production of the 737 MAX airplane, and the GM-United Auto Workers strike. However, these factors are not discussed at length because they were one-off occurrences that were temporary in nature and may have limited implications for policy going forward.
Fiscal Policy
Fiscal stimulus can boost aggregate demand (i.e., total spending) in the short run through higher government spending or lower taxes that are deficit financed. Increases in deficit-financed government spending on goods and services boost total spending in the economy directly because government spending is a component of GDP. Deficit-financed tax cuts increase total spending to the extent that they are spent by their recipients.11 The effect of fiscal stimulus on growth is temporary because, by nature, total spending cannot exceed total potential output for long—especially when the economy is already close to full employment, as it is today.12 In addition, certain types of tax cuts alter incentives to work, save, and invest. These changes could affect potential output (supply-side effects) in addition to total spending (demand-side effects).13
Policy changes on both the tax and spending sides of the budget enlarged the deficit in FY2018 relative to the current-law baseline for that year. Notably, the tax cuts in the 2017 act, P.L. 115-97, began in calendar year 2018, with the budgetary effects peaking in FY2019.14 The Bipartisan Budget Act of 2018 (P.L. 115-123) increased the Budget Control Act's (P.L. 112-25's) discretionary spending caps, and those increases—combined with increases in discretionary spending not subject to the caps—increased discretionary spending relative to the CBO baseline by $94 billion in FY2018.15 These discretionary spending changes provided fiscal stimulus compared to current law but not compared to recent policy—discretionary spending was a steady 6.2% of GDP in both FY2017 and FY2018. In other words, compared to the previous year, the legislative changes to boost discretionary spending prevented contractionary fiscal policy from occurring. Mandatory spending fell because spending on health programs and automatic stabilizers (benefits where spending levels are sensitive to economic conditions) grew more slowly in dollar terms than GDP. Statutory changes to mandatory spending levels in FY2018 were minimal, and thus were not responsible for the decline.
CBO projected that the tax cuts would boost GDP growth relative to the baseline by 0.3 percentage points in both FY2018 and FY2019.16 This estimate included demand-side and supply-side effects.17 Thus, based on CBO's projections, the tax cuts can help explain why growth accelerated in the faster-growth period, but cannot explain why growth subsequently slowed, because fiscal stimulus from the tax cuts left growth unchanged in FY2019 from the previous year. Relative to the baseline, the boost to growth from the tax cuts is projected to gradually fade beginning in FY2020 and eventually reduce growth beginning in FY2025.
The federal budget deficit rose from 3.5% of GDP in FY2017 to 3.9% of GDP in FY2018. The increase was caused by the decline in revenues from 17.2% of GDP in FY2017 to 16.5% of GDP in FY2018. By contrast, spending fell as a percentage of GDP between FY2017 and FY2018, which would reduce the deficit as a share of GDP, all else equal.18
The federal budget deficit as a percentage of GDP rose in FY2019 from 3.9% to 4.5%, which would seem to indicate additional fiscal stimulus to the economy. However, a closer look at the data reveals that the stimulus is more limited than the increase in the deficit would indicate. Part of the increase in the deficit is attributable to a rise in mandatory spending and net interest payments as a share of GDP, but the increase is not caused by policy changes in either of these cases. Instead, spending in these categories increased as economic conditions and programs' take-up rates changed. Part of the increase in the deficit is attributable to a further decrease in revenues as a percentage of GDP, but this is also not due to additional policy changes. Instead, it is primarily because this was the first full fiscal year in which P.L. 115-97's tax cuts were in place. The main fiscal stimulus was a small boost to discretionary spending, from 6.2% of GDP in FY2018 to 6.3% in FY2019.19
Fiscal stimulus works by changing policy to increase spending or reduce revenue from year to year. With policy changes having a modest effect on spending and revenue as a share of GDP, additional stimulus compared to the previous year was modest in FY2019. In other words, fiscal policy was not projected to cause growth to slow, but neither was it projected to provide a further boost to growth from what had been provided the previous year.
Monetary Policy
The Federal Reserve (Fed) can temporarily influence growth through its control of short-term interest rates. The Fed tightened monetary policy from December 2016 to December 2018, with short-term interest rates gradually increased from a range of 0.25%-0.5% to a range of 2.25%-2.5%.20 This reduced the amount of monetary stimulus that the Federal Reserve was providing to the economy in response to higher growth by decreasing demand for interest-sensitive goods and services, such as business investment and consumer durables. This tightening mostly occurred during the higher-growth period, but because monetary policy affects the economy with a lag, the full economic effects of this tightening were not felt until after the last rate increase in December 2018.
In 2019, the Fed changed course, reducing interest rates three times between August and October in response to slower growth and fears of a potential recession. After the last rate cut in October, interest rates were lower than the inflation rate again, marking a more stimulative (expansionary) course. Because of the lags in effectiveness, these reductions should provide a stimulative boost to the economy in the coming quarters.
Regulatory Relief
Throughout the Trump Administration, agencies have emphasized regulatory relief for businesses through legislation and the rulemaking process. On January 30, 2017, the Administration issued an executive order that required all agencies to identify at least two existing regulations to be repealed for each new regulation they proposed.21 To support this executive order, the Office of Information and Regulatory Affairs (OIRA) has published regulatory reform reports each year.22 Although not all of the regulatory changes reported provide relief for business, these reports provide a comprehensive list of regulatory actions that increase costs (which they classify as regulatory actions) or reduce costs (which they classify as deregulatory actions) on net and an estimate of net cost savings since FY2017. The reports do not include agencies defined as independent in 44 U.S.C. §3502, however, so deregulatory actions by independent agencies that promulgate economic rules, such as financial regulators, are omitted. For this reason, the table undercounts total regulatory and deregulatory actions.23 As shown in Table 2, agencies have undertaken 393 deregulatory actions and 52 significant regulatory actions since FY2017, at a net benefit totaling $50.9 billion, based on agency estimates.24
|
Fiscal Year |
Deregulatory Actions |
Significant Deregulatory Actions |
Significant Regulatory Actions |
Net Cost |
|
2017 |
67 |
n/a |
3 |
-$14.0 |
|
2018 |
57 |
14 |
-$23.4 |
|
|
2019 |
150 |
61 |
35 |
-$13.5 |
|
Total |
393 |
n/a |
52 |
-$50.9 |
Source: OIRA, Regulatory Reform: Completed Actions for Fiscal Year 2017; OIRA, Regulatory Reform Under Executive Order 13771: Final Accounting for Fiscal Year 2018; OIRA, Regulatory Reform Under Executive Order 13771: Final Accounting for Fiscal Year 2019.
Notes: N/a = not available. OIRA defines deregulatory actions as final rules, guidance, actions related to regulatory cooperation, and information collection requests that impose total costs less than zero. OIRA defines significant deregulatory actions as deregulatory actions that reduce total costs by $100 million or more or meet other specified criteria. OIRA defines regulatory actions as significant final rules and guidance that impose total costs of $100 million or more or meet other specified criteria; thus, the table labels these as significant regulatory actions. These totals do not include certain independent agencies. Net cost is measured on a net present value basis. Negative net cost implies that benefits exceed costs for the sum of these actions.
Quantitative estimates of how regulations affect economic growth vary widely, and a comprehensive tally is difficult because of differences in methodology between estimates and the possibility that separate regulations may have interactive effects when considered jointly. The $50.9 billion estimate in Table 2 is not an estimate of the effect on GDP. Regulatory changes can have a broad array of costs and benefits that can be assigned monetary values (subject to a high degree of uncertainty), but not all of those costs and benefits affect the production of goods and services. Examples include effects on health, safety, and the environment.
The fact that deregulatory actions have continued at a similar pace in the slower-growth period suggests the limits that these actions may have on overall growth. Deregulatory actions that affect single industries (or a subset of firms within an industry) can be important for output growth within that industry, but any given industry individually makes up a small share of the overall economy.25 Moreover, regulatory changes are likely to have one-off effects on GDP growth (i.e., they raise the level of output once), as opposed to permanently increasing growth rates (which would require output to continually grow more rapidly each year in the future). In other words, companies may respond to a regulatory change that lowers their costs by boosting output, but once that transition is complete, output will likely stay at the higher level and growth will likely revert to its previous pace.
Stock Market and the Wealth Effect
The stock market's performance may have contributed to faster growth. The S&P 500 index (an index of large stock prices) rose by 38% between November 4, 2016, and January 26, 2018, with relatively little volatility by historical standards.
Higher equity prices can temporarily boost economic growth through their effects on companies and stockholders. When a stock rises in value, it improves the stock-issuing company's financial condition, which may induce more physical investment spending. As shown in Table 1, business investment spending was noticeably higher in the faster-growth period than in the slower-growth period. For holders of stocks and other assets, a rise in their assets' value may also induce a wealth effect, whereby their consumption spending increases in response to their improved net worth. In terms of overall wealth, the ratio of household net worth to income is now higher than it was before the 2007-2009 financial crisis or the dotcom bubble, which burst in 2000.26 The exact size of the wealth effect is uncertain, however, because the direction of causation is unclear—using stock prices as an example, more consumption could raise the value of firms producing the goods and services being consumed or higher stock prices could induce stockholders to consume more.
The period of faster economic growth outlasted the period of the stock market's best performance, but the stock market did not perform poorly after January 2018. The S&P 500's value in August 2019 was about the same as in January 2018, with significant volatility over that period, featuring several steep and sudden declines followed by rebounds. Since October 2019, the stock market has steadily risen again.
Consumer and Business Confidence
Surveys on consumer sentiment showed an increase in confidence in December 2016—before growth accelerated.27 Confidence remained high through 2018, but was more volatile in 2019 (although it remained high compared to levels registered in the past two recessions). All else equal, higher consumer confidence may help explain why consumption growth was strong.
Business confidence was high in 2018, but volatile in 2017 and the first half of 2019 and lower in the second half of 2019, according to surveys.28 All else equal, greater business confidence may lead firms to hire more workers and undertake more physical investment spending. As shown in Table 1, physical investment spending grew much more quickly in the faster-growth period than the slower-growth period.
In interpreting these developments, it is important to note that the direction of causation is unclear—greater consumer and business confidence may be a reaction to higher economic growth, rather than a driver of economic growth.
Trade Policy Uncertainty
Since 2017, the Administration has proposed a series of escalating tariffs and other import restrictions on major trading partners, such as China and the European Union. In response, affected countries have often proposed retaliatory trade restrictions on U.S. exports. Collectively, these proposed and implemented trade restrictions have popularly been referred to as a trade war to denote the broader scope of trade restrictions undertaken compared to the past. This section considers the joint economic impact of restrictions on U.S. imports and retaliatory foreign restrictions on U.S. exports.29
In the short term, changes in trade policy disrupt the production of goods and services that are exported or imported, or that rely on exports and imports as intermediate goods. In national accounting, exports are part of GDP and imports are subtracted from GDP (because they are not goods and services produced in the United States). Thus, trade restrictions negatively affect GDP through their effects on U.S. exports and U.S. goods reliant on imports, but positively affect GDP through their effects on U.S. imports and U.S. import-competing goods in the short run. The data bear this out: although many factors affect trade, export and import growth have both declined to close to zero since overall growth has slowed. Export growth fell from an average of 3.0% from the third quarter of 2017 to the third quarter of 2018 to 0.2% from the fourth quarter of 2018 to the third quarter of 2019, and import growth fell from an average of 5.0% to 0.9% over the same periods.
Besides the direct mixed effect that trade restrictions have had on growth through their effect on exports and imports, they are viewed as having a negative indirect effect on growth through their effect on real income (because U.S. consumers face higher prices on imports, their overall purchasing power falls), financial conditions (if trade restrictions cause asset prices to fall or interest rates to rise), and business investment (because firms might hesitate to undertake large capital purchases if their business outlook is uncertain due to trade policy uncertainty). Although uncertainty is an inherently subjective measure, the International Monetary Fund (IMF) has attempted to quantify trade policy uncertainty, and finds that it was far higher in 2019 than at any point since the start of its index (1995).30 Finally, to the extent that trade uncertainty explains the appreciation of the dollar (discussed in the next section), this could partly or wholly offset any increase in net exports (exports less imports) that would be caused by U.S. tariffs.
The trade dispute's precise effects on growth are uncertain because they mostly depend on second-order effects that are hard to measure, but they are generally thought to have been negative on net thus far. Goldman Sachs economists estimate that the trade dispute with China has reduced quarterly growth by between 0.2 and 0.4 percentage points each quarter from the second quarter of 2018 through the fourth quarter of 2019 (and could continue to reduce growth in future quarters, depending on what happens to trade policy in the future).31 They estimate that the trade restrictions' direct effects have positively affected growth, but that this has been more than offset by the negative indirect effects outlined above. CBO estimates that the direct effects of tariffs implemented to date will reduce the level of real GDP by 0.3% by 2020 (assuming the tariffs remain in place until then)—a somewhat smaller effect than Goldman Sachs estimated, partly because Goldman Sachs's estimate includes more recent trade policy developments. CBO projects the effect on GDP will wane over time, assuming the tariffs remain in place until 2029.32 The Organisation for Economic Co-operation and Development (OECD) estimates that trade restrictions, if unchanged, will reduce GDP growth by 0.5% by 2021.33
The timing of trade policy uncertainty's effects on business confidence and investment is hard to pinpoint, but the effects have likely increased over time. Announcements of trade policy changes began in the higher-growth period, but were phased in and ratcheted up over time.34 Further, confidence depends partly on how individuals believe the trade disputes will ultimately be resolved. Perceptions of whether trade disputes would be resolved or escalate are likely to have varied over time as U.S. and foreign policymakers' rhetoric on intentions and progress has fluctuated.
One source of trade policy uncertainty was removed when the new U.S.-Mexico-Canada Agreement (H.R. 5430) was signed into law, assuming all parties to the agreement ratify it. Other sources of uncertainty, such as trade relations with China, remain outstanding, albeit arguably diminished by the signing of the Phase 1 bilateral agreement on January 15, 2020.35 When the myriad of trade disputes are eventually resolved, uncertainty will no longer weigh on growth. However, if trade becomes radically more open or closed, that could affect long-term productivity, as it would affect the efficient use of economic resources through, respectively, more or less scope for comparative advantage.
Slowdown in Global Growth and Strong Dollar
According to the IMF, global growth fell from 3.8% in 2017 to 3.6% in 2018 to a projected 3.0% in 2019, which would be its slowest growth rate since the 2007-2009 financial crisis.36 It attributes half of the slowdown to the economic crises in Argentina, Iran, Turkey, and Venezuela, but the slowdown was widespread and included important U.S. trading partners such as the eurozone and China.37 For countries where exports are an important source of growth, such as China, trade policy uncertainty (discussed above) likely contributed to the slowdown. Slower global growth reduces demand for U.S. exports, which reduces U.S. growth, all else equal. As shown in Table 1, U.S. export growth fell from an average of 3.0% from the third quarter of 2017 to the third quarter of 2018 to 0.2% from the fourth quarter of 2018 to the third quarter of 2019.
U.S. interest rates have been higher than those of major trading partners for several years, and this difference widened during the period when the Fed was raising rates. Relatively higher economic growth and interest rates in the United States compared to the rest of the world contributed to a strengthening of the dollar exchange rate, as capital flowed into the United States to take advantage of relatively higher rates of return. When foreigners invest in U.S. assets, they must first buy U.S. dollars, which increases the value of the dollar, all else equal. In the flexible exchange rate era (beginning in the 1970s), the dollar's real value against a broad trade-weighted index reached its highest level since 2003 in December 2016, and it has remained relatively high since then. The mid-1980s and late 1990s were the only other periods when the dollar's value was comparably high.
Trade policy uncertainty may also help explain why the dollar has appreciated, although the direction of the exchange rate effect is uncertain, theoretically. Trade restrictions on U.S. imports reduce the relative demand for foreign currency, boosting the value of the dollar. However, retaliatory tariffs on U.S. exports reduce the relative demand for the U.S. dollar, potentially offsetting some or all of the upward pressure on the dollar. If tariffs reduce growth in importing countries relative to U.S. growth, this could further reduce the demand for their currency relative to the dollar. Finally, the dollar is traditionally a safe haven currency that investors flock to when uncertainty rises—even in cases where the uncertainty has emanated from the United States.
When the dollar's value rises, U.S. exports are relatively more expensive in the rest of the world and U.S. imports are less expensive, all else equal. The fact that the dollar's value was high during the higher-growth period was largely a reflection of the strength of the U.S. economy, and one of the natural equilibration mechanisms that prevents economic overheating. A weaker dollar could potentially have supported growth through higher exports and lower imports during the slower-growth period, but this did not occur because growth in many major trading partners was relatively weaker than in the United States.
Future Prospects and Policy Implications
The consensus forecast is for the economy to continue growing at its recent moderate pace in the coming quarters.38 However, the current economic expansion is already the longest recorded expansion in U.S. history, so it is natural to wonder if the recent slowdown will turn into a recession in the near term. As noted above, the slowdown has returned the growth rate to the average for the overall expansion. A return to trend means growth has less room to decline in the future before it turns negative, which has been a feature of all previous recessions. Some recessions are caused by external shocks to the economy—idiosyncratic changes that reduce output, such as a spike in energy prices. Any given shock is less likely to result in negative growth if the economy is growing rapidly when the shock occurs than if it is growing slowly. However, a return to trend growth could counterintuitively make it less likely that the economy enters a recession because there is less of a risk that the economy will overheat. Some recessions are caused by the economy growing unsustainably quickly when it is already at full employment, which leads to higher inflation and, ultimately, a corrective crash in economic activity.39 By contrast, absent external shocks, growth at the trend rate could theoretically continue indefinitely. For this reason, fiscal and monetary stimulus may have helped prevent growth from slowing further in 2018, but additional stimulus to attempt to increase growth above trend could potentially be counterproductive.
It is unusual for fiscal and monetary policy to still be easy (i.e., for the budget deficit to be high and interest rates to be low), as they are now, when the economy has already returned to full employment. Furthermore, growth during this expansion has been strong only during periods in which fiscal policy has been more stimulative. This raises questions about whether growth could remain sufficiently strong if fiscal and monetary stimulus were withdrawn—a problem that has not arisen in previous expansions since after the Great Depression, but one that many advanced economies have grappled with in this expansion.
If growth were to slow further, the stimulus available to counteract it may be limited. As a result of fiscal and monetary policy remaining stimulative throughout the long economic expansion, policymakers have less headroom to respond to a future downturn. In the case of monetary policy, short-term interest rates are already relatively close to zero, limiting how much additional stimulus the Fed can provide through its conventional tool of cutting short-term rates. The Fed may find that this tool is quickly exhausted in the next recession, in which case it could be required to turn to unconventional tools such as large-scale asset purchases (popularly known as quantitative easing) or negative interest rates40 to fight the recession. In the case of fiscal policy, the publicly held federal debt is the highest it has been as a share of GDP since World War II and is projected to continue to increase under current policy. The budget deficit is already larger than its historical average as a share of GDP and will automatically increase in a recession with no change in policy because of the budget's automatic stabilizers.41 Unprecedentedly high debt may make policymakers feel constrained to provide enough additional fiscal stimulus to counteract the recession. Or high debt may cause debt holders to refuse to finance enough stimulus, particularly because of the reliance on foreigners to finance the federal debt. Foreigners have held 40%-50% of the publicly held debt in recent decades.
There are competing schools of thought on the best way to address this limited fiscal and monetary headroom. One school of thought argues for fiscal and monetary policy to be tightened now (by reducing deficits and raising interest rates, respectively) to gain additional headroom to be used in the next recession, and make it less likely that the economy will overheat at full employment. This strategy would be successful as long as the economy could withstand the withdrawal of stimulus and continue growing at a moderate pace. The other school of thought believes that fiscal and monetary stimulus should be used aggressively in response to any slowdown to avert a recession since the limited headroom would make a recession more likely to be deep and prolonged.42 This school of thought has been cited by Fed Chairman Jerome Powell as a justification for the Fed's decision to reduce interest rates three times in 2019.43 But this strategy could backfire if the economy nevertheless enters a recession at some point when headroom is still highly limited.
Monetary and fiscal policy primarily influence short-term growth. Other policies can influence the long-term trend growth rate, but more indirectly, slowly, and imprecisely. Long-term growth is determined by growth in the labor force, changes in the quality of the labor force, growth in the capital stock, and productivity growth. Multiple policy areas influence each of those factors. For example, education and training influence the quality of the labor force; infrastructure spending contributes directly to the capital stock; health policy influences hours worked; and trade and technology policies influence productivity growth.
Author Contact Information
Footnotes
| 1. |
Gross domestic product measures the value of goods and services produced in the United States. Real gross domestic product is adjusted for inflation (the general rise in prices). For more information, see CRS In Focus IF10408, Introduction to U.S. Economy: GDP and Economic Growth, by Mark P. Keightley. |
| 2. |
For more information, see CRS Report R44543, Slow Growth in the Current U.S. Economic Expansion, by Mark P. Keightley and Marc Labonte. |
| 3. |
All quarterly growth rates are adjusted for inflation, annualized, and seasonally adjusted. |
| 4. |
Regional GDP data are only available through the second quarter of 2019, at present. |
| 5. |
A different break point could have been chosen because growth was 3.1% in the first quarter of 2019. If this report had used this break point instead, growth in the faster-growth period would have been 2.8% instead of 3.1%, but the faster-growth period would have been two quarters longer. Growth in the slower-growth period would have been the same, but the slower-growth period would have been two quarters shorter. |
| 6. |
For purposes of GDP, government spending only includes government purchases of goods and services. It does not include government transfers to individuals. In the federal budget, government spending comprises both. In GDP, government includes federal, state, and local government. |
| 7. |
For more information, see CRS In Focus IF10411, Introduction to U.S. Economy: The Business Cycle and Growth, by Marc Labonte. |
| 8. |
Congressional Budget Office (CBO), An Update to the Budget and Economic Outlook, Table 2-5, August 2019, https://www.cbo.gov/system/files/2019-08/55551-CBO-outlook-update_0.pdf. |
| 9. |
See CRS Insight IN10882, Business Investment Spending Slowdown, by Marc Labonte; and CRS In Focus IF10557, Introduction to U.S. Economy: Productivity, by Marc Labonte. |
| 10. |
For example, the Federal Reserve projects a longer-run growth rate of 1.7% to 2.2%. See Federal Open Market Committee, Projection Materials, December 11, 2019, Table 1, https://www.federalreserve.gov/monetarypolicy/files/fomcprojtabl20191211.pdf. |
| 11. |
For estimates of the extent that government spending and tax cuts temporarily boost total spending, see Table 1 of Charles Whalen and Felix Reichling, The Fiscal Multiplier and Economic Policy Analysis in the United States, CBO, working paper 2015-02, February 2015, https://www.cbo.gov/sites/default/files/114th-congress-2015-2016/workingpaper/49925-FiscalMultiplier_1.pdf. |
| 12. |
Full employment is the concept that the economy's labor and capital resources are fully employed. It is closely linked to the concept of the natural rate of unemployment, which is the lowest sustainable unemployment rate that the economy can achieve. The unemployment rate is currently at a five-decade low, and is thus thought to be near the natural unemployment rate. |
| 13. |
For more information, see CRS Report R45723, Fiscal Policy: Economic Effects, by Marc Labonte. |
| 14. |
The act is also referred to as the 2017 tax revision and is popularly called the "Tax Cuts and Jobs Act," although that is not its official title. For more information, see CRS Report R45092, The 2017 Tax Revision (P.L. 115-97): Comparison to 2017 Tax Law, coordinated by Molly F. Sherlock and Donald J. Marples. |
| 15. |
For more information, see CRS Insight IN10861, Discretionary Spending Levels Under the Bipartisan Budget Act of 2018, by Grant A. Driessen and Marc Labonte; and CRS Report R45778, Exceptions to the Budget Control Act's Discretionary Spending Limits, by Megan S. Lynch. |
| 16. |
CBO, Budget and Economic Outlook, April 2018, Table B-2, https://www.cbo.gov/system/files/2019-04/53651-outlook-2.pdf. As shown on p. 117 of that document, CBO's projected effects of the tax cuts are similar to other prominent forecasters. |
| 17. |
In August 2019, CBO compared actual revenues with its projection of revenues under the tax cut and found that overall revenues were slightly lower than—but largely consistent with—its projection; however, corporate tax revenues were significantly lower than expected. See CBO, Budget and Economic Outlook: An Update, August 2019, https://www.cbo.gov/system/files/2019-08/55551-CBO-outlook-update_0.pdf. |
| 18. |
FY2018 covers the fourth quarter of 2017 through the third quarter of 2018, compared to the high-growth period of third quarter of 2017 through the third quarter of 2018. |
| 19. |
Since the Budget Control Act called for large declines in FY2019 discretionary spending relative to the previous year, policy changes did, however, prevent a sizeable fiscal contraction from taking place. |
| 20. |
For background, see CRS Report RL30354, Monetary Policy and the Federal Reserve: Current Policy and Conditions, by Marc Labonte. |
| 21. |
Executive Order 13771, "Reducing Regulation and Controlling Regulatory Costs," January 30, 2017, https://www.whitehouse.gov/presidential-actions/presidential-executive-order-reducing-regulation-controlling-regulatory-costs/. |
| 22. |
Reports and methodology available at https://www.reginfo.gov/public/do/eAgendaEO13771. |
| 23. |
For example, omission of the financial regulatory agencies means that rules promulgated pursuant to P.L. 115-174 are not included in Table 2. For more information, see CRS Report R45073, Economic Growth, Regulatory Relief, and Consumer Protection Act (P.L. 115-174) and Selected Policy Issues, coordinated by David W. Perkins. |
| 24. |
OIRA defines benefits as "such as, but not limited to, the promotion of the efficient functioning of the economy and private markets, the enhancement of health and safety, the protection of the natural environment, and the elimination or reduction of discrimination or bias" and costs as "such as, but not limited to, the direct cost both to the government in administering the regulation and to businesses and others in complying with the regulation, and any adverse effects on the efficient functioning of the economy, private markets (including productivity, employment, and competitiveness), health, safety, and the natural environment. See Executive Order 12866, "Regulatory Planning and Review," 58 Federal Register 190, October 4, 1993. |
| 25. |
Although it is usually assumed a deregulatory action affecting business will increase output, in principle some types of actions could decrease output. For example, certain actions could reduce growth by reducing competition, by reducing hours worked and productivity through injuries or health problems, or by causing a financial crisis. |
| 26. |
Federal Reserve, Monetary Policy Report, July 2019, Figure 17, https://www.federalreserve.gov/monetarypolicy/2019-02-mpr-part1.htm. |
| 27. |
As measured by University of Michigan's Consumer Sentiment Index. |
| 28. |
As measured by Federal Reserve Bank of Atlanta's Business Expectations Index. |
| 29. |
For more information, see CRS Insight IN10943, Escalating U.S. Tariffs: Timeline, coordinated by Brock R. Williams; and CRS Report R45529, Trump Administration Tariff Actions (Sections 201, 232, and 301): Frequently Asked Questions, coordinated by Brock R. Williams. |
| 30. |
Hites Ahir, Nicholas Bloom, and Davide Furceri, "New Index Tracks Trade Uncertainty Across the Globe," IMFBlog , International Monetary Fund, September 9, 2019, https://blogs.imf.org/2019/09/09/new-index-tracks-trade-uncertainty-across-the-globe. |
| 31. |
Daan Struyven, Hui Shan, and Helen Hu, "The Trade War Drag on U.S.-China Growth Should Abate in 2020," Global Economics Comment, November 18, 2019. |
| 32. |
CBO, An Update to the Budget and Economic Outlook, August 2019, https://www.cbo.gov/system/files/2019-08/55551-CBO-outlook-update_0.pdf. |
| 33. |
Organisation of Economic Co-operation and Development, "United States," Economic Outlook, November 2019, https://www.oecd-ilibrary.org/sites/a724e469-en/index.html?itemId=/content/component/a724e469-en. |
| 34. |
While some tariff changes were initially proposed before the second quarter of 2018, many changes were not effective until 2018 or later. |
| 35. |
White House, "President Donald J. Trump is Signing a Landmark Phase One Trade Agreement with China," Fact Sheet, January 15, 2020, https://www.whitehouse.gov/briefings-statements/president-donald-j-trump-signing-landmark-phase-one-trade-agreement-china/. For more information, see CRS Insight IN11208, U.S. Signs Phase One Trade Deal with China, by Karen M. Sutter. |
| 36. |
Gita Gopinath, "The World Economy: Synchronized Slowdown, Precarious Outlook," IMFBlog, International Monetary Fund, October 15, 2019, https://blogs.imf.org/2019/10/15/the-world-economy-synchronized-slowdown-precarious-outlook. |
| 37. |
International Monetary Fund, World Economic Outlook, October 2019, Figure 1.14, https://www.imf.org/en/Publications/WEO/Issues/2019/10/01/world-economic-outlook-october-2019. |
| 38. |
This consensus is shared by the Federal Reserve, the CBO, and private forecasters. For example, the Blue Chip consensus forecast is an average of dozens of private forecasters. The Blue Chip consensus growth forecast for 2020 is 1.8%. Blue Chip, Economic Indicators, vol. 44, no. 12, December 10, 2019. |
| 39. |
For more information, see CRS Insight IN10853, What Causes a Recession?, by Marc Labonte. |
| 40. |
Negative rates have been used for stimulus in a few foreign economies, but never in the United States. |
| 41. |
For example, more individuals will qualify for means-tested benefits and households' taxable income will decline relative to the baseline. |
| 42. |
For fiscal policy options, see CRS Report R45780, Fiscal Policy Considerations for the Next Recession, by Mark P. Keightley. |
| 43. |
Federal Reserve, "Transcript of Chair Powell's Press Conference," September 18, 2019, p. 17, https://www.federalreserve.gov/mediacenter/files/FOMCpresconf20190918.pdf. |