Federal Crop Insurance: Record Prevent Plant (PPL) Acres and Payments in 2019
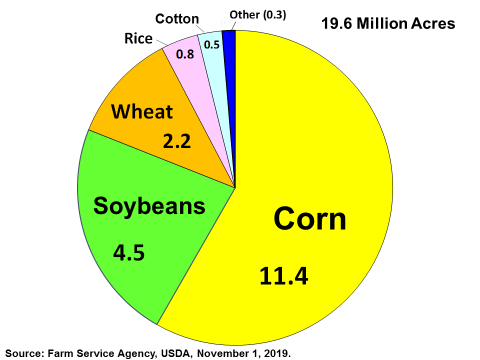
U.S. agricultural production got off to a late start in 2019 due to prolonged cool, wet springtime conditions throughout the major growing regions, particularly in states across the northern plains and eastern Corn Belt. Saturated soils prevented many farmers from planting their intended crops—such acres are referred to as “prevent plant (PPL)” acres. As of November 1, 2019, the U.S. Department of Agriculture (USDA) reported that farmers were unable to plant a record 19.6 million acres in 2019—including 11.4 million acres of corn and 4.5 million acres of soybeans. The previous record for total PPL acres was set in 2011, when USDA reported 10.2 million acres of PPL.
USDA’s Risk Management Agency (RMA) reported on November 15, 2019, that 2019 PPL indemnity payments were over $4.2 billion, with $2.6 billion (60.6%) for corn PPL acres and $1.1 billion (25%) for soybean PPL acres. The 2019 average national PPL payment rate for all crops was $224.04 per acre. Payment rates varied by crop and ranged from a low of $50 per acre for millet to a high of $1,432 per acre for dark air cured tobacco.
The unusually wet spring conditions that produced the record PPL acres in 2019 were heavily concentrated in Corn Belt states but were also reported in significant numbers in Arkansas, Texas, Mississippi, Louisiana, North Carolina, Tennessee, New York, and Oklahoma. However, South Dakota’s 3.9 million acres of PPL were more than double second-place Ohio’s 1.4 million of PPL acres. South Dakota’s PPL acres accounted for over 20% of the national total in 2019, while its PPL indemnity payments of over $925 million accounted for 21.9% of national PPL indemnity payments. During the previous 19-year period from 2000 to 2018, national PPL averaged 4.1 million acres annually with average indemnities of $680 million per year. Of these national totals, South Dakota accounted for an average of 10% of PPL acres (406 million acres) and 11.2% of PPL indemnities ($76.4 million).
Farmers that were unable to plant a crop during the spring of 2019 due to natural causes were potentially eligible for multiple payments under federal farm programs. First, federal crop insurance provides PPL coverage under a standard policy that covers pre-planting cost and potential revenue loss. Second, the FY2019 supplemental authorized disaster assistance payments for PPL (referred to as “top up”) in addition to crop insurance indemnities. Third, the Administration’s 2019 MFP payments, although based on planted acres, also included payments for eligible cover crops planted on PPL acres.
In addition to the unplanted acres, a sizeable portion of the U.S. corn and soybean crops was planted later than usual. Such late planting meant that initial crop development would be behind normal across much of the major growing regions and that eventual yields would depend on beneficial weather extending late into the fall to achieve full crop maturity. Widespread wet conditions continued into the fall, especially in the northern plains and western Corn Belt. Ultimately, much of the corn crop was harvested under wet conditions with high moisture content that required drying. Due to the high costs of propane for drying, many farmers chose to leave their corn in the field until more beneficial market conditions emerged. As of December 16, 2019, USDA estimated that 8% (or 7.2 million acres) of the U.S. corn crop had yet to be harvested, adding further to the uncertainty of yields and harvested acreage for the 2019 corn crop.
Saturated soil conditions heading into the winter months suggests a continuation of wet conditions into the 2020 planting season and the potential for a repeat of planting difficulties in the year ahead. Should wet conditions persist in 2020 and create a situation where farmers are again confronted with delayed or prevented planting, many producers may also bump up against a limit on the continued use of crop insurance PPL. Another looming concern for market watchers and policymakers is that, should wet conditions persist in 2020, they could signal the potential for continued dependence on federal programs to sustain farm incomes in 2020.
Federal Crop Insurance: Record Prevent Plant (PPL) Acres and Payments in 2019
Jump to Main Text of Report
Contents
- Introduction
- Wet Spring Affects Corn and Soybean Planting
- Planting Delays Complicate Producer Choices
- Record PPL Acres in 2019
- PPL Comparison by Crop: Corn and Soybeans Dominate
- PPL Comparison by State: South Dakota Stands Out
- PPL Acres Eligible for Multiple Payments
- Crop Insurance PPL Indemnity Payments
- FY2019 Supplemental Top Up Payments for PPL Losses
- MFP Payments for PPL Cover Crops
- Combined PPL Payments from Multiple Programs
- Late Harvest Suggests Additional Crop Losses
- Implications for Congress
Figures
Tables
Appendixes
Summary
U.S. agricultural production got off to a late start in 2019 due to prolonged cool, wet springtime conditions throughout the major growing regions, particularly in states across the northern plains and eastern Corn Belt. Saturated soils prevented many farmers from planting their intended crops—such acres are referred to as "prevent plant (PPL)" acres. As of November 1, 2019, the U.S. Department of Agriculture (USDA) reported that farmers were unable to plant a record 19.6 million acres in 2019—including 11.4 million acres of corn and 4.5 million acres of soybeans. The previous record for total PPL acres was set in 2011, when USDA reported 10.2 million acres of PPL.
USDA's Risk Management Agency (RMA) reported on November 15, 2019, that 2019 PPL indemnity payments were over $4.2 billion, with $2.6 billion (60.6%) for corn PPL acres and $1.1 billion (25%) for soybean PPL acres. The 2019 average national PPL payment rate for all crops was $224.04 per acre. Payment rates varied by crop and ranged from a low of $50 per acre for millet to a high of $1,432 per acre for dark air cured tobacco.
The unusually wet spring conditions that produced the record PPL acres in 2019 were heavily concentrated in Corn Belt states but were also reported in significant numbers in Arkansas, Texas, Mississippi, Louisiana, North Carolina, Tennessee, New York, and Oklahoma. However, South Dakota's 3.9 million acres of PPL were more than double second-place Ohio's 1.4 million of PPL acres. South Dakota's PPL acres accounted for over 20% of the national total in 2019, while its PPL indemnity payments of over $925 million accounted for 21.9% of national PPL indemnity payments. During the previous 19-year period from 2000 to 2018, national PPL averaged 4.1 million acres annually with average indemnities of $680 million per year. Of these national totals, South Dakota accounted for an average of 10% of PPL acres (406 million acres) and 11.2% of PPL indemnities ($76.4 million).
Farmers that were unable to plant a crop during the spring of 2019 due to natural causes were potentially eligible for multiple payments under federal farm programs. First, federal crop insurance provides PPL coverage under a standard policy that covers pre-planting cost and potential revenue loss. Second, the FY2019 supplemental authorized disaster assistance payments for PPL (referred to as "top up") in addition to crop insurance indemnities. Third, the Administration's 2019 MFP payments, although based on planted acres, also included payments for eligible cover crops planted on PPL acres.
In addition to the unplanted acres, a sizeable portion of the U.S. corn and soybean crops was planted later than usual. Such late planting meant that initial crop development would be behind normal across much of the major growing regions and that eventual yields would depend on beneficial weather extending late into the fall to achieve full crop maturity. Widespread wet conditions continued into the fall, especially in the northern plains and western Corn Belt. Ultimately, much of the corn crop was harvested under wet conditions with high moisture content that required drying. Due to the high costs of propane for drying, many farmers chose to leave their corn in the field until more beneficial market conditions emerged. As of December 16, 2019, USDA estimated that 8% (or 7.2 million acres) of the U.S. corn crop had yet to be harvested, adding further to the uncertainty of yields and harvested acreage for the 2019 corn crop.
Saturated soil conditions heading into the winter months suggests a continuation of wet conditions into the 2020 planting season and the potential for a repeat of planting difficulties in the year ahead. Should wet conditions persist in 2020 and create a situation where farmers are again confronted with delayed or prevented planting, many producers may also bump up against a limit on the continued use of crop insurance PPL. Another looming concern for market watchers and policymakers is that, should wet conditions persist in 2020, they could signal the potential for continued dependence on federal programs to sustain farm incomes in 2020.
Introduction
This report analyzes the effects of historic wet conditions during the 2019 growing season on major U.S. field crops, primarily corn and soybeans. These effects include record acres prevented from being planted, widespread delays in planting and harvesting of the corn and soybean crops, large crop insurance indemnity payments due to prevented plantings and weather-related yield losses, and additional ad hoc payments announced for producers experiencing both trade damage and losses from prevented planting.
This report focuses on corn and soybeans—the two largest commercial crops grown in the United States in terms of number of producers, cultivated area, volume produced, and value of production. Together, they account for 54% of land planted to major field crops since 2010.1 They are critical inputs for several sectors, including the livestock, biofuels, food processing, and export sectors. As a result, any delay or reduction from expected output for either of these crops can have important implications for market prices and the broader U.S. farm economy.
The U.S. Department of Agriculture (USDA) forecasted an increased role of federal support for farm incomes in 2019—including $22.4 billion in direct support payments and $10.3 billion in federal crop insurance indemnity payments.2 Together, the forecast of USDA farm support plus crop insurance indemnities of $32.7 billion represents a 35.3% share of U.S. net farm income $92.5 billion. Since 2010, the federal crop insurance program has emerged as the largest component of the farm safety net in terms of taxpayer outlays, averaging $7.8 billion annually in premium subsidies.3 While USDA implements the federal crop insurance program, Congress is responsible for authorizing and funding it. The federal crop insurance program is permanently authorized by the Federal Crop Insurance Act of 1980 (P.L. 96-365), as amended (7 U.S.C. §1501 et seq.) and receives mandatory funding.4 Each of the past three farm bills—P.L. 10-246 (2008), P.L. 113-79 (2014), and P.L. 115-334 (2018)—has included a separate title to modify crop insurance program provisions.
Wet Spring Affects Corn and Soybean Planting
U.S. agricultural production got off to a late start in 2019 due to prolonged cool, wet springtime conditions throughout the major growing regions, particularly in states across the northern plains and eastern Corn Belt.5 Saturated soils prevented many farmers from planting their intended crops (see text box below). Such acres are referred to as "prevent plant" (PPL) acres.
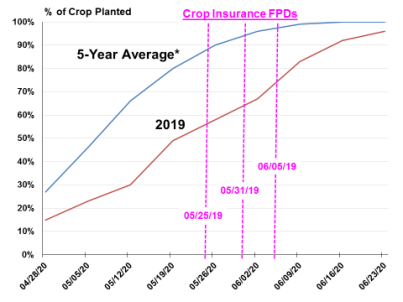
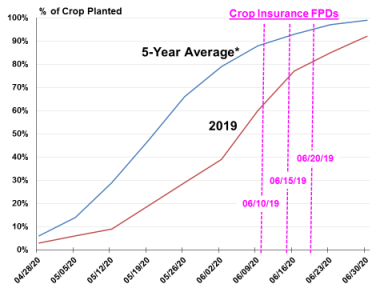
In addition to the unplanted acres, sizeable portions of the U.S. corn and soybean crops were planted later than usual, especially in Illinois, Michigan, Missouri, Ohio, Wisconsin, and North and South Dakota. Traditionally, 96% of the U.S. corn crop is planted by June 2, but in 2019 by that date 67% of the crop had been planted (Figure 1). Similarly, the U.S. soybean crop was planted with substantial delays. By June 16, 77% of the U.S. soybean crop was planted, whereas an average of 93% of the crop has been planted by that date during the previous five years (Figure 2).
|
Figure 1. U.S. Corn Planting Progress, 2019 versus the Five-Year Average |
 |
|
Source: Compiled by CRS from USDA, NASS, various 2019 Crop Progress reports. Notes: FPD = Final Planting Date, a crop insurance deadline that varies geographically, see Figure 3. The five-year average is for 2014-2018. NASS surveys corn planting progress through the fourth week of June. |
|
Figure 2. U.S. Soybean Planting Progress, 2019 versus the Five-Year Average |
 |
|
Source: Compiled by CRS from USDA, NASS, various 2019 Crop Progress reports. Notes: FPD = Final Planting Date, a crop insurance deadline that varies geographically, see Figure 3. The five-year average is for 2014-2018. NASS surveys soybean planting progress through the final week of June. |
|
Assessing Producer Planting Intentions and Actual Plantings March Planting Intentions Report USDA's National Agricultural Statistics Service (NASS) attempts to ascertain U.S. producer planting intentions for each new crop year based primarily on surveys conducted during the first two weeks of March. The March Agricultural Survey is a probability survey that includes a sample of approximately 82,400 farm operators selected from a list of producers that ensures that all operations in the United States have a chance to be selected. Data from operators is collected by mail, internet, telephone, or personal interview to obtain information on crop acreage intentions. The survey results are released at the end of March in an annual Prospective Plantings report.6 June Acreage Report Similarly, NASS estimates planted and harvested acreages based primarily on surveys conducted during the first two weeks of June with a sample of approximately 68,100 farm operators. NASS survey results are released at the end of June in an annual Acreage report.7 However, due to widespread planting delays in 2019, NASS conducted a second survey in July to better capture actual plantings. Excessive rainfall in 2019 had led to planting delays and challenges at the time of the initial June survey, leaving a portion of acres still to be planted for corn in Illinois, Indiana, Iowa, Kansas, Michigan, Minnesota, Missouri, Nebraska, New York, North Dakota, Ohio, South Dakota, and Wisconsin; cotton in Arkansas; sorghum in Kansas; and soybeans in Arkansas, Illinois, Indiana, Iowa, Kansas, Michigan, Minnesota, Missouri, Nebraska, New York, North Dakota, Ohio, South Dakota, and Wisconsin. The June survey respondents who reported acreage as not yet planted for corn, cotton, sorghum, and soybeans in 14 principal producer states for the Acreage report, released June 28, 2019, were re-contacted in July. In addition to the resurvey data, NASS incorporated certified acreage information (as reported to USDA by producers participating in USDA farm programs) from USDA's Farm Service Agency (FSA) into the estimating process.8 Crop Progress Reports Crop progress and growing conditions are also reported by NASS during the growing season—in the Crop Progress report—based on the opinion of experts residing within the major growing zones supplemented by remote sensing technology that provides evidence on both cultivated area and plant growth. In addition, the Crop Progress report assesses the pace of planting and harvesting of major program crops in the principal producing states. The Crop Progress report is published weekly starting the first week in April and running through November. For more information on NASS crop production estimates, see CRS Report R44814, NASS and U.S. Crop Production Forecasts: Methods and Issues, by Randy Schnepf. |
Planting Delays Complicate Producer Choices
Widespread planting delays for corn and soybeans pushed both crops' growing cycle into hotter, drier periods of the summer than usual. In addition, maximizing yield potential will likely depend on beneficial weather extending into the fall to achieve full crop maturity. This would potentially make crop growth vulnerable to an early freeze in the fall that would terminate further yield growth.
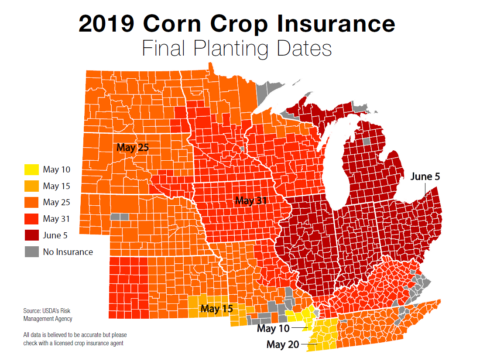
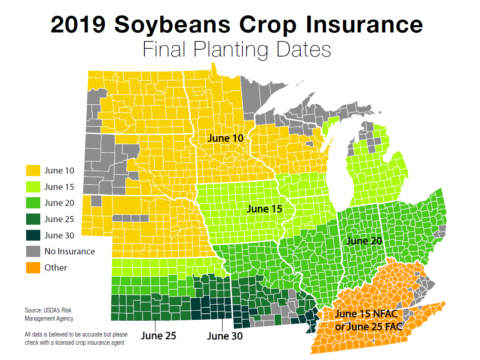
Also, planting delays increase the complexity of producer decisionmaking. When the planting occurs after a crop insurance policy's "final planting date" (FPD), the "late planting period" clause in the policy comes into play, and insurance coverage starts to decline with each successive day of delay (Figure 3).
|
Figure 3. Crop Insurance Final Planting Dates (FPD): Corn and Soybeans |
 |
|
Source: Sara Schafer, "Is Prevent Plant the Most Profitable Option in 2019?," Farm Journal's AGPRO, May 13, 2019, https://www.agprofessional.com/article/prevent-plant-most-profitable-option-2019. Notes: FAC = following another crop; NFAC = not following another crop. Acres planted on or before the FPD receive the full yield or revenue coverage that was purchased. If the crop is planted after the FPD, coverage is reduced by 1% per day throughout the late-planting period (25 days for both corn and soybeans). Policyholders who are prevented from planting some crop acres until after the FPD and choose to not plant the crop at all will receive 55% of the original guarantee for corn or 60% of the original guarantee for soybeans. For an additional premium, prevented planting coverage can be increased to 60% of the original coverage for corn acres or, for soybean acres, 65% of the original coverage. This choice must be made when the policy is purchased. A crop planted after the end of the late-planting period will be insured at the prevented-planting coverage level. |
|
Figure 3. Crop Insurance Final Planting Dates (FPD): Corn and Soybeans |
 |
|
Source: Sara Schafer, "Is Prevent Plant the Most Profitable Option in 2019?," Farm Journal's AGPRO, May 13, 2019, https://www.agprofessional.com/article/prevent-plant-most-profitable-option-2019. Notes: FAC = following another crop; NFAC = not following another crop. Acres planted on or before the FPD receive the full yield or revenue coverage that was purchased. If the crop is planted after the FPD, coverage is reduced by 1% per day throughout the late-planting period (25 days for both corn and soybeans). Policyholders who are prevented from planting some crop acres until after the FPD and choose to not plant the crop at all will receive 55% of the original guarantee for corn or 60% of the original guarantee for soybeans. For an additional premium, prevented planting coverage can be increased to 60% of the original coverage for corn acres or, for soybean acres, 65% of the original coverage. This choice must be made when the policy is purchased. A crop planted after the end of the late-planting period will be insured at the prevented-planting coverage level. |
Insured acres planted on or before the FPD receive the full yield or revenue coverage that was purchased. However, if the crop is planted after the FPD, insurance coverage is reduced by 1% per day throughout the late-planting period (which begins the day after the FPD and extends for 25 days for both corn and soybeans). During the late-planting period, producers must decide whether to opt for a PPL indemnity payment or try to plant the crop under reduced insurance coverage with a heightened risk of reduced yields.
Despite the risks associated with this choice, large portions of both the corn and soybean crops were planted after the FPD (Figure 1 and Figure 2). The choice of planting versus not planting was complicated in 2019 by Secretary of Agriculture Perdue's announcement on May 23 that only producers with planted acres would be eligible for "trade damage" assistance payments in 2019 under the Market Facilitation Program (MFP).9 The Secretary's announcement, which came in the middle of the planting period, could have encouraged greater planting than would have otherwise occurred as farmers sought to ensure eligibility for the 2019 MFP payment.
During 2018, U.S. soybean and corn producers had received MFP payments based on their farms' harvested output, including $1.65 per bushel for soybean and $0.01 per bushel for corn.10 For 2019, the Secretary of Agriculture was offering higher payment rates of $2.05 per bushel for soybeans and $0.14 for corn. However, the MFP payment formula would use planted acres—not harvested production—and combine the commodity-specific payment rates of major program crops (referred to as "non-specialty crops") at the county level (weighted by historical county planted acres and yields) to derive a single county-level MFP payment rate. The potential for 2019 MFP payments could have provided sufficient incentive for some producers to plant their corn and soybean crops under conditions they would not have otherwise (e.g., to plant their crops in wet fields where potential yield-reducing problems associated with seed germination and soil compaction are increased). If such planting did occur, it likely prevented even larger PPL acres from being reported.
Additionally, overarching uncertainty remained in 2019 associated with the then-ongoing trade dispute between the United States and China. The dispute had reduced U.S. agricultural exports in 201811 and dampened prospects for both commodity prices and export volumes in 2019. These factors further complicated producers' evaluations of market payoffs under different planting and crop insurance choices.
Record PPL Acres in 2019
The two principal sources for data on PPL acres within USDA—the Farm Service Agency (FSA) and the Risk Management Agency (RMA)—provide similar but not identical estimates of PPL (Figure 4). FSA oversees the implementation of USDA's farm revenue-support and disaster assistance programs.12 All producers that participate in these farm programs are required to report their acreage and yields to FSA in an annual acreage report that details crop production activity by specific field.
 |
|
Source: FSA, Crop Acreage Data, 2019 Crop Year, as of November 1, 2019; and RMA, Prevent Plant Acres, Cause of Loss database, as of November 15, 2019. Note: FSA and RMA provide different estimates of PPL. FSA data is based on acreage reports from farmers that participate in USDA farm programs; RMA data is from farmers that participate in federal crop insurance. |
RMA oversees the implementation of USDA's crop insurance programs.13 All participating producers provide detailed information on insured crops and land to RMA. Farmers report the same number of acres to RMA and FSA. However, not all farms participate in USDA farm programs or buy federal crop insurance.14 As a result, differences in reported acres planted, harvested, and prevented from being planted occur between the two sources.
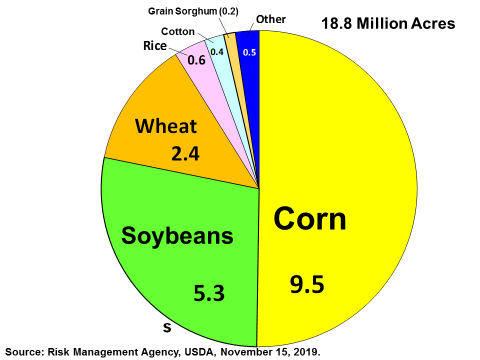
As of November 1, 2019, U.S. farmers reported to FSA that, of the cropland that they intended to plant this past spring, they were unable to plant 19.6 million acres due primarily to prolonged wet conditions that prevented field work.15 In contrast, RMA reported a record 18.8 million of PPL acres.16 The previous record for total PPL acres was set in 2011, when RMA reported 10.2 million acres and FSA reported 9.6 million of PPL.
PPL Comparison by Crop: Corn and Soybeans Dominate
In 2019, FSA reported 19.6 million PPL acres, including 11.4 million acres of corn and 4.5 million acres of soybeans—both crops established new records for PPL acres by substantial margins. The previous record PPL for corn was 2.8 million acres in 2013, and for soybeans it was 2.1 million acres in 2015. By way of comparison, in 2019 RMA's PPL acres included slightly more soybean (5.3 versus 4.5 million) and wheat (2.4 versus 2.2 million) acres and less corn (9.5 versus 11.4 million) acres. For both datasets (FSA and RMA), corn, soybeans, and wheat accounted for over 90% of PPL acres (92.3% for FSA, 91.5% for RMA).
RMA reported 2019 PPL indemnity payments of over $4.2 billion, with $2.6 billion (60.6%) for corn PPL acres and $1.1 billion (25%) for soybean PPL acres (Table 1). The 2019 average national PPL payment rate for all crops was $224.04 per acre. Payment rates vary by crop and ranged from a low of $50 per acre for millet to a high of $1,432 per acre for dark air cured tobacco.
Some economists have suggested that the large discrepancy in corn PPL acres between the two data sources (1.9 million acres) could be the result of acres originally intended to be planted to soybeans being claimed as corn PPL acres to obtain the higher PPL indemnity for corn available under federal crop insurance.17 In their analysis of historical PPL indemnity rates, the PPL payment rate was almost always higher for corn than soybeans. In 2019, corn's average PPL payment rate of $270.13 per acre was about $70 per acre (34.7%) higher than soybean's average PPL payment rate (Table 1). Thus, producers had an incentive to claim PPL for corn to the maximum extent possible, whether corn or soybeans was the intended crop.
A breakout of PPL acres by state and by major commodity is available in the Appendix to this report (Table A-1).
|
Commodity |
PPL Acres |
% PPL Acres |
PPL Indemnity |
% Indemnity |
$ per Acre |
||||||||
|
Corn |
|
|
|
|
|
||||||||
|
Soybeans |
|
|
|
|
|
||||||||
|
Wheat |
|
|
|
|
|
||||||||
|
Rice |
|
|
|
|
|
||||||||
|
Cotton |
|
|
|
|
|
||||||||
|
Grain Sorghum |
|
|
|
|
|
||||||||
|
Sunflowers |
|
|
|
|
|
||||||||
|
Dry Beans |
|
|
|
|
|
||||||||
|
Dry Peas |
|
|
|
|
|
||||||||
|
Barley |
|
|
|
|
|
||||||||
|
Oats |
|
|
|
|
|
||||||||
|
Canola |
|
|
|
|
|
||||||||
|
Cotton ELS |
|
|
|
|
|
||||||||
|
Popcorn |
|
|
|
|
|
||||||||
|
Potatoes |
|
|
|
|
|
||||||||
|
Peanuts |
|
|
|
|
|
||||||||
|
Safflower |
|
|
|
|
|
||||||||
|
Sweet Corn |
|
|
|
|
|
||||||||
|
Hybrid Corn Seed |
|
|
|
|
|
||||||||
|
Millet |
|
|
|
|
|
||||||||
|
Flax |
|
|
|
|
|
||||||||
|
Sugar Beets |
|
|
|
|
|
||||||||
|
Burley Tobacco |
|
|
|
|
|
||||||||
|
Onions |
|
|
|
|
|
||||||||
|
Processing Beans |
|
|
|
|
|
||||||||
|
Flue Cured Tobacco |
|
|
|
|
|
||||||||
|
Green Peas |
|
|
|
|
|
||||||||
|
Silage Sorghum |
|
|
|
|
|
||||||||
|
Dark Air Tobacco |
|
|
|
|
|
||||||||
|
Rye |
|
|
|
|
|
||||||||
|
All Other Crops |
|
|
|
|
|
||||||||
|
Grand Total |
|
|
|
|
|
Source: Compiled by CRS using RMA, Cause of Loss data for 2019, downloaded on November 19, 2019.
Note: NIA = Net Insured Acres.
PPL Comparison by State: South Dakota Stands Out
The unusually wet spring conditions that produced the record PPL acres in 2019 were heavily concentrated in Corn Belt states but were also reported in significant amounts in Arkansas, Texas, Mississippi, Louisiana, North Carolina, Tennessee, New York, and Oklahoma (Table 2). However, the 3.9 million acres of PPL reported in South Dakota (primarily the eastern portion of the state) were more than double second-place Ohio, where 1.4 million PPL acres were reported. South Dakota's PPL acres accounted for over 20% of the national total in 2019, while its PPL indemnity payments of over $925 million accounted for 21.9% of national PPL indemnity payments.18
|
# |
States |
PPL Acres |
% |
% Cum. |
|
PPL Indemnities |
% |
% Cum. |
|||||||||||
|
1 |
SD |
|
|
|
|
|
|
|
|||||||||||
|
2 |
OH |
|
|
|
|
|
|
|
|||||||||||
|
3 |
IL |
|
|
|
|
|
|
|
|||||||||||
|
4 |
MO |
|
|
|
|
|
|
|
|||||||||||
|
5 |
AR |
|
|
|
|
|
|
|
|||||||||||
|
6 |
MN |
|
|
|
|
|
|
|
|||||||||||
|
7 |
KS |
|
|
|
|
|
|
|
|||||||||||
|
8 |
ND |
|
|
|
|
|
|
|
|||||||||||
|
9 |
IN |
|
|
|
|
|
|
|
|||||||||||
|
10 |
MI |
|
|
|
|
|
|
|
|||||||||||
|
11 |
TX |
|
|
|
|
|
|
|
|||||||||||
|
12 |
MS |
|
|
|
|
|
|
|
|||||||||||
|
13 |
WI |
|
|
|
|
|
|
|
|||||||||||
|
14 |
IA |
|
|
|
|
|
|
|
|||||||||||
|
15 |
LA |
|
|
|
|
|
|
|
|||||||||||
|
16 |
NE |
|
|
|
|
|
|
|
|||||||||||
|
17 |
NC |
|
|
|
|
|
|
|
|||||||||||
|
18 |
TN |
|
|
|
|
|
|
|
|||||||||||
|
19 |
NY |
|
|
|
|
|
|
|
|||||||||||
|
20 |
OK |
|
|
|
|
|
|
|
|||||||||||
|
Other |
|
|
|
|
|
|
|
||||||||||||
|
Total |
|
|
|
|
|
|
|
Source: Compiled by CRS using RMA, Cause of Loss data for 2019, downloaded on November 19, 2019.
PPL Acres Eligible for Multiple Payments
Farmers who were unable to plant a crop during the spring of 2019 due to natural causes were eventually eligible for multiple payments under federal farm programs. First, federal crop insurance provides PPL coverage under a standard policy that covers pre-planting cost and potential revenue loss. Second, the FY2019 supplemental authorized disaster assistance payments for PPL (referred to as "top up") in addition to crop insurance indemnities. Third, the Administration's 2019 MFP payments were based on planted acres. However, payments were also included for eligible cover crops planted on PPL acres.
Crop Insurance PPL Indemnity Payments
If producers are prevented from planting an insured crop because of an insured peril (described below), then the PPL provisions of a standard crop insurance policy compensate the affected producers for pre-planting costs incurred in preparation for planting their insured crops.
|
Insured Perils Federal multi-peril crop insurance protects only against unavoidable, naturally occurring events. Covered perils or "causes of loss" include adverse weather conditions (such as hail, frost, drought, excess moisture, etc.), failure of irrigation water supply (if caused by an insured peril during the insurance period), fire (if due to natural causes), and plant disease and insects but not damage due to insufficient or improper application of pest or disease control measures and wildlife damage.19 |
Crop insurance PPL coverage is available for any farm-based COMBO policy. COMBO policies include individual yield or revenue insurance policies:
- Revenue protection (RP) insures a producer-selected coverage level of the farm's historical yield times the higher of the projected price or the harvest price.
- RP with the harvest price exclusion insures a producer-selected coverage level of the farm's historical yield times the projected price.
- Yield protection insures for a producer-selected coverage level of the farm's historical yield.
Area-based revenue and yield policies—such as Area Risk Protection and Area Yield Protection—that rely on county yields and revenues to trigger indemnity payments are not eligible for PPL indemnities.
Calculating the PPL Indemnity
As described in the section "Planting Delays Complicate Producer Choices," policyholders who are prevented from planting acres until after the FPD may choose not to plant the crop and instead receive a PPL indemnity, calculated as a percentage of the original insurance guarantee (e.g., 55% for corn and 60% for soybean).20 For example, suppose that a corn producer with an insurable yield of 200 bushels per acre21 has purchased RP at an 80% coverage level with an RMA projected price of $4.00 per bushel. For this policy:
- The RP coverage guarantee is 200 x $4.00 x 80% = $640 per acre;
- The PPL indemnity is 55% x $640 = $352 per acre.
Alternately, consider a hypothetical soybean producer with an average production history yield of 50 bushels per acre, an RMA projected price of $9.54 per bushel, and an RP policy with an 80% coverage level. For this policy:
- The RP coverage guarantee is 50 x $9.54 x 80% = $381.60 per acre;
- The PPL indemnity is 60% x $381.60 = $228.96 per acre.
FY2019 Supplemental Top Up Payments for PPL Losses
On June 3, 2019, Congress passed a FY2019 supplemental appropriations bill (P.L. 116-20) that, among other assistance, authorized $3 billion in additional funds for disasters that impacted farmers and ranchers.22 The disaster funding is administered through multiple USDA programs and provides financial assistance to producers with production losses on both insured and non-insured crops.23 All of the agriculture funds are designated as emergency spending.
The supplemental funding covers several types of agricultural losses from 2018 and 2019, including losses for crops prevented from being planted in 2019. In particular, producers who claimed PPL losses in 2019 are eligible for a top up of 10%-15% of their PPL indemnity. The PPL top up is 15% for producers with standard RP policies that include the harvest price option as a default and 10% for producers who opted out of the harvest price option and selected the RP with harvest price exclusion policy. For 2019, 91% of corn and soybean insured acres were covered by RP with harvest price option.24 Under the corn and soybean examples introduced earlier, the supplemental top up would be calculated as:
- For a corn RP policy: 15% x $352 = $52.80 per acre;
- For a soybean RP policy: 15% x $$228.96 = $34.34 per acre.
Requirements Associated with the Top Up Payments
The FY2019 supplemental program limits payments to up to 90% of losses, including payments from crop insurance and the non-insured disaster assistance program (NAP) but excluding MFP payments. For producers who did not purchase crop insurance or NAP in advance of the natural disasters, payments are limited to 70% of losses. In addition, all recipients of any FY2019 supplemental disaster payments (including the PPL top up) are required to purchase crop insurance or NAP for the next two crop years.
MFP Payments for PPL Cover Crops
Under USDA's 2019 MFP program, eligibility for payments—which range from $15 to $150 per acre—is restricted to planted acres, thus excluding any PPL acres.25 However, on June 10, 2019, Secretary Perdue announced that USDA was exploring "legal flexibilities" to provide a minimal per acre MFP payment to farmers who opted for a PPL indemnity but also planted an MFP-eligible cover crop (such as barley, oats, or rye) with the potential to be harvested and for subsequent use of those cover crops for forage.26 On July 29, 2019, USDA announced a 2019 MFP payment rate of $15 per acre for PPL losses claimed on non-specialty crop acres followed by a USDA-approved cover crop.27
Combined PPL Payments from Multiple Programs
In summary, a producer can combine payments from multiple programs without having planted the intended cash crop. While it is not likely to cover all losses incurred, the combination can result in a higher payment in 2019 than was possible in previous years. Based on the above example, a corn farmer with a standard RP policy and an 80% coverage level could receive combined PPL payments of $419.80 per acre, including the PPL indemnity ($352), the supplemental top up payment ($52.80), and the MFP payment for an eligible cover crop planted on PPL acres ($15). By comparison, the original RP policy with 80% coverage would have guaranteed a maximum revenue of $640 per acre had the insured crop been planted. On such an RP policy, a yield loss of nearly 66% would be necessary to generate an indemnity payment that would match the federal payout under the suite of multiple programs available to PPL acres in 2019.
Similarly, the hypothetical soybean producer with a standard RP policy and an 80% coverage level could receive combined PPL payments of $278.30 per acre, including the PPL indemnity ($228.96), the supplemental top up payment ($34.34), and the MFP payment for an eligible cover crop planted on PPL acres ($15).
However, the second and third payment programs—the top up and the extended MFP payment on eligible cover crops—were not known until later in the growing season (June 3 for the top up and July 29 for the extended MFP payment) after most late planting versus PPL decisions had been made. Some preliminary research suggests that some farmers that might have been better off choosing PPL with top up and extended MFP on cover crops but instead elected to plant corn or soybeans. This choice may have been driven in part by then-relatively high futures market prices and the prospect of qualifying for the 2019 MFP payment, which required planting an eligible crop as announced by Secretary Perdue on May 23.28
Late Harvest Suggests Additional Crop Losses
In addition to the PPL acres, large portions of the corn and soybean crops were planted two to four weeks later than usual (Figure 1 and Figure 2). Such late planting meant that initial crop development would be behind normal across much of the major growing regions and that eventual yields would depend on beneficial weather extending late into the fall to achieve full crop maturity. The late planting also rendered crop growth vulnerable to an early freeze in the fall. Widespread wet conditions continued into the fall, especially in the northern plains and western Corn Belt. North Dakota recorded the wettest September on record in 2019,29 while Iowa recorded the wettest October.30
Ultimately, much of the corn crop was harvested under wet conditions with high moisture content that required drying. An early cold spell in the Upper Midwest had already heightened the demand for propane that, in addition to serving as the primary energy source for drying corn, is used to heat hog barns and for other farm operations. This resulted in limited supplies and higher prices for propane. Many farmers chose to leave their corn in the field until more beneficial market conditions emerged. As of December 16, 2019—the date of USDA's final weekly Crop Progress report for 2019—an estimated 8% (or 7.2 million acres) of the U.S. corn crop had yet to be harvested, adding further to the uncertainty of yields and harvested acreage for the 2019 corn crop (Table 3).
|
Date |
Corn: % Harvested |
Soybeans: % Harvested |
||||||||||||
|
2019 |
Average: 2014-2018 |
% Late |
2019 |
Average: 2014-2018 |
% Late |
|||||||||
|
September 22 |
|
|
|
|
|
|
|
|||||||
|
September 29 |
|
|
|
|
|
|
|
|||||||
|
October 6 |
|
|
|
|
|
|
|
|||||||
|
October 13 |
|
|
|
|
|
|
|
|||||||
|
October 20 |
|
|
|
|
|
|
|
|||||||
|
October 27 |
|
|
|
|
|
|
|
|||||||
|
November 3 |
|
|
|
|
|
|
|
|||||||
|
November 10 |
|
|
|
|
|
|
|
|||||||
|
November 17 |
|
|
|
|
|
|
|
|||||||
|
November 24a |
|
|
|
|
|
|
|
|||||||
|
December 2 |
|
|
|
|
|
|
|
|||||||
|
December 9 |
|
|
|
|
|
|
|
|||||||
Source: Compiled by CRS from NASS, various 2019 Crop Progress reports.
Notes: NA = not available. NASS begins to survey soybean harvesting progress in the final week of September.
a. Originally, the November 24 Crop Progress report was scheduled to be the last Crop Progress report of the 2019 season. However, due to widespread delays in harvest progress, the weekly national Crop Progress report was extended for two additional weeks.
Implications for Congress
Saturated soil conditions heading into the winter months suggest a continuation of wet conditions into the 2020 planting season and the potential for a repeat of planting difficulties in the months ahead. These unusual conditions have come in the midst of a continued trade dispute between the United States and China that has dampened demand for U.S. agricultural products from one of the United States' principal foreign markets31 and has compelled the Administration to undertake large ad hoc "trade aid" payments to producers of selected commodities.32
The record PPL acreage has resulted in record crop insurance PPL indemnity payments under the PPL provisions of standard federal crop insurance policies in 2019. Should wet conditions persist into 2020 and create a situation where farmers are again confronted with delayed or prevented planting, some producers may also bump up against a limit on the continued use of PPL. Under RMA rules, PPL can be taken only for crops planted on an insured unit in one of the four preceding crop years.33 Thus, four consecutive years of PPL would result in ineligibility for the affected cropland. Furthermore, while crop insurance indemnities can help to offset some of the financial loss associated with prevented planting or poor harvests, they are not designed to cover all of the associated losses.
Another concern for producers is the timing and clarity (or lack thereof) with respect to USDA announcements about new payment programs that are linked to producer production choices. In general, to avoid adversely influencing producer behavior—a precept of most farm policies—such announcements should be made either well in advance of the spring planting period or well after production decisions have been made.
A final looming concern for market watchers and policymakers is the increased role of USDA payments to support farm incomes in 2019.34 USDA forecasts $22.4 billion in direct support payments to the U.S. agricultural sector in 2019, including $14.3 billion in direct payments made under trade aid programs as well as over $8 billion in payments from other farm programs.35 In addition, USDA forecasts $10.3 billion in federal crop insurance indemnity payments.36 Together, forecasts of USDA farm support plus crop insurance indemnities combine for $32.7 billion in payments that represent a 35.3% share of USDA's November forecast of 2019 net farm income of $92.5 billion.37
Without this federal support, net farm income would be lower, primarily due to continued weak prices for most major crops. Should these conditions persist into 2020, they would signal the potential for continued dependence on federal programs to sustain farm incomes in 2020.
Appendix. Supplementary Table
|
State |
Corn |
Soybeans |
Wheat |
Rice |
Cotton |
Grain Sorghum |
Sun-flowers |
Dry Beans |
Dry Peas |
Other Crops |
Grand Total |
|||||||||||
|
SD |
|
|
|
|
|
|
|
|
|
|
|
|||||||||||
|
OH |
|
|
|
|
|
|
|
|
|
|
|
|||||||||||
|
IL |
|
|
|
|
|
|
|
|
|
|
|
|||||||||||
|
MO |
|
|
|
|
|
|
|
|
|
|
|
|||||||||||
|
AR |
|
|
|
|
|
|
|
|
|
|
|
|||||||||||
|
MN |
|
|
|
|
|
|
|
|
|
|
|
|||||||||||
|
KS |
|
|
|
|
|
|
|
|
|
|
|
|||||||||||
|
ND |
|
|
|
|
|
|
|
|
|
|
|
|||||||||||
|
IN |
|
|
|
|
|
|
|
|
|
|
|
|||||||||||
|
MI |
|
|
|
|
|
|
|
|
|
|
|
|||||||||||
|
TX |
|
|
|
|
|
|
|
|
|
|
|
|||||||||||
|
MS |
|
|
|
|
|
|
|
|
|
|
|
|||||||||||
|
WI |
|
|
|
|
|
|
|
|
|
|
|
|||||||||||
|
IA |
|
|
|
|
|
|
|
|
|
|
|
|||||||||||
|
LA |
|
|
|
|
|
|
|
|
|
|
|
|||||||||||
|
NE |
|
|
|
|
|
|
|
|
|
|
|
|||||||||||
|
NC |
|
|
|
|
|
|
|
|
|
|
|
|||||||||||
|
TN |
|
|
|
|
|
|
|
|
|
|
|
|||||||||||
|
NY |
|
|
|
|
|
|
|
|
|
|
|
|||||||||||
|
OK |
|
|
|
|
|
|
|
|
|
|
|
|||||||||||
|
SC |
|
|
|
|
|
|
|
|
|
|
|
|||||||||||
|
KY |
|
|
|
|
|
|
|
|
|
|
|
|||||||||||
|
AL |
|
|
|
|
|
|
|
|
|
|
|
|||||||||||
|
CO |
|
|
|
|
|
|
|
|
|
|
|
|||||||||||
|
MT |
|
|
|
|
|
|
|
|
|
|
|
|||||||||||
|
CA |
|
|
|
|
|
|
|
|
|
|
|
|||||||||||
|
GA |
|
|
|
|
|
|
|
|
|
|
|
|||||||||||
|
PA |
|
|
|
|
|
|
|
|
|
|
|
|||||||||||
|
VA |
|
|
|
|
|
|
|
|
|
|
|
|||||||||||
|
ID |
|
|
|
|
|
|
|
|
|
|
|
|||||||||||
|
AZ |
|
|
|
|
|
|
|
|
|
|
|
|||||||||||
|
MD |
|
|
|
|
|
|
|
|
|
|
|
|||||||||||
|
VT |
|
|
|
|
|
|
|
|
|
|
|
|||||||||||
|
WA |
|
|
|
|
|
|
|
|
|
|
|
|||||||||||
|
NJ |
|
|
|
|
|
|
|
|
|
|
|
|||||||||||
|
NM |
|
|
|
|
|
|
|
|
|
|
|
|||||||||||
|
OR |
|
|
|
|
|
|
|
|
|
|
|
|||||||||||
|
DE |
|
|
|
|
|
|
|
|
|
|
|
|||||||||||
|
WY |
|
|
|
|
|
|
|
|
|
|
|
|||||||||||
|
FL |
|
|
|
|
|
|
|
|
|
|
|
|||||||||||
|
UT |
|
|
|
|
|
|
|
|
|
|
|
|||||||||||
|
WV |
|
|
|
|
|
|
|
|
|
|
|
|||||||||||
|
ME |
|
|
|
|
|
|
|
|
|
|
|
|||||||||||
|
MA |
|
|
|
|
|
|
|
|
|
|
|
|||||||||||
|
AK |
|
|
|
|
|
|
|
|
|
|
|
|||||||||||
|
NH |
|
|
|
|
|
|
|
|
|
|
|
|||||||||||
|
CT |
|
|
|
|
|
|
|
|
|
|
|
|||||||||||
|
Total |
|
|
|
|
|
|
|
|
|
|
|
Source: Compiled by CRS using RMA, Cause of Loss data for 2019, downloaded on November 19, 2019.
Author Contact Information
Footnotes
| 1. |
U.S. Department of Agriculture (USDA), Farm Service Agency (FSA), PSD database, December 10, 2019. |
| 2. |
John Schwartz, "A Wet Year Causes Farm Woes Far Beyond the Floodplains," New York Times, November 21, 2019. |
| 3. |
Premium subsidies vary with the value of the insured crop and the producer-selected coverage level. The federal government pays a portion of the premium (62% on average) that equals 100% in the case of catastrophic coverage and declines for higher coverage levels. |
| 4. |
CRS Report R45193, Federal Crop Insurance: Program Overview for the 115th Congress. |
| 5. |
The U.S. Corn Belt is a zone of deep, fertile soils that make it one of the world's most productive corn- and soybean-growing regions. It stretches from Ohio westward through Indiana, Illinois, and Iowa, including the southern portions of Michigan, Wisconsin, and Minnesota, northern Missouri, and the eastern portions of North and South Dakota, Nebraska, and Kansas. |
| 6. |
NASS Prospective Planting reports are available at https://usda.library.cornell.edu/concern/publications/x633f100h. |
| 7. |
NASS Acreage reports are available at https://usda.library.cornell.edu/concern/publications/j098zb09z. |
| 8. |
A detailed description of how NASS incorporates the FSA certified acreage information into the estimating process can be found at https://www.nass.usda.gov/Education_and_Outreach/Understanding_Statistics/FSA_Acreage.pdf. |
| 9. |
CRS Report R45865, Farm Policy: USDA's 2019 Trade Aid Package, by Randy Schnepf. |
| 10. |
CRS Report R45310, Farm Policy: USDA's 2018 Trade Aid Package, by Randy Schnepf et al. |
| 11. |
CRS Report R45924, U.S. Farm Income Outlook: August 2019 Forecast, by Randy Schnepf |
| 12. |
See CRS In Focus IF11164, 2018 Farm Bill Primer: Title I Commodity Programs, by Randy Schnepf. |
| 13. |
CRS Report R45193, Federal Crop Insurance: Program Overview for the 115th Congress. |
| 14. |
C. Zulauf et al., "Decoding Prevent Plant Acres for Corn and Soybeans," farmdoc daily, vol. 9, no. 214, November 13, 2019. |
| 15. |
FSA, Crop Acreage Data, 2019 crop year, as of November 1, 2019, https://www.fsa.usda.gov/news-room/efoia/electronic-reading-room/frequently-requested-information/crop-acreage-data/index. |
| 16. |
RMA data on PPL acres is embedded in its larger "Cause of Loss" data set that is updated weekly and available at https://www.rma.usda.gov/en/Information-Tools/Summary-of-Business/Cause-of-Loss. |
| 17. |
Zulauf et al. |
| 18. |
During the 19-year period from 2000 to 2018, national PPL averaged 4.1 million acres per year with average annual indemnities of $680 million. Of these national totals, South Dakota accounted for an average of 10% of PPL acres (406 million acres) and 11.2% of PPL indemnities ($76.4 million). |
| 19. |
Iowa State University, Extension and Outreach, "Current Crop Insurance Policies," Ag Decision Maker, File A1-48, October 2014. |
| 20. |
For an additional premium, PPL coverage can be increased to 60% of the original coverage for corn acres or 65% for soybean acres. This choice must be made when the policy is purchased, however. |
| 21. |
The insurable yield is referred to as the average production history in the insurance policy. |
| 22. |
CRS In Focus IF11245, FY2019 Supplemental Appropriations for Agriculture, by Megan Stubbs and Jim Monke. |
| 23. |
John Newton, "Review WHIP+ and Other Disaster Assistance Programs," Market Intel, American Farm Bureau Federation, September 23, 2019. |
| 24. |
RMA, Summary of Business data base, accessed on December 18, 2019. |
| 25. |
CRS Report R45865, Farm Policy: USDA's 2019 Trade Aid Package, by Randy Schnepf. |
| 26. |
USDA, "Secretary Perdue Statement on Disaster and Trade-Related Assistance," press release, June 10, 2019. |
| 27. |
Commondity Credit Corporation, "Trade Mitigation Program," Federal Register, p. 36456, July 29, 2019. |
| 28. |
G. Schnitkey and D. Lattz, "IFES 2019: What Did We Learn from Delayed Planting: Farm Management Implications," farmdoc daily, December 30, 2019. |
| 29. |
Schwartz, "A Wet Year Causes Farm Woes Far Beyond the Floodplains." |
| 30. |
Donnelle Eller, "Rain Stalls Iowa's Harvest, but Drier Weather Could Get Farmers Back into Fields by This Weekend," Des Moines Register, October 23, 2019. |
| 31. |
CRS Report R45903, Retaliatory Tariffs and U.S. Agriculture. |
| 32. |
See CRS Report R45865, Farm Policy: USDA's 2019 Trade Aid Package; and CRS Report R45310, Farm Policy: USDA's 2018 Trade Aid Package. |
| 33. |
RMA, Common Crop Insurance Policy, 20-BR, Section 17(e)(1)(i), November 2019. |
| 34. |
Schwartz, "A Wet Year Causes Farm Woes Far Beyond the Floodplains." |
| 35. |
CRS Report R46132, U.S. Farm Income Outlook: November 2019 Forecast, by Randy Schnepf; and Economic Research Service, "2019 Farm Income Forecast," November 27, 2019. |
| 36. |
Crop insurance indemnity payments are financed from a combination of federal support for the program and producer-paid premiums. |
| 37. |
During the previous 10-year period (2009-2018), direct farm payments combined with crop insurance indemnity payments accounted for an average share of 23.5% of net farm income. |