Science, Technology, Engineering, and Mathematics (STEM) Education: An Overview
The term STEM education refers to teaching and learning in the fields of science, technology, engineering, and mathematics. It typically includes educational activities across all grade levels—from pre-school to post-doctorate—in both formal (e.g., classrooms) and informal (e.g., afterschool programs) settings. Federal policymakers have an active and enduring interest in STEM education, and the topic is frequently raised in federal science, education, workforce, national security, and immigration policy debates.
Various attempts to assess the federal STEM education effort have produced different estimates of its scope and scale. These efforts have identified between 105 and 254 STEM education programs and activities at 13 to 15 federal agencies. Annual federal appropriations for STEM education are typically in the range of $2.8 billion to $3.4 billion. All published inventories identify the Department of Education, National Science Foundation, and the Department of Health and Human Services as key agencies in the federal effort. Over half of federal STEM education funding is intended to serve the needs of postsecondary schools and students; the remainder goes to efforts at the K-12 educational level. Much of the funding for postsecondary students is in the form of financial aid, including fellowships and grants.
It is often suggested that the United States performs poorly in STEM education, but the data paint a complex picture. By some measures, U.S. students appear to be doing quite well. For example, overall graduate student enrollments in science and engineering (S&E) grew 15% over the last decade. Further, S&E degree attainment for groups traditionally underrepresented in STEM majors—such as Hispanic/Latino, African American, and female students—grew by 122%, 35%, and 37%, respectively. On the other hand, concerns remain about persistent academic achievement gaps between various demographic groups, STEM teacher quality, the rankings of U.S. students on international STEM assessments, foreign student enrollments and increased educational attainment in other countries, and the ability of the U.S. STEM education system to meet domestic demand for STEM labor.
Federal STEM education policy concerns center on broad issues—such as governance of the federal effort and broadening participation of underrepresented populations—as well as those that are specific to STEM education at the elementary, secondary, and postsecondary levels. Governance concerns focus on perceived duplication and lack of coordination in the federal effort; broadening participation concerns tend to highlight achievement and participation gaps between various demographic groups. A variety of policy options have garnered attention in recent years, relating to elementary, secondary, and postsecondary STEM education. At the K-12 level, these include proposals to address educational accountability, standards, and teacher quality. At the postsecondary level, proposals center on efforts to remediate and retain students in STEM majors.
This report is intended to serve as a primer on existing STEM education policy issues and programs. It covers the federal STEM education effort and the condition of STEM education in the United States, and examines selected policy issues central to the contemporary federal conversation about STEM education. It also provides a history of major federal legislative efforts impacting STEM education.
Science, Technology, Engineering, and Mathematics (STEM) Education: An Overview
Jump to Main Text of Report
Contents
- Introduction
- The Federal Effort in STEM Education
- Governance and Character of the Federal Effort
- Federal STEM Education Strategic Plan
- Key Agencies and Historical Trends
- Selected STEM Education Programs
- The Condition of U.S. STEM Education
- Overall Trends
- Policy Areas of Concern
- Participation of Traditionally Underrepresented Groups
- Quality and Quantity of STEM Teachers
- International Assessment Results
- Foreign Student Enrollment and Degree Attainment
- Global STEM Education Attainment
- U.S. STEM Labor Supply
- Legislative History and Recent Efforts
- Selected Historical Acts
- Land Ordinance of 1785 and Northwest Ordinance of 1787
- Marine Hospital Service Act of 1798 (1 Stat. 605)
- Morrill Acts of 1862 (12 Stat. 503) and 1890 (26 Stat. 417)
- National Science Foundation Authorization Act of 1950 (P.L. 81-507)
- National Defense Education Act of 1958 (P.L. 85-864)
- Elementary and Secondary Education Act of 1965 (P.L. 89-10)
- Higher Education Act of 1965 (P.L. 89-329)
- Department of Education Organization Act of 1979 (P.L. 96-88)
- Education for Economic Security Act of 1984 (P.L. 98-377)
- America COMPETES Act of 2007 (P.L. 110-69) and America COMPETES Reauthorization Act of 2010 (P.L. 111-358)
- Recent Legislative Efforts
- Every Student Succeeds Act
- Carl D. Perkins Career and Technical Education Act
- The American Innovation and Competitiveness Act
- Inspiring the Next Space Pioneers, Innovators, Researchers, and Explorers (INSPIRE) Women Act
Figures
- Figure 1. Structure of Federal STEM Policy Administration
- Figure 2. Federal STEM Education Funding by Primary Objective, FY2010
- Figure 3. Number of S&E Degrees Awarded from 1966 to 2015, by Degree Level
- Figure 4. Trends in 4th Grade Average NAEP Mathematics Scores from 1990 to 2017
- Figure 5. Trends in 8th Grade Average NAEP Mathematics Scores from 1990 to 2017
Tables
Summary
The term STEM education refers to teaching and learning in the fields of science, technology, engineering, and mathematics. It typically includes educational activities across all grade levels—from pre-school to post-doctorate—in both formal (e.g., classrooms) and informal (e.g., afterschool programs) settings. Federal policymakers have an active and enduring interest in STEM education, and the topic is frequently raised in federal science, education, workforce, national security, and immigration policy debates.
Various attempts to assess the federal STEM education effort have produced different estimates of its scope and scale. These efforts have identified between 105 and 254 STEM education programs and activities at 13 to 15 federal agencies. Annual federal appropriations for STEM education are typically in the range of $2.8 billion to $3.4 billion. All published inventories identify the Department of Education, National Science Foundation, and the Department of Health and Human Services as key agencies in the federal effort. Over half of federal STEM education funding is intended to serve the needs of postsecondary schools and students; the remainder goes to efforts at the K-12 educational level. Much of the funding for postsecondary students is in the form of financial aid, including fellowships and grants.
It is often suggested that the United States performs poorly in STEM education, but the data paint a complex picture. By some measures, U.S. students appear to be doing quite well. For example, overall graduate student enrollments in science and engineering (S&E) grew 15% over the last decade. Further, S&E degree attainment for groups traditionally underrepresented in STEM majors—such as Hispanic/Latino, African American, and female students—grew by 122%, 35%, and 37%, respectively. On the other hand, concerns remain about persistent academic achievement gaps between various demographic groups, STEM teacher quality, the rankings of U.S. students on international STEM assessments, foreign student enrollments and increased educational attainment in other countries, and the ability of the U.S. STEM education system to meet domestic demand for STEM labor.
Federal STEM education policy concerns center on broad issues—such as governance of the federal effort and broadening participation of underrepresented populations—as well as those that are specific to STEM education at the elementary, secondary, and postsecondary levels. Governance concerns focus on perceived duplication and lack of coordination in the federal effort; broadening participation concerns tend to highlight achievement and participation gaps between various demographic groups. A variety of policy options have garnered attention in recent years, relating to elementary, secondary, and postsecondary STEM education. At the K-12 level, these include proposals to address educational accountability, standards, and teacher quality. At the postsecondary level, proposals center on efforts to remediate and retain students in STEM majors.
This report is intended to serve as a primer on existing STEM education policy issues and programs. It covers the federal STEM education effort and the condition of STEM education in the United States, and examines selected policy issues central to the contemporary federal conversation about STEM education. It also provides a history of major federal legislative efforts impacting STEM education.
Introduction
The term STEM education refers to teaching and learning in the fields of science, technology, engineering, and mathematics. It typically includes educational activities across all grade levels—from pre-school to post-doctorate—in both formal (e.g., classrooms) and informal (e.g., afterschool programs) settings. Federal policymakers have an active and enduring interest in STEM education, and the topic is frequently raised in federal science, education, workforce, national security, defense, and immigration policy debates.
Although many observers cite the launch of the Soviet Union's Sputnik satellite in the 1950s as a key turning point for STEM education policy in the United States, federal interest in scientific and technological literacy writ large is long-standing and dates to at least the 1st Congress.1 For example, in the first State of the Union address, President George Washington called upon Congress to promote scientific knowledge for the sake of the republic and the polity:
Nor am I less persuaded that you will agree with me in opinion that there is nothing which can better deserve your patronage than the promotion of science and literature. Knowledge is in every country the surest basis of public happiness. In one in which the measures of government receive their impressions so immediately from the sense of the community as in ours it is proportionably [sic] essential.2
More recent concerns about scientific and technological proficiency of the population of the United States have focused on the relationship between STEM education and national prosperity and power. Since World War II, the United States has benefitted from the social, economic, health, and military advances made possible, in part, by a highly skilled STEM workforce. Today, a wide range of U.S. occupations—in STEM and non-STEM fields—either require or benefit from workers with STEM skills and knowledge.3 Most observers would likely argue that science and technology skills will continue to be as important in the future as they were in the past, if not more so. As such, many observers consider widespread STEM literacy, as well as specific STEM expertise, to be critical human capital competencies for the 21st century.
The education system is one major source of STEM skills and knowledge among the U.S. population.4 Federal legislators have paid close attention to the STEM-related outputs of that system—such as the number of college graduates with degrees in STEM fields or the performance of U.S. students on international mathematics tests—and have sought to increase its functioning and capacity through federal policy and investments. For example, over 300 bills containing just the term "science education" were introduced in the 20 years between the 105th (1997-1998) and 115th (2017-2018) Congresses. Agency reauthorization bills often contain STEM education-related provisions, and at least 14 federal agencies conduct STEM education programs or activities. The annual federal investment in STEM education programs, while difficult to estimate, is typically considered to be around $3 billion.5
Given policymakers' ongoing interest in the scope and scale of the federal STEM education effort, this report aims to provide an overview of the current and historical landscape of programs and issues in STEM education. The first section of this report examines federal agencies, programs, and funding for STEM education. The second section examines the performance of the U.S. STEM education system and outstanding issues that may be of interest to Congress. The final section of the report includes a list of major acts dealing with STEM education and provides a history of recent legislative efforts. Appendix A contains links to sources of STEM education data, and Appendix B includes descriptions of the federal STEM education effort from selected historical inventories.
|
Whether it is visas for foreign workers, scholarships for STEM majors, or funding for scientific research, the question of what is meant by the term STEM is central to the federal policy conversation. Some federal agencies, such as the National Science Foundation (NSF), generally use a broader definition of STEM that includes psychology and the social sciences (e.g., political science, economics) as well as the physical and life sciences and engineering (e.g., physics, chemistry, biology, mathematics).6 Others, including the Department of Homeland Security (DHS) and the U.S. Immigration and Customs Enforcement (ICE), use a narrower definition that generally excludes most (but not all) social sciences and focuses on mathematics, chemistry, physics, computer and information sciences, and engineering.7 The STEM Education Act of 2015 (P.L. 114-59) expressly added the term computer science to the definition of STEM education used by certain federal science agencies. However, some analysts argue that field-specific definitions are too static and that definitions of STEM should focus on "an assemblage of practices and processes that transcend disciplinary lines and from which knowledge and learning of a particular kind emerges."8 The lack of a common definition for STEM has contributed to confusion, and even contradictory findings, in federal agency, academic, and nonprofit research on the condition of the U.S. STEM workforce and labor supply.9 In order to increase the comparability of data, the interagency Standard Occupational Classification (SOC) Policy Committee published recommendations for defining STEM occupations in August 2012.10 The SOC Policy Committee recommended that STEM occupations fall into two domains: (1) Science, Engineering, Mathematics, and Information Technology,11 and (2) Science- and Engineering-Related.12 |
The Federal Effort in STEM Education
Governance and Character of the Federal Effort
The federal effort in STEM education can be thought of as consisting of two major components. The first component consists of programs that can be used for a variety of general educational purposes, and which may include STEM education as an optional element, but not as the main purpose. These include programs such as Title I-A of the Elementary and Secondary Education Act of 1965,13 which provides additional funds for school districts serving large concentrations of children living in poverty. These also include postsecondary federal student aid, consisting of Pell grants, student loans, and campus-based programs for students attending institutions of higher education (IHEs). Students who receive Pell grants or federal student loans may choose to use the money to pursue degrees in STEM fields; however, routing students into those fields is not the primary purpose of those programs.
The second component of the federal effort in STEM education consists of programs whose main stated goal is to improve STEM education outcomes in the United States, whether by supporting students in STEM fields directly, improving STEM teacher preparation, improving the quality of STEM programs at the K-12 and postsecondary educational levels, providing better access to STEM majors for traditionally underrepresented minorities, or through some other means. Even though the amount of money spent annually on these programs by the federal government is significantly lower than on those that make up the first component discussed above, these programs are the ones that most directly attempt to influence the quality of STEM education in the United States, and they will be the main focus of this report.
The overall structure of the administration of federal STEM policy is shown in Figure 1. The Office of Science and Technology Policy (OSTP) advises the President on scientific aspects of foreign and domestic policy.14 The National Science and Technology Council (NSTC) coordinates science and technology policy across the federal government.15 The responsibility for coordinating STEM education programs and initiatives across the federal government falls to the NSTC's Committee on STEM Education (CoSTEM). CoSTEM was established in 2011 in accordance with statutory requirements of the America COMPETES Reauthorization Act of 2010 (P.L. 111-358). Since its establishment, CoSTEM has carried out an inventory of the federal effort in STEM education (hereinafter referred to as NSTC-11)16 in response to concerns about the focus and possible overlap in the nature of federal approaches and has created and begun implementing the Federal STEM Education Five-Year Strategic Plan.17
 |
|
Source: Adapted from GAO, Science, Technology, Engineering, And Mathematics Education: Actions Needed to Better Assess the Federal Investment, Washington, DC, March 28, 2018, available at https://www.gao.gov/products/GAO-18-290. |
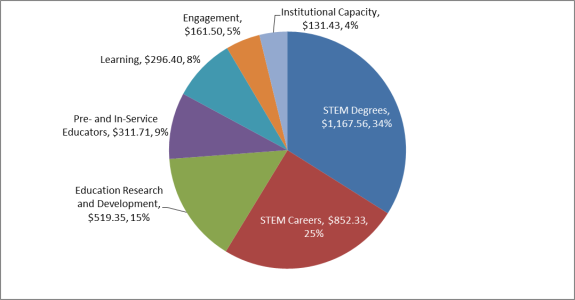
The NSTC-11 inventory found that, as of FY2011, federal agencies were making 254 distinct investments18 in STEM education for a total budgetary commitment of $3.4 billion. The inventory characterized federal investments in STEM education by primary objective. Of the eight pre-defined primary objectives, federal agencies reported the largest shares of their STEM investments were for the following: (1) increasing the number of postsecondary STEM degrees, (2) preparing people to enter into STEM careers, and (3) conducting STEM education research and development. The distribution of federal STEM investments by primary objective is shown in Figure 2. NSTC-11 also reported that nearly three-quarters (74%) of all federal STEM education investments had at least two secondary objectives in addition to the primary one.
The inventory also included NSTC's suggestions for possible approaches to improving the federal STEM education portfolio. These suggestions included consolidating programs, creating joint program solicitations across agencies, and developing data sharing, evaluation, and performance measurement tools. For more about the various attempts to catalogue the federal STEM education effort, see Appendix B.
The NSTC-11 inventory also attempted to identify the primary "audiences" (i.e., groups) that were being served by federal investments in STEM education. The majority of distinct investments—in terms of numbers of activities or programs (64%) and funding in dollars (54%) listed in NSTC-11—provided assistance to or services intending to benefit at least two primary categories of audience types. As shown in Table 1, the largest number of investments and the largest total funding were targeted toward undergraduate and graduate learners. Other categories—including K-12 students and K-12 STEM teachers—received substantial attention as well, both in terms of number of programs and total amount invested.
|
Audience |
Number of Investments |
Total Funding, |
|
Undergraduate Learners |
131 |
1,713 |
|
Graduate Learners |
104 |
1,527 |
|
K-12 Teachers |
94 |
1,199 |
|
K-12 Learners |
93 |
947 |
|
University Faculty |
65 |
926 |
|
Informal Educators |
58 |
425 |
|
Adults |
47 |
500 |
Source: CRS calculations using data from the Committee on STEM Education, National Science and Technology Council, Federal STEM Education Portfolio Report, December 2011, Table 6, p. 20.
Notes: The table is sorted by number of investments for each target audience category. The overall number of investments across audiences sums to a greater total than reported in the inventory because agencies responding to the inventory questions could indicate multiple primary audiences for each investment in STEM education. Programs providing funding for postgraduate researchers in the STEM disciplines were not included in the NSTC-11 inventory. Therefore, such programs are not reflected in the table.
Federal STEM Education Strategic Plan
CoSTEM's five-year strategic plan,19 mandated by the America COMPETES Reauthorization Act, was released in 2013. This plan was created with the goal of identifying priority STEM education investment areas where a coordinated federal strategy can be developed and implemented across federal agencies over a five-year period, leading to major improvements of the federal STEM effort. The strategic plan identified five such priority STEM education investment areas:
- 1. Improve STEM instruction. Prepare 100,000 excellent new K-12 STEM teachers by 2020, and support the existing STEM teacher workforce.
- 2. Increase and sustain youth and public engagement in STEM. Support a 50% increase in the number of U.S. youths who have an authentic STEM experience each year prior to completing high school.
- 3. Enhance STEM experience of undergraduate students. Graduate 1 million additional students with degrees in STEM fields over the next 10 years.
- 4. Better serve groups historically underrepresented in STEM fields. Increase the number of students from groups that have been underrepresented in STEM fields that graduate with STEM degrees in the next 10 years and improve women's participation in areas of STEM where they are significantly underrepresented.
- 5. Design graduate education for tomorrow's STEM workforce. Provide graduate-trained STEM professionals with basic and applied research expertise and ancillary skills needed for success in a broad range of careers.
Key Agencies and Historical Trends
According to the NSTC-11 program inventory and subsequent annual updates carried out by the OSTP,20 funding for the federal STEM education effort ranged from $2.8 billion to $3.4 billion in nominal dollars annually between the FY2010 baseline year and FY2016. (See Table 2.) No single federal agency is responsible for the entire federal effort in STEM education. Instead, STEM education programs are spread out across over a dozen federal agencies, with the largest shares (both by number of programs and total investment) housed at NSF (39.8% of total dollars), the Department of Health and Human Services (HHS, 21.1%), and the Department of Education (ED, 17.8%). As of FY2016, the Department of the Interior (DOI), DHS, and the Environmental Protection Agency (EPA) had the smallest STEM education budgets in the portfolio of federal agencies supporting STEM education.
Of the 14 federal agencies that have reported funding for STEM education programs during the period between FY2010 and FY2016, funding increased at four—the Corporation for National and Community Service (CNCS), the Department of Defense (DOD), HHS, and NSF—and remained constant at one (Department of Agriculture). Funding for STEM education at the remaining agencies decreased during this time. In terms of dollars spent, the largest increases in funding (between the FY2010 baseline and FY2016 enacted) were at HHS (+$52 million) and for STEM education-related activities within AmeriCorps programs at the CNCS (+$33 million).21 The largest decrease was at ED, a $455 million (or 46%) reduction in STEM education funding between FY2010 and FY2016. That decrease is largely attributable to the termination of the National Science and Mathematics Access to Retain Talent, or SMART Grants, program, after FY2010.22)
Table 2. Funding for Federal STEM Education Effort by Agency: FY2010 to FY2016
(in millions of nominal dollars)
|
Change (FY2016 from FY2010) |
|||||||||
|
Agency |
FY2010 Funding |
FY2011 Funding |
FY2012 Enacted |
FY2013 Actual |
FY2014 Enacted |
FY2015 Enacted |
FY2016 Enacted |
$ |
% |
|
CNCS |
0 |
0 |
0 |
0 |
14 |
14 |
33 |
33 |
n/a |
|
DOI |
1 |
4 |
3 |
3 |
3 |
3 |
3 |
2 |
200% |
|
DHS |
7 |
5 |
11 |
11 |
6 |
5 |
5 |
-2 |
-29% |
|
EPA |
17 |
20 |
26 |
17 |
20 |
19 |
8 |
-9 |
-53% |
|
NRC |
25 |
10 |
16 |
15 |
20 |
16 |
15 |
-9 |
-40% |
|
DOE |
63 |
51 |
49 |
68 |
49 |
50 |
52 |
-11 |
-17% |
|
DOC |
73 |
43 |
40 |
33 |
35 |
35 |
35 |
-38 |
-52% |
|
USDA |
91 |
88 |
88 |
75 |
89 |
90 |
91 |
0 |
0% |
|
DOT |
104 |
100 |
102 |
87 |
86 |
90 |
98 |
-6 |
-6% |
|
DOD |
126 |
152 |
153 |
137 |
132 |
142 |
138 |
12 |
10% |
|
NASA |
178 |
156 |
150 |
141 |
127 |
164 |
155 |
-24 |
-13% |
|
HHS |
577 |
582 |
582 |
599 |
619 |
616 |
629 |
52 |
9% |
|
ED |
986 |
544 |
517 |
463 |
507 |
528 |
531 |
-455 |
-46% |
|
NSF |
1,174 |
1,148 |
1,154 |
1,176 |
1,179 |
1,176 |
1,187 |
13 |
1% |
|
Total |
$3,420 |
$2,902 |
$2,889 |
$2,824 |
$2,885 |
$2,946 |
$2,979 |
-$441 |
-13% |
Source: CRS summary of data published by the Office of Science and Technology Policy as part of its Progress Report on Coordinating Federal STEM Education. Most recent update is available at https://obamawhitehouse.archives.gov/sites/default/files/microsites/ostp/stem_budget_supplement_fy_17_final.pdf.
Notes: Agencies presented in numerical order (smallest to largest amount of STEM education funding) based on FY2010 baseline funding level. Agencies listed include the Corporation for National and Community Service (CNCS), Department of the Interior (DOI), Department of Homeland Security (DHS), Environmental Protection Agency (EPA), Nuclear Regulatory Commission (NRC), Department of Energy (DOE), Department of Commerce (DOC), U.S. Department of Agriculture (USDA), Department of Transportation (DOT), Department of Defense (DOD), National Aeronautics and Space Administration (NASA), Department of Health and Human Services (HHS), Department of Education (ED), and National Science Foundation (NSF).
In recent years, there has been a push at the federal level to streamline the federal STEM education effort. This push has stemmed from concerns about the spread, overlap, and duplication of effort among the activities undertaken by the many federal STEM programs at the various agencies.23 For more information about the various attempts to catalogue the federal STEM programs, see Appendix B.
As Table 3 shows, the total number of distinct STEM education investments at federal agencies dropped by 51% between the FY2010 baseline year (254) and FY2016 (125).24 The agency with the largest change was NASA, which saw a 91% reduction (-57) in the number of investments over the observed period. The number of STEM education programs and activities was reduced by close to 50% at HHS (-18), NSF (-20), and DOC (-9) and by 75% at DHS (-3). DHS, however, started from a comparatively low base (four programs in FY2010). The agencies that saw net increases in the number of STEM education investments during the period from FY2010 to FY2016 were CNCS (+1), DOI (+2), and DOT (+1), all of which started with relatively low numbers of investments.
|
Change (FY2016 from FY2010) |
|||||||||
|
Agency |
FY2010 |
FY2011 |
FY2012 |
FY2014 |
FY2015 |
FY2016 |
# |
% |
|
|
CNCS |
0 |
0 |
0 |
0 |
1 |
1 |
1 |
1 |
n/a |
|
DOI |
1 |
0 |
0 |
0 |
0 |
3 |
3 |
2 |
200% |
|
DHS |
4 |
3 |
3 |
3 |
1 |
1 |
1 |
-3 |
-75% |
|
EPA |
8 |
7 |
7 |
6 |
7 |
7 |
5 |
-3 |
-38% |
|
NRC |
4 |
3 |
2 |
2 |
3 |
3 |
3 |
-1 |
-25% |
|
DOE |
26 |
22 |
22 |
21 |
15 |
17 |
15 |
-11 |
-42% |
|
DOC |
19 |
18 |
15 |
12 |
10 |
10 |
10 |
-9 |
-47% |
|
USDA |
17 |
18 |
16 |
12 |
13 |
13 |
13 |
-4 |
-24% |
|
DOT |
5 |
6 |
6 |
5 |
5 |
5 |
6 |
1 |
20% |
|
DOD |
16 |
17 |
16 |
16 |
11 |
11 |
11 |
-5 |
-31% |
|
NASA |
63 |
61 |
61 |
39 |
18 |
6 |
6 |
-57 |
-91% |
|
HHS |
36 |
36 |
26 |
24 |
21 |
19 |
18 |
-18 |
-50% |
|
ED |
14 |
11 |
12 |
11 |
12 |
12 |
12 |
-2 |
-14% |
|
NSF |
41 |
41 |
38 |
32 |
22 |
21 |
21 |
-20 |
-49% |
|
TOTAL |
254 |
243 |
224 |
183 |
139 |
129 |
125 |
-129 |
-51% |
Source: CRS summary of data published by the Office of Science and Technology Policy as part of its Progress Report on Coordinating Federal STEM Education. Most recent update is available at https://obamawhitehouse.archives.gov/sites/default/files/microsites/ostp/stem_budget_supplement_fy_17_final.pdf.
Notes: For comparability with Table 2, agencies presented in numerical order (smallest to largest) based on FY2010 baseline funding level. Agencies listed include the Corporation for National and Community Service (CNCS), Department of the Interior (DOI), Department of Homeland Security (DHS), Environmental Protection Agency (EPA), Nuclear Regulatory Commission (NRC), Department of Energy (DOE), Department of Commerce (DOC), U.S. Department of Agriculture (USDA), Department of Transportation (DOT), Department of Defense (DOD), National Aeronautics and Space Administration (NASA), Department of Health and Human Services (HHS), Department of Education (ED), and National Science Foundation (NSF).
Selected STEM Education Programs
This section of this report highlights some of the largest federal investments in STEM education. Measured by FY2016 budget authority, the three largest federal STEM education programs are National Research Service Awards ($477 million)25 at HHS, the Graduate Research Fellowship program ($332 million) at NSF, and the Mathematics and Science Partnership program (MSP, $153 million) at ED. However, because FY2016 was the final year of funding for the MSP program, this report highlights the next-largest program in the OSTP inventory, the Improving Undergraduate STEM Education program (IUSE, $105 million in FY2016) at NSF.
|
What Happened to the MSP Program? For many years, ED's MSP program26 was one of the largest federal STEM education programs (measured by annual budget authority) in the federal STEM education portfolio. It also once represented a significant share of ED's contribution to that portfolio. For example, the MSP program alone accounted for more than half (52%) of ED's STEM education portfolio in FY2012 ($150 million of $284 million). First authorized by the No Child Left Behind Act of 2001 (P.L. 107-110), ED's MSP program provided formula grants to states to increase the academic achievement of students in mathematics and science by enhancing the content knowledge and teaching skills of classroom teachers. With these funds, each state administered a grant competition in which awards were made to partnerships between high-need school districts and institutions of higher education. Grantees typically used funds to provide summer institutes and ongoing professional development designed to improve teachers' content knowledge through direct collaboration with scientists, mathematicians, and engineers. However, in 2015, Congress enacted the Every Student Succeeds Act (ESSA, P.L. 114-95). Among other things, ESSA repealed ED's MSP program authority and established a new block grant program—the Student Success and Academic Enrichment Grants program, also known as the "Title IV block grant"—to provide funds to state and local educational agencies for a wide variety of educational and education-related activities. These activities include STEM education activities; but because of the structure and style of the new program (e.g., formula block grant), funding for STEM education is indistinguishable (from a federal perspective) from funding for other authorized activities, such as the arts or foreign languages.27 The FY2017 authorized funding level for the Title IV block grant is $1.65 billion. The FY2017 appropriations for the Title IV block grant equaled $400 million. |
Ruth L. Kirschstein National Research Service Awards (HHS)
First funded in 1975, the Ruth L. Kirschstein National Research Service Awards (NRSA)—a combination of institutional grants and individual fellowships—constituted approximately three-quarters (76%) of HHS spending on STEM education in FY2016.28 Most NRSA funds support Institutional Research Training Grants, and a smaller portion supports individual fellowships. Institutional Research Training Grants are awarded to institutions to develop or enhance research training opportunities for individuals who are training for careers in specified areas of interest to the institution or principal investigator.29 Organizations within the National Institutes of Health (NIH)—for example, the National Institute on Aging—grant individual fellowship awards.
Graduate Research Fellowships (NSF)
The Graduate Research Fellowship (GRF) program is the oldest and largest STEM education program at NSF. Established in 1952, the GRF is one of the most prestigious national awards offered to STEM graduate students. Fellows receive three-year portable stipends for graduate study leading to research-based masters and doctoral degrees in fields related to NSF's mission. Applicants are chosen by a competitive, merit review-based grant-making process.
In FY2016, NSF issued 8,000 fellowships (including 2,000 new fellowships) worth up to $46,000 each.30 This amount includes a $12,000 cost-of-education (COE) allowance for the enrolling institution and a $34,000 stipend for the fellow.31 Total program funding in FY2016 was $332 million, an increase of $197 million (145%) from $136 million in the OSTP inventory baseline year (FY2010).
Improving Undergraduate STEM Education (NSF)
NSF's Improving Undergraduate STEM Education (IUSE) program supports projects that aim to improve the quality and effectiveness of education for undergraduate students in the STEM fields through the development of new and innovative curricular materials and methods of instruction, as well as new assessment tools for measuring student learning. Additionally, IUSE supports projects that aim to improve diversity of students and instructors in STEM education. IUSE provides awards in one of two tracks: Engaged Student Learning and Institutional and Community Transformation.32 IUSE's program solicitation for FY2018 and FY2019 lists an expectation of making 140 new awards. Awards can include up to $300,000 for up to three years for projects in the exploration and design stages and up to $3 million for up to five years for projects in the development and implementation stages.33
The Condition of U.S. STEM Education
No single fact or statistic can wholly capture the condition of STEM education in the United States, and for a variety of reasons, the question "What is the condition of STEM education in the United States?" may be unanswerable. However, some trends appear to have held over time, and in the most general sense, based upon some commonly examined indicators, the condition of STEM education in the United States may be characterized as having more or less held constant, and improved in some areas, over the course of the last four decades. This is not the entirety of the story, though. Looking at STEM education from this broad perspective disguises trends that raise concerns and drive policy in this area. Among these concerns are persistent achievement gaps between various demographic groups across both secondary and postsecondary education levels, U.S. K-12 student performance on international mathematics and science tests, U.S. K-12 STEM teacher quality, and the U.S. STEM labor supply.
Overall Trends
According to the U.S. Census Bureau, the percentage of U.S. bachelor's degree holders with undergraduate degrees in science and engineering (S&E) was 35.0% in 2016 (approximately 25.9 million people).34 This percentage is roughly consistent with the annual production of S&E bachelor's degrees in the United States across recent decades. NSF estimates that the percentage of bachelor's degrees in S&E fields has held relatively constant—at between approximately 30% and 35% of all bachelor's degrees—for the past four decades. However, in part because the U.S. college-age population grew during these years, the total number of S&E bachelor's degrees awarded annually more than tripled between 1966 and 2015 (from 184,313 to 650,057).35
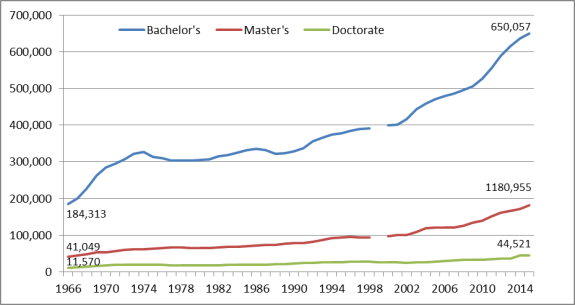
At the graduate level, S&E degrees dominate doctoral degree production. Since 1966, the percentage of doctorates in S&E fields has ranged between approximately 56% and 70% of all doctoral degrees (where a field of study has been reported).36 The total number of doctoral degrees in S&E fields has also more than tripled, growing from 11,570 in 1966 to 44,521 in 2015.37 Graduate enrollment in S&E shows similar upward trends, with an increase from about 493,000 to almost 668,000 between 2000 and 2015.38 Figure 3 displays the number of S&E degrees awarded, by degree level, over the last four decades.
|
Figure 3. Number of S&E Degrees Awarded from 1966 to 2015, by Degree Level |
 |
|
Source: National Science Foundation, National Center for Science and Engineering Statistics, "Table 1," Science and Engineering Degrees: 1966-2012, NSF 15-326, June 2015; IPEDS Completions from webCASPAR at https://ncsesdata.nsf.gov/webcaspar/. Notes: Includes only degrees where the field of study is known. Includes degrees awarded in the social sciences and psychology. Data not available for bachelor's and master's degrees in 1999. |
In K-12, U.S. student performance on standardized national mathematics tests has held constant or improved over the past four decades, as measured by performance on the National Assessment of Educational Progress (NAEP). NAEP is the only nationally representative, continuing assessment of elementary and secondary students' mathematics and science knowledge. NAEP is commonly discussed as a single assessment, but it is actually a series of four assessment programs: national assessment, state assessment, the trial urban district assessment, and the long-term trend assessment (LTT). Although the LTT has been in place since the late 1960s, the most commonly administered programs—the national and state NAEP assessments—began in 1990. Results discussed herein represent student achievement in the national NAEP program.
The national NAEP program assesses students biennially in grades 4 and 8. Students in grade 12 also participate in the national NAEP program, although less frequently. NAEP assessments are administered uniformly using the same sets of test booklets nationwide, and assessments are designed to be comparable from year to year. In mathematics, results are reported on a scale from 0-50039.
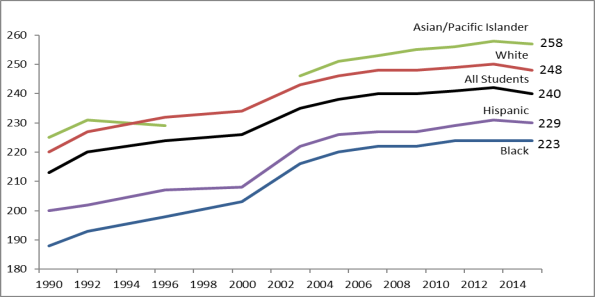
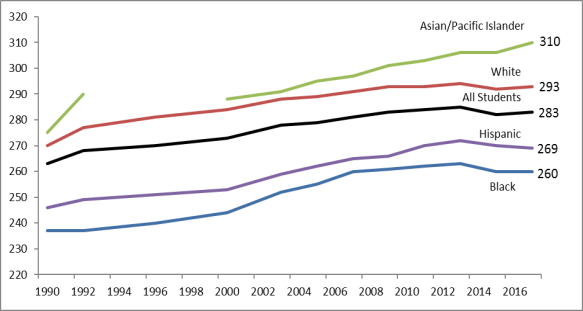
NAEP scores of students in 4th and 8th grades increased by 27 and 20 points, respectively, between 1990 and 2017.40 However, these scores have remained virtually unchanged over the past decade. Figure 4 and Figure 5 present average NAEP 4th and 8th grade math scores by various student subgroups. Although all group scores have improved over time, sizable gaps between groups have persisted.
The average scores of 12th grade students on the NAEP mathematics assessment were two points higher in 2015 than they were in 2005,41 when the test was first administered to this age group. The average scores on the NAEP science assessments administered to 12th graders remained unchanged from 2009 to 2015.
In addition to average scores, NAEP also presents student scores in terms of achievement levels. Achievement levels are performance standards that describe what students should know and be able to do. Results are reported as percentages of students performing at or above three achievement levels (Basic, Proficient, and Advanced). According to NAEP, students performing at or above the Proficient level on NAEP assessments demonstrate solid academic performance and competency over challenging subject matter.42 In 2017, 80% of fourth-grade students performed at or above the Basic level on the mathematics assessment. The same year, 40% of fourth-graders performed at or above the Proficient level, and 8% of fourth-graders performed at the Advanced level. Of eighth-grade students who took the NAEP mathematics assessment in 2017, 70% performed at or above the Basic level, 34% at or above the Proficient level, and 10% at the Advanced level.
Policy Areas of Concern
In some respects, the aforementioned trends paint a fairly optimistic picture for STEM education in the United States. Why, then, are so many observers so concerned about it? Those with concerns about STEM education cite a variety of data and trends as alarming. Among these are persistent achievement gaps between various demographic groups, concerns about adequate preparation of U.S. STEM teachers, and U.S. student performance on international mathematics and science assessments at the K-12 educational level. Other issues that garner attention include the proportion of foreign student enrollments in STEM programs in U.S. institutions of higher education, global STEM education attainment as it pertains to the U.S. position as a global leader in STEM education, and the availability of S&E graduates of sufficient quality and quantity to satisfy the demands of the U.S. STEM labor market.43
Participation of Traditionally Underrepresented Groups
A central topic in the conversation about STEM education focuses on achievement gaps among various racial and ethnic groups and between women and men with regard to certain STEM education outcomes, as well as underrepresentation of certain racial and ethnic minorities and women in STEM majors and careers. There are several reasons why these are considered concerns in discussions of the state of U.S. STEM education. Some observers view underrepresentation of certain demographic groups in STEM majors as an issue of limiting U.S. economic competitiveness: not including significant portions of the population in STEM majors and careers can decrease the talent pool for U.S. employers looking for the top workers with the best STEM skills. Others see it as an issue of equity and social justice: STEM degrees can lead to a variety of lucrative careers, and underrepresentation of minorities in those careers can keep those groups from increasing their economic prosperity and perpetuate economic gaps that exist in the United States.44 Research suggests that achievement gaps between underrepresented minorities and other groups at the K-12 level can often propagate into underrepresentation of those groups in STEM majors and careers,45 which is why issues of achievement gaps and underrepresentation are often considered as parts of the same concern. Achievement gaps and underrepresentation can be seen in a wide variety of STEM data, which show disparities by race, ethnicity, and gender in test scores, degree attainment, and employment.
Academic Achievement Gaps at the Elementary and Secondary Education Levels
Looking at the 4th and 8th grade NAEP mathematics assessments in 2017, there was at least a 19-point gap between the average scores of white students and their black and Hispanic counterparts.46 (See Figure 4 and Figure 5.) Such gaps have persisted throughout the history of the NAEP mathematics assessments at both the 4th and 8th grade levels. While this 19-plus point gap has persisted for two decades, students of all ethnicities and races have higher average scores in 2017 than they did in 1990.47 In terms of achievement-level results on the NAEP, 51% of white fourth-graders scored at or above a Proficient level in 2017, while 19% of black and 26% of Hispanic students did so. A similar picture exists at the eighth-grade level, where 44% of white students scored at or above Proficient, compared to 13% of black and 20% of Hispanic students. These achievement gaps between white students and students from certain minority groups are already present in elementary school and persist through the students' K-12 careers.
Differences in Postsecondary Education Degree Attainment
In addition to achievement gaps at the K-12 educational level, another central topic of discussion in conversations about STEM education policy is the underrepresentation of women and certain ethnic and racial groups in bachelor and doctoral degree attainment in science and engineering. For example, 19.8% of bachelor's degrees in engineering went to women in 2014.48 However, this percentage has increased significantly over time, as the corresponding number was 0.4% in 1966. On the other hand, the percentage of bachelor's degrees in mathematics and computer science awarded to women has decreased from 33.2% in 1966 to 25.5% in 201249. While women account for relatively small percentages of undergraduate degree recipients in certain STEM fields (as noted above), they accounted for 76.7% of the psychology degrees and 59.1% of the biological and agricultural sciences baccalaureate degrees in 2014.50 Women's proportion of STEM doctoral degrees (excluding the health sciences) grew from 39% in 2000 to 45% in 2015.51
Although gaps in postsecondary STEM degree attainment between certain demographics appear to be both pervasive and persistent, some evidence points to various types of improvement over time and in certain fields. For example, in the decade between 2000 and 2010, overall graduate enrollments in S&E fields grew by 35%. Among U.S. citizens and permanent residents, S&E graduate enrollments among Hispanic/Latino, American Indian/Alaska Native, and black/African American students grew at a higher rate than that of whites (not of Hispanic origin) and Asians.52 Additionally, the percentage of STEM bachelor's degrees awarded to Hispanic/Latino students grew from 7.7% in 2004 to 12.1% in 2014, which is a significantly faster rate than the rate of growth of the Hispanic/Latino population as a proportion of U.S. population during this time. However, during the same period, the percentage of STEM bachelor's degrees awarded to black/African-American students remained virtually constant at just below 9%.53
Differences in Occupational Outcomes
Historically, women and certain minorities—especially blacks/African-Americans and Hispanics/Latinos—have been underrepresented in STEM employment. Researchers have found that individuals from these groups are less likely to start and persist in STEM majors during college,54 which can explain part of the gap in STEM employment, since most STEM workers have degrees in STEM fields.55
While women remain underrepresented in STEM occupations, making up 26% of STEM workers in the U.S. in 2011, their representation in all fields of STEM professions is greater than it was in the 1970s. The percentage of women in STEM fields varies greatly by type of STEM occupation. According to the U.S. Census Bureau, in 2011 women comprised 13% of engineers, 27% of computer professionals, 41% of life and physical scientists, 47% of mathematical workers, and 61% of social scientists. The share of women in each of these fields has grown steadily since the 1970s, with the exception of computer professions, in which the share of women has been on the decline since 1990.56
Black and Hispanic individuals are also underrepresented in STEM occupations. In 2011, blacks, who made up 11% of the overall workforce, held 6% of STEM jobs, and Hispanics, who made up 15% of the workforce, held 7% of STEM jobs. As is the case for the representation of women, racial and ethnic representation differs by specific STEM field. However, in each of the major STEM occupational fields as defined by the U.S. Census, blacks and Hispanics were underrepresented in 2011. The gaps between share of the total workforce and share of the STEM workforce for black and Hispanic workers have persisted since the 1970s and grew for both groups between 2000 and 2011.57
Quality and Quantity of STEM Teachers
Many observers look to the nation's K-12 teaching force as a source of shortcomings in student mathematics and science achievement. Research on teacher quality conducted over the last 20 years suggests that, among those who teach mathematics and science, having a postsecondary degree in the subject they teach positively affects student achievement.58 Many U.S. mathematics and science teachers lack degrees in the subjects they teach. For example, nearly all high school teachers have at least a baccalaureate degree; however, mathematics teachers are less likely than teachers of other subject areas to have majored in the subject they teach. In the 2007-2008 school year, roughly 17% of all high school teachers did not major in the subject they taught, while 28% of mathematics teachers did not major in mathematics.59
International Assessment Results
Another area often cited as concerning is how U.S. students compare with their peers in other nations in their knowledge of mathematics and science. While U.S. students usually score above the all-country average on international mathematics and science tests, they typically score below the average of industrialized nations. For example, on the 2015 Program for International Student Assessment (PISA), U.S. 15-year-olds ranked below the Organization for Economic Cooperation and Development (OECD) average in mathematics and ranked at the OECD average in science.60 U.S. students fare better on the Trends in International Mathematics and Science Study (TIMSS); U.S. 8th graders ranked ninth in mathematics and eighth in science out of the 34 education systems that participated in the 2015 TIMSS assessment.61 There is some evidence that U.S. student performance in mathematics and science is improving over time. U.S. 8th graders' average mathematics and science scores in 2015 were higher than on any previous administration of the TIMSS, which has been offered since 1995.
Some observers caution against using student assessments to compare nations. A variety of factors may influence test results, including translation issues, differences in test administration, student effort,62 and the selection and diversity of test takers. The latter issue is often raised by critics of international assessments when looking at U.S. student performance. Some observers say that low performance in the United States is closely related to poverty, though the same reasoning applies to other countries. One analysis of the 2009 PISA results found that the richest U.S. areas (especially areas with less than 10% poverty) perform better than most other nations.63 Other analysts assert that (in general) improved performance on international assessments could have positive effects on long-term economic growth.64
Foreign Student Enrollment and Degree Attainment65
Although the number of degrees awarded in STEM fields has increased over time, many analysts are concerned about the percentage of STEM degrees that go to foreign students. For example, foreign students earned 15,000 STEM doctorates at U.S. universities in 2015, up from about 8,500 in 2000. Foreign students' share of STEM doctorates rose from 30% in 2000 to 34% in 2015. In some fields, these students earned even larger shares of doctoral degrees. In 2015, they earned half or more of doctoral degrees awarded in engineering, computer sciences, and economics. They earned relatively lower proportions of doctoral degrees in other S&E fields—for example, 28% in biological sciences, 20% in medical sciences, 6% in psychology, and less than 25% in most social sciences (except economics).66 Overall, the percentage of doctoral degrees going to foreign students has been generally increasing since the mid-1970s.67
The presence of foreign students in U.S. graduate STEM programs has been and continues to be of concern to some analysts because foreign graduates may not be eligible for work in the United States or in certain jobs requiring security clearance. Other observers suggest that these trends may mean missed opportunities or depressed wages for U.S. citizens and permanent residents who may be displaced by foreign graduates. Some analysts say that federal policymakers should encourage foreign STEM students to study and stay in the United States, arguing that policies meant to attract the world's best and brightest are key to ensuring U.S. competitiveness.68
Global STEM Education Attainment
In addition to concerns about foreign students obtaining STEM graduate degrees at U.S. institutions, some observers assert that the United States is falling behind other nations in the production of total STEM degrees after having been the world leader in educational attainment for several decades after World War II. Of the approximately 7.5 million undergraduate degrees awarded globally in S&E in 2014, students in India earned about 25%, students in China earned about 22%, European Union students earned about 10%, and U.S. students earned about 10%.69 The number of S&E degrees awarded annually has been growing much faster over the past two decades in India and China than in the United States.70
Further, while the United States awarded the largest number of total S&E doctoral degrees in 2014 (about 40,000 compared to China's 34,000 and India's 13,000), in 2007 China overtook the United States to become the world leader in the number of doctoral degrees awarded in the specific fields of natural sciences and engineering. While China has a much higher population than the United States and can therefore be expected to produce more STEM graduates and Ph.D.s, the rate of growth of Chinese STEM degree production is significantly higher than that in the United States. The high growth of graduate education in China has been facilitated by large government investments in higher education over the last 20 years, intended to establish world-class universities in that country.71
Some researchers have challenged these degree production numbers, arguing that in some cases the United States produces higher quality graduates and that country-level comparisons are misleading because the statistics are not based on common methodologies or definitions.72
U.S. STEM Labor Supply73
Shortage Debate
Many business, academic, and policy leaders assert that U.S. STEM education weaknesses have contributed (or will soon contribute) to national S&E workforce shortages. They further contend that this labor supply problem has diminished U.S. global economic competitiveness and threatened national security (or will do so in the future).74 However, some observers argue that perceived limitations in the U.S. S&E workforce are overstated and that U.S. competitiveness is not threatened by across-the-board S&E labor shortages and does not require a supply-side response.75 A third view holds that perceptions of S&E workforce shortages are accurate if the increasing numbers of jobs that are technically non-STEM but require STEM competencies (e.g., analytical skills) are included in labor demand calculations.76
A 2015 report by the National Science Board on the condition of the STEM workforce in the United States concluded that there is not a single "yes" or "no" answer to the question of whether the United States has a surplus or shortage of STEM workers. Rather, the report emphasized the importance of coordination between education providers and employers to ensure proper alignment of supply and demand through career pathways.77
According to the U.S. Census Bureau, there were 7.2 million STEM workers (6% of the total workforce) in the United States in 2011. About 70% of these workers had at least a bachelor's degree. However, the bureau states that "the vast majority of workers who have been trained in science and engineering are not currently working in a STEM occupation." Those who majored in engineering or computers/mathematics/statistics had the highest rates of employment in STEM occupations (49% each). The next-highest rate of STEM employment (27%) was among those who majored in physical and related sciences. Education majors had the lowest STEM employment rate overall (2%).78
Legislative History and Recent Efforts
Depending on how broadly the term is defined, federal interest in STEM education may be traced to the 1st Congress. Several institutions that would become central parts of the federal STEM education effort—such as HHS (1798, 1 Stat. 605),79 the Smithsonian Institution (1846, 9 Stat. 103), the National Academy of Sciences (a private nonprofit chartered by Congress in 1863, 12 Stat. 806), and ED (originally the Office of Education, 1867, 14 Stat. 434)—were in place before the United States celebrated its first centennial.
Federal STEM education policymaking intensified after World War II. The desire to maintain the scientific achievements of the war led to the creation of NSF in 1950. By 1952, NSF was issuing Graduate Research Fellowship awards to promising STEM graduate students. The Soviet Union's launch of the first artificial satellite, Sputnik, triggered fears that the United States was falling behind in mathematics and science education and led to the National Defense Education Act of 1958, which some cite as the first federal foray into STEM education policy in the modern era.
The 114th and 115th Congresses saw some legislative action that will have an effect on the federal effort in STEM education. For example, the Every Student Succeeds Act, reauthorizing the Elementary and Secondary Education Act of 1965, was enacted in December 2015, significantly changing the federal involvement in STEM education at the elementary and secondary education levels.
The following section discusses selected historical federal STEM education measures,80 as well as legislative efforts in the 114th and 115th Congresses that are relevant to STEM education policy.
Selected Historical Acts
Land Ordinance of 178581 and Northwest Ordinance of 178782
The Land Ordinance of 1785 was one of a series of three measures providing for the political and geographic incorporation of the Northwest Territories in the Union. These measures were passed by the Continental Congress after the Revolutionary War and prior to the adoption of the Constitution. Drafted primarily for the purpose of disposing of land in the territories, the Land Ordinance of 1785 directed surveyors to establish townships in the territories. These townships were to be subdivided into lots, one of which (lot number 16) was to be preserved for the maintenance of a public school. The Land Ordinance's more famous cousin, the Northwest Ordinance of 1787, established governments in the territories and provided for the civil liberties of the inhabitants. On the question of education the Northwest Ordinance said, "Religion, morality and knowledge, being necessary to good government and the happiness of mankind, schools and the means of education shall forever be encouraged."83
Marine Hospital Service Act of 1798 (1 Stat. 605)84
Congress established the Marine Hospital Service (MHS) in 1798 to provide medical care for merchant seamen. Many federal health agencies trace their origin to the establishment of the MHS, including NIH, which began as the Hygienic Laboratory within the MHS in 1887. The Ransdell Act of 1930 (P.L. 71-251) re-designated the Hygienic Laboratory as the NIH and authorized fellowships at the institute. Although NIH education and training funding in the 1930s, 1940s, and 1950s primarily focused on post-doctoral researchers and clinical traineeships for physicians, in 1948 the National Cancer Institute began awarding funds to institutions to improve undergraduate education.85 In 1974 Congress established the NRSA at NIH. The National Research Service Award Act (P.L. 93-348) consolidated and established under a single authority existing research and fellowship authorities. P.L. 107-206 renamed the NRSA the "Ruth L. Kirschstein National Research Service Award" in 2002.
Morrill Acts of 1862 (12 Stat. 503)86 and 1890 (26 Stat. 417)
The Morrill Act of 1862 authorized the sale of federal lands and distribution of the proceeds to the states for the purpose of establishing land-grant colleges in the "mechanic arts" (e.g., engineering, manufacturing, inventions), agriculture, and military tactics. The 1890 Morrill Act expanded the purposes of the colleges to include "agriculture, the mechanic arts, the English language, and the various branches of mathematical, physical, natural, and economic science." These provisions were repealed in 1981 and replaced with "food and agricultural sciences."87 Colleges funded by these acts include the Massachusetts Institute of Technology, Clemson University, and many U.S. Historically Black Colleges and Universities.88
National Science Foundation Authorization Act of 1950 (P.L. 81-507)89
NSF was established in 1950—in part—to "develop and encourage the pursuit of a national policy for basic research and education in the sciences."90 NSF distributed its first fellowships to pre- and post-doctoral STEM students in 1952. As early as 1953, NSF began supporting teacher institutes as a means of improving STEM education in the lower grades.91 Although both Congress and the President have made changes to NSF since its founding, STEM education has remained a core function of the agency.
National Defense Education Act of 1958 (P.L. 85-864)
Passed in 1958 in response to the Soviet Union's launch of Sputnik, the National Defense Education Act (NDEA) sought to address concerns about "existing imbalances in our educational programs which have led to an insufficient proportion of our population educated in science, mathematics, and modern foreign languages and trained in technology."92 Among its many provisions, the NDEA authorized the first federal student loan program; provided funds to states for science, mathematics, and modern foreign language instruction; and authorized grants to states for programs to identify and encourage gifted students.
Elementary and Secondary Education Act of 1965 (P.L. 89-10)93
The primary source of federal aid to K-12 education is the Elementary and Secondary Education Act (ESEA).94 ESEA was initially enacted in 1965 and was most recently amended and reauthorized by the Every Student Succeeds Act (P.L. 114-95). STEM education was not central to the ESEA as originally constructed in 1965, but STEM-specific provisions have been added in subsequent reauthorizations. See the passage below on the Every Student Succeeds Act under "Recent Legislative Efforts."
Higher Education Act of 1965 (P.L. 89-329)
The Higher Education Act (HEA) authorized a series of programs (not limited to STEM education) that provide federal aid and support to institutions of higher education, as well as a broad array of federal student aid programs that assist students and their families with paying the costs of obtaining a postsecondary education. The HEA student aid programs are the primary source of direct assistance to students, supporting postsecondary pursuits in STEM and other fields. The HEA was most recently amended in 2008 by the Higher Education Opportunity Act (P.L. 110-315). However, the only major explicitly STEM-focused postsecondary program administered by ED was enacted by the Higher Education Reconciliation Act of 2005 (HERA; P.L. 109-171). The HERA amendments included authorization of appropriations for the SMART Grant program, which provided for $4,000 grants to students majoring in STEM fields. Congress provided that the program sunset at the end of the 2010-2011 academic year. Approximately $1.4 billion in grants were awarded between FY2006 and FY2010.
Department of Education Organization Act of 1979 (P.L. 96-88)
The Department of Education Organization Act established ED as an independent federal agency. Section 304 of the act transferred science education programs established at NSF to ED.95 Excluded from this directive were programs that related to scientific career development, continuing education of scientific personnel, career-focused broadening participation programs, research and development in science learning, and programs to inform the general public about the nature of science and technology and related policy issues. The conference report on the final bill included two specific examples of NSF programs to be transferred to ED: Elementary and Pre-school Science Teacher Training and Minority Institutions Science Improvement.96 The act provided only for the transfer of programs in existence at the time of enactment and included a provision affirming NSF's authority to initiate and conduct programs under its originating act (P.L. 81-507).
Education for Economic Security Act of 1984 (P.L. 98-377)
The Education for Economic Security Act of 1984 authorized teacher institutes and mathematics and science education development programs at NSF, directed ED to provide grants to states and local educational agencies for STEM teacher training and development, and authorized presidential awards for teaching in mathematics and science, among other things. The act was enacted following publication of several reports—most notably A Nation at Risk—that were highly critical of the U.S. education system and amid growing concerns about international competitiveness in the wake of the 1970s recession and apparent ascendancy of the Japanese and German economies.
America COMPETES Act of 2007 (P.L. 110-69) and America COMPETES Reauthorization Act of 2010 (P.L. 111-358)97
The America COMPETES Act and its 2010 reauthorization authorize a variety of STEM education programs at several federal science agencies and ED. Most of the specified STEM education authorizations of appropriations in these acts are at NSF, but the acts also contain STEM education provisions for the Department of Energy, NASA, and the National Oceanic and Atmospheric Administration. Among other things, the 2010 reauthorization established a federal government-wide STEM education coordinating committee under NSTC. The American Innovation and Competitiveness Act (AICA; P.L. 114-329) reauthorized portions of the COMPETES Acts. See the section "The American Innovation and Competitiveness Act" under Recent Legislative Efforts for a description of AICA.
Recent Legislative Efforts
Every Student Succeeds Act98
The Every Student Succeeds Act (ESSA; P.L. 114-95) reauthorized the ESEA and was signed into law by President Obama in December 2015. It made changes to STEM education provisions that had been contained in previous reauthorizations of the ESEA. The biggest change with respect to STEM education programs was the elimination of the Math and Science Partnerships program. Instead, STEM education is an allowable use of funds in the new Title IV block grant that provides aims to "provide all students with access to a well-rounded education."99 Additionally, ESSA authorized the STEM Master Teacher Corps program that would provide salary bonuses and professional development opportunities to outstanding teachers of STEM subjects.
Carl D. Perkins Career and Technical Education Act100
The Carl D. Perkins Career and Technical Education Act of 2006 (Perkins Act; P.L. 109-270) is the main federal law supporting the development of career and technical skills among students in secondary and postsecondary education. The Perkins Act aims to improve academic outcomes and preparedness for higher education or the labor market among students enrolled in career and technical education programs, which often include STEM occupational fields such as advanced manufacturing or information technology. Total appropriations for the Perkins Act have averaged approximately $1.1 billion over the last 10 years. In the 115th Congress, the House of Representatives undertook efforts to reauthorize the Perkins Act, which expired in FY2013. The House passed the Career and Technical Education for the 21st Century Act (H.R. 2353),101 which would provide more flexibility for the states with respect to setting annual performance targets and the consequences of not meeting those targets.
The American Innovation and Competitiveness Act
The American Innovation and Competitiveness Act (AICA; P.L. 114-329) was signed into law in January 2017. The AICA reauthorized portions of the America COMPETES Act and had a number of provisions related to federal investments in STEM education. In particular, the AICA directed NSF to award grants to increase the participation of underrepresented populations in STEM fields. It also created an interagency advisory panel and working group on STEM education to advise NSTC's Committee on STEM Education and OSTP. It directed NSF to expand grant programs for research into computer science education, encouraged the creation of a grant program supporting STEM apprenticeship opportunities, and promoted efforts to expand undergraduate research opportunities and recognize outstanding mentors in STEM fields.
Inspiring the Next Space Pioneers, Innovators, Researchers, and Explorers (INSPIRE) Women Act
This act, known as the INSPIRE Women Act (P.L. 115-7) was signed into law in February 2017. It directs NASA to encourage women and girls to study STEM fields and pursue careers in aerospace through support of NASA's existing programs, including NASA Girls and NASA Boys, Aspire to Inspire, and Summer Institute in STEM.102
Appendix A. Data Sources and Major Publications
A number of sources and major publications provide data about the federal STEM education effort and the condition of STEM education in the United States and around the globe. This appendix includes links to sources and publications where readers can find STEM education data and information.
National and International Assessments
- National Assessment of Educational Progress (NAEP). The NAEP is the largest nationally representative and continuing assessment of U.S. K-12 students, usually taken by students in grades 4, 8, and 12. There are two NAEP assessments: Main NAEP and Long-Term Trends (LTT). The Main NAEP administers assessments in 12 subject areas, including mathematics and science. The LTT assesses mathematics and reading. In 2013, ED launched a pilot NAEP assessment in technology and engineering literacy. The first such assessment was carried out in 2014.103
- Trends in International Mathematics and Science Study (TIMSS). TIMSS is an international test that assesses the mathematics and science achievements of U.S. 4th and 8th grade students in a manner designed to be comparable across countries. The most recent TIMSS assessment was administered in 2015.104
- Program for International Student Assessment (PISA). PISA assesses the reading, mathematics, and science literacy of 15-year-old students in dozens of industrialized and developing nations. Data collection for the most recent PISA assessment was completed in fall 2015.105
Federal Programs and Inventories
- U.S. Government Accountability Office (GAO), Science, Technology, Engineering, and Mathematics Education: Actions Needed to Better Assess the Federal Investment (GAO-18-290). This 2018 GAO report on federal STEM education programs includes an inventory of federal STEM education programs and policy recommendations.106
- National Science and Technology Council, A Report from the Federal Inventory of STEM Education Fast-Track Action Committee (NSTC-11) and A Report from the Federal Coordination in STEM Education Task Force (NSTC-12). These reports provide an inventory of federal STEM education investments from FY2008 to FY2010 actual (in the 2011 report) and an update with information from FY2011 enacted to FY2013 requested (in the 2012 report).107
- U.S. Department of Education, Academic Competitiveness Council (ACC), Report of the Academic Competitiveness Council—The 2007 ACC report provides an inventory of federal STEM education programs with funding data from FY2005 actual to the FY2007 President's budget request. It also includes policy recommendations and an assessment of STEM education program evaluations from across the federal enterprise.108
- GAO, Higher Education: Federal Science, Technology, Engineering, and Mathematics Programs and Related Trends (GAO-06-114). This 2005 GAO report includes an inventory of federal STEM education programs and assesses program goals and constituencies served.109
Condition of STEM Education
- National Science Board, Science and Engineering Indicators 2016. This publication provides, among other things, one of the most comprehensive collections of key STEM indicators. It is published every two years.110
- NSF, National Center for Science and Engineering Statistics (NCSES). NCSES compiles and analyzes a variety of STEM data. Much of this data may be found in Science and Engineering Indicators, but the NCSES website includes separate, detailed, and timely publications on various STEM education data.111
STEM Education and the Workforce
- GAO, Science, Technology, Engineering, and Mathematics Education: Assessing the Relationship between Education and the Workforce (GAO-14-374). This 2014 GAO report assesses the trends in STEM degrees awarded in the United States and available jobs over the course of a decade.112
At the request of Congress, five inventories of federal STEM education programs and activities have been published since 2005: three by GAO, one by the Academic Competitiveness Council (ACC), and one by the NSTC. The first GAO study, in 2005, found 207 distinct federal STEM education programs funded at about $2.8 billion in FY2004. In 2007, the ACC found 105 STEM education programs funded at about $3.1 billion in FY2006. A 2011 report by the NSTC identified 252 distinct investments in STEM education funded at about $3.4 billion in FY2010. That NSTC report has been updated annually and identified 125 distinct investments in FY2016 (see Table 3 above). A second GAO study, published in 2012, reported 209 programs funded at about $3.1 billion in FY2010. A follow-up to that GAO report, published in 2018, found 163 programs funded at about $2.9 billion in FY2016.
The discrepancies between these inventories indicate that measuring and categorizing the federal effort in STEM education is complex and subject to methodological challenges. Differences between the inventories are due, in part, to the lack of a common definition of what constitutes a STEM education program or activity. Auditors have also found STEM education activities performed by science mission agencies difficult to capture because such activities tend to be fiscally and organizationally integrated into what are otherwise primarily scientific research programs. Funding calculations and program identification become even more intricate when broad-purpose education programs with a STEM goal are considered (e.g., teacher training programs that focus on mathematics in addition to other fields such as reading). Finally, some estimates of federal STEM education activities depend on agency self-reporting, which is a less reliable auditing method.
Author Contact Information
Acknowledgments
Jeff Kuenzi, CRS Specialist in Education Policy, and Heather Gonzalez developed and co-authored previous versions of this report.
Footnotes
| 1. |
Earlier examples include debate at the Constitutional Convention about whether to empower the federal government "to establish seminaries for the promotion of literature and the arts and sciences." James Madison, "Saturday, August 18," Notes of Debates in the Federal Convention of 1787, see TeachingAmericanHistory.org. |
| 2. |
U.S. President George Washington, First Annual Message to Congress on the State of the Union, January 8, 1790, The American Presidency Project website. |
| 3. |
For a visual representation of occupational sectors that require STEM skills, see https://www.census.gov/dataviz/visualizations/stem/stem-html/. |
| 4. |
Immigration, while outside the scope of this report, is another source of STEM skills and knowledge. For more information on foreign workers with STEM degrees, see CRS Report R42530, Immigration of Foreign Nationals with Science, Technology, Engineering, and Mathematics (STEM) Degrees, by [author name scrubbed]. |
| 5. |
See the section "Key Agencies and Historical Trends" for a more detailed discussion of federal STEM funding. |
| 6. |
The America COMPETES Act of 2010 (P.L. 111-358) defines the term STEM for the agencies it authorizes, including NSF. Under Section 2, the term STEM means "the academic and professional disciplines of science, technology, engineering, and mathematics." NSF funds research in mathematics, the physical sciences, and engineering, as well as in psychology and the social sciences. |
| 7. |
See ICE, STEM-Designated Degree Program List, effective as of May 10, 2016. |
| 8. |
Jean Moon and Susan Rundell Singer, "Bringing STEM into Focus," Education Week, vol. 31, no. 19 (February 1, 2012), pp. 32, 24. |
| 9. |
This challenge is more fully described in National Science Board, Revisiting the STEM Workforce: A Companion to Science and Engineering Indicators 2014, NSB-2015-10, February 4, 2015. |
| 10. |
U.S. Department of Labor, Bureau of Labor Statistics, Standard Occupational Classification, 2010 SOC Crosswalks, August 2012. |
| 11. |
Includes two subdomains: (1) life and physical science, engineering, mathematics, and information technology occupations, and (2) social science occupations. |
| 12. |
Includes two subdomains: (1) architecture occupations, and (2) health occupations. |
| 13. |
The Elementary and Secondary Education Act of 1965 (ESEA) was most recently reauthorized by the Every Student Succeeds Act (P.L. 114-95) in 2015. |
| 14. |
For more information on the OSTP, see CRS Report R43935, Office of Science and Technology Policy (OSTP): History and Overview, by [author name scrubbed] and [author name scrubbed]. |
| 15. |
The NSTC was established under President Clinton by Executive Order 12881 in 1993. It is tasked with coordinating the science and technology policymaking process, integrating the President's science and technology policy agenda across the federal government, ensuring that science and technology considerations are taken into account in the development and implementation of federal policies and programs, and furthering international cooperation in science and technology. In recent years, the NSTC has been led by the director of the Office of Science and Technology Policy (OSTP). |
| 16. |
CoSTEM, The Federal Science Technology, Engineering, and Mathematics (STEM) Education Portfolio, December 2011, https://obamawhitehouse.archives.gov/sites/default/files/microsites/ostp/costem__federal_stem_education_portfolio_report.pdf. While NSTC-11 was the most extensive inventory of the federal STEM portfolio carried out by CoSTEM, some of its findings have been updated by the OSTP on an annual basis (see Table 2 and Table 3). |
| 17. |
CoSTEM, Federal Science Technology, Engineering, and Mathematics (STEM) Education 5-Year Strategic Plan, May 2013, https://obamawhitehouse.archives.gov/sites/default/files/microsites/ostp/stem_stratplan_2013.pdf. |
| 18. |
An "investment" is defined in NSTC-11 as a funded STEM education activity that had a dedicated budget of more than $300,000 in FY2010 and staff to manage the budget. This budget may be part of a budget for a larger program. Activities that are one-time or irregular expenditure of overhead funds are excluded. |
| 19. |
Available at https://www.whitehouse.gov/sites/whitehouse.gov/files/ostp/Federal_STEM_Strategic_Plan.pdf. |
| 20. |
Most recently, the OSTP published the Progress Report on Coordinating Federal STEM Education in March 2016. It is available at https://obamawhitehouse.archives.gov/sites/default/files/microsites/ostp/stem_budget_supplement_fy_17_final.pdf. |
| 21. |
More information about the STEM AmeriCorps initiative is available at http://www.nationalservice.gov/special-initiatives/task-force-expanding-national-service/stem-americorps. |
| 22. |
More information about SMART Grants is available at http://www2.ed.gov/programs/smart/index.html. |
| 23. |
See GAO, Science, Technology, Engineering, And Mathematics Education: Strategic Planning Needed to Better Manage Overlapping Programs across Multiple Agencies, Washington, DC, January 20, 2012, https://www.gao.gov/products/GAO-12-108; and GAO, Science, Technology, Engineering, And Mathematics Education: Actions Needed to Better Assess the Federal Investment, Washington, DC, March 28, 2018, https://www.gao.gov/products/GAO-18-290. |
| 24. |
Exact assessments of the number of federal STEM programs vary based on the definitions used. For example, GAO's 2018 survey Science, Technology, Engineering, And Mathematics Education: Actions Needed to Better Assess the Federal Investment found 163 distinct federal STEM programs in FY2016. However, this CRS report presents data from OSTP's program inventories, as their definition of "STEM investment" has remained consistent between FY2010 and FY2016. |
| 25. |
This amount includes funding for Institutional Research Training Grants (T32, T35) and individual fellowships. Executive Office of the President, Office of Science and Technology Policy, Progress Report on Coordinating Federal Science, Technology, Engineering, and Mathematics (STEM) Education Investments, March 2016, p. 25. |
| 26. |
In addition to ED's MSP, the 107th Congress created a companion program at NSF. NSF's companion program was also initially called the Mathematics and Science Partnership (MSP) program, and was intended to partner closely with ED's MSP. In FY2014 NSF merged its MSP with Computing Education for the 21st Century and relaunched it as the Science, Technology, Engineering, Mathematics, including Computing Partnerships (STEM+C) program. For more information on the STEM+C program, see https://www.nsf.gov/funding/pgm_summ.jsp?pims_id=505006. |
| 27. |
See P.L. 114-95, Section 4104, for a list of allowable uses. |
| 28. |
FY2016 funding for NRSA Institutional Research Training Grants (T32, T35) was $473 million. FY2016 funding for Individual Pre-doctoral Fellows was $4 million. Total STEM education funding at NIH in FY2016, according to the FY2017 OSTP inventory, was $629 million. |
| 29. |
More information about Institutional Research Training Grants is available at http://grants.nih.gov/training/nrsa.htm. |
| 30. |
The GRF program is co-funded by NSF's main research and education accounts, as per Section 510 of the America COMPETES Reauthorization Act of 2010 (P.L. 111-358). National Science Foundation, "Major Investments in STEM Graduate Students and Graduate Education," FY2017 Budget Request to Congress, February 9, 2016, p. NSF-wide Investments-62, at http://www.nsf.gov/about/budget/fy2017/toc.jsp. |
| 31. |
National Science Foundation, "Major Investments in STEM Graduate Education," FY2016 Budget Request to Congress, February 2, 2015, p. NSF-wide Investments-58. GRF program rules require institutions of higher education to exempt GRF fellows from tuition and fees. The COE provides funds to the institution for the cost of educating the student. The institution is responsible for tuition and fees in excess of the COE. Stipends are a form of salary and may be treated as taxable income. |
| 32. |
For more information on the IUSE program, see https://www.nsf.gov/funding/pgm_summ.jsp?pims_id=505082. |
| 33. |
NSF, "Improving Undergraduate STEM Education: Education and Human Resources (IUSE: EHR)," https://www.nsf.gov/pubs/2017/nsf17590/nsf17590.htm. |
| 34. |
Source: U.S. Census Bureau, 2016 American Community Survey 1-Year Estimates. |
| 35. |
The low was 30.5% in 1991 and the high was 35.7% in 1969. NSF, National Center for Science and Engineering Statistics, "Table 1," Science and Engineering Degrees: 1966-2012, NSF 15-326, June 2015; National Science Board Science & Engineering Indicators 2018, Appendix Table 2-21, https://www.nsf.gov/statistics/2018/nsb20181/assets/561/tables/at02-21.pdf. |
| 36. |
NSF, National Center for Science and Engineering Statistics, "Table 1," Science and Engineering Degrees: 1966-2012, NSF 15-326, June 2015. The low was 56.1% in 1976 and the high was 70.5% in 2011. |
| 37. |
National Science Board Science & Engineering Indicators 2018, Appendix Table 2-29 available at https://www.nsf.gov/statistics/2018/nsb20181/assets/561/tables/at02-29.pdf. |
| 38. |
National Science Board Science & Engineering Indicators Report 2018, Chapter 2 available at https://www.nsf.gov/statistics/2018/nsb20181/report/sections/higher-education-in-science-and-engineering/highlights |
| 39. |
Reading and mathematics scores are reported on a scale from 0-500. Scores for other content areas assessed by NAEP are reported on a scale from 0-300. In addition to reading and mathematics, NAEP also assesses students in the arts, civics, economics, geography, science, technology, U.S. history, and writing. |
| 40. |
Out of a possible 500 points, the average scores of 4th graders have gone from 213 in 1990 to 240 in 2017; those of 8th graders have gone from 263 to 283. The differences between 1990 and 2017 scores for both grades are statistically significant (p<.05). U.S. Department of Education, Institute of Education Sciences, National Center for Education Statistics, The Nation's Report Card, 2017: Mathematics Assessments, https://www.nationsreportcard.gov/math_2017/#nation/scores?grade=4 and https://www.nationsreportcard.gov/math_2017/#nation/scores?grade=8. |
| 41. |
This test is scored out of 300 points. The average score for 12th graders nationwide was 150 in 2005 and 152 in 2015. |
| 42. |
The exact definitions are as follows: Basic denotes partial mastery of the knowledge and skills that are fundamental for proficient work at a given grade; Proficient represents solid academic performance for the given grade level and competency over challenging subject matter including subject-matter knowledge, application of such knowledge to real world situations, and analytical skills appropriate to the subject matter; Advanced presumes mastery of both the Basic and Proficient levels and represents superior academic performance. It should be noted that the NAEP Proficient achievement level does not represent grade level proficiency as determined by other assessment standards (e.g., state or district assessments). Most state standards for proficient performance in mathematics in grades 4 and 8 are closest to the Basic achievement level in NAIP; see Bandeira de Mello, V., T. Rahman, and B.J. Park, Mapping State Proficiency Standards Onto NAEP Scales: Results From the 2015 NAEP Reading and Mathematics Assessments, U.S. Department of Education (Washington, DC: Institute of Education Sciences, National Center for Education Statistics, 2018). For more information on NAEP achievement levels, see https://nces.ed.gov/nationsreportcard/guides/. |
| 43. |
Although a global competitiveness rationale drives much of the contemporary debate about STEM education policies, STEM illiteracy (particularly innumeracy) has also been linked to other national challenges such as the mortgage crisis, poor retirement savings and planning, and even medication errors. For example, see Annamaria Lusardi and Olivia S. Mitchell, The Economic Importance of Financial Literacy: Theory and Evidence, Journal of Economic Literature, vol. 52, iss. 1 (March 2014); Meta Brown et al., Financial Education and the Debt Behavior of the Young, The Review of Financial Studies, vol. 29, iss. 9 (September 2016); and Robert Preidt, "Parents' Poor Math Skills May = Medication Errors," National Institutes of Health, U.S. National Library of Medicine, Medline Plus website, April 30, 2012. |
| 44. |
Research shows that minority students in the United States are concentrated in college majors that lead to relatively low-paying jobs, such as social work and human services, and are underrepresented in majors that lead to higher-paying jobs, including STEM majors. See, for example, Anthony P. Carnevale et al., African Americans: College Majors and Earnings, Georgetown University Center on Education and the Workforce, 2016, https://cew.georgetown.edu/wp-content/uploads/AfricanAmericanMajors_2016_web.pdf. |
| 45. |
Adam V. Maltese and Robert H. Tai, Pipeline Persistence: Examining the Association of Educational Experiences with Earned Degrees in STEM Among U.S. Students, Science Education Policy, 2010; and Jeannie Oakes, Opportunities, Achievement, and Choice: Women and Minority Students in Science and Mathematics; Review of Research in Education, 1990. |
| 46. |
The 2015 gap between the average scores of Hispanics and whites on the NAEP mathematics test was 18 points; for black and white students, the gap was 24 points. Each of these gaps was found to be statistically significant. For more information on NAEP results and scoring, see U.S. Department of Education, Institute of Education Sciences, National Center for Education Statistics, http://www.nationsreportcard.gov/reading_math_2015/#?grade=4 |
| 47. |
For more information on student achievement, see CRS Report R45049, Educational Assessment and the Elementary and Secondary Education Act, by [author name scrubbed]; and CRS Report R45048, Basic Concepts and Technical Considerations in Educational Assessment: A Primer, by [author name scrubbed]. |
| 48. |
The percentages of degrees awarded to women correspond closely to the percentages of women enrolled in engineering and computer sciences programs in 2014. This might indicate that retention and persistence of women in these fields of study is not likely to be the major factor behind the low percentages of women receiving bachelor's degrees in engineering and mathematics. NSF, National Center for Science and Engineering Statistics, Women, Minorities, and Persons with Disabilities in Science and Engineering, Table 5-1: Bachelor's Degrees Awarded, by Sex and Field: 2004-14, Table 3-1: Graduate Enrollment 2014 by Field, Sex, Citizenship, Ethnicity, and Race, and Table 7-2: Doctoral Degrees in Science and Engineering by Field: 2004-2014, Women; NSF 17-310, January 2017. |
| 49. |
National Science Foundation, National Center for Science and Engineering Statistics, "Table 11," Women as a Percentage of All Bachelor Recipients, by Major Field Group: 1966-2012, NSF 15-326, June 2015; |
| 50. |
National Center for Science and Engineering Statistics, Women, Minorities, and Persons with Disabilities in Science and Engineering, Table 5-1: Bachelor's Degrees Awarded, by Sex and Field: 2004-14. |
| 51. |
NSF, National Science Board, Science and Engineering Indicators: 2018, NSB 18-01, January 2018, Appendix Table 2-29. |
| 52. |
The rates of increase for Hispanic/Latino, American Indian/Alaska Native, and black/African American S&E graduate enrollments between 2000 and 2010 were 65%, 55%, and 50%, respectively. Kelly Kang, NCSES Infobrief: Full-Time Graduate Enrollment in Science and Engineering Rose in 2013, Fueled by a Large Increase in Foreign Graduate Enrollment, NSF, National Center for Science and Engineering Statistics, NSF 15-318, April 2015. |
| 53. |
National Center for Science and Engineering Statistics, Women, Minorities, and Persons with Disabilities in Science and Engineering, Table 5-6: Bachelor's Degrees Awarded, Percent Distribution, by Ethnicity and Race of U.S. Citizens and Permanent Residents: 2004-14. |
| 54. |
Amanda L. Griffith, Persistence of Women and Minorities in STEM Field Majors: Is It the School That Matters? Economics of Education Review 29(6): 911–922, 2010; Peter Arcidiacono et al., University Differences in the Graduation of Minorities in STEM Fields: Evidence from California, American Economic Review 106(3): 525-562, 2016; and Sarah L. Eddy et al., Gender Gaps in Achievement and Participation in Multiple Introductory Biology Classrooms, Life Sciences Education 13(3), 2017. |
| 55. |
Liana Christin Landivar, U.S. Census Bureau, The Relationship Between Science and Engineering Education and Employment in STEM Occupations, ACS-23, September 2013, available at http://www.census.gov/prod/2013pubs/acs-23.pdf |
| 56. |
Based on data from the U.S. Census Bureau, 1980, 1980, 1990, and 2000 decennial censuses and 2011 American Community Survey as summarized in Liana Christin Landivar, Disparities in STEM Employment by Sex, Race, and Hispanic Origin, American Community Survey Reports, September 2013. |
| 57. |
Ibid. |
| 58. |
Suzanne M. Wilson, Measuring the Quantity and Quality of the K-12 STEM Teacher Pipeline, SRI Education White Paper, SRI International, 2016. |
| 59. |
U.S. Department of Education, Institute of Education Sciences, National Center for Education Statistics, "Table 2," Education and Certification Qualifications of Departmentalized Public High School-Level Teachers of Core Subjects: Evidence from the 2007-08 Schools and Staffing Survey, NCES 2011-317, May 2011, p. 14. |
| 60. |
U.S. Department of Education, Institute of Education Sciences, National Center for Education Statistics, Performance of U.S. 15-Year-Old Students in Science, Reading, and Mathematics Literacy in an International Context: First Look at PISA 2015, December 2016. |
| 61. |
U.S. Department of Education, Institute of Education Sciences, National Center for Education Statistics, Highlights from TIMSS and TIMSS Advanced 2015: Mathematics and Science Achievement of U.S. Students in Grades 4 and 8 and in Advanced Courses at the End of High School in an International Context, November 2016. |
| 62. |
Some research has found that U.S. students do not try very hard on low-stakes standardized tests and that this affects scores. For example, research on financial incentives to improve student performance found that "[t]he large effects of these relatively modest financial incentives [$10 to $20] suggest that at baseline this population of students [e.g., students in the study sample] puts forth low effort in response to low (perceived) returns to achievement on standardized tests." Steven D. Levitt et. al., The Behavioralist Goes to School: Leveraging Behavioral Economics to Improve Educational Performance, National Bureau of Economic Research, Working Paper no. 18165, June 2012. |
| 63. |
National Association of Secondary School Principals, "NASSP Responds to International Assessment Results," press release, December 10, 2010; and Cynthia McCabe, "The Economics Behind International Education Rankings," NEAToday, December 9, 2010. |
| 64. |
Erik A. Hanushek and Ludger Woessman, The High Cost of Low Educational Performance: The Long-Run Impact of Improving PISA Outcomes, OECD, 2010. |
| 65. |
For more information on issues related to foreign students and foreign technical workers, see CRS Report R43735, Temporary Professional, Managerial, and Skilled Foreign Workers: Policy and Trends. |
| 66. |
National Science Board, Science and Engineering Indicators: 2018, NSB 18-01, January 2018, Appendix Table 2-32. |
| 67. |
NSF, U.S. Doctorates in the 20th Century, Figure 3.7: Citizenship Status of Ph.D.'s: 1960-1999, NSF 06-319, October 2006; and Mark K. Feigener, Number of Doctorates Awarded in the United States Declined in 2010, NSF, NSF 12-303, November 2011. |
| 68. |
Issues related to the percentage of U.S. STEM degrees going to foreign students have been examined by Congress in several hearings across a number of different committees from the 111th to the 113th Congresses. For example, see U.S. Congress, House Committee on Science, Space, and Technology, American Competitiveness: the Role of Research and Development, 113th Cong., 1st sess., February 6, 2013 (Washington, DC: GPO, 2013); and U.S. Congress, House Committee on Small Business, Subcommittee on Contracting and Workforce, Help Wanted: the Small Business STEM Workforce Shortage and Immigration Reform, 113th Cong., 1st sess., April 25, 2013 (Washington, DC: GPO, 2013). |
| 69. |
National Science Board, Science and Engineering Indicators 2018, Chapter 2, https://www.nsf.gov/statistics/2018/nsb20181/report/sections/higher-education-in-science-and-engineering/highlights. |
| 70. |
National Science Board, Science and Engineering Indicators 2018, Figure 2-24, https://www.nsf.gov/statistics/2018/nsb20181/figures. |
| 71. |
Doctoral degree totals include those awarded to foreign students. China expanded its domestic production of S&E doctoral degrees from about 2,700 in 1994 to almost 28,500 in 2008. National Science Board, Science and Engineering Indicators 2018, Figure 2-25 and Appendix Tables 2-37 and 2-38. |
| 72. |
Gary Gereffi et al., "Getting the Numbers Right: International Engineering Education in the United States, China, and India," Journal of Engineering Education, vol. 97, no. 1 (January 2008), p. 13-25. |
| 73. |
For more information, see CRS Report R43061, The U.S. Science and Engineering Workforce: Recent, Current, and Projected Employment, Wages, and Unemployment. |
| 74. |
Multiple reports from a variety of U.S. academic, scientific, and business organizations have made this argument. For example, see (1) National Academy of Sciences, National Academy of Engineering, and Institute of Medicine, Committee on Prospering in the Global Economy of the 21st Century: An Agenda for American Science and Technology, and Committee on Science, Engineering, and Public Policy, Rising Above the Gathering Storm: Energizing and Employing America for a Brighter Economic Future (Washington, DC: National Academies Press, 2007); and (2) Frederick M. Hess, Andrew P. Kelly, and Olivia Meeks, The Case for Being Bold: A New Agenda for Business in Improving STEM Education, U.S. Chamber of Commerce, Institute for a Competitive Workforce, April 2011. |
| 75. |
For example, see Richard Freeman, "The Market for Scientists and Engineers," NBER Reporter, no. 3 (Summer 2007), pp. 6-8; Ron Hira, "U.S. Policy and the STEM Workforce System," American Behavioral Scientist, vol. 53, no. 7 (March 2010), pp. 949-961; Testimony of Institute for the Study of International Migration Director of Policy Studies B. Lindsay Lowell in U.S. Congress, House Committee on the Judiciary, Subcommittee on Immigration Policy and Enforcement, "STEM" the Tide: Should America Try to Prevent an Exodus of Foreign Graduates of U.S. Universities with Advanced Science Degrees?, hearings, 112th Cong., 1st sess., Serial No. 112-64, October 5, 2011; and B. Lindsay Lowell and Harold Salzman, Into the Eye of the Storm: Assessing the Evidence on Science and Engineering Education, Quality, and Workforce Demand, Urban Institute, October 2007. |
| 76. |
Anthony P. Carnevale et al., STEM: Science, Technology, Engineering, and Mathematics, Georgetown University Center on Education and the Workforce, October 20, 2011, p.7. |
| 77. |
National Science Board, Revisiting the STEM Workforce, A Companion to Science and Engineering Indicators 2014, 2015, https://www.nsf.gov/news/news_summ.jsp?cntn_id=134866. |
| 78. |
L.C. Landivar, The Relationship Between Science and Engineering Education and Employment in STEM Occupations, American Community Survey Reports, ACS-23 (Washington, DC: U.S. Census Bureau, 2013). |
| 79. |
The Department of Health and Human Services (HHS) traces its history to establishment of the federal Marine Hospital Service, forerunner of the contemporary U.S. Public Health Service, in 1798. More information about HHS history is available at http://www.hhs.gov/about/hhshist.html. |
| 80. |
Unless otherwise indicated, historical STEM education measures in this section are described as originally passed. Most of these measures have been amended, in some cases quite significantly (including repeal), since they became law. |
| 81. |
John C. Fitzpatrick, ed., Journals of the Continental Congress 1774-1789, edited from the original records in the Library of Congress, vol. 28 (Washington, DC: GPO, 1933), p. 375, http://memory.loc.gov/cgi-bin/query/r?ammem/hlaw:@field%28DOCID+@lit%28jc0281%29%29. |
| 82. |
Library of Congress, Primary Documents in America History: Northwest Ordinance, Library of Congress/Virtual Services Digital Reference Section/Web Guides website, April 25, 2012, http://www.loc.gov/rr/program/bib/ourdocs/northwest.html. |
| 83. |
Library of Congress, An Ordinance for the Government of the Territory of the United States, North-West of the River Ohio, Library of Congress/American Memory/Documents from the Continental Congress and Constitutional Convention 1774-1789 website, http://memory.loc.gov/cgi-bin/query/r?ammem/bdsdcc:@field(DOCID+@lit(bdsdcc22501)). |
| 84. |
The statute establishing the MHS does not include a formal title for the act. For the sake of consistency with other headings in this section, CRS used the title "Marine Hospital Service Act of 1789" to describe 1 Stat. 605. A copy of this statute, An Act for the relief of sick and disabled Seamen, is available at http://memory.loc.gov/cgi-bin/ampage?collId=llsl&fileName=001/llsl001.db&recNum=728. |
| 85. |
U.S Congress, Senate Committee on Labor and Public Welfare, National Research Service Award Act, report to accompany H.R. 7724, 93rd Cong., 1st sess., S. Rept. 93-381. |
| 86. |
National Archives and Records Administration, Morrill Act (1862), http://www.ourdocuments.gov/doc.php?doc=33. |
| 87. |
Agriculture and Food Act of 1981 (P.L. 97-98). |
| 88. |
Library of Congress, Primary Documents in America History: Morrill Act, July 30, 2010, http://www.loc.gov/rr/program/bib/ourdocs/Morrill.html. |
| 89. |
For more information on STEM education at NSF, see CRS Report R45009, The National Science Foundation: FY2018 Appropriations and Funding History. |
| 90. |
National Science Foundation Act of 1950 (P.L. 81-507), http://www.nsf.gov/about/history/legislation.pdf. |
| 91. |
Dorothy Schaffter, The National Science Foundation (New York: Frederick A. Praeger, Publishers, 1969), p. 96. |
| 92. |
National Defense Education Act (P.L. 85-864). |
| 93. |
For more information on ESEA, see CRS In Focus IF10556, Elementary and Secondary Education Act: Overview of Title I-A Academic Accountability Provisions; and CRS Report R44297, Reauthorization of the Elementary and Secondary Education Act: Highlights of the Every Student Succeeds Act. |
| 94. |
Particularly Title I, Part A, Program of Education for the Disadvantaged. |
| 95. |
Department of Education Organization Act (P.L. 96-88), http://www.eric.ed.gov/PDFS/ED180121.pdf. |
| 96. |
U.S. Congress, Senate Committee on Governmental Affairs, Legislative History of P.L. 96-88, Department of Education Organization Act (Part 2), committee print, 96th Cong., 2nd sess. (Washington, DC: GPO 1980), p. 1758. |
| 97. |
For more information about the America COMPETES Act see CRS Report R44345, Efforts to Reauthorize the America COMPETES Act: In Brief. |
| 98. |
For more information on the Every Student Succeeds Act, see CRS Report R44297, Reauthorization of the Elementary and Secondary Education Act: Highlights of the Every Student Succeeds Act. |
| 99. |
ESSA, Section 4101. |
| 100. |
For more information about the Perkins Act, see CRS Report R44542, Carl D. Perkins Career and Technical Education Act of 2006: An Overview. |
| 101. |
For more information about H.R. 2353, see CRS Report R44861, Reauthorization of the Perkins Act in the 115th Congress: Comparison of Current Law and H.R. 2353. |
| 102. |
For more information about these programs, see https://women.nasa.gov/. |
| 103. |
More information about these assessments is available at LTT Mathematics: http://www.nationsreportcard.gov/ltt_2012/, Main NAEP Mathematics: https://www.nationsreportcard.gov/math_2017/#?grade=4, Main NAEP Science: http://www.nationsreportcard.gov/science_2015/#?grade=4, and Main NAEP Technology and Engineering Literacy (TEL)—http://www.nationsreportcard.gov/tel_2014/. |
| 104. |
More information about TIMSS is available at https://nces.ed.gov/timss/. |
| 105. |
More information about PISA is available at https://nces.ed.gov/surveys/pisa/. |
| 106. |
The report is available at https://www.gao.gov/products/GAO-18-290. |
| 107. |
NSTC-11 is available at https://obamawhitehouse.archives.gov/sites/default/files/microsites/ostp/costem__federal_stem_education_portfolio_report.pdf. NSTC-12 is available at |
| 108. |
The 2007 ACC report is available at https://eric.ed.gov/?id=ED496649. |
| 109. |
The 2005 GAO report is available at http://www.gao.gov/products/GAO-06-114. |
| 110. |
More information about Science and Engineering Indicators is available at https://www.nsf.gov/statistics/2016/nsb20161/#/. |
| 111. |
More information about NCSES is available at https://www.nsf.gov/statistics/. |
| 112. |
The report is available at http://www.gao.gov/assets/670/663079.pdf. |