The U.S. Science and Engineering Workforce: Recent, Current, and Projected Employment, Wages, and Unemployment
The adequacy of the U.S. science and engineering workforce has been an ongoing concern of Congress for more than 60 years. Scientists and engineers are widely believed to be essential to U.S. technological leadership, innovation, manufacturing, and services, and thus vital to U.S. economic strength, national defense, and other societal needs. Congress has enacted many programs to support the education and development of scientists and engineers. Congress has also undertaken broad efforts to improve science, technology, engineering, and math (STEM) skills to prepare a greater number of students to pursue science and engineering (S&E) degrees. In addition, some policymakers have sought to increase the number of foreign scientists and engineers working in the United States through changes in visa and immigration policies.
Policymakers, business leaders, academicians, S&E professional society analysts, economists, and others hold diverse views with respect to the adequacy of the S&E workforce and related policy issues. These issues include whether a shortage of scientists and engineers exists in the United States, what the nature of such a shortage might be (e.g., too few people with S&E degrees, mismatched skills and needs), and whether the federal government should undertake policy interventions to address such a putative shortage or to allow market forces to work in this labor market. Among the key indicators used by labor economists to assess occupational labor shortages are employment growth, wage growth, and unemployment rates.
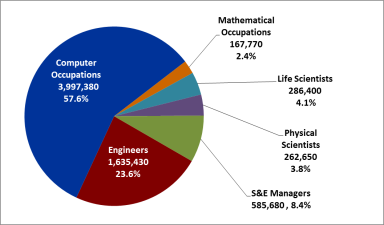
In 2016, there were 6.9 million scientists and engineers (as defined in this report) employed in the United States, accounting for 4.9% of total U.S. employment. Science and engineering employment was concentrated in two S&E occupational groups, computer occupations (57.6%) and engineers (23.6%), with the rest accounted for by S&E managers (8.4%), physical scientists (3.8%), life scientists (4.1%), and those in mathematical occupations (2.4%). From 2012 to 2016, S&E employment increased by 747,040, a compound annual growth rate (CAGR) of 2.9%, while overall U.S. employment grew by 1.9% CAGR. Viewed only in aggregate, the increase in S&E employment masks the varied degrees of growth and decline in detailed S&E occupations.
In 2016, the mean wage for all scientists and engineers was $94,450, while the mean wage for all other occupations was $49,630. Between 2012 and 2016, the nominal mean wages of the S&E occupational groups grew between 1.0% CAGR (mathematical occupations) and 2.5% CAGR (S&E managers). Inflation-adjusted wage growth for each of the S&E occupational groups was less than 1.4% CAGR, and in the case of mathematical occupations was negative. Nominal wage growth for all occupations in the economy was 2.0%; real wages grew by 0.9%.
Compared to the overall workforce, the S&E occupational groups had significantly lower unemployment rates for the 2012-2016 period. In general, though, the professional occupations (of which the S&E occupations are a part) historically have had lower unemployment rates than the workforce as a whole. In 2016, with the exception of life scientists, the unemployment rates for S&E occupational groups (2.0%-2.9%) were higher than other selected professional occupations, including lawyers (0.7%), physicians and surgeons (0.5%), dentists (0.4%), and registered nurses (1.2%). Life scientists had an unemployment rate of 0.6%.
The Bureau of Labor Statistics (BLS) projects that the number of S&E jobs will grow by 853,600 between 2016 and 2026, a growth rate (1.1% CAGR) that is somewhat faster than that of the overall workforce (0.7%). In addition, BLS projects that 5.179 million scientists and engineers will be needed due to labor force exits and occupational transfers (referred to collectively as occupational separations). BLS projects the total number of openings in S&E due to growth, labor force exits, and occupational transfers between 2016 and 2026 to be 6.033 million, including 3.477 million in the computer occupations and 1.265 million in the engineering occupations.
The U.S. Science and Engineering Workforce: Recent, Current, and Projected Employment, Wages, and Unemployment
Jump to Main Text of Report
Contents
- Overview
- Methodology
- Occupational Taxonomy
- Data Sources
- Time Frame
- Methodological Limitations
- Selected S&E Occupational Data
- Current Employment, Wages, and Unemployment
- Employment
- Wages
- Unemployment
- Recent Trends in Employment, Wages, and Unemployment
- Employment Trends
- Wage Trends
- Unemployment Trends
- Employment Projections, 2016-2026
- Scientists and Engineers in Aggregate
- Science and Engineering Occupational Groups
- Detailed Science and Engineering Occupations
- Concluding Observations
- Perspectives on the Adequacy of the U.S. S&E Workforce
- Perspectives on Ways to Foster Development of the S&E Workforce
Figures
- Figure 1. Compilation of S&E Occupational Employment, 2016
- Figure 2. Mean Annual Wages of S&E Occupational Groups and Other Selected Professional Occupations, 2016
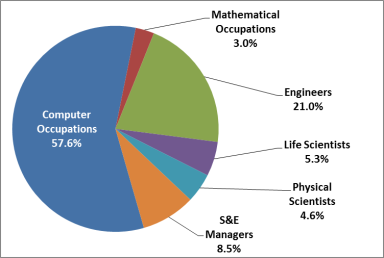
- Figure 3. Aggregate S&E Employment, 2012 and 2016
- Figure 4. Nominal and Inflation-Adjusted Compound Annual Growth Rates of Mean Wages in S&E Occupational Groups, 2012-2016
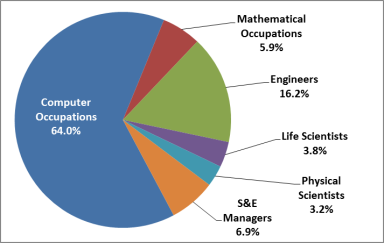
- Figure 5. Share of Total Projected S&E Occupational Job Growth, 2016-2026, by S&E Occupational Group
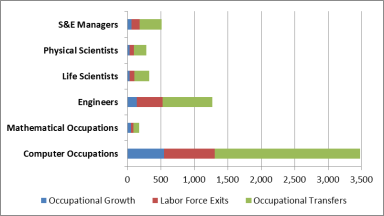
- Figure 6. Composition of Job Openings in the S&E Occupational Groups by Occupational Growth, Labor Force Exits, and Occupational Transfers, 2016-2026
- Figure 7. Share of Projected S&E Job Openings Due to Job Growth and Labor Force Exits, 2016-2026, by S&E Occupational Group
Tables
- Table 1. Mean Annual Wages of S&E Occupations, 2016
- Table 2. Annual Average Unemployment Rate for S&E Occupations, 2016
- Table 3. Employment Change in S&E Occupational Groups, 2012-2016
- Table 4. Employment in Detailed S&E Occupations, 2012-2016
- Table 5. S&E Occupations with the Largest Employment Growth, 2012-2016
- Table 6. S&E Occupations with the Largest Employment Losses, 2012-2016
- Table 7. S&E Occupations with the Fastest Growth Rates, 2012-2016
- Table 8. S&E Occupations with the Slowest Growth Rates, 2012-2016
- Table 9. Unemployment Rates for S&E Occupational Groups, the Overall Workforce, and Other Selected Professional and Related Occupations, 2012-2016
- Table 10. Employment Projections for S&E Occupational Groups, Other Selected Professional and Related Occupations, 2016-2026
- Table 11. S&E Occupations with the Largest Projected Job Growth, Other Selected Occupations, 2016-2026
- Table 12. S&E Occupations with the Smallest Projected Job Growth, 2016-2026
- Table 13. S&E Occupations with the Fastest Projected Job Growth Rates, 2016-2026
- Table 14. S&E Occupations with the Slowest Projected Job Growth Rates, 2016-2026
- Table 15. S&E Occupations with the Most Projected Job Openings Due to Growth, Labor Force Exits, and Occupational Transfers, 2016-2026
- Table 16. S&E Occupations with Fewest Projected Job Openings Due to Growth, Labor Force Exits, and Occupational Transfers, 2016-2026
- Table B-1. SOC Occupational Classifications Included in ACS Occupational Classifications
Summary
The adequacy of the U.S. science and engineering workforce has been an ongoing concern of Congress for more than 60 years. Scientists and engineers are widely believed to be essential to U.S. technological leadership, innovation, manufacturing, and services, and thus vital to U.S. economic strength, national defense, and other societal needs. Congress has enacted many programs to support the education and development of scientists and engineers. Congress has also undertaken broad efforts to improve science, technology, engineering, and math (STEM) skills to prepare a greater number of students to pursue science and engineering (S&E) degrees. In addition, some policymakers have sought to increase the number of foreign scientists and engineers working in the United States through changes in visa and immigration policies.
Policymakers, business leaders, academicians, S&E professional society analysts, economists, and others hold diverse views with respect to the adequacy of the S&E workforce and related policy issues. These issues include whether a shortage of scientists and engineers exists in the United States, what the nature of such a shortage might be (e.g., too few people with S&E degrees, mismatched skills and needs), and whether the federal government should undertake policy interventions to address such a putative shortage or to allow market forces to work in this labor market. Among the key indicators used by labor economists to assess occupational labor shortages are employment growth, wage growth, and unemployment rates.
In 2016, there were 6.9 million scientists and engineers (as defined in this report) employed in the United States, accounting for 4.9% of total U.S. employment. Science and engineering employment was concentrated in two S&E occupational groups, computer occupations (57.6%) and engineers (23.6%), with the rest accounted for by S&E managers (8.4%), physical scientists (3.8%), life scientists (4.1%), and those in mathematical occupations (2.4%). From 2012 to 2016, S&E employment increased by 747,040, a compound annual growth rate (CAGR) of 2.9%, while overall U.S. employment grew by 1.9% CAGR. Viewed only in aggregate, the increase in S&E employment masks the varied degrees of growth and decline in detailed S&E occupations.
In 2016, the mean wage for all scientists and engineers was $94,450, while the mean wage for all other occupations was $49,630. Between 2012 and 2016, the nominal mean wages of the S&E occupational groups grew between 1.0% CAGR (mathematical occupations) and 2.5% CAGR (S&E managers). Inflation-adjusted wage growth for each of the S&E occupational groups was less than 1.4% CAGR, and in the case of mathematical occupations was negative. Nominal wage growth for all occupations in the economy was 2.0%; real wages grew by 0.9%.
Compared to the overall workforce, the S&E occupational groups had significantly lower unemployment rates for the 2012-2016 period. In general, though, the professional occupations (of which the S&E occupations are a part) historically have had lower unemployment rates than the workforce as a whole. In 2016, with the exception of life scientists, the unemployment rates for S&E occupational groups (2.0%-2.9%) were higher than other selected professional occupations, including lawyers (0.7%), physicians and surgeons (0.5%), dentists (0.4%), and registered nurses (1.2%). Life scientists had an unemployment rate of 0.6%.
The Bureau of Labor Statistics (BLS) projects that the number of S&E jobs will grow by 853,600 between 2016 and 2026, a growth rate (1.1% CAGR) that is somewhat faster than that of the overall workforce (0.7%). In addition, BLS projects that 5.179 million scientists and engineers will be needed due to labor force exits and occupational transfers (referred to collectively as occupational separations). BLS projects the total number of openings in S&E due to growth, labor force exits, and occupational transfers between 2016 and 2026 to be 6.033 million, including 3.477 million in the computer occupations and 1.265 million in the engineering occupations.
Overview
Many congressional policymakers have an ongoing interest in whether the number of U.S. scientists and engineers is sufficient to meet the needs of U.S. employers, to spur economic growth and job creation through innovation, to maintain U.S. global technological leadership and industrial competitiveness, and to address other important national and societal needs.
To help ensure an adequate science and engineering (S&E) workforce, Congress has established and funded a variety of federal programs. These programs are intended to foster improved science, technology, engineering, and mathematics (STEM) skills among students; to incentivize students to pursue degrees in science and engineering through tools such as fellowships, assistantships, and traineeships; and to provide graduate and postgraduate research experiences at U.S. colleges and universities through the financing of university-based research. The 115th Congress is considering a wide variety of legislation to promote STEM education. In addition, Congress is considering changes to immigration policies, among them the number of visas and processes associated with F-1 visas, H-1B visas, L-1 visas, and legal permanent residency ("green cards"), to address U.S. S&E workforce needs.1
As Congress develops policies and programs and makes appropriations to help address the nation's needs for scientists and engineers, it may consider past, current, and projected S&E workforce trends. Among the key factors that labor economists examine for evidence of labor shortages are employment growth, wage growth, and unemployment rates relative to other occupations.2 This report provides employment, wage, and unemployment information for the computer occupations, mathematical occupations, engineers, life scientists, physical scientists, and S&E management occupations, as follows:
- The section on "Current Employment, Wages, and Unemployment" provides a statistical snapshot of occupational employment, wage, and unemployment data for the S&E workforce in 2016 (the latest year for which data are available).
- The section on "Recent Trends in Employment, Wages, and Unemployment" provides a perspective on how S&E employment, wages, and unemployment changed during the period 2012-2016.
- The section on "Employment Projections, 2016-2026" provides an analysis of projections by the Bureau of Labor Statistics for how the number employed in S&E occupations is expected to change during the 2016-2026 period, as well as how many openings will be created by growth, labor force exits, and occupational transfers.
A final section, "Concluding Observations," provides stakeholder perspectives that Congress may consider as it seeks to ensure that the United States has an adequate S&E workforce to meet the demands of the 21st century.
Methodology
Occupational Taxonomy
Most experts agree that there is no authoritative definition of which occupations comprise the science and engineering (S&E) workforce. Rather, the selection of occupations included in any particular analysis of the S&E workforce may vary. Some analysts, policymakers, and organizations may refer to the group in different ways (e.g., the scientific and technical workforce, the STEM workforce) and include varying sets of occupations. In 2011, the Bureau of Labor Statistics (BLS), in defining the STEM occupations for a particular analysis, stated, "This is only one possible definition of STEM occupations; other definitions exist that may be better suited for other uses."3
The size of the S&E workforce varies substantially depending on which occupations are included in the definition. In its 2016 Science and Engineering Indicators report, the National Science Board (NSB) stated, "In 2013, estimates of the size of the S&E workforce ranged from approximately 6 million to more than 21 million depending on the definition used," further noting that "when defined by occupation, the S&E workforce totals between 6.2 million and 6.3 million people according to the most recent estimates."4
The policy debate about the adequacy of the U.S. S&E workforce has focused largely on the computer occupations, mathematical occupations, engineers, and physical scientists. For purposes of this report, these occupations, along with life scientists (a part of the natural sciences, with physics and chemistry) and S&E management occupations, are collectively referred to as the S&E workforce. Notably, this group does not include social scientists (e.g., economists, survey researchers, psychologists, sociologists, urban and regional planners, anthropologists, archeologists, geographers, historians, political scientists) or S&E-related technicians. As defined this way, the size of the S&E workforce in 2016 was approximately 6.9 million.5
This report uses a modified version of the Standard Occupation Classification (SOC) system6 to categorize scientists and engineers. The report taxonomy includes six S&E occupational groups, each composed of closely related detailed occupations:
- Computer occupations—computer and information research scientists; computer systems analysts; computer programmers; software developers, applications; software developers, systems software; database administrators; network and computer systems administrators; computer user support specialists; computer network support specialists; information security analysts; web developers; computer network architects; and computer occupations, all other.
- Mathematical occupations—actuaries; mathematicians; operations research analysts; statisticians; and mathematical science occupations, all other.
- Engineers—aerospace, agricultural, biomedical, chemical, civil, computer hardware, electrical, electronics (except computer), environmental, health and safety (except mining safety engineers and inspectors), industrial, materials, mechanical, mining and geological (including mining safety engineers), nuclear, and petroleum engineers; engineers, all other; and marine engineers and naval architects.
- Life scientists—animal scientists; food scientists and technologists; soil and plant scientists; biochemists and biophysicists; microbiologists; zoologists and wildlife biologists; biological scientists, all other; conservation scientists; foresters; epidemiologists; medical scientists (except epidemiologists); and life scientists, all other.
- Physical scientists—astronomers; physicists; atmospheric and space scientists; chemists; materials scientists; environmental scientists and specialists (including health); geoscientists (except hydrologists and geographers); hydrologists; and physical scientists, all other.
- Science and engineering managers—computer and information systems managers, architectural and engineering managers,7 and natural sciences managers.
A description of the detailed occupations is provided in the Appendix A. Figures illustrating the educational composition of each S&E occupation are provided in Appendix B.
Data Sources
This report relies on federal government employment, wage, and unemployment data from the following sources:
- The Occupational Employment Statistics (OES),8 a survey of nonfarm establishments conducted by the U.S. Department of Labor's Bureau of Labor Statistics and state workforce agencies, is the source of employment and wage data for the 2012-2016 period. The survey provides employment and wage estimates annually for over 800 occupations. According to BLS, "employees" are all part-time and full-time workers who are paid a wage or salary. The survey does not cover the self-employed, owners and partners in unincorporated firms, household workers, or unpaid family workers. For this report, the wage statistic used is the occupational "mean wage," an average wage calculated by summing the wages of all the employees in a given occupation and then dividing the total wages by the number of employees.
- The Current Population Survey (CPS),9 a monthly survey of households conducted for BLS by the Department of Commerce's Bureau of the Census, is the source of the unemployment data in this report. CPS data are also used to supplement OES data in BLS employment projections (discussed below).
- BLS's Employment Projections,10 a biennial product of BLS, provide occupational employment and industry employment projection data for 10-year periods. The latest projections, covering the 2016-2026 period, were published in October 2017. According to BLS, for most industries, the OES survey provides data for the occupational staffing patterns—the distribution of wage and salary employment by occupation in each industry—and Current Employment Statistics (CES)11 data provide information on total wage and salary employment in each nonfarm industry. While OES data include only wage and salary, nonfarm employment, the employment data in the projections also include agricultural industry employment and the self-employed (derived from CPS data) to arrive at base year employment levels for each occupation.12
Time Frame
The "Recent Trends in Employment, Wages, and Unemployment" section provides information on changes in employment, wages, and unemployment for the period 2012 to 2016. The "Employment Projections, 2016-2026" section relies entirely on the most recent Bureau of Labor Statistics biennial employment projections for the 2016-2026 time frame.
Methodological Limitations
It is important to note that a wide range of factors can affect the size and occupational composition of the U.S. S&E workforce. Among these factors are global and domestic economic conditions; the development and market adoption of new technologies; capital cost and availability; the level of public and private funding for research and development; changes in scientific, technological, and market opportunities; the size, knowledge, and skills of the U.S.-born labor force; the size, knowledge, and skills of the foreign-born labor force in the United States; and changes in business practices regarding the use of foreign-based science and engineering capabilities. This report does not attempt to attribute changes in the U.S. S&E workforce to any of these factors specifically.
In addition, a variety of factors may affect the comparability of OES data over time:
Although the OES survey methodology is designed to create detailed cross-sectional employment and wage estimates for the U.S., States, metropolitan and nonmetropolitan areas, across industry and by industry, it is less useful for comparisons of two or more points in time. Challenges in using OES data as a time series include changes in the occupational, industrial, and geographical classification systems, changes in the way data are collected, changes in the survey reference period, and changes in mean wage estimation methodology, as well as permanent features of the methodology.13
In its examination of current trends, CRS chose the 2012-2016 time period, in part, to enhance comparability of data across the period by reducing inconsistencies that may result from changes in the OES occupational classification system, and in part to provide a current perspective on trends in the S&E occupations. The OES survey used the same occupational categories (based on the 2010 Standard Occupational Classification) throughout the 2012-2016 period.
The Bureau of Labor Statistics makes a number of estimates in developing its employment projections. These estimates include "the future size and composition of the population, as well as on the trends in labor force participation rates of different age, gender, race, and ethnic groups, a total of 136 separate categories" as well as other factors such as economic growth, technological innovation, changes in business practices or production methods, replacement of one product or service by another, organizational restructuring of work, changes to the size of business establishments, offshore and domestic outsourcing, and expected employment change in a segment of an industry where an occupation is more concentrated relative to expected employment changes in other segments of the same industry.14 For its 2016-2026 projections, BLS replaced its previous methodology for estimating "occupational replacement needs" with a new methodology for estimating "occupational separations." According to BLS, the occupational replacement methodology "is no longer in use because BLS identified statistical and conceptual issues with the implementation of this method that compromised the accuracy and validity of the resulting estimates."15
Other factors may affect occupational projections as well, including changes to immigration laws and patterns, trade laws and practices, regulatory regimes, and social and educational patterns; wars and disasters; revolutionary advances in technology; and shifts in consumer tastes. The BLS evaluates the accuracy of its projections regularly and publishes these evaluations in its Monthly Labor Review.16
Selected S&E Occupational Data
Current Employment, Wages, and Unemployment
This section provides a snapshot of the S&E workforce in 2016, using employment, wages, and unemployment data.
Employment
 |
|
Source: CRS analysis of Occupational Employment Statistics survey data, May 2016, Bureau of Labor Statistics, U.S. Department of Labor, http://www.bls.gov/oes/tables.htm. Notes: Chart does not include social scientists or S&E-related technicians. For additional information about which detailed occupations are included, see "Occupational Taxonomy." |
In 2016, the latest year for which Occupational Employment Statistics survey data are available, 6.9 million people were employed in the United States as scientists and engineers, accounting for 4.9% of total U.S. employment. Science and engineering employment was concentrated in two occupational groups—computer occupations and engineers—which together accounted for 81% of S&E jobs, with 57.6% and 23.6%, respectively. The remainder of S&E employment was accounted for by science and engineering managers (8.4%), life scientists (4.1%), physical scientists (3.8%), and mathematical occupations (2.4%). Employment totals and share of S&E occupational employment are presented in Figure 1.
(See Table 4 for more detailed 2016 employment data on specific S&E occupations.)
Wages
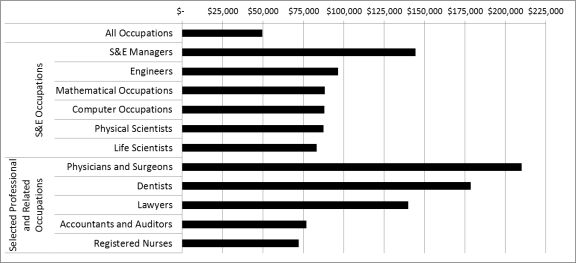
Scientists and engineers have a mean annual wage that exceeds the mean annual wage for all occupations in the United States. In 2016, the mean annual wage for all scientists and engineers was $94,450; the mean annual wage for all occupations—professional and nonprofessional—was $49,630. S&E managers had the highest mean annual wage of all S&E occupational groups at $144,270, followed by engineers, $96,440; mathematical occupations, $88,320; computer occupations, $87,870; physical scientists, $87,320; and life scientists, $83,080. Scientists and engineers have lower mean annual wages than some other professionals, such as physicians and surgeons ($210,170), dentists ($178,670), and lawyers ($139,880). (See Figure 2.)
|
Figure 2. Mean Annual Wages of S&E Occupational Groups and Other Selected Professional Occupations, 2016 |
 |
|
Source: CRS analysis of Occupational Employment Statistics survey data, May 2016 Bureau of Labor Statistics, U.S. Department of Labor, https://www.bls.gov/oes/tables.htm. |
Table 1 shows the 2016 mean annual wage for each of the S&E occupational groups and individual S&E occupations, organized by S&E occupational group.
|
Occupational Group |
Mean Annual Wage |
|
Science and Engineering Managers |
$144,270 |
|
Computer and Information Systems Managers |
145,740 |
|
Architectural and Engineering Managers |
143,870 |
|
Natural Sciences Managers |
136,150 |
|
Computer Occupations |
$87,870 |
|
Computer and Information Research Scientists |
116,320 |
|
Software Developers, Systems Software |
110,590 |
|
Software Developers, Applications |
104,300 |
|
Computer Network Architects |
104,240 |
|
Information Security Analysts |
96,040 |
|
Computer Systems Analysts |
91,620 |
|
Computer Occupations, All Other |
88,880 |
|
Database Administrators |
87,130 |
|
Computer Programmers |
85,180 |
|
Network and Computer Systems Administrators |
84,500 |
|
Web Developers |
72,150 |
|
Computer Network Support Specialists |
67,770 |
|
Computer User Support Specialists |
53,100 |
|
Mathematical Occupations |
$88,320 |
|
Actuaries |
114,120 |
|
Mathematicians |
105,600 |
|
Statisticians |
85,160 |
|
Operations Research Analysts |
84,340 |
|
Mathematical Science Occupations, All Other |
77,550 |
|
Engineers |
$96,440 |
|
Petroleum Engineers |
147,030 |
|
Computer Hardware Engineers |
118,700 |
|
Aerospace Engineers |
112,010 |
|
Nuclear Engineers |
105,950 |
|
Chemical Engineers |
105,420 |
|
Electronics Engineers, Except Computer |
103,760 |
|
Mining and Geological Engineers, Including Mining Safety Engineers |
103,010 |
|
Marine Engineers and Naval Architects |
99,860 |
|
Engineers, All Other |
99,250 |
|
Electrical Engineers |
98,620 |
|
Materials Engineers |
97,050 |
|
Health and Safety Engineers, Except Mining Safety Engineers and Inspectors |
90,190 |
|
Biomedical Engineers |
89,970 |
|
Mechanical Engineers |
89,800 |
|
Civil Engineers |
89,730 |
|
Environmental Engineers |
88,530 |
|
Industrial Engineers |
88,530 |
|
Agricultural Engineers |
77,330 |
|
Life Scientists |
$83,080 |
|
Medical Scientists, Except Epidemiologists |
95,000 |
|
Biochemists and Biophysicists |
94,340 |
|
Life Scientists, All Other |
83,150 |
|
Biological Scientists, All Other |
77,830 |
|
Epidemiologists |
77,720 |
|
Microbiologists |
76,850 |
|
Animal Scientists |
72,890 |
|
Food Scientists and Technologists |
71,270 |
|
Soil and Plant Scientists |
69,290 |
|
Conservation Scientists |
65,130 |
|
Zoologists and Wildlife Biologists |
64,890 |
|
Foresters |
60,300 |
|
Physical Scientists |
$87,320 |
|
Physicists |
121,770 |
|
Astronomers |
110,380 |
|
Geoscientists, Except Hydrologists and Geographers |
106,390 |
|
Materials Scientists |
101,570 |
|
Physical Scientists, All Other |
98,460 |
|
Atmospheric and Space Scientists |
94,840 |
|
Hydrologists |
83,740 |
|
Chemists |
80,820 |
|
Environmental Scientists and Specialists, Including Health |
75,360 |
Source: CRS analysis of Occupational Employment Statistics survey data, May 2016, Bureau of Labor Statistics, U.S. Department of Labor, https://www.bls.gov/oes/tables.htm.
Unemployment
The 2016 annual average unemployment rate for each S&E occupation is provided in Table 2. In 2016, the unemployment rates for S&E occupations range from 0.2% for biological scientists to 5.2% for web developers. The unemployment rate for every S&E occupation other than web developers was below the overall unemployment rate of 4.9%.17 However, the unemployment rates for most S&E occupations were higher than the rates for some other professional occupations—including dentists (0.4%), physicians and surgeons (0.5%), lawyers (0.7%), and registered nurses (1.2%).
|
Occupation |
Unemployment Rate |
|
Total, 16 years and over |
4.9 |
|
Science and Engineering Managers |
|
|
Computer and Information Systems Managers |
2.7 |
|
Architectural and Engineering Managers |
3.9 |
|
Natural Sciences Managers |
— |
|
Computer Occupations |
|
|
Computer and Information Research Scientists |
— |
|
Computer Systems Analysts |
2.6 |
|
Information Security Analysts |
3.2 |
|
Computer Programmers |
3.4 |
|
Software Developers, Applications and Systems Software |
1.6 |
|
Web Developers |
5.2 |
|
Computer Support Specialists |
3.3 |
|
Database Administrators |
3.1 |
|
Network and Computer Systems Administrators |
1.4 |
|
Computer Network Architects |
1.1 |
|
Computer Occupations, All Other |
3.0 |
|
Mathematical Occupations |
|
|
Actuaries |
— |
|
Mathematicians |
— |
|
Operations Research Analysts |
3.3 |
|
Statisticians |
1.4 |
|
Miscellaneous Mathematical Science Occupations |
— |
|
Engineers |
|
|
Aerospace Engineers |
2.2 |
|
Agricultural Engineers |
— |
|
Biomedical Engineers |
— |
|
Chemical Engineers |
4.2 |
|
Civil Engineers |
1.5 |
|
Computer Hardware Engineers |
1.6 |
|
Electrical and Electronics Engineers |
1.7 |
|
Environmental Engineers |
— |
|
Industrial Engineers, Including Health and Safety |
2.5 |
|
Marine Engineers and Naval Architects |
— |
|
Materials Engineers |
— |
|
Mechanical Engineers |
1.1 |
|
Mining and Geological Engineers, Including Mining Safety Engineers |
— |
|
Nuclear Engineers |
— |
|
Petroleum Engineers |
— |
|
Engineers, All Other |
1.7 |
|
Life Scientists |
|
|
Agricultural and Food Scientists |
— |
|
Biological Scientists |
0.2 |
|
Conservation Scientists and Foresters |
— |
|
Medical Scientists, Except Epidemiologists |
0.4 |
|
Life Scientists, All Other |
— |
|
Physical Scientists |
|
|
Astronomers and Physicists |
— |
|
Atmospheric and Space Scientists |
— |
|
Chemists and Material Scientists |
2.8 |
|
Environmental Scientists and Geoscientists |
3.4 |
|
Physical Scientists, All Other |
1.9 |
Source: Current Population Survey, 2016, Bureau of Labor Statistics, U.S. Department of Labor.
Notes: Unemployment for occupations refers to the experienced unemployed (those with prior work experience), classified according to their last job. For occupations in which the total number of employed and unemployed totals less than 50,000 the unemployment rate is not shown;—indicate data are not available.
Recent Trends in Employment, Wages, and Unemployment
This section provides information on changes in employment, wages, and unemployment for the period 2012 to 2016.
Employment Trends
Aggregate S&E Employment
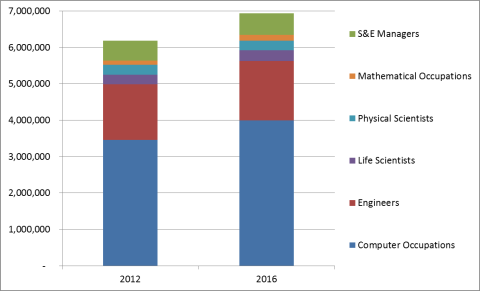
During the 2012-2016 period, aggregate S&E employment increased by 747,040 jobs, rising from 6.2 million to 6.9 million, a compound annual growth rate of 2.9%.18 The growth in the S&E occupations exceeded growth in overall U.S. employment, which grew 1.9% CAGR during this same period. Growth rates for the S&E occupational groups and detailed occupations are provided in the following sections.
Science and Engineering Occupational Groups
Figure 3 illustrates the aggregate size and occupational composition of the S&E workforce in 2012 and 2016. Aggregate S&E employment increased by 747,040 from 2012 to 2016, led by growth in the computer occupations (540,880), engineering occupations (105,320), and mathematical occupations (46,700).
|
Figure 3. Aggregate S&E Employment, 2012 and 2016 by S&E Occupational Group |
 |
|
Source: CRS analysis of Occupational Employment Statistics survey data, 2012-2016, Bureau of Labor Statistics, U.S. Department of Labor, https://www.bls.gov/oes/tables.htm. |
Table 3 provides employment data—2012 employment, 2016 employment, changes in number employed, and the compound annual growth rates during the 2012 to 2016 period—for each S&E occupational group. The fastest growth rate among S&E occupational groups during this period was in mathematical occupations, which grew at 8.5% CAGR, while the largest increase in the number employed was in computer occupations, which added 540,880 jobs. The slowest growth rate among S&E occupational groups during this period was for physical scientists, which contracted by 1.1% CAGR.
|
Occupation |
Employment, 2012 |
Employment, 2016 |
Employment Change, |
Employment Change, (Percentage) |
|
All occupations |
130,287,700 |
140,400,040 |
10,112,340 |
1.9 |
|
All S&E occupations |
6,187,760 |
6,934,800 |
747,040 |
2.9 |
|
S&E managers |
545,940 |
585,680 |
39,740 |
1.8 |
|
Computer occupations |
3,456,500 |
3,997,380 |
540,880 |
3.7 |
|
Mathematical occupations |
120,560 |
167,260 |
46,700 |
8.5 |
|
Engineers |
1,530,110 |
1,635,430 |
105,320 |
1.7 |
|
Life scientists |
260,040 |
286,400 |
26,360 |
2.4 |
|
Physical scientists |
274,610 |
262,650 |
-11,960 |
-1.1 |
Source: CRS analysis of Occupational Employment Statistics survey data, 2012-2016, Bureau of Labor Statistics, U.S. Department of Labor, https://www.bls.gov/oes/tables.htm.
Detailed S&E Occupations
Table 4 provides 2012-2016 employment data for each of the S&E occupations, organized by S&E group. The data indicate that there was substantial variation in the number of jobs gained and lost among the S&E occupations, as well as in their growth rates. With respect to the number employed, the occupation with the largest gain was software developers, applications, which added 207,660 jobs, while the occupation experiencing the largest decrease was computer programmers, which lost 45,590 jobs. Some have speculated that some of the losses in computer programmers may be due to reclassification of these positions as other computer occupations (e.g., software developers). The S&E occupations with the fastest growth rates were mathematical scientists, all other (13.2% CAGR, 780 new jobs), and operations research analysts (12.1% CAGR, 39,970 new jobs). The occupation with the fastest decline was physical scientists, all other (-6.9% CAGR, loss of 6,270 jobs).
Among the computer occupations, those with the fastest growth rates were computer occupations, all other (8.9% CAGR); software developers, applications (7.9% CAGR); and information security analysts (7.5% CAGR). The only computer occupation that experienced a decline in employment was computer programmers, which fell by 3.8% CAGR.
Ten engineering occupations increased employment during this period, with the largest growth in industrial engineers (36,420, 3.9% CAGR), mechanical engineers (33,250, 3.1% CAGR), and civil engineers (29,700, 2.8% CAGR). Employment gains in these and other engineering occupations were offset by declines in eight engineering occupations, including aerospace engineers (-11,910, -3.9% CAGR); computer hardware engineers (-6,630, -2.2% CAGR); and petroleum engineers (-3,630, -2.6% CAGR).
Growth in the mathematical occupations was led by operations research analysts (39,970, 12.1% CAGR), statisticians (7,870, 6.9% CAGR), and mathematical science occupations, all other (780, 13.2% CAGR). The remaining mathematical occupations declined: actuaries (-1,400, -1.7% CAGR) and mathematicians (-520, -4.3% CAGR).
Among life scientists, medical scientists, except epidemiologists, had the largest employment growth (13,450, 3.4% CAGR), followed by biological sciences, all other (4,030, 3.1% CAGR), and microbiologists (3,120, 4.0% CAGR). Employment declined in three life science occupations: life scientists, all other (-1,050, -3.1% CAGR); foresters (-1,050, -2.9% CAGR); and zoologists and wildlife biologists (-930, -1.3% CAGR).
The only physical sciences occupation with substantial growth was chemists (1,710, 0.5% CAGR). Environmental scientists and specialists, including health, remained essentially unchanged. Seven other physical sciences occupations declined, led by physical scientists, all other (-6,270, -6.9% CAGR), geoscientists, except hydrologists and geographers (-4,760, -3.6% CAGR), and physicists (-1,140, -1.6% CAGR).
Two S&E management occupations grew: computer and information systems managers (42,770, 3.3% CAGR) and natural sciences managers (6,220, 3.1% CAGR). The number of architectural and engineering managers declined (-9,250, -1.3% CAGR).
|
Occupational Group |
Employ-ment, |
Employ-ment, |
Employ-ment Change, Number |
Employ-ment Change, CAGR |
|
Science and Engineering Managers |
||||
|
Computer and Information Systems Managers |
309,740 |
352,510 |
42,770 |
3.3% |
|
Architectural and Engineering Managers |
187,640 |
178,390 |
-9,250 |
-1.3% |
|
Natural Sciences Managers |
48,560 |
54,780 |
6,220 |
3.1% |
|
Computer Occupations |
||||
|
Computer and Information Research Scientists |
24,880 |
26,580 |
1,700 |
1.7% |
|
Computer Systems Analysts |
482,040 |
568,960 |
86,920 |
4.2% |
|
Information Security Analysts |
72,670 |
96,870 |
24,200 |
7.5% |
|
Computer Programmers |
316,790 |
271,200 |
-45,590 |
-3.8% |
|
Software Developers, Applications |
586,340 |
794,000 |
207,660 |
7.9% |
|
Software Developers, Systems Software |
391,700 |
409,820 |
18,120 |
1.1% |
|
Web Developers |
102,940 |
129,540 |
26,600 |
5.9% |
|
Database Administrators |
111,590 |
113,730 |
2,140 |
0.5% |
|
Network and Computer Systems Administrators |
350,320 |
376,820 |
26,500 |
1.8% |
|
Computer Network Architects |
137,890 |
157,070 |
19,180 |
3.3% |
|
Computer User Support Specialists |
525,630 |
602,840 |
77,210 |
3.5% |
|
Computer Network Support Specialists |
167,980 |
188,740 |
20,760 |
3.0% |
|
Computer Occupations, All Other |
185,730 |
261,210 |
75,480 |
8.9% |
|
Mathematical Occupations |
||||
|
Actuaries |
21,340 |
19,940 |
-1,400 |
-1.7% |
|
Mathematicians |
3,250 |
2,730 |
-520 |
-4.3% |
|
Operations Research Analysts |
69,180 |
109,150 |
39,970 |
12.1% |
|
Statisticians |
25,570 |
33,440 |
7,870 |
6.9% |
|
Mathematical Science Occupations, All Other |
1,220 |
2,000 |
780 |
13.2% |
|
Engineers |
||||
|
Aerospace Engineers |
80,420 |
68,510 |
-11,910 |
-3.9% |
|
Agricultural Engineers |
2,470 |
1,980 |
-490 |
-5.4% |
|
Biomedical Engineers |
18,810 |
20,590 |
1,780 |
2.3% |
|
Chemical Engineers |
32,190 |
31,990 |
-200 |
-0.2% |
|
Civil Engineers |
258,100 |
287,800 |
29,700 |
2.8% |
|
Computer Hardware Engineers |
79,580 |
72,950 |
-6,630 |
-2.2% |
|
Electrical Engineers |
160,560 |
183,770 |
23,210 |
3.4% |
|
Electronics Engineers, except Computer |
134,960 |
132,100 |
-2,860 |
-0.5% |
|
Environmental Engineers |
50,850 |
52,280 |
1,430 |
0.7% |
|
Health and Safety Engineers, except Mining Safety Engineers and Inspectors |
23,490 |
25,410 |
1,920 |
2.0% |
|
Industrial Engineers |
220,130 |
256,550 |
36,420 |
3.9% |
|
Marine Engineers and Naval Architects |
6,880 |
8,120 |
1,240 |
4.2% |
|
Materials Engineers |
22,740 |
26,800 |
4,060 |
4.2% |
|
Mechanical Engineers |
252,540 |
285,790 |
33,250 |
3.1% |
|
Mining and Geological Engineers, incl. Mining Safety Engineers |
7,640 |
6,940 |
-700 |
-2.4% |
|
Nuclear Engineers |
19,930 |
17,680 |
-2,250 |
-3.0% |
|
Petroleum Engineers |
36,410 |
32,780 |
-3,630 |
-2.6% |
|
Engineers, All Other |
122,410 |
123,390 |
980 |
0.2% |
|
Life Scientists |
||||
|
Animal Scientists |
2,120 |
2,470 |
350 |
3.9% |
|
Food Scientists and Technologists |
13,680 |
14,200 |
520 |
0.9% |
|
Soil and Plant Scientists |
12,410 |
14,690 |
2,280 |
4.3% |
|
Biochemists and Biophysicists |
26,410 |
29,200 |
2,790 |
2.5% |
|
Microbiologists |
18,550 |
21,670 |
3,120 |
4.0% |
|
Zoologists and Wildlife Biologists |
18,650 |
17,720 |
-930 |
-1.3% |
|
Biological Scientists, All Other |
31,080 |
35,110 |
4,030 |
3.1% |
|
Conservation Scientists |
18,460 |
20,470 |
2,010 |
2.6% |
|
Foresters |
9,470 |
8,420 |
-1,050 |
-2.9% |
|
Epidemiologists |
4,850 |
5,690 |
840 |
4.1% |
|
Medical Scientists, except Epidemiologists |
95,420 |
108,870 |
13,450 |
3.4% |
|
Life Scientists, All Other |
8,940 |
7,890 |
-1,050 |
-3.1% |
|
Physical Scientists |
||||
|
Astronomers |
2,150 |
1,830 |
-320 |
-3.9% |
|
Physicists |
17,820 |
16,680 |
-1,140 |
-1.6% |
|
Atmospheric and Space Scientists |
10,190 |
9,800 |
-390 |
-1.0% |
|
Chemists |
84,950 |
86,660 |
1,710 |
0.5% |
|
Materials Scientists |
7,970 |
7,750 |
-220 |
-0.7% |
|
Environmental Scientists and Specialists, incl. Health |
84,240 |
84,250 |
10 |
0.0% |
|
Geoscientists, Except Hydrologists and Geographers |
35,180 |
30,420 |
-4,760 |
-3.6% |
|
Hydrologists |
6,880 |
6,300 |
-580 |
-2.2% |
|
Physical Scientists, All Other |
25,230 |
18,960 |
-6,270 |
-6.9% |
Source: CRS analysis of Occupational Employment Statistics survey data, 2012-2016, Bureau of Labor Statistics, U.S. Department of Labor, http://www.bls.gov/oes/tables.htm.
Table 5 shows the 10 S&E occupations with the largest employment growth from 2012 to 2016. The list includes five computer occupations, three engineering occupations, one mathematics occupation, and one S&E management occupation.
|
Rank |
S&E Occupation |
Employment Growth |
|
1 |
Software Developers, Applications |
207,660 |
|
2 |
Computer Systems Analysts |
86,920 |
|
3 |
Computer User Support Specialists |
77,210 |
|
4 |
Computer Occupations, All Other |
75,480 |
|
5 |
Computer and Information Systems Managers |
42,770 |
|
6 |
Operations Research Analysts |
39,970 |
|
7 |
Industrial Engineers |
36,420 |
|
8 |
Mechanical Engineers |
33,250 |
|
9 |
Civil Engineers |
29,700 |
|
10 |
Web Developers |
26,600 |
Source: CRS analysis of Occupational Employment Statistics survey data, 2012-2016, BLS, U.S. Department of Labor.
Table 6 shows the 10 S&E occupations with the largest employment losses. The occupation with the greatest employment loss is computer programmers. As mentioned earlier, some have speculated that some of the losses in computer programmers may be due to reclassification of these positions as other computer occupations (e.g., software developers). The list includes five engineering occupations, two physical sciences occupations, one computer occupation, one mathematics occupation, and one S&E management occupation.
|
Rank |
S&E Occupation |
Employment Growth |
|
1 |
Computer Programmers |
-45,590 |
|
2 |
Aerospace Engineers |
-11,910 |
|
3 |
Architectural and Engineering Managers |
-9,250 |
|
4 |
Computer Hardware Engineers |
-6,630 |
|
5 |
Physical Scientists, All Other |
-6,270 |
|
6 |
Geoscientists, Except Hydrologists and Geographers |
-4,760 |
|
7 |
Petroleum Engineers |
-3,630 |
|
8 |
Electronics Engineers, Except Computer |
-2,860 |
|
9 |
Nuclear Engineers |
-2,250 |
|
10 |
Actuaries |
-1,400 |
Source: CRS analysis of Occupational Employment Statistics survey data, 2012-2016, BLS, U.S. Department of Labor.
Table 7 shows the 10 S&E occupations with the fastest growth rates. The occupation with the fastest growth rate was mathematical science occupations, all other (13.2% CAGR), adding 1,220 jobs from 2012 to 2016, followed by operations research analysts (12.1% CAGR), and computer occupations, all other (8.9% CAGR). The list includes five computer occupations, three mathematics occupations, one engineering occupation, and one life sciences occupation.
|
Rank |
S&E Occupation |
Employment Growth rate |
|
1 |
Mathematical Science Occupations, All Other |
13.2% |
|
2 |
Operations Research Analysts |
12.1% |
|
3 |
Computer Occupations, All Other |
8.9% |
|
4 |
Software Developers, Applications |
7.9% |
|
5 |
Information Security Analysts |
7.5% |
|
6 |
Statisticians |
6.9% |
|
7 |
Web Developers |
5.9% |
|
8 |
Soil and Plant Scientists |
4.3% |
|
9 |
Computer Systems Analysts |
4.2% |
|
10 |
Marine Engineers and Naval Architects |
4.2% |
Source: CRS analysis of Occupational Employment Statistics survey data, 2012-2016, BLS, U.S. Department of Labor.
Table 8 shows the 10 S&E occupations with the slowest growth rates. All 10 of these occupations have negative growth rates. This list includes at least one occupation from each of the engineering, physical sciences, life sciences, mathematics, and computer occupational groups.
|
Rank |
S&E Occupation |
Employment Growth Rate |
|
1 |
Physical Scientists, All Other |
-6.9% |
|
2 |
Agricultural Engineers |
-5.4% |
|
3 |
Mathematicians |
-4.3% |
|
4 |
Astronomers |
-3.9% |
|
5 |
Aerospace Engineers |
-3.9% |
|
6 |
Computer Programmers |
-3.8% |
|
7 |
Geoscientists, Except Hydrologists and Geographers |
-3.6% |
|
8 |
Life Scientists, All Other |
-3.1% |
|
9 |
Nuclear Engineers |
-3.0% |
|
10 |
Foresters |
-2.9% |
Source: CRS analysis of Occupational Employment Statistics survey data, 2012-2016, BLS, Department of Labor.
Wage Trends
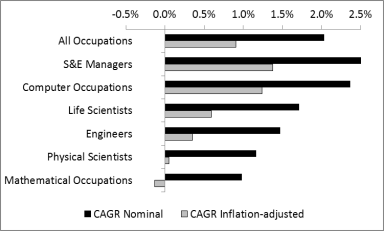
Between 2012 and 2016, mean wages for each S&E occupational group grew at about the same pace as the overall mean wage for all occupations, and only somewhat faster than inflation. Figure 4 illustrates the nominal and inflation-adjusted compound annual growth rates for each S&E occupational group, as well as for all occupations. The nominal growth rate of mean wages for all occupations during this period was 2.0% CAGR, while the fastest growth rate in the S&E occupational groups was for S&E managers (2.5% CAGR), followed by computer occupations (2.4% CAGR). All other S&E occupational groups had mean wage growth smaller than that of all occupations: life scientists (1.7% CAGR), engineers (1.5% CAGR), physical scientists (1.2% CAGR), and mathematic occupations (1.0% CAGR). Adjusted for inflation, mathematical occupations experienced a small decline (-0.1% CAGR) in mean wages between 2012 and 2016, while the other S&E occupational groups grew by less than 1.4% CAGR.
|
Figure 4. Nominal and Inflation-Adjusted Compound Annual Growth Rates |
 |
|
Source: CRS analysis of Occupational Employment Statistics survey data, 2012-2016, http://www.bls.gov/oes/tables.htm, using BLS Consumer Price Index Inflation Calculator for May 2012 and May 2016, http://data.bls.gov/cgi-bin/cpicalc.pl. |
Unemployment Trends
Table 9 provides unemployment rates for the S&E occupational groups, as well as all for all workers (16 years and over) and selected professional and related occupations for the years 2012-2016. This table provides a perspective on how the unemployment rates of S&E occupational groups compare to the overall unemployment rate and other selected professional and related occupations, as well as how these rates changed during this period.
Professional occupations (of which the S&E occupations are a part) historically have had lower unemployment rates than the overall workforce. As shown in Table 9, S&E occupational groups had significantly lower unemployment rates than those of the overall workforce for the 2012-2016 period. Nevertheless, during this period the S&E occupational groups generally had unemployment rates that were comparable or higher than the rates for other selected professional occupations (e.g., lawyers, dentists, physicians and surgeons, registered nurses, accountants and auditors).
Table 9. Unemployment Rates for S&E Occupational Groups, the Overall Workforce, and Other Selected Professional and Related Occupations, 2012-2016
|
2012 |
2013 |
2014 |
2015 |
2016 |
|
|
Total, 16 years and over |
8.1% |
7.4% |
6.2% |
5.3% |
4.9% |
|
S&E Occupations |
|||||
|
Physical Scientistsa |
3.5% |
3.3% |
2.8% |
2.6% |
2.9% |
|
S&E Managersb |
3.1% |
3.1% |
1.7% |
2.2% |
2.8% |
|
Computer Occupations |
3.8% |
3.7% |
2.7% |
2.6% |
2.6% |
|
Mathematical Occupationsc |
n/a |
2.4% |
3.9% |
1.9% |
2.4% |
|
Engineersd |
3.2% |
3.0% |
2.4%d |
2.2% |
2.0% |
|
Life Scientistse |
2.9% |
2.6% |
4.0% |
2.7% |
0.6% |
|
Selected Non-S&E Occupations |
|||||
|
Accountants and auditors |
4.2% |
4.2% |
3.6% |
3.2% |
2.5% |
|
Registered nurses |
2.0% |
2.6% |
2.0% |
2.1% |
1.5% |
|
Lawyers |
2.1% |
1.4% |
1.9% |
1.2% |
1.1% |
|
Physicians and surgeons |
0.6% |
0.8% |
0.7% |
0.4% |
0.6% |
|
Dentists |
0.7% |
1.5% |
0.9% |
0.2% |
0.1% |
Source: CRS analysis of unpublished data for 2012-2016 from the Current Population Survey, BLS.
a. According to CPS, unemployment data for atmospheric and space scientists are not available. For this table, this category includes all other physical sciences occupations.
b. According to CPS, unemployment data for natural science managers are not available. For this table, this category includes computer and information systems managers and architectural and engineering managers.
c. According to CPS, unemployment data for actuaries, mathematicians, and miscellaneous mathematical science occupations are not available. For this table, this category includes only operations research analysts and statisticians; data for statisticians was not available for 2012.
d. According to CPS, unemployment data for agricultural engineers, biomedical engineers, marine engineers and naval architects, mining and geological engineers, including mining safety engineers are not available; unemployment data for materials engineers was unavailable for 2014 only. For this table, this category includes all other engineering occupations.
e. According to CPS, unemployment data for life scientists, all other are not available. For this table, this category includes all other life sciences occupations.
Employment Projections, 2016-2026
This section provides an analysis of the Bureau of Labor Statistics occupational employment projections for the 2016-2026 period. The data for this projection period were released in October 2017.
Scientists and Engineers in Aggregate
CRS analysis of Bureau of Labor Statistics employment projections indicates that the science and engineering workforce is expected to grow from 7.3 million to 8.2 million jobs between 2016 and 2026, an increase of 853,600 (11.7%) jobs over the 10-year period (1.1% CAGR). This growth rate is higher than the growth rate projected for all occupations (0.7% CAGR) during this period.19
In addition to the job openings created by growth in the number of jobs in S&E occupations, BLS projects that an additional 1.439 million scientists and engineers will exit the labor force due to factors such as retirement, death, and to care for family members. This brings the number of S&E job openings created by job growth and those exiting the workforce to nearly 2.3 million. In addition, BLS projects that there will be an additional 3.7 million openings created by occupational transfers in S&E positions during this period, that is, workers in S&E occupations who leave their jobs to take jobs in different occupations, S&E or non-S&E.20 The BLS projections do not include data that allow for a quantitative analysis of how many new workers (those not in the labor market in 2016) will be required for openings created by job growth, labor force exits, and occupational transfers, as there is no detail to how many of the S&E openings are expected to be filled by workers transferring into these openings from S&E occupations and from non-S&E occupations (that is, some workers may transfer from one S&E occupation to another, some may transfer from an S&E occupations to a non-S&E occupations, and still others may transfer from a non-S&E occupation into an S&E occupations). According to BLS, the projections methodology allows for multiple occupational transfers from the same position during the 10-year projection period, but only one occupational transfer in a given year.21
Science and Engineering Occupational Groups
Employment projections for science and engineering occupational groups are provided in Table 10. This table provides the following information for each group: 2016 actual employment; 2026 projected employment; the total change, total percentage increase, and compound annual growth rate in the number of jobs between 2016 and 2026; the annual average increase in the number of jobs; occupational separations, including labor force exits, occupational transfers, and total occupational separations; and total annual job openings (growth plus occupational separations).
Among the S&E occupational groups, computer occupations are projected to see the largest increase in the number employed (546,100), the largest annual average number of labor force exits (75,800), and the largest annual average number of occupational transfers (217,300). Computer occupations, which accounted for 58.0% of all S&E jobs in 2016, are projected to account for 64.0% of the total growth in S&E occupations between 2016 and 2026. (See Figure 5.) As a result, the share of all S&E jobs accounted for by computer occupations is projected to rise to 58.6% in 2026.
Mathematical occupations are projected to have the fastest employment growth (2.5% CAGR), increasing their projected share of total S&E employment slightly from 2.5% in 2016 to 2.8% in 2026.
The occupational groups that are projected to account for a smaller share of total S&E job growth than their share of total 2016 S&E employment are as follows:
- S&E Managers—projected to account for 7.0% of total S&E job growth during the 2016-2026 period, down from their 8.3% share of S&E employment in 2016, resulting in their projected share of 2026 S&E employment falling to 8.1%.
- Engineers—projected to account for 16.2% of total S&E job growth during the 2016-2026 period, below their 23.0% share of S&E employment in 2016, thus reducing their projected share of 2026 S&E employment to 22.3%;
- Life Scientists—projected to account for 3.8% of total S&E job growth during the 2016-2026 period, below their 4.5% share of S&E employment in 2016, thus reducing their projected share of 2026 S&E employment to 4.4%; and
- Physical Scientists—projected to account for 3.2% of total S&E job growth during the 2016-2026 period, below their 3.8% share of S&E employment in 2016, thus reducing their projected share of 2026 S&E employment to 3.7%.
Table 10. Employment Projections for S&E Occupational Groups, Other Selected Professional and Related Occupations, 2016-2026
Numbers in thousands, except percent and CAGR
|
Employment |
Change, |
Change, |
Occupational Separations, |
Occupa-tional Openings, |
|||||||
|
2016 |
2026 |
Number |
% |
CAGR |
Number |
Labor Force Exits |
Occupa-tional Transfers |
Total |
|||
|
Computer Occupations |
4,238.6 |
4,784.3 |
546.1 |
12.9% |
1.2% |
54.6 |
75.8 |
217.3 |
292.8 |
347.4 |
|
|
Mathematical Occupations |
180.1 |
230.2 |
50.1 |
27.8% |
2.5% |
5.0 |
4.0 |
8.6 |
12.8 |
17.8 |
|
|
Engineers |
1,680.8 |
1,819.7 |
138.5 |
8.2% |
0.8% |
13.9 |
38.5 |
74.1 |
112.7 |
126.6 |
|
|
Life Scientists |
325.4 |
357.7 |
32.6 |
10.0% |
1.0% |
3.3 |
7.2 |
22.2 |
29.0 |
32.3 |
|
|
Physical Scientists |
278.2 |
305.1 |
27.0 |
9.7% |
0.9% |
2.7 |
6.5 |
18.7 |
25.2 |
27.9 |
|
|
S&E Managers |
604.4 |
663.7 |
59.3 |
9.8% |
0.9% |
5.9 |
11.9 |
33.4 |
45.4 |
51.3 |
|
|
Total, S&E |
7,307.5 |
8,160.7 |
853.6 |
11.7% |
1.1% |
85.4 |
143.9 |
374.3 |
517.9 |
603.3 |
|
|
Selected Other Professional and Related Occupations |
|||||||||||
|
Lawyers |
792.5 |
867.4 |
74.9 |
9.5% |
0.9% |
7.5 |
16.5 |
18.0 |
34.4 |
41.9 |
|
|
Dentists |
153.5 |
179.9 |
26.4 |
17.2% |
1.6% |
2.6 |
3.1 |
1.2 |
4.3 |
7.0 |
|
|
Physicians and surgeons |
713.8 |
820.3 |
106.5 |
14.9% |
1.4% |
10.7 |
11.2 |
8.5 |
19.7 |
30.4 |
|
|
Registered nurses |
2,955.2 |
3,392.2 |
437.0 |
14.8% |
1.4% |
43.7 |
90.9 |
69.0 |
159.9 |
203.6 |
|
|
Accountants and auditors |
1,397.7 |
1,538.0 |
140.3 |
10.0% |
1.0% |
14.0 |
43.3 |
84.5 |
127.8 |
141.8 |
|
|
Total, All Occupations |
156,063.8 |
167,582.3 |
11,518.5 |
7.4% |
0.7% |
1151.9 |
7,548.5 |
10,040.0 |
17,588.5 |
18,740.4 |
|
Source: CRS analysis of Employment Projections, 2016-2026, Bureau of Labor Statistics, U.S. Department of Labor.
Notes: Numbers for S&E occupational groups may not add due to rounding of component occupations.
Across all occupations (not just S&E occupations), BLS projects the number needed to replace those exiting the labor force (75.5 million) will be more than six times the number of new jobs created (11.5 million). For S&E occupations, the number needed to replace those exiting the workforce (1.4 million) is expected to be less than twice the number of new jobs created (0.9 million). For nearly all S&E occupational groups, labor force exits greatly exceed the number of projected new jobs in the occupation as for the workforce as a whole. For example, BLS projects 385,000 labor force exits in the engineering occupations and job growth of 138,900 between 2016 and 2026. However, for the mathematical occupations, the number of openings resulting from job growth (50,100) is expected to exceed the number of openings resulting from labor force exits (40,000) during this period.
Figure 6 illustrates the composition of projected job openings by job growth, labor force exits, and occupational transfers for each S&E occupational group for the 2016-2026 period. Figure 7 illustrates the composition of total projected S&E job openings resulting from job growth, labor force exits, and occupational transfers by S&E occupational group for the 2016-2026 period.
Detailed Science and Engineering Occupations
The Bureau of Labor Statistics' projected job growth and labor force for the S&E occupations vary substantially for the 2016-2026 projection period. Table 11-Table 16 show the top 10 S&E occupations in terms of job growth, job losses, and labor force exits.
Table 11 shows the 10 S&E occupations with the highest projected growth in jobs during the 2016-2026 projection period. These occupations account for 71.5% of total growth in S&E jobs. Seven of the ten S&E occupations on this list are in the computer occupations. One of the remaining three occupations is computer and information systems managers. The only two non-IT occupations in the top 10 are civil engineers and mechanical engineers.
Table 11. S&E Occupations with the Largest Projected Job Growth, Other Selected Occupations, 2016-2026
|
Rank |
S&E Occupation |
Projected Average Annual Job Growtha |
|
|
1 |
Software developers, applications |
|
|
|
2 |
Computer user support specialists |
|
|
|
3 |
Computer systems analysts |
|
|
|
4 |
Software developers, systems software |
|
|
|
5 |
Computer and information systems managers |
|
|
|
6 |
Civil engineers |
|
|
|
7 |
Operations research analysts |
|
|
|
8 |
Information security analysts |
|
|
|
9 |
Computer occupations, all other |
|
|
|
10 |
Mechanical engineers |
|
|
|
Selected Non S&E Occupations with Highest Projected Growth |
|||
|
1 |
Personal care aides |
|
|
|
2 |
Combined food preparation & serving workers, incl. fast food |
|
|
|
3 |
Registered nurses |
|
|
|
4 |
Home health aides |
|
|
|
5 |
Janitors and cleaners, except maids and housekeeping cleaners |
|
|
Source: CRS analysis of Employment Projections, 2016-2026, Bureau of Labor Statistics, U.S. Department of Labor.
a. The numbers in this column are derived by dividing the net job creation during the 2016-2026 projection period for each occupation by 10 to get the average annual number of net new jobs created.
Table 12 shows the 10 S&E occupations with the smallest projected growth in jobs. The list includes occupations from computer, physical and life sciences, mathematics, and engineering occupations. The only S&E occupation projected to see a reduction in jobs is computer programmers. This could be due, in part, to a reclassification of jobs previously counted as computer programmers to software developers (applications and systems software).
|
Rank |
S&E Occupation |
Projected Average Annual Job Growtha |
|
|
1 |
Computer programmers |
|
|
|
2 |
Mathematical science occupations, all other |
|
|
|
3 |
Agricultural engineers |
|
|
|
4 |
Astronomers |
|
|
|
5 |
Materials engineers |
|
|
|
6 |
Animal scientists |
|
|
|
7 |
Mining and geological engineers, incl. mining safety engineers |
|
|
|
8 |
Epidemiologists |
|
|
|
9 |
Foresters |
|
|
|
10 |
Materials scientists |
|
Source: CRS analysis of Employment Projections, 2016-2026, Bureau of Labor Statistics, U.S. Department of Labor.
a. The numbers in this column are derived by dividing the net job creation during the 2016-2026 projection period for each occupation by 10 to get the average annual number of net new jobs created.
Table 13 shows the 10 S&E occupations with the fastest projected job growth rates. Statisticians (2.9%), software developers, applications (2.7% CAGR), and mathematicians (2.6% CAGR) are the fastest-growing S&E occupations. The remaining occupations on the list range from 1.3% to 2.5% CAGR, faster than the overall projected job growth rate for all occupations (0.7% CAGR). The list includes four mathematical occupations, three computer occupations, two physical sciences occupations, and one engineering occupation. The five non-S&E occupations with the highest growth rate for the projection period are also provided for context.
|
Rank |
S&E Occupation |
Projected Job Growth Rate (CAGR) |
Projected Average Annual Job Growtha |
|||
|
1 |
Statisticians |
|
|
|||
|
2 |
Software developers, applications |
|
|
|||
|
3 |
Mathematicians |
|
|
|||
|
4 |
Information security analysts |
|
|
|||
|
5 |
Operations research analysts |
|
|
|||
|
6 |
Actuaries |
|
|
|||
|
7 |
Computer and information research scientists |
|
|
|||
|
8 |
Petroleum engineers |
|
|
|||
|
9 |
Physicists |
|
|
|||
|
10 |
Geoscientists, except hydrologists and geographers |
|
|
|||
|
Non-S&E Occupations with Fastest Projected Growth |
|
|||||
|
1 |
Solar photovoltaic installers |
|
|
|||
|
2 |
Wind turbine service technicians |
|
|
|||
|
3 |
Home health aides |
|
|
|||
|
4 |
Personal care aides |
|
|
|||
|
5 |
Physician assistants |
|
|
|||
|
All Occupations |
|
|
||||
Source: CRS analysis of Employment Projections, 2016-2026, Bureau of Labor Statistics, U.S. Department of Labor.
a. The numbers in this column are derived by dividing the net job creation during the 2016-2026 projection period for each occupation by 10 to get the average annual number of net new jobs created.
Table 14 shows the 10 S&E occupations with the slowest projected job growth rates, ranging from -0.8% to 0.6% CAGR, each below the overall projected job growth rate of 0.7% CAGR. The list includes five engineering occupations and architectural and engineering managers. Of the remaining four, three are life sciences occupations and one is a computer occupation.
|
Rank |
S&E Occupation |
Projected Job Growth Rate (CAGR) |
Projected Average Annual Job Growtha |
|||
|
1 |
Computer programmers |
|
|
|||
|
2 |
Materials engineers |
|
|
|||
|
3 |
Electronics engineers, except computer |
|
|
|||
|
4 |
Nuclear engineers |
|
|
|||
|
5 |
Foresters |
|
|
|||
|
6 |
Animal scientists |
|
|
|||
|
7 |
Computer hardware engineers |
|
|
|||
|
8 |
Architectural and engineering managers |
|
|
|||
|
9 |
Food scientists and technologists |
|
|
|||
|
10 |
Aerospace engineers |
|
|
Source: CRS analysis of Employment Projections, 2016-2026, Bureau of Labor Statistics, U.S. Department of Labor.
a. The numbers in this column are derived by dividing the net job creation during the 2016-2026 projection period for each occupation by 10 to get the average annual number of net new jobs created.
Table 15 shows the 10 S&E occupations with the most projected job openings due to growth, labor force exits, and occupational transfers. Five of the ten occupations are computer occupations and one is computer and information systems managers. In addition, three occupations on the list are engineering occupations—civil, mechanical, and industrial engineers—and one is a mathematical occupation. These 10 occupations account for $60.8% of all projected job openings in S&E occupations.
Table 15. S&E Occupations with the Most Projected Job Openings Due to Growth, Labor Force Exits, and Occupational Transfers, 2016-2026
|
Rank |
S&E Occupation |
Projected Average Annual Job Openingsa |
|
|
1 |
Software developers, applications |
|
|
|
2 |
Computer user support specialists |
|
|
|
3 |
Computer systems analysts |
|
|
|
4 |
Software developers, systems software |
|
|
|
5 |
Computer and information systems managers |
|
|
|
6 |
Civil engineers |
|
|
|
7 |
Operations research analysts |
|
|
|
8 |
Computer occupations, all other |
|
|
|
9 |
Mechanical engineers |
|
|
|
10 |
Industrial engineers |
|
Source: CRS analysis of Employment Projections, 2016-2026, Bureau of Labor Statistics, U.S. Department of Labor.
a. The numbers in this column are derived by dividing the net job creation during the 2016-2026 projection period for each occupation by 10 to get the average annual number of net new jobs created.
Table 16 shows the 10 S&E occupations with the fewest projected job openings. These 10 occupations account for less than 1% of all S&E job openings during the projection period. The list includes occupations from life sciences, physical sciences, engineering, and mathematics.
Table 16. S&E Occupations with Fewest Projected Job Openings Due to Growth, Labor Force Exits, and Occupational Transfers, 2016-2026
|
Rank |
S&E Occupation |
Projected Average Annual Job Openingsa |
|
|
1 |
Agricultural engineers |
|
|
|
2 |
Mathematical science occupations, all other |
|
|
|
3 |
Astronomers |
|
|
|
4 |
Mathematicians |
|
|
|
5 |
Epidemiologists |
|
|
|
6 |
Mining and geological engineers, incl. mining safety engineers |
|
|
|
7 |
Marine engineers and naval architects |
|
|
|
8 |
Animal scientists |
|
|
|
9 |
Hydrologists |
|
|
|
10 |
Materials scientists |
|
Source: CRS analysis of Employment Projections, 2016-2026, Bureau of Labor Statistics, U.S. Department of Labor.
a. The numbers in this column are derived by dividing the net job creation during the 2016-2026 projection period for each occupation by 10 to get the average annual number of net new jobs created.
Concluding Observations
Scientists and engineers are widely believed to be essential to U.S. technological leadership, innovation, manufacturing, and services, and thus vital to U.S. economic strength, national defense, and other societal needs (e.g., treating and preventing diseases, ensuring access to affordable energy, protecting and restoring the environment). The adequacy of the U.S. science and engineering workforce has been an ongoing concern of Congress for more than 60 years. Congress has enacted many programs to support the education and development of scientists and engineers. Congress has also undertaken broad efforts to improve science, technology, engineering, and math (STEM) skills to prepare a greater number of students to pursue science and engineering (S&E) degrees. Some policymakers have sought to increase the number of foreign scientists and engineers working in the United States through changes in visa and immigration policies.
While there is a broad consensus on the important role of scientists and engineers in the United States, policymakers, business leaders, academicians, S&E professional society analysts, economists, and others hold diverse views with respect to the adequacy of the S&E workforce and related policy issues. In particular, there are varying perspectives about whether a shortage of scientists and engineers exists in the United States, what the nature of such a shortage might be (e.g., too few people with S&E degrees, a mismatch of worker skills and employer needs), and whether the federal government should undertake policy interventions to address a putative shortage or allow market forces to work in this labor market.
Perspectives on the Adequacy of the U.S. S&E Workforce
Here are some general ways in which their views may be expressed:
- There is a shortage. There is a shortage (or a looming shortage) of scientists and engineers (or alternatively, an inadequate supply of workers with degrees in science and engineering fields), and this may result in the loss of U.S. scientific, engineering, technological, and industrial leadership, with consequent effects on areas such as economic growth, job creation, standard of living, and national security.22
- There is not a shortage. Assertions of a broad shortage of scientists and engineers are not supported by the data when considering indicators such as employment growth, wage growth, and unemployment rates.23
- More scientists and engineers are needed regardless of the existence of a shortage. Historically, federal policies, programs, and investments have contributed to the development of the United States' scientific and engineering workforce. Regardless of whether demand currently exceeds supply, increasing the number of U.S. scientists and engineers will increase U.S. innovation, economic performance, and job creation. Even if there is not a shortage of scientists and engineers, jobs in many occupations require a higher level of STEM knowledge than ever before.24 Students who earn S&E degrees gain thinking skills, problem-solving skills, and STEM knowledge that will enable them to be successful not only in S&E occupations, but also in S&E-related careers and in non-S&E fields where they can apply their S&E knowledge and skills.25
- Government interventions in the S&E labor market to address perceived shortages may introduce inefficiencies. Federal government efforts to increase the number of scientists and engineers by incentivizing the pursuit of degrees in S&E disciplines and/or increasing immigration quotas may result in less efficient operation of the S&E labor market. For example, too many students may be educated in S&E for the number of jobs available and graduates who find S&E jobs may receive lower salaries.26
- Workforce projections are unreliable for predicting shortages. Long-term projections for S&E occupations are unreliable.27 Relying on such projections may result in the preparation of too many or too few students with S&E degrees or in mismatches between the students' education and market needs. Among the difficulties in making long-term projections are unexpected changes in the mix of industrial output or employment due to technological or market changes, factor substitution (e.g., substitution of capital for labor) due to changes in prices, changes in retirement behavior, the availability of foreign labor, labor market demographics, and government policies.28
- There may be shortages in certain industries, occupations, or fields. Shortages may exist in some S&E occupations or for certain employers, for example in new and emerging S&E fields (e.g., nanotechnology); cyclical industries (e.g., aerospace); in fields where foreign scientists and engineers may not be employed due to export control laws; and for employers otherwise limited, in general or for specific purposes, to using only U.S. citizens.
- The labor market will resolve such needs. If markets are allowed to operate freely (i.e., without government interventions), any short-term "shortages" will be resolved as wages equilibrate demand and supply, as the labor supply increases (e.g., as more students earn S&E degrees) in response to market signals, or through substitution of alternative inputs.29
- The potential adverse consequences of even discrete shortages require government interventions. These shortages should be met with federal efforts to increase supply or the United States may face the loss of technological leadership in new and emerging fields, lower economic performance, and diminished national security.30
- Industry assertions of shortages are driven by a desire to reduce costs and/or increase current knowledge. Industry assertions of S&E shortages are driven primarily by a desire to lower their labor costs through increased supply by providing a continuous stream of young, lower-cost recent college graduates through education, training, and immigration. These new hires can replace older, higher-cost workers with less current knowledge.31
- The real issue is a skills mismatch, not a shortage of people. The difficulty employers have in meeting their S&E workforce needs (in particular their information technology workforce needs) results primarily from a mismatch between the specific skills—or combinations of knowledge, skills, and experience—needed by employers and those held by S&E workers.32
- Expanding immigration can help address the shortage. Immigration policies directed at increasing the number of foreign scientists and engineers in the United States put the creativity of the world's best and brightest to work for the U.S. economy and reduce the loss of U.S.-educated foreign nationals with S&E degrees (i.e., returning to their countries of origin, working in countries other than the United States or their countries of origin).33
- Expanding immigration will dampen the market signals that would otherwise drive more U.S. students into science and engineering. Visa and immigration policies directed at increasing the number of foreign scientists and engineers in the United States may, by increasing the overall supply of scientists and engineers, depress wages, increase unemployment, and reduce career opportunities for U.S. scientists and engineers; discourage American students from pursuing S&E degrees and careers; and cloud labor market signals (e.g., wage growth, unemployment rates) to students considering pursuing S&E degrees and careers.34
- U.S. students lag those of other nations in STEM knowledge; federal efforts to improve STEM education are needed. U.S. students lag foreign students in STEM knowledge, and this may result in fewer and/or less-talented U.S. scientists and engineers, lower economic growth, and reduced economic competitiveness.35 Federal policies and programs can help to build a stronger K-12 STEM education system.
- International assessments do not reflect the adequacy of U.S. student STEM knowledge. Standardized tests used to compare the STEM knowledge of U.S. K-12 students to those of other nations do not appropriately reflect the STEM knowledge of U.S. students, the adequacy of their preparation to pursue S&E degrees and occupations, or their future capabilities as scientists and engineers.36
Perspectives on Ways to Foster Development of the S&E Workforce
These disparate perspectives contribute to a variety of opinions on the roles the federal government should play in fostering the development of the S&E workforce, including the merits of federal policies focused on
- increasing the number of students pursuing S&E degrees;
- increasing the number of foreign scientists and engineers admitted to the United States;
- increasing the number and share of underrepresented minorities and women in science and engineering;
- improving K-12 STEM education; and
- improving career information and counseling for high school students.
As Congress considers approaches to bolstering U.S. competitiveness and scientific, engineering, technological, and industrial leadership, it may consider these perspectives and opinions.
Appendix A. S&E Occupational Descriptions and Entry-Level Education Requirements
|
Occupation |
Description |
Entry-Level Education |
|
Computer Occupations |
||
|
Computer and Information Research Scientists |
Conduct research into fundamental computer and information science as theorists, designers, or inventors. Develop solutions to problems in the field of computer hardware and software. |
Doctoral or professional degree |
|
Computer Programmers |
Create, modify, and test the code, forms, and script that allow computer applications to run. Work from specifications drawn up by software developers or other individuals. May assist software developers by analyzing user needs and designing software solutions. May develop and write computer programs to store, locate, and retrieve specific documents, data, and information. |
Bachelor's degree |
|
Computer User Support Specialists |
Provide technical assistance to computer users. Answer questions or resolve computer problems for clients in person, or via telephone or electronically. May provide assistance concerning the use of computer hardware and software, including printing, installation, word processing, electronic mail, and operating systems. |
Some college, no degree |
|
Computer Network Support Specialists |
Analyze, test, troubleshoot, and evaluate existing network systems, such as local area network (LAN), wide area network (WAN), and Internet systems or a segment of a network system. Perform network maintenance to ensure networks operate correctly with minimal interruption. |
Associate's degree |
|
Computer Systems Analysts |
Analyze science, engineering, business, and other data processing problems to implement and improve computer systems. Analyze user requirements, procedures, and problems to automate or improve existing systems and review computer system capabilities, workflow, and scheduling limitations. May analyze or recommend commercially available software. |
Bachelor's degree |
|
Database Administrators |
Administer, test, and implement computer databases, applying knowledge of database management systems. Coordinate changes to computer databases. May plan, coordinate, and implement security measures to safeguard computer databases. |
Bachelor's degree |
|
Information Security Analysts |
Plan, implement, upgrade, or monitor security measures for the protection of computer networks and information. May ensure appropriate security controls are in place that will safeguard digital files and vital electronic infrastructure. May respond to computer security breaches and viruses. |
Bachelor's degree |
|
Web Developers |
Design, create, and modify websites. Analyze user needs to implement website content, graphics, performance, and capacity. May integrate Web sites with other computer applications. May convert written, graphic, audio, and video components to compatible Web formats by using software designed to facilitate the creation of Web and multimedia content. |
Associate's degree |
|
Computer Network Architects |
Design and implement computer and information networks, such as local area networks (LAN), wide area networks (WAN), intranets, extranets, and other data communications networks. Perform network modeling, analysis, and planning. May also design network and computer security measures. May research and recommend network and data communications hardware and software. |
Bachelor's degree |
|
Network and Computer Systems Administrators |
Install, configure, and support an organization's local area network (LAN), wide area network (WAN), and Internet systems or a segment of a network system. Monitor network to ensure network availability to all system users and may perform necessary maintenance to support network availability. May monitor and test website performance to ensure Web sites operate correctly and without interruption. May assist in network modeling, analysis, planning, and coordination between network and data communications hardware and software. May supervise computer user support specialists and computer network support specialists. May administer network security measures. |
Bachelor's degree |
|
Software Developers, Applications |
Develop, create, and modify general computer applications software or specialized utility programs. Analyze user needs and develop software solutions. Design software or customize software for client use with the aim of optimizing operational efficiency. May analyze and design databases within an application area, working individually or coordinating database development as part of a team. May supervise computer programmers. |
Bachelor's degree |
|
Software Developers, Systems Software |
Research, design, develop, and test operating systems-level software, compilers, and network distribution software for medical, industrial, military, communications, aerospace, business, scientific, and general computing applications. Set operational specifications and formulate and analyze software requirements. May design embedded systems software. Apply principles and techniques of computer science, engineering, and mathematical analysis. |
Bachelor's degree |
|
Computer Occupations, All Other |
All computer occupations not listed separately. Excludes Computer and Information Systems Managers; Computer Hardware Engineers; Electrical and Electronics Engineers; Computer Science Teachers, Postsecondary; Multimedia Artists and Animators; Graphic Designers; Computer Operators; and Computer, Automated Teller, and Office Machine Repairs. |
Bachelor's degree |
|
Mathematical Occupations |
||
|
Actuaries |
Analyze statistical data, such as mortality, accident, sickness, disability, and retirement rates and construct probability tables to forecast risk and liability for payment of future benefits. May ascertain insurance rates required and cash reserves necessary to ensure payment of future benefits. |
Bachelor's degree |
|
Mathematicians |
Conduct research in fundamental mathematics or in application of mathematical techniques to science, management, and other fields. Solve problems in various fields using mathematical methods. |
Master's degree |
|
Operations Research Analysts |
Formulate and apply mathematical modeling and other optimizing methods to develop and interpret information that assists management with decision making, policy formulation, or other managerial functions. May collect and analyze data and develop decision support software, service, or products. May develop and supply optimal time, cost, or logistics networks for program evaluation, review, or implementation. |
Bachelor's degree |
|
Statisticians |
Develop or apply mathematical or statistical theory and methods to collect, organize, interpret, and summarize numerical data to provide usable information. May specialize in fields such as bio-statistics, agricultural statistics, business statistics, or economic statistics. Includes mathematical and survey statisticians. |
Master's degree |
|
Mathematical Science Occupations, All Other |
All mathematical scientists not listed separately. |
Bachelor's degree |
|
Engineers |
||
|
Aerospace Engineers |
Perform engineering duties in designing, constructing, and testing aircraft, missiles, and spacecraft. May conduct basic and applied research to evaluate adaptability of materials and equipment to aircraft design and manufacture. May recommend improvements in testing equipment and techniques. |
Bachelor's degree |
|
Agricultural Engineers |
Apply knowledge of engineering technology and biological science to agricultural problems concerned with power and machinery, electrification, structures, soil and water conservation, and processing of agricultural products. |
Bachelor's degree |
|
Biomedical Engineers |
Apply knowledge of engineering, biology, and biomechanical principles to the design, development, and evaluation of biological and health systems and products, such as artificial organs, prostheses, instrumentation, medical information systems, and heath management and care delivery systems. |
Bachelor's degree |
|
Chemical Engineers |
Design chemical plant equipment and devise processes for manufacturing chemicals and products, such as gasoline, synthetic rubber, plastics, detergents, cement, paper, and pulp, by applying principles and technology of chemistry, physics, and engineering. |
Bachelor's degree |
|
Civil Engineers |
Perform engineering duties in planning, designing, and overseeing construction and maintenance of building structures, and facilities, such as roads, railroads, airports, bridges, harbors, channels, dams, irrigation projects, pipelines, power plants, and water and sewage systems. Includes architectural, structural, traffic, ocean, and geo-technical engineers. |
Bachelor's degree |
|
Computer Hardware Engineers |
Research, design, develop, or test computer or computer-related equipment for commercial, industrial, military, or scientific use. May supervise the manufacturing and installation of computer or computer-related equipment and components. |
Bachelor's degree |
|
Electrical Engineers |
Research, design, develop, test, or supervise the manufacturing and installation of electrical equipment, components, or systems for commercial, industrial, military, or scientific use. |
Bachelor's degree |
|
Electronics Engineers, Except Computers |
Research, design, develop, or test electronic components and systems for commercial, industrial, military, or scientific use employing knowledge of electronic theory and materials properties. Design electronic circuits and components for use in fields such as telecommunications, aerospace guidance and propulsion control, acoustics, or instruments and controls. |
Bachelor's degree |
|
Environmental Engineers |
Research, design, plan, or perform engineering duties in the prevention, control, and remediation of environmental hazards using various engineering disciplines. Work may include waste treatment, site remediation, or pollution control technology. |
Bachelor's degree |
|
Health and Safety Engineers, except Mining Safety Engineers and Inspectors |
Promote worksite or product safety by applying knowledge of industrial processes, mechanics, chemistry, psychology, and industrial health and safety laws. Includes industrial product safety engineers. |
Bachelor's degree |
|
Industrial Engineers |
Design, develop, test, and evaluate integrated systems for managing industrial production processes, including human work factors, quality control, inventory control, logistics and material flow, cost analysis, and production coordination. |
Bachelor's degree |
|
Marine Engineers and Naval Architects |
Design, develop, and evaluate the operation of marine vessels, ship machinery, and related equipment, such as power supply and propulsion systems. |
Bachelor's degree |
|
Materials Engineers |
Evaluate materials and develop machinery and processes to manufacture materials for use in products that must meet specialized design and performance specifications. Develop new uses for known materials. Includes those engineers working with composite materials or specializing in one type of material, such as graphite, metal and metal alloys, ceramics and glass, plastics and polymers, and naturally occurring materials. Includes metallurgists and metallurgical engineers, ceramic engineers, and welding engineers. |
Bachelor's degree |
|
Mechanical Engineers |
Perform engineering duties in planning and designing tools, engines, machines, and other mechanically functioning equipment. Oversee installation, operation, maintenance, and repair of equipment such as centralized heat, gas, water, and steam systems. |
Bachelor's degree |
|
Mining and Geological Engineers |
Conduct sub-surface surveys to identify the characteristics of potential land or mining development sites. May specify the ground support systems, processes and equipment for safe, economical, and environmentally sound extraction or underground construction activities. May inspect areas for unsafe geological conditions, equipment, and working conditions. May design, implement, and coordinate mine safety programs. |
Bachelor's degree |
|
Nuclear Engineers |
Conduct research on nuclear engineering projects or apply principles and theory of nuclear science to problems concerned with release, control, and use of nuclear energy and nuclear waste disposal. |
Bachelor's degree |
|
Petroleum Engineers |
Devise methods to improve oil and gas extraction and production and determine the need for new or modified tool designs. Oversee drilling and offer technical advice. |
Bachelor's degree |
|
Engineers, All Other |
All engineers not listed separately. |
Bachelor's degree |
|
Life Scientists |
||
|
Animal Scientists |
Conduct research in the genetics, nutrition, reproduction, growth, and development of domestic farm animals. |
Doctoral or professional degree |
|
Food Scientists and Technologists |
Use chemistry, microbiology, engineering, and other sciences to study the principles underlying the processing and deterioration of foods; analyze food content to determine levels of vitamins, fat, sugar, and protein; discover new food sources; research ways to make processed foods safe, palatable, and healthful; and apply food science knowledge to determine best ways to process, package, preserve, store, and distribute food. |
Bachelor's degree |
|
Soil and Plant Scientists |
Conduct research in breeding, physiology, production, yield, and management of crops and agricultural plants or trees, shrubs, and nursery stock, their growth in soils, and control of pests; or study the chemical, physical, biological, and mineralogical composition of soils as they relate to plant or crop growth. May classify and map soils and investigate effects of alternative practices on soil and crop productivity. |
Bachelor's degree |
|
Biochemists and Biophysicists |
Study the chemical composition or physical principles of living cells and organisms, their electrical and mechanical energy, and related phenomena. May conduct research to further understanding of the complex chemical combinations and reactions involved in metabolism, reproduction, growth, and heredity. May determine the effects of foods, drugs, serums, hormones, and other substances on tissues and vital processes of living organisms. |
Doctoral or professional degree |
|
Microbiologists |
Investigate the growth, structure, development, and other characteristics of microscopic organisms, such as bacteria, algae, or fungi. Includes medical microbiologists who study the relationship between organisms and disease or the effects of antibiotics on microorganisms. |
Bachelor's degree |
|
Zoologists and Wildlife Biologists |
Study the origins, behavior, diseases, genetics, and life processes of animals and wildlife. May specialize in wildlife research and management. May collect and analyze biological data to determine the environmental effects of present and potential use of land and water habitats. |
Bachelor's degree |
|
Biological Scientists, All Other |
All biological scientists not listed separately. |
Bachelor's degree |
|
Conservation Scientists |
Manage, improve, and protect natural resources to maximize their use without damaging the environment. May conduct soil surveys and develop plans to eliminate soil erosion or to protect rangelands. May instruct farmers, agricultural production managers, or ranchers in best ways to use crop rotation, contour plowing, or terracing to conserve soil and water; in the number and kind of livestock and forage plants best suited to particular ranges; and in range and farm improvements, such as fencing and reservoirs for stock watering. |
Bachelor's degree |
|
Foresters |
Manage public and private forested lands for economic, recreational, and conservation purposes. May inventory the type, amount, and location of standing timber, appraise the timber's worth, negotiate the purchase, and draw up contracts for procurement. May determine how to conserve wildlife habitats, creek beds, water quality, and soil stability, and how best to comply with environmental regulations. May devise plans for planting and growing new trees, monitor trees for healthy growth, and determine optimal harvesting schedules. |
Bachelor's degree |
|
Epidemiologists |
Investigate and describe the determinants and distribution of disease, disability, or health outcomes. May develop the means for prevention and control. |
Master's degree |
|
Medical Scientists, except Epidemiologists |
Conduct research dealing with the understanding of human diseases and the improvement of human health. Engage in clinical investigation, research and development, or other related activities. Includes physicians, dentists, public health specialists, pharmacologists, and medical pathologists who primarily conduct research. |
Doctoral or professional degree |
|
Life Scientists, All Other |
All life scientists not listed separately. |
Bachelor's degree |
|
Physical Scientists |
||
|
Astronomers |
Observe, research, and interpret astronomical phenomena to increase basic knowledge or apply such information to practical problems. |
Doctoral or professional degree |
|
Physicists |
Conduct research into physical phenomena, develop theories on the basis of observation and experiments, and devise methods to apply physical laws and theories. |
Doctoral or professional degree |
|
Atmospheric and Space Scientists |
Investigate atmospheric phenomena and interpret meteorological data, gathered by surface and air stations, satellites, and radar to prepare reports and forecasts for public and other uses. Includes weather analysts and forecasters whose functions require the detailed knowledge of meteorology. |
Bachelor's degree |
|
Chemists |
Conduct qualitative and quantitative chemical analyses or experiments in laboratories for quality or process control or to develop new products or knowledge. |
Bachelor's degree |
|
Materials Scientists |
Research and study the structures and chemical properties of various natural and synthetic or composite materials, including metals, alloys, rubber, ceramics, semiconductors, polymers, and glass. Determine ways to strengthen or combine materials or develop new materials with new or specific properties for use in a variety of products and applications. Includes glass scientists, ceramic scientists, metallurgical scientists, and polymer scientists. |
Bachelor's degree |
|
Environmental Scientists and Specialists, including Health |
Conduct research or perform investigation for the purpose of identifying, abating, or eliminating sources of pollutants or hazards that affect either the environment or the health of the population. Using knowledge of various scientific disciplines, may collect, synthesize, study, report, and recommend action based on data derived from measurements or observations of air, food, soil, water, and other sources. |
Bachelor's degree |
|
Geoscientists, except Hydrologists and Geographers |
Study the composition, structure, and other physical aspects of the Earth. May use geological, physics, and mathematics knowledge in exploration for oil, gas, minerals, or underground water; or in waste disposal, land reclamation, or other environmental problems. May study the Earth's internal composition, atmospheres, oceans, and its magnetic, electrical, and gravitational forces. Includes mineralogists, crystallographers, paleontologists, stratigraphers, geodesists, and seismologists. |
Bachelor's degree |
|
Hydrologists |
Research the distribution, circulation, and physical properties of underground and surface waters; and study the form and intensity of precipitation, its rate of infiltration into the soil, movement through the earth, and its return to the ocean and atmosphere. |
Master's degree |
|
Physical Scientists, All Other |
All physical scientists not listed separately. |
Bachelor's degree |
|
S&E Managers |
||
|
Architectural and Engineering Managers |
Plan, direct, or coordinate activities in such fields as architecture and engineering or research and development in these fields. |
Bachelor's degree |
|
Computer and Information Systems Managers |
Plan, direct, or coordinate activities in such fields as electronic data processing, information systems, systems analysis, and computer programming. |
Bachelor's degree |
|
Natural Sciences Managers |
Plan, direct, or coordinate activities in such fields as life sciences, physical sciences, mathematics, statistics, and research and development in these fields. |
Bachelor's degree |
Source: Occupational Employment Statistics, Bureau of Labor Statistics, U.S. Department of Labor, http://www.bls.gov/oes/current/oes_stru.htm; Employment Projections, BLS, U.S. Department of Labor, http://data.bls.gov/projections/occupationProj; Standard Occupational Classification, BLS, U.S. Department of Labor, https://www.bls.gov/soc/home.htm.
Appendix B. Composition of S&E Occupations by Education Level
Together with its biannual employment projections, BLS publishes data on the educational composition of occupations. BLS uses data collected as part of the American Community Survey (ACS) for this purpose. The ACS uses a compressed version of the Standard Occupational Classification (SOC) system that includes multiple SOC codes under a single ACS code. A crosswalk of SOC codes to ACS codes is provided at the end of this appendix.
The occupational composition of each of the ACS occupational classifications corresponding to the SOC codes for S&E occupations used in this report is illustrated below in chart form. For these charts, CRS has aggregated educational levels below the associate's degrees into a category called "Less than an Associate's degree." This category includes "less than high school diploma," "high school diploma or equivalent," and "some college, no degree."

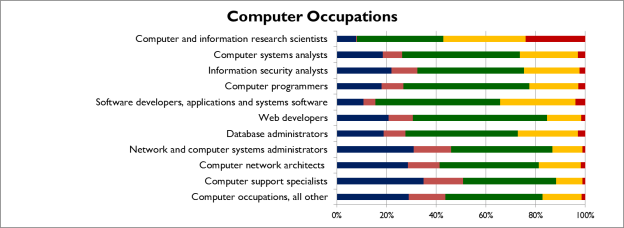

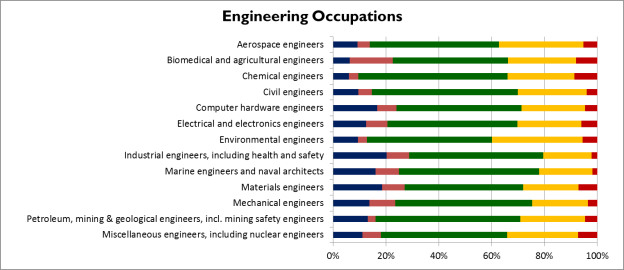


|
American Community Survey |
Standard Occupation Classification(s) |
|
Computer and information systems managers |
Computer and information systems managers |
|
Architectural and engineering managers |
Architectural and engineering managers |
|
Natural sciences managers |
Natural sciences managers |
|
Computer and information research scientists |
Computer and information research scientists |
|
Computer systems analysts |
Computer systems analysts |
|
Information security analysts |
Information security analysts |
|
Computer programmers |
Computer programmers |
|
Software developers, applications & systems software |
Includes: Software developers, applications Software developers, systems software |
|
Web developers |
Web developers |
|
Database administrators |
Database administrators |
|
Network and computer systems administrators |
Network and computer systems administrators |
|
Computer network architects |
Computer network architects |
|
Computer support specialists |
Includes: Computer user support specialists Computer network support specialists |
|
Computer occupations, all other |
Computer occupations, all other |
|
Actuaries |
Actuaries |
|
Miscellaneous mathematical science occupations, including mathematicians and statisticians |
Includes: Mathematicians Statisticians; and mathematical science occupations, all other |
|
Operations research analysts |
Operations research analysts |
|
Aerospace engineers |
Aerospace engineers |
|
Biomedical and agricultural engineers |
Includes: Agricultural engineers Biomedical engineers |
|
Chemical engineers |
Chemical engineers |
|
Civil engineers |
Civil engineers |
|
Computer hardware engineers |
Computer hardware engineers |
|
Electrical and electronics engineers |
Includes: Electrical engineers Electronics engineers, except computer |
|
Environmental engineers |
Environmental engineers |
|
Industrial engineers, including health and safety |
Includes: Industrial engineers Health and safety engineers, except mining safety engineers and inspectors |
|
Marine engineers and naval architects |
Marine engineers and naval architects |
|
Materials engineers |
Materials engineers |
|
Mechanical engineers |
Mechanical engineers |
|
Petroleum, mining and geological engineers, including mining safety engineers |
Includes: Petroleum engineers Mining and geological engineers, incl. mining safety engineers |
|
Miscellaneous engineers, including nuclear engineers |
Includes: Nuclear engineers Engineers, all other |
|
Agricultural and food scientists |
Includes: Animal scientists Food scientists and technologists Soil and plant scientists |
|
Biological scientists |
Includes: Biochemists and biophysicists Microbiologists Zoologists and wildlife biologists Biological scientists, all other |
|
Conservation scientists and foresters |
Includes: Conservation scientists Foresters |
|
Medical scientists, and life scientists, all other |
Includes: Epidemiologists Medical scientists, except epidemiologists Life scientists, all other |
|
Astronomers and physicists |
Includes: Astronomers Physicists |
|
Atmospheric and space scientists |
Atmospheric and space scientists |
|
Chemists and materials scientists |
Includes: Chemists Materials scientists |
|
Environmental scientists and geoscientists |
Includes: Environmental scientists and specialists, including health Geoscientists, except hydrologists and geographers Hydrologists |
|
Physical scientists, all other |
Physical scientists, all other |
Author Contact Information
Footnotes
| 1. |
For additional information, see CRS Report R42530, Immigration of Foreign Nationals with Science, Technology, Engineering, and Mathematics (STEM) Degrees, by Ruth Ellen Wasem, and CRS Report R43735, Temporary Professional, Managerial, and Skilled Foreign Workers: Policy and Trends, by Carla N. Argueta. |
| 2. |
See, for example, Carolyn M. Veneri, "Can Occupational Labor Shortages Be Identified Using Available Data?," Monthly Labor Review, March 1999, p. 18. |
| 3. |
For purposes of the BLS analysis, the authors defined the STEM occupation group as consisting of 97 occupations, including computer and math sciences, architecture and engineering, life and physical sciences, managerial and postsecondary teaching occupations associated with these functional areas, and two sales occupations that require scientific or technical education at the postsecondary level—sales engineers and wholesale and engineering manufacturing sales representatives of technical and scientific products. Ben Cover, John Jones, and Audrey Watson, "Science, Technology, Engineering, and Mathematics (STEM) Occupations: A Visual Essay," Monthly Labor Review, May 2011, p. 3. |
| 4. |
National Science Board, Science and Engineering Indicators 2016, January 2016, pp. 3-5, 3-14. |
| 5. |
CRS analysis of May 2016 Occupational Employment Statistics data produced by the Department of Labor Bureau of Labor Statistics, available at https://www.bls.gov/oes/tables.htm. |
| 6. |
The Standard Occupational Classification system is a federal system that defines over 840 detailed occupations, and groups them into 461 broad occupations, 97 minor groups, and 23 major groups. Detailed occupations in the SOC with similar job duties, and in some cases skills, education, and/or training, are grouped together. The system is used by federal statistical agencies for the purpose of collecting, calculating, and disseminating data. First established in 1977, the SOC system has been revised periodically; the latest revision is the 2010 SOC. |
| 7. |
Occupational Employment Statistics (OES) employment figures for the occupation group "architectural and engineering managers" are reported as a single number, thus the architectural managers are included in this group, though data on architect and other architectural-related occupations are not otherwise included in this report. |
| 8. |
Occupational Employment Statistics, Bureau of Labor Statistics, U.S. Department of Labor, http://www.bls.gov/oes. |
| 9. |
Current Population Survey, Bureau of Labor Statistics, U.S. Department of Labor, http://www.bls.gov/cps. |
| 10. |
Employment Projections, Bureau of Labor Statistics, U.S. Department of Labor, http://www.bls.gov/emp. |
| 11. |
The Current Employment Statistics survey provides industry employment data used by BLS in making its biennial 10-year projections. The CES survey does not collect occupational information. |
| 12. |
Telephone conversation with Michael Wolf, economist, Division of Occupational Outlook, Office of Occupational Statistics and Employment Projections, Bureau of Labor Statistics, Department of Labor, March 4, 2013. |
| 13. |
BLS website, Occupational Employment Statistics, Frequently Asked Questions, http://www.bls.gov/oes/oes_ques.htm. |
| 14. |
BLS website, Employment Projections, Projections Methodology, https://www.bls.gov/emp/ep_projections_methods.htm. |
| 15. |
BLS website, Employment Projections Occupational Separations and Openings, https://www.bls.gov/emp/ep_separations.htm. For further discussion see, BLS website, Estimating Occupational Replacement Needs, https://www.bls.gov/emp/ep_replacements.htm. |
| 16. |
For links to past evaluations of BLS projections, see http://www.bls.gov/emp/ep_pub_projections_eval.htm. For the latest evaluation, see "Evaluation of BLS employment, labor force and macroeconomic projections to 2006, 2008, and 2010," by Kathryn J. Byun, Richard Henderson, and Mitra Toossi, Monthly Labor Review, November 2015, https://www.bls.gov/opub/mlr/2015/article/evaluation-of-bls-employment-labor-force-and-macroeconomic-projections-1.htm. |
| 17. |
The occupational classification system used in the Current Population Survey is based on the 2010 Standard Occupational Classification System but differs somewhat from those used in the Occupational Employment Statistics survey. CPS does not publish unemployment rates for occupations with an employment base of less than 50,000. |
| 18. |
A compound annual growth rate (CAGR) is a calculated growth rate which, if applied year after year to a beginning amount reaches a specified final amount. |
| 19. |
CRS analysis of BLS 2016-2026 employment projections, https://www.bls.gov/emp/#data. |
| 20. |
For the 2016-2026 projections, BLS used a new methodology; previously, BLS calculated "net replacement needs" to calculate the number of people needed to fill occupational positions due to retirements, deaths, change of occupations, and other reasons. In its place, BLS provided data for what it terms "occupational separations" in two categories: labor force exits and occupational transfers. Notably the occupational separations rates are generally significantly higher than earlier replacement rates. In some occupations, the number of occupational separations during the 2016-2026 period exceeds the number employed in 2016. According to BLS, "The occupational separations method was first used with the 2016–26 projections. Before then, BLS used a cohort-component method for estimating job openings due to replacement needs from the 1991 through the 2014–24 projections. This method is no longer in use because BLS identified statistical and conceptual issues with the implementation of this method that compromised the accuracy and validity of the resulting estimates. BLS began developing the separations method in 2011 and only adopted it after a lengthy development process, including considerable outreach to users, including a notice of solicitation of comments in the Federal Register." |
| 21. |
CRS telephone conversation with BLS, November 1, 2017. |
| 22. |
See, for example, National Research Council, Rising Above the Gathering Storm: Energizing and Employing America for a Brighter Economic Future, 2007, http://www.nap.edu/catalog.php?record_id=11463; U.S. Department of Energy, Secretary Chu, Intel President Discuss Need for More U.S. Engineers, September 1, 2011, http://energy.gov/articles/secretary-chu-intel-president-discuss-need-more-us-engineers; Shirley Ann Jackson, President, Rensselaer Polytechnic Institute, The Quite Crisis: Falling Short in Producing American Scientific and Technical Talent, Building Engineering and Science Talent (BEST), 2002; and Vinton G. Cerf, "How to Fire Up U.S. Innovation," Wall Street Journal, April 12, 2011, http://online.wsj.com/article/SB10001424052748704461304576216911954533514.html; and Rodney C. Atkins, Senior Vice President, Systems and Technology Group, IBM, "America Desperately Needs More STEM Students. Here's How to Get Them," Forbes, July 9, 2012, http://www.forbes.com/sites/forbesleadershipforum/2012/07/09/america-desperately-needs-more-stem-students-heres-how-to-get-them. |
| 23. |
See, for example, testimony of Ralph Gomory, President, Alfred P. Sloan Foundation, before the U.S. Congress, House Committee on Science and Technology, The Globalization of R&D and Innovation, Part I, 110th Cong., June 12, 2007 (Washington: GPO, 2008); testimony of Michael Teitelbaum, Vice President, Alfred P. Sloan Foundation and Harold Salzman, Senior Research Associate, The Urban Institute, before the U.S. Congress, House Committee on Science and Technology, The Globalization of R&D and Innovation, Part IV, 110th Cong., November 6, 2007 (Washington: GPO, 2008); Robert J. Samuelson, "Sputnik Scare, Updated" Washington Post, August 26, 2005, p. A27, http://www.washingtonpost.com/wp-dyn/content/article/2005/05/25/AR2005052501812.html; and Michael Teitelbaum, "The U.S. Science and Engineering Workforce: An Unconventional Portrait," Pan-Organizational Summit on the U.S. Science and Engineering Workforce, Government-Industry-University Research Roundtable, National Research Council, 2003, pp. 1-7, http://www.nap.edu/catalog.php?record_id=10727. |
| 24. |
See, for example, U.S. Congress Joint Economic Committee, Chairman's Staff, STEM Education: Preparing for the Jobs of the Future, April 2012, http://www.jec.senate.gov/public/index.cfm?a=Files.Serve&File_id=6aaa7e1f-9586-47be-82e7-326f47658320. |
| 25. |
See, for example, Vern Ehlers, before the U.S. Congress, House Committee on Science and Technology, The Globalization of R&D and Innovation, Part IV, 110th Cong., November 6, 2007 (Washington: GPO, 2008). |
| 26. |
See, for example, Leonard Lynn, Case Western Reserve University, and Hal Salzman, Rutgers University, "Dynamics of Engineering Labor Markets: Petroleum Engineering and Responsive Supply," presentation at "U.S. Engineering in the Global Economy," sponsored by the Alfred P. Sloan Foundation, Cambridge, MA, September 26, 2011, https://rucore.libraries.rutgers.edu/rutgers-lib/45742/. |
| 27. |
See, for example, Office of Technology Assessment, Demographic Trends and the Scientific and Engineering Workforce, OTA-TM-SET-35, December 1985, http://www.princeton.edu/~ota/disk2/1985/8507/8507.PDF. |
| 28. |
See, for example, Richard B. Freeman, Is a Great Labor Shortage Coming? Replacement Demand in the Global Economy, National Bureau of Economic Research, Working Paper 12541, Cambridge, MA, September 2006, http://www.nber.org/papers/w12541. |
| 29. |
See, for example, Richard B. Freeman, Does Globalization of the Scientific/Engineering Workforce Threaten U.S. Economic Leadership?, National Bureau of Economic Research, Working Paper 11457, Cambridge, MA, June 2005, http://www.nber.org/papers/w11457.pdf. |
| 30. |
See, for example, National Research Council, Rising Above the Gathering Storm: Energizing and Employing America for a Brighter Economic Future, 2007. |
| 31. |
See, for example, various writings of Norm Matloff, Professor of Computer Science, University of California at Davis, http://heather.cs.ucdavis.edu/matloff.html. |
| 32. |
See, for example, Tom Kucharvy, Solutions to STEM Skills Mismatch, Beyond IT, February 25, 2012, http://beyond-it-inc.com/GKEblog/solutions-to-stem-skills-mismatch.html; and "Statistic of the Month: Investigating the Skills Mismatch," Center on International Education Benchmarking, July 31, 2012, http://www.ncee.org/2012/07/statistic-of-the-month-investigating-the-skills-mismatch. |
| 33. |
See, for example, Vivek Wadhwa, Anna Lee Saxenian, Richard Freeman, and Alex Salever, Losing the World's Best and Brightest: America's New Immigrant Entrepreneurs, Ewing Marion Kauffman Foundation, March 2009, http://www.kauffman.org/what-we-do/research/immigration-and-the-american-economy/losing-the-worlds-best-and-brightest-americas-new-immigrant-entrepreneurs-part-v; The White House, "Fact Sheet: Fixing Our Broken Immigration System So Everyone Plays by the Rules," press release, January 29, 2013, http://www.whitehouse.gov/the-press-office/2013/01/29/fact-sheet-fixing-our-broken-immigration-system-so-everyone-plays-rules; and Robert D. Atkinson, Eight Ideas for Improving the America COMPETES Act, Information Technology and Innovation Foundation, March 2010, http://www.itif.org/files/2010-america-competes.pdf. |
| 34. |
See, for example, Ross Eisenbrey, Vice President, Economic Policy Institute, "Op-Ed: America's Genius Glut," New York Times, February 7, 2013; Remarks of Brian Keane, Founder and CEO, Ameritas Technologies, and Neeraj Gupta, Founder and CEO, Systems in Motion, at Senate briefing on "Understanding the Impact of the H-1B Program: On the Economy, Employers and Workers," March 14, 2013, http://www.epi.org/files/2013/Keane_H-1B_briefing_14_March_2013.pdf; and Stan Sorscher, Labor Representative, Society of Professional Engineering Employees in Aerospace, Flooding the STEM Labor Market, March 3, 2013, http://www.ifpte.org/downloads/issues/2013-3-3%20Flooding%20the%20STEM%20labor%20market.pdf. |
| 35. |
U.S. Department of Education, "Secretary Arne Duncan's Remarks at OECD's Release of the Program for International Student Assessment (PISA) 2009 Results," press release, December 7, 2010, http://www.ed.gov/news/speeches/secretary-arne-duncans-remarks-oecds-release-program-international-student-assessment; Paul E. Peterson, Ludger Woessmann, Eric A. Hanushek, and Carlos X. Lastra-Anadon, Globally Challenged: Are U.S. Students Ready to Compete, Harvard Kennedy School, Harvard University, PEPG Report No. 11-03, August 2011, http://www.hks.harvard.edu/pepg/PDF/Papers/PEPG11-03_GloballyChallenged.pdf; and Brandon Wright, "What do International Tests Really Show About U.S. Student Performance," Thomas B. Fordham Institute, January 24, 2013, http://www.edexcellence.net/commentary/education-gadfly-weekly/2013/january-24/what-do-international-tests-really-show-about-us-performance.html. |
| 36. |
Martin Carnoy and Richard Rothstein, What Do International Tests Really Show About U.S. Student Performance, Economic Policy Institute, January 15, 2013, http://www.epi.org/publication/us-student-performance-testing. |