Background and Issues for Congress
Over the past two years, Congress has demonstrated significant interest in U.S. and international trade trends as part of its efforts to examine U.S. trade policy and key U.S. trading relationships. Congress's role in trade policy stems from a number of overlapping responsibilities, including its constitutional authority over regulating commerce with foreign countries and broad oversight responsibility over the performance of the economy. In some areas, particularly in negotiating trade agreements, Congress has opted to delegate certain authorities to the President. Interest in bilateral trade flows and balances has been heightened as the Trump Administration renegotiates existing U.S. free trade agreements (FTAs) and pursues news ones, and takes a more forceful stance to reduce U.S. bilateral trade deficits, enforce U.S. trade laws and agreements, and promote what it considers to be "free," "fair," and "reciprocal" trade.
Members of Congress have long recognized that international trade is an important engine not only of the U.S. economy, but also of the global economy.1 Total trade (exports plus imports) as a share of global gross domestic product (GDP) has risen from 25% in 1960 to 56% in 2017. Greater openness to trade and reforms worldwide have been linked to higher growth in productivity and real incomes, as well as to reduced poverty.2 For decades since World War II, annual real global trade growth outpaced GDP growth, growing on average 1.5 times faster. This trend has not held in recent years as the global economy recovered from the global financial and economic crisis. Growth in the volume of world merchandise trade slowed to 2.0% in 2016—the slowest pace of growth since 2009. Trade growth has seen some rebound, increasing to 5.4% in 2017—the strongest growth rate since 2011, driven mainly by cyclical factors, particularly increased investment and consumption expenditure.3
U.S. world trade has grown steadily over the past decade. In 2017, the United States exported $2.4 trillion in goods and services and imported $2.9 trillion.4 Since 2009, when trade flows declined sharply in the midst of the financial crisis, U.S. exports have grown 48.5%, while U.S. imports have grown 47.6% in nominal terms. More broadly, since 1960, trade relative to GDP has risen markedly. U.S. exports as a share of GDP expanded from 5% in 1960 to over 12% of GDP in 2017, while U.S. imports expanded from 4% to over 15% of GDP (Figure 1 and Figure 2).
|
Figure 1. U.S. Share of Exports in GDP (as a percentage of GDP) |
 |
|
Source: CRS calculations with data from the U.S. Department of Commerce, Bureau of Economic Analysis. |
|
Figure 2. U.S. Share of Imports in GDP (as a percentage of GDP) |
 |
|
Source: CRS calculations with data from the U.S. Department of Commerce, Bureau of Economic Analysis. |
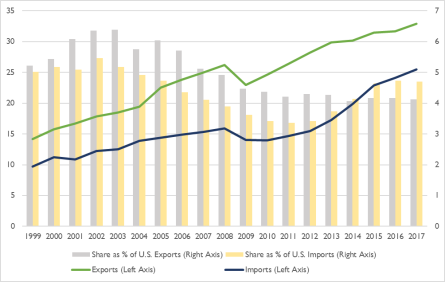
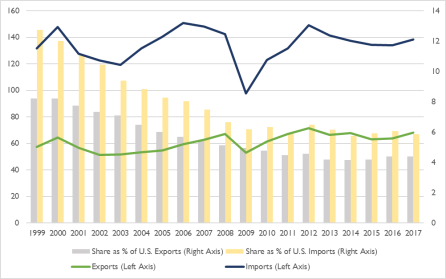
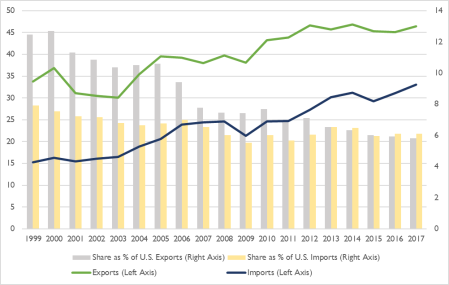
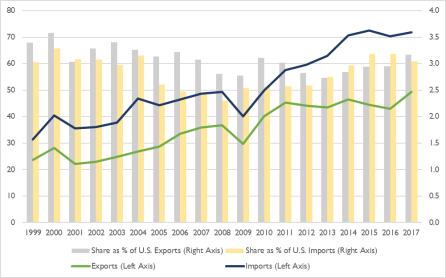
According to data from the U.S. Department of Commerce's Bureau of Economic Analysis, China was the top U.S. trading partner in 2017, with $711.7 billion in total goods and services trade, followed by Canada ($679.9 billion), Mexico ($622.1 billion), Japan ($286.1 billion), and Germany ($239.8 billion). China was the largest source of U.S. imports, while Canada was the largest destination for U.S. exports. However, considering the 28 member states of the European Union (EU) as a single trading partner, the EU is both the largest U.S. export destination ($528.2 billion) and the largest source of U.S. imports ($629.4 billion).5 The majority of U.S. global trade—approximately 65%—is with countries with which the United States does not have a free trade agreement (FTA).6 Moreover, while most of the United States' largest trading partners remain advanced economies, U.S. trade with emerging market and developing economies—although comparatively low—accounts for a growing share of total U.S. trade (Figure 3 and Figure 4).
The changes in U.S. trade patterns pose both opportunities and challenges for U.S. international trade relations. These developments have intensified congressional interest in U.S. trade policy and heightened its demand for information and comparative analysis of bilateral U.S. trade flows. In the coming months, Congress may face issues such as shaping U.S. trade policy to reflect this changing composition of trade; enhancing the competitive position of U.S. firms, workers, and industries; promoting access to new foreign market opportunities for U.S. businesses; and addressing tensions, trade barriers, and issues raised by the growing role of emerging economies in the global economy.
In addition, questions affecting U.S. trade trends could also arise as the Trump Administration renegotiates FTAs and pursues new ones, and Congress debates and ratifies them. Congress is expected to closely monitor negotiations on other trade agreements and on developments at the World Trade Organization (WTO). The economic position of the United States is also an important factor to consider. The agreements and negotiations raise several important policy questions: Do the agreements and the ongoing negotiations serve U.S. interests? Is the Administration fulfilling its obligations under Trade Promotion Authority (TPA)? Are bilateral and regional FTAs and negotiations, on the one hand, and the U.S. multilateral agenda at the WTO, on the other hand, mutually supportive or in conflict? In deciding whether to approve new bilateral FTAs, or debate more generally on U.S. trade policy, Members of Congress may weigh potential costs and benefits to their constituents and to the U.S. economy as a whole.
This report provides a summary of the main economic developments in the trade activities of the United States with its major trading partners in 2017—the most recent year for which yearly U.S. trade data are available. It is intended primarily as a reference, and it focuses on what has happened with U.S. bilateral trade relations in recent years—not why or what the changes imply. The main objective of this report is to present the current data and statistics in a way that is accessible and understandable to help inform policy discussions. It is important to note that the growth in global production chains, intrafirm trade, and trade in intermediate goods means that traditional accounting methods may distort trade data and not fully reflect the source of resources that are used in producing goods and services (see "Limitations of Trade Data"). This makes it increasingly difficult to understand and interpret the implications of trade data for the U.S. economy. (A comprehensive overview of recent trends and developments in U.S. trade is provided in CRS Report R45420, U.S. Trade Trends and Developments, by Andres B. Schwarzenberg.)
Sources
This report relies heavily on resources from the U.S. Department of Commerce's Bureau of Economic Analysis and Census Bureau, and from the U.S. International Trade Commission (ITC)—the main sources of U.S. trade data—for information and statistics presented throughout the report. It is also based on primary and secondary source materials, including publications and news releases by the ITC, the Office of the U.S. Trade Representative (USTR), the International Monetary Fund (IMF), the World Bank, and the World Trade Organization (WTO). Much of the trade data used in the report are revised throughout the year.
Limitations of Trade Data
The growth in global production chains, intrafirm trade, and trade in intermediate goods means that traditional accounting methods may distort trade data and not fully reflect the source of resources that are used in producing goods and services. This makes it increasingly difficult to understand and interpret the implications of trade data for the U.S. economy. Thus, it is important to note that the conventional trade data that may drive policy discussions, and that are used throughout this report, may underestimate trade in services, as the data are not measured on a value-added basis and do not attribute any portion of the traded value of manufactured and agricultural products to services inputs. Intermediate services embedded within a value chain as inputs include not only transportation and distribution to help move goods along, but also R&D, design and engineering, and business services.
China is a good example of this phenomenon. Since initiating economic reforms in 1979 and opening up its economy to global trade and investment, China has emerged as a major center for global supply chains. Because of China's large pool of low-cost labor, many export-oriented multinational corporations have moved production from other countries (primarily in Asia) to China. In many cases, products that are "made in China" are actually products that are "assembled in China," using imported inputs (such as components) that are designed and produced globally. Currently, the value added that occurs in China is often quite small relative to the total value of the finished product when it is imported into the United States and elsewhere, and a significant level of the profits from the sale of the product is estimated to accrue to the multinational company that owns the brand.
To illustrate, when the United States imports such products as iPhones and iPads, it attributes the full value of those imports as occurring in China, even though the value added that occurred there is quite small. Apple Inc., the U.S. firm that developed these products, is the largest beneficiary in terms of the profits generated by the sale of its products, and most of its product design, software development, product management, marketing, and other high-wage functions and employment occur in the United States. In other words, U.S. trade data may identify locations from which finished products come, but they often fail to reflect who ultimately benefits from that trade. In many instances, U.S. imports from China are really imports from many countries. Yet, the full value of the final imported product is attributed to China, which results in what one might consider to be an inflated trade deficit figure. A joint study by the OECD and the WTO estimated that the U.S trade deficit with China would have been reduced by 25% in 2009 if bilateral trade flows were measured according to the value added that occurred in each country before it was exported.7 Additionally, another study estimated that 24.7% of U.S. imports from Canada, and 39.8% of U.S. final merchandise imports from Mexico, consist of value added from the United States.8
U.S. Trade Trends: Comparative Overview9
Total Trade in Goods
U.S merchandise exports totaled $1.6 trillion in 2017, a 6.62% ($96.4 billion) increase from the 2016 level. The value of U.S. merchandise imports was $2.4 trillion over the same period, up 6.92% ($152.9 billion) from 2016. U.S. imports increased more than U.S. exports, leading to a $56.4 billion (7.52%) increase in the U.S. merchandise trade deficit to $807.5 billion in 2017.
Trade in Goods with Leading Partners
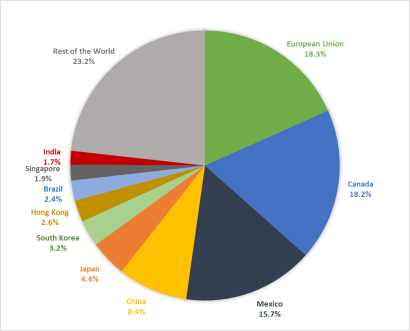
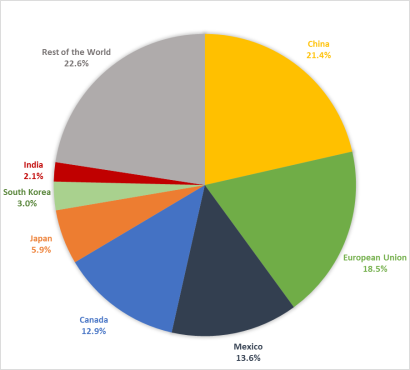
In 2017, the EU was the United States' top trading partner in terms of two-way merchandise trade, followed by China, Canada, and Mexico (Table 1). China's share in U.S. merchandise trade has increased dramatically over the past few decades, from 5.78% in 2000 to 16.27% in 2017 (Table 2). Ranked by exports, the EU was the leading market for U.S. exports, which totaled $284.8 billion (18.33% of all U.S. exports) (Figure 5). Canada was the second-largest export market ($282.9 billion worth of U.S. exports or 18.21% of all U.S. exports), followed by Mexico and China. In terms of imports, China was the leading source of U.S. imports ($506.3 billion or 21.44% of all U.S. imports), followed by the EU ($437.4 billion or 18.53% of all U.S. imports), Mexico, and Canada (Figure 6).
U.S. merchandise exports to all six top trading partners increased from 2016 to 2017. The largest increase in value was a $15.63 billion increase in U.S. exports to Canada, which totaled $282.9 billion in 2017, compared to $267.2 billion in 2016. It was followed by a $14.4 billion increase in exports to China, from $115.9 billion in 2016 to $130.4 billion in 2017. In percentage terms, the largest increase in U.S. exports in 2017 was to South Korea (14.65%), followed by China (12.45%).
U.S. merchandise imports from all six top trading partners also increased in 2017. The largest rises in value were a $43.0 billion (9.30%) increase in imports from China, a $21.9 billion (7.73%) increase in imports from Canada, and a $19.7 billion (6.55%) increase in imports from Mexico.
|
Trading Partner |
Total Trade |
Exports |
Imports |
Trade Balance |
|||||||||||||||||
|
2017 |
2017 |
% Change 2017/16 |
2017 |
% Change 2017/16 |
2017 |
% Change 2017/16 |
|||||||||||||||
|
WORLD |
|
|
|
|
|
|
|
||||||||||||||
|
European Union |
|
|
|
|
|
|
|
||||||||||||||
|
China |
|
|
|
|
|
|
|
||||||||||||||
|
Canada |
|
|
|
|
|
|
|
||||||||||||||
|
Mexico |
|
|
|
|
|
|
|
||||||||||||||
|
Japan |
|
|
|
|
|
|
|
||||||||||||||
|
Germany |
|
|
|
|
|
|
|
||||||||||||||
|
South Korea |
|
|
|
|
|
|
|
||||||||||||||
|
United Kingdom |
|
|
|
|
|
|
|
||||||||||||||
|
France |
|
|
|
|
|
|
|
||||||||||||||
|
India |
|
|
|
|
|
|
|
||||||||||||||
|
Taiwan |
|
|
|
|
|
|
|
||||||||||||||
|
Italy |
|
|
|
|
|
|
|
||||||||||||||
|
Brazil |
|
|
|
|
|
|
|
||||||||||||||
|
Singapore |
|
|
|
|
|
|
|
||||||||||||||
|
Hong Kong |
|
|
|
|
|
|
|
||||||||||||||
|
Saudi Arabia |
|
|
|
|
|
|
|
||||||||||||||
Source: CRS calculations with data from the U.S. Department of Commerce, Bureau of Economic Analysis.
Notes: Total trade, or two-way trade, is the sum of exports and imports.
Table 2. Share of U.S. Merchandise Trade with Major Trading Partners
(as a share of U.S. total trade, exports, and imports of merchandise)
|
Trading Partner |
2000 |
2017 |
||||||||||||||||
|
Total Trade |
Exports |
Imports |
Total Trade |
Exports |
Imports |
|||||||||||||
|
European Union |
|
|
|
|
|
|
||||||||||||
|
China |
|
|
|
|
|
|
||||||||||||
|
Canada |
|
|
|
|
|
|
||||||||||||
|
Mexico |
|
|
|
|
|
|
||||||||||||
|
Japan |
|
|
|
|
|
|
||||||||||||
|
Germany |
|
|
|
|
|
|
||||||||||||
|
Korea, South |
|
|
|
|
|
|
||||||||||||
|
United Kingdom |
|
|
|
|
|
|
||||||||||||
|
France |
|
|
|
|
|
|
||||||||||||
|
India |
|
|
|
|
|
|
||||||||||||
|
Taiwan |
|
|
|
|
|
|
||||||||||||
|
Italy |
|
|
|
|
|
|
||||||||||||
|
Brazil |
|
|
|
|
|
|
||||||||||||
|
Singapore |
|
|
|
|
|
|
||||||||||||
|
Hong Kong |
|
|
|
|
|
|
Source: CRS calculations with data from the U.S. Department of Commerce, Bureau of Economic Analysis.
|
Figure 5. Destination of U.S. Merchandise Exports in 2017 (as a percentage of total U.S. merchandise exports) |
 |
|
Source: CRS with data from the U.S. Department of Commerce, Bureau of Economic Analysis. |
|
Figure 6. Source of U.S. Merchandise Imports in 2017 (as a percentage of total U.S. merchandise imports) |
 |
|
Source: CRS with data from the U.S. Department of Commerce, Bureau of Economic Analysis. |
Trade in Goods with Free Trade Agreement Partners10
The United States negotiates trade-liberalizing agreements for numerous economic, commercial, foreign policy, and national security reasons. The United States has 14 free trade agreements (FTA) in force, covering 20 countries.11 The majority of U.S. FTA partners are small, emerging market, and developing economies. While U.S. FTAs cover some major U.S. trading partners, like Canada and Mexico, less than 39% of total U.S. merchandise trade is with FTA partners.
Table 3. U.S. Merchandise Trade with Free Trade Agreement Partners
(in millions of current U.S. dollars)
|
FTA Partner |
2016 |
2017 |
||||||||||||||||
|
Exports |
Imports |
Balance |
Exports |
Imports |
Balance |
|||||||||||||
|
Australia |
|
|
|
|
|
|
||||||||||||
|
Bahrain |
|
|
|
|
|
|
||||||||||||
|
Canada |
|
|
|
|
|
|
||||||||||||
|
Chile |
|
|
|
|
|
|
||||||||||||
|
Colombia |
|
|
|
|
|
|
||||||||||||
|
Costa Rica |
|
|
|
|
|
|
||||||||||||
|
Dominican Republic |
|
|
|
|
|
|
||||||||||||
|
El Salvador |
|
|
|
|
|
|
||||||||||||
|
Guatemala |
|
|
|
|
|
|
||||||||||||
|
Honduras |
|
|
|
|
|
|
||||||||||||
|
Israel |
|
|
|
|
|
|
||||||||||||
|
Jordan |
|
|
|
|
|
|
||||||||||||
|
South Korea |
|
|
|
|
|
|
||||||||||||
|
Mexico |
|
|
|
|
|
|
||||||||||||
|
Morocco |
|
|
|
|
|
|
||||||||||||
|
Nicaragua |
|
|
|
|
|
|
||||||||||||
|
Oman |
|
|
|
|
|
|
||||||||||||
|
Panama |
|
|
|
|
|
|
||||||||||||
|
Peru |
|
|
|
|
|
|
||||||||||||
|
Singapore |
|
|
|
|
|
|
||||||||||||
Source: CRS calculations with data from the U.S. Department of Commerce, Census Bureau.
Notes: Census basis.
U.S. two-way (exports plus imports) merchandise trade between the United States and its 20 FTA partners was $1.5 trillion in 2017, which accounted for 38.76% of total U.S. merchandise trade with the world. The value of U.S. exports to FTA partners totaled $720.3 billion, a 6.55% ($44.3 billion) increase from $676.0 billion in 2016. The value of U.S. exports to most FTA partners increased in 2017; the exceptions were exports to Bahrain and Israel, which declined 0.15% ($1.3 million) and 4.91% ($647 million), respectively (Table 3). U.S. imports from FTA partners were valued at $796.8 billion, a 6.5% ($48.6 billion) increase from $748.2 billion in 2016. The U.S. merchandise trade deficit with all FTA partners increased 5.98% ($4.3 billion) to $76.5 billion in 2017.
U.S. trade with the two NAFTA countries (Canada and Mexico) contributed the most to overall U.S. trade with FTA partners. In 2017, these countries accounted for $1.1 trillion, or 75.09%, of total U.S. trade with FTA partners. From 2016 to 2017, the value of U.S. exports to NAFTA countries rose 5.8% ($28.8 billion) to $525.6 billion. U.S. imports from NAFTA countries rose 7.33% ($41.9 billion) to $613.6 billion in 2017. As a result, the U.S. merchandise trade deficit with its NAFTA partners increased by 17.47% ($13.1 billion) to $88.0 billion in 2017.
U.S. trade with its non-NAFTA FTA partners was valued at $378.0 billion in 2017, which represented a 6.24% ($22.2 billion) increase from 2016. U.S. exports to these FTA partners increased 8.64% ($15.5 billion), from $179.2 billion in 2016 to $194.7 billion in 2017. At the same time, U.S. imports from these trade partners increased 3.81% ($6.7 billion), from $176.5 billion in 2016 to $183.3 billion. U.S. exports increased more than imports, causing the U.S. merchandise trade surplus with its non-NAFTA FTA partners to increase 323.23% to $11.5 billion.
Imports Under U.S. Free Trade Agreements
The value of U.S. imports entering into the United States under the preferential terms of an FTA—or subject to the FTA tariff scheme—was $385.6 billion in 2017, a 2.83% ($10.6 billion) increase from the 2016 value of $375.0 billion (Table 4). These imports accounted for nearly half (48.39%) of total imports from FTA partners in 2017 and for 16.47% of total U.S. imports from the world.
FTA imports from Chile grew 26.59% ($1.3 billion), which represented the largest percentage increase. Imports under FTAs from Peru and Bahrain increased 24.42% ($650 million) and 16.68% ($83.0 million), respectively, albeit from smaller baselines. Combined imports from the NAFTA partners (Canada and Mexico) rose 3.54% ($10.7 billion). U.S. imports under an FTA declined the most from Oman (down 13.81% or 113.0 million), followed by Colombia (down 7.01% or 377.0 million) and South Korea (down 5.62% or 2.0 billion).
Jordan was the U.S. FTA partner with the highest ratio of imports entering under an FTA to total imports, at 88.10%. Other countries with notably high ratios include Oman (65.78%), Bahrain (58.43%), and Chile (56.41%). CAFTA-DR countries as a whole also had a high ratio, at 57.57%. The partners with the smallest shares of imports entered under an FTA are Singapore (9.36%), Israel (12.34%), and Panama (12.71%).
|
FTA |
2016 |
2017 |
% Change 2017/16 |
% Total Imports from Partner(s) (2017) |
||
|
NAFTA (Canada and Mexico) |
302,374 |
313,086 |
|
51.03 |
||
|
South Korea |
35,055 |
33,085 |
|
46.31 |
||
|
CAFTA-DR* |
13,586 |
13,609 |
|
57.57 |
||
|
Chile |
4,702 |
5,952 |
|
56.41 |
||
|
Colombia |
5,387 |
5,010 |
|
36.96 |
||
|
Australia |
3,732 |
4,018 |
|
40.00 |
||
|
Peru |
2,661 |
3,311 |
|
45.47 |
||
|
Israel |
2,743 |
2,709 |
|
12.34 |
||
|
Singapore |
1,845 |
1,814 |
|
9.36 |
||
|
Jordan |
1,356 |
1,487 |
|
88.10 |
||
|
Oman |
815 |
702 |
|
65.78 |
||
|
Bahrain |
499 |
582 |
|
58.43 |
||
|
Morocco |
194 |
205 |
|
16.67 |
||
|
Panama |
53 |
56 |
|
12.71 |
||
|
TOTAL |
375,001 |
385,626 |
|
48.39 |
Source: U.S. International Trade Commission, USITC DataWeb.
Note: *The Dominican Republic–Central America Free Trade Agreement (CAFTA-DR) includes, in addition to the Dominican Republic, Costa Rica, El Salvador, Guatemala, Honduras, and Nicaragua.
Trade Preference Programs12
The United States has four preference programs designed to encourage economic growth in developing countries. They offer access to the U.S. market in the form of preferential duty reduction or duty elimination for eligible imports. The Generalized System of Preferences (GSP) is the broadest program covering most developing countries. Additional programs for specific regions include the African Growth and Opportunity Act (AGOA), the Caribbean Basin Initiative (CBI)/Caribbean Basin Trade Partnership Agreement (CBTPA), and the Nepal Trade Preference Program (NTPP). Individual countries may be covered by more than one program. In such countries, importers of eligible goods may choose among programs when purchasing these goods from beneficiary countries. In addition, the Haitian Hemispheric Opportunity through Partnership Encouragement Act of 2006 (HOPE Act), the HOPE II Act of 2008 (HOPE II Act), and the Haitian Economic Lift Program Act of 2010 (HELP Act) further expanded CBI benefits for Haiti, providing preferential treatment for its textile and apparel products.
The value of U.S. imports entering under trade preference programs with developing countries increased 18.43%, from $29.3 billion in 2016 to $34.71 billion in 2017. Over the same period, total U.S. merchandise imports from the world increased 6.92%. The increase was largely due to a 32.39% increase ($3.1 billion) in the value of U.S. imports under AGOA (not including GSP) and an 11.93% ($2.3 billion) increase in imports under GSP (Table 5). Imports from CBI/CBTPA also increased in 2017 ($90.0 billion or 10.33%).
Overall, U.S. imports benefiting from duty-free access through U.S. preference programs accounted for 1.47% of total U.S. imports during 2017, up from 1.33% in 2016. Each program's respective share of total U.S. imports under preference programs in 2017 was as follows:
- GSP, 61.10% ($21.2 billion);
- AGOA, 36.11% ($12.5 billion);
- CBI/CBTPA, 2.88% ($1.0 billion);
- Haiti initiatives, 1.66% ($0.6 billion); and
- Nepal Trade Preference Program, 0.01% ($0.002 billion).
|
Trade Preference Program (TPP) |
2016 |
2017 |
% Change 2017/16 |
||||||
|
Generalized System of Preferences (GSP) |
|||||||||
|
Total Imports from GSP Beneficiaries (million $) |
|
|
|
||||||
|
Total Imports under GSP (million $) |
|
|
|
||||||
|
African Growth and Opportunity Act (AGOA) |
|
|
|
||||||
|
Total imports from AGOA countries (million $) |
|
|
|
||||||
|
Imports under AGOA (million $) |
|
|
|
||||||
|
Imports under AGOA, excluding GSP (million $) |
|
|
|
||||||
|
Nepal Trade Preference Program (NTPP) |
|
|
|
||||||
|
Total imports from Nepal (thousand $) |
|
|
|
||||||
|
Imports under GSP (thousand $) |
|
|
|
||||||
|
Imports under NTPP (thousand $) |
|
|
|
||||||
|
Caribbean Basin Initiatives (CBI) |
|
|
|
||||||
|
Total imports from CBI countries (million $) |
|
|
|
||||||
|
Total imports under CBI (million $) |
|
|
|
||||||
|
Haiti Initiatives |
|
|
|
||||||
|
Total apparel imports from Haiti (million $) |
|
|
|
||||||
|
Apparel imports under a TPP (million $) |
|
|
|
||||||
|
CBI (million $) |
|
|
|
||||||
|
HOPE and HELP Acts (b) (million $) |
|
|
|
Source: CRS with data and information from the U.S. International Trade Commission.
Notes:
a. U.S. imports under NTPP were first recorded in 2017.
b. The Haitian Hemispheric Opportunity through Partnership Encouragement Act of 2006 (HOPE Act); the HOPE II Act of 2008 (HOPE II Act); the Haitian Economic Lift Program Act of 2010 (HELP Act)
Total Trade in Services
The United States remains highly competitive in the global services market. As the world's top exporter of services, the United States accounted for $780.9 billion, or 14.55%, of world services exports in 2017.13 Other top world exporters included the UK ($360.6 billion or 6.72% total world services exports), Germany ($308.7 billion or 5.75%), France ($265.7 billion or 4.95%), and China ($206.5 billion or 3.85%) (Table 6). Most of the world's top 10 services exporters in 2017 were developed countries. However, China (currently the fifth-largest services exporter) and India (currently the seventh-largest services exporter) have been among the top 10 since the mid-2000s. Overall, the top 10 exporting countries together accounted for 52.14% of world services exports in 2017.
Table 6. World Services Exporters and Importers in 2017
(in billions of current U.S. dollar and as a percentage of total world services exports and imports)
|
Country |
Exports |
Country |
Imports |
||||||||||
|
Value |
Share |
Value |
Share |
||||||||||
|
World |
|
|
World |
|
|
||||||||
|
United States |
|
|
United States |
|
|
||||||||
|
United Kingdom |
|
|
China |
|
|
||||||||
|
Germany |
|
|
Germany |
|
|
||||||||
|
France |
|
|
France |
|
|
||||||||
|
China |
|
|
United Kingdom |
|
|
||||||||
|
Japan |
|
|
Ireland |
|
|
||||||||
|
India |
|
|
Japan |
|
|
||||||||
|
Ireland |
|
|
Singapore |
|
|
||||||||
|
Singapore |
|
|
Netherlands |
|
|
||||||||
|
Netherlands |
|
|
South Korea |
|
|
||||||||
Source: CRS calculations with data from the International Monetary Fund, Balance of Payments Statistics Yearbook (September 2018).
Notes: Balance of Payment basis.
The United States also remains the world's largest importer of services ($538.1 billion or 10.57% of total world services imports), followed by China ($71.9 billion or 9.27%), Germany ($327.1 billion or 6.42%), France ($244.7 or 4.81%), and the UK ($222.6 billion or 4.37%). The top 10 importer countries together accounted for 52.04% of world services imports in 2017.
U.S. two-way (exports and imports) trade in services increased 5.63% between 2016 and 2017. During that period, U.S. exports of services increased 5.11% ($38 billion), from $758.9 billion to $797.7 billion, while U.S. services imports grew 6.40% ($32.6 billion), from $509.8 billion to $542.5 billion. The U.S. surplus in services trade increased 2.45% ($6.1 billion) to $255.2 billion. U.S. exports in all nine services export categories grew in 2017. The services export categories with the highest growth rates in 2017 included financial services (10.32%), telecommunications, computers, and information services (9.52%), and insurance services (5.74%). U.S. imports of services grew in all but one of the services import categories (maintenance and repair services).
Trade in Services with Leading Partners
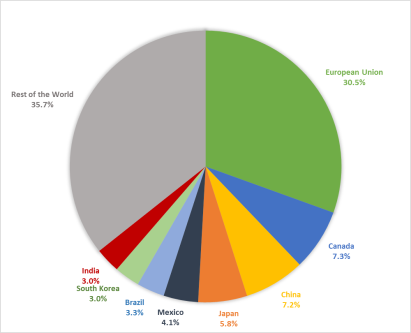
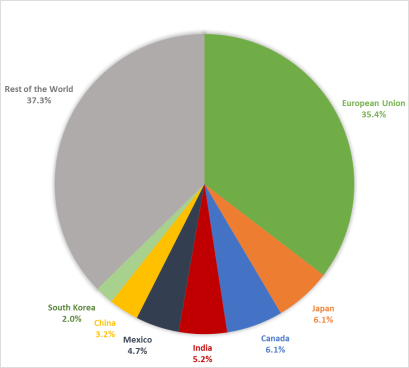
In 2017, the EU—as a single entity—was the United States' top trading partner in terms of two-way (exports plus imports) trade in services, while the largest single-country trading partners were the UK, Canada, Japan, China, and Germany (Table 7).14 Since 2000, the share of U.S. services trade with partners like the UK, Canada, and Japan has decreased, while that of China and India, for example, has grown dramatically (Table 8). The EU was the largest export market for U.S. services in 2017, as well as the largest foreign supplier of U.S. services imports. The EU accounted for $243.4 billion (30.51%) of total U.S. services exports and for $192.0 billion (35.39%) of total U.S. services imports (Figure 7 and Figure 8). After the EU, the top markets for U.S. services exports were the UK, Canada, China, and Japan, while the top sources of U.S. services imports were the UK, Germany, Japan, and Canada. In 2017, the United States maintained a services trade surplus with every major services trading partner except Hong Kong ($4.4 billion deficit), India ($3.1 billion deficit), and France ($2.7 billion deficit).
U.S. services exports to nearly all leading trading partners increased from 2016 to 2017. Exports declined to Taiwan (down $1.8 billion or 15.18%), France (down $552 million or 2.79%), and Saudi Arabia (down $155.0 billion or 1.66%). The largest increase in value was a $4.1 billion increase in U.S. services exports to Canada, followed by a $3.1 billion increase to India and a $2.8 billion increase to the UK. In percentage terms, the largest increases in U.S. services exports between 2016 and 2017 were to Hong Kong (19.15%), India (15.19%), South Korea (11.24%), and Brazil (10.57%).
U.S. services imports from all but two of the major trading partners increased in 2017. Imports from both Brazil and South Korea fell last year, down 6.90% ($534 million) and 0.18% ($20 million), respectively. The largest increases in value were a $4.6 billion increase in U.S. services imports from the UK (up 8.77%), a $2.4 billion increase in imports from Canada (up 7.98%), and a $2.3 billion increase in imports from India (up 8.98%). In percentage terms, the largest increase in U.S. services imports between 2016 and 2017 was from Hong Kong (up 10.11%), followed by Singapore (up 9.31%) and Italy (up 9.22%).
|
Trading Partner |
Total Trade |
Exports |
Imports |
Trade Balance |
|||||||||||||||||
|
2017 |
2017 |
% Change 2017/16 |
2017 |
% Change 2017/16 |
2017 |
% Change 2017/16 |
|||||||||||||||
|
World |
|
|
|
|
|
|
|
||||||||||||||
|
European Union |
|
|
|
|
|
|
|
||||||||||||||
|
United Kingdom |
|
|
|
|
|
|
|
||||||||||||||
|
Canada |
|
|
|
|
|
|
|
||||||||||||||
|
Japan |
|
|
|
|
|
|
|
||||||||||||||
|
China |
|
|
|
|
|
|
|
||||||||||||||
|
Germany |
|
|
|
|
|
|
|
||||||||||||||
|
Mexico |
|
|
|
|
|
|
|
||||||||||||||
|
India |
|
|
|
|
|
|
|
||||||||||||||
|
France |
|
|
|
|
|
|
|
||||||||||||||
|
South Korea |
|
|
|
|
|
|
|
||||||||||||||
|
Brazil |
|
|
|
|
|
|
|
||||||||||||||
|
Singapore |
|
|
|
|
|
|
|
||||||||||||||
|
Hong Kong |
|
|
|
|
|
|
|
||||||||||||||
|
Italy |
|
|
|
|
|
|
|
||||||||||||||
|
Taiwan |
|
|
|
|
|
|
|
||||||||||||||
|
Saudi Arabia |
|
|
|
|
|
|
|
||||||||||||||
Table 8. Share of U.S. Trade in Services with Major Trading Partners
(as a share of U.S. total trade, exports, and imports of services)
|
Trading Partner |
2000 |
2017 |
||||||||||||||||
|
Total Trade |
Exports |
Imports |
Total Trade |
Exports |
Imports |
|||||||||||||
|
European Union |
|
|
|
|
|
|
||||||||||||
|
United Kingdom |
|
|
|
|
|
|
||||||||||||
|
Canada |
|
|
|
|
|
|
||||||||||||
|
Japan |
|
|
|
|
|
|
||||||||||||
|
China |
|
|
|
|
|
|
||||||||||||
|
Germany |
|
|
|
|
|
|
||||||||||||
|
Mexico |
|
|
|
|
|
|
||||||||||||
|
India |
|
|
|
|
|
|
||||||||||||
|
France |
|
|
|
|
|
|
||||||||||||
|
South Korea |
|
|
|
|
|
|
||||||||||||
|
Brazil |
|
|
|
|
|
|
||||||||||||
|
Singapore |
|
|
|
|
|
|
||||||||||||
|
Hong Kong |
|
|
|
|
|
|
||||||||||||
|
Italy |
|
|
|
|
|
|
||||||||||||
|
Taiwan |
|
|
|
|
|
|
Source: CRS calculations with data from the U.S. Department of Commerce, Bureau of Economic Analysis.
|
Figure 7. Destination of U.S. Services Exports in 2017 (as a percentage of total U.S. services exports) |
 |
|
Source: CRS with data from the U.S. Department of Commerce, Bureau of Economic Analysis. |
|
Figure 8. Source of U.S. Services Imports in 2017 (as a percentage of total U.S. services imports) |
 |
|
Source: CRS with data from the U.S. Department of Commerce, Bureau of Economic Analysis. |
Total Trade in Goods and Services
In 2017, exports of goods and services totaled $2.4 trillion and imports totaled $2.9 trillion, resulting in a deficit of $552.3 billion, up slightly from 2016, but down from the all-time high level registered in 2006 ($761.7 billion) (Table 9). The deficit on goods increased to $807.5 billion in 2017, from $751.1 billion in 2016, though it remained well below the annual record deficit of $837.3 billion registered in 2006.
|
Description |
2014 |
2015 |
2016 |
2017 |
% Change 2015/14 |
% Change 2016/15 |
% Change 2017/16 |
|
|
Exports |
2,376.7 |
2,266.7 |
2,215.8 |
2,351.1 |
-4.63 |
-2.24 |
6.10 |
|
|
Imports |
2,866.2 |
2,765.2 |
2,717.8 |
2,903.3 |
-3.52 |
-1.71 |
6.83 |
|
|
Balance |
-489.6 |
-498.5 |
-502.0 |
-552.3 |
1.83 |
0.70 |
10.02 |
|
Source: CRS calculations with data from the U.S. Department of Commerce, Bureau of Economic Analysis.
Note: Balance of Payments basis.
Trade in Goods and Services with Leading Partners
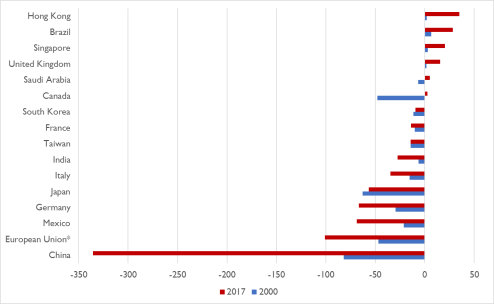
In 2017, the EU was the United States' largest market for U.S. goods and services exports, accounting for $528.2 billion (22.47% of total U.S. exports, down from 24.97% in 2000), as well as the leading source of U.S. imports, which totaled $629.4 billion (21.68% of total U.S. imports, largely unchanged from the share in 2000). Canada was the second-largest U.S. export market, with $341.3 billion worth of U.S. exports (14.52% of total U.S. exports, down from 18.96% in 2000), and the fourth-largest source of U.S. imports, which totaled $338.5 billion (11.6%, down from 17.39% in 2000). The share of China in U.S. trade has increased dramatically over the past few decades. In 2000, it accounted for 2.00% of total U.S. exports and 7.14% of total U.S. imports. Last year, China's share had risen to 8.00% of total U.S. exports and 18.04% of U.S. imports. Figure 9 and Table 10 present data on bilateral U.S. trade balances on goods and services.
|
2014 |
2015 |
2016 |
2017 |
|||||||||
|
World |
|
|
|
|
||||||||
|
China |
|
|
|
|
||||||||
|
European Union |
|
|
|
|
||||||||
|
Mexico |
|
|
|
|
||||||||
|
Germany |
|
|
|
|
||||||||
|
Japan |
|
|
|
|
||||||||
|
Italy |
|
|
|
|
||||||||
|
India |
|
|
|
|
||||||||
|
Taiwan |
|
|
|
|
||||||||
|
France |
|
|
|
|
||||||||
|
South Korea |
|
|
|
|
||||||||
|
Canada |
|
|
|
|
||||||||
|
Saudi Arabia |
|
|
|
|
||||||||
|
United Kingdom |
|
|
|
|
||||||||
|
Singapore |
|
|
|
|
||||||||
|
Brazil |
|
|
|
|
||||||||
|
Hong Kong |
|
|
|
|
Source: CRS calculations with data from the U.S. Department of Commerce, Bureaus of Economic Analysis.
European Union
Trade in Goods
The EU—comprised of 28 member states—was the United States' largest two-way (exports plus imports) trading partner for both goods and services. The value of U.S. merchandise trade with the EU increased 4.66% ($32.2 billion), from $690.1 billion in 2016 to $722.2 billion in 2017. However, the EU share of U.S. trade declined slightly, from 18.83% in 2016 to 18.45% in 2017. The U.S. trade deficit with the EU rose 3.01% ($4.5 billion), from $148.1 billion in 2016 to $152.6 billion in 2017. It remains lower than the trade deficit registered in 2015 ($157.4 billion).
The EU was the largest market for U.S. merchandise exports both in 2016 and 2017, accounting for 18.53% of total U.S. exports in 2017 (Figure 10). U.S. exports to the EU increased 5.11% ($13.9 billion), from $271.0 billion in 2016 to $284.8 billion in 2017. Leading U.S. exports to the EU included civilian aircraft, engines, and parts (13.02% of all U.S. exports to the EU), medicaments (3.14%), petroleum and petroleum products (not including crude) (2.37%), and immunological products (1.84%).
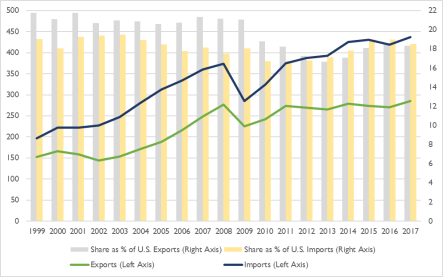
In terms of imports, the EU was the second-largest source of U.S. merchandise imports in 2017, after China. The EU accounted for 18.53% of total U.S. imports in 2017. U.S. imports from the EU increased 4.37% ($18.3 billion), from $419.1 billion in 2016 to $437.4 billion in 2017. Leading U.S. imports were passenger motor vehicles (9.20% of all U.S. imports from the EU), medicaments (5.87%), parts of turbojets or turbo-propellers (1.84%), light oils (1.84%), and airplanes and other aircraft (1.47%).
Trade in Services
The value of U.S. two-way (exports plus imports) services trade with the 28 member states of the EU increased 5.06% ($21.0 billion), from $414.4 billion in 2016 to $435.4 billion in 2017. However, the EU share of U.S. services trade declined slightly, from 32.66% in 2016 to 32.49% in 2017, as total U.S. trade with other trading partners increased by more than U.S. trade with the EU. The U.S. services trade surplus with the EU declined 8.28% ($4.6 billion), from $56.1 billion in 2016 to $51.4 billion in 2017, lower than the U.S. trade surplus registered with the EU in 2014 ($52.3 billion) and 2015 ($54.9 billion).
The EU was the largest market for U.S. service exports in 2017, accounting for 30.51% of total U.S. services exports (Figure 11). U.S. services exports to the EU increased 3.47% ($8.2 billion), from $235.2 billion in 2016 to $243.4 billion in 2017. In terms of imports, the EU was the largest source of U.S. services imports. It accounted for 35.39% of total U.S. services imports in 2017. U.S. services imports from the EU increased 7.15% ($12.8 billion), from $179.2 billion in 2016 to $192.0 billion in 2017. The UK was the EU's largest services trader with the United States, followed by Germany, France, and Italy.
Total Trade in Goods and Services
U.S. total exports (goods and services) to the EU increased $22.0 billion (4.35%) to $528.2 billion, while U.S. total imports from the EU increased $31.1 billion (5.20%) to $629.4 billion (Table 11). Overall, the U.S. trade deficit with the EU rose 9.87% ($9.1 billion) to $101.2 billion.
|
2014 |
2015 |
2016 |
2017 |
|||||||||
|
Exports |
|
|
|
|
||||||||
|
Imports |
|
|
|
|
||||||||
|
Balance (Deficit) |
|
|
|
|
Source: CRS calculations with data from the U.S. Department of Commerce, Bureau of Economic Analysis.
China
Trade in Goods
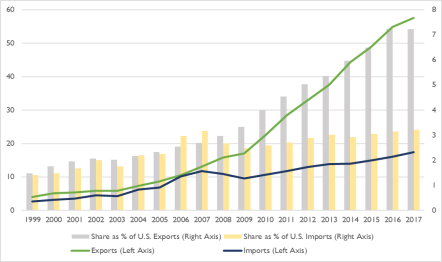
In 2017, China was the United States' largest, single-country trading partner based on two-way (exports plus imports) merchandise trade, accounting for 16.27% of total U.S. merchandise trade, up from 15.80% in 2016. U.S. two-way merchandise trade with China amounted to $636.7 billion in 2017, an increase of 9.93% over the $579.2 billion recorded in 2016. The U.S. merchandise trade deficit with China of $375.9 billion remained higher than the U.S. trade deficit registered with any other trading partner in 2017. The deficit's $28.6 billion increase from 2016 was due to a $43.1 billion increase in U.S. merchandise imports from China in 2017 that outpaced a $14.4 billion increase in U.S. merchandise exports to China.
China was the third-largest single-country destination for U.S. merchandise exports in 2017, behind Canada and Mexico. It accounted for 8.39% of total U.S. goods exports, up from 7.96% in 2016 (Figure 12). U.S. merchandise exports to China amounted to $130.4 billion in 2017, increasing 12.45% ($14.4 billion) relative to 2016. Top U.S. exports to China in 2017 were civilian aircraft, engines, and parts (12.52% of all U.S. exports to China), soybeans (9.43%), passenger motor vehicles (6.31%), crude petroleum (3.39%), and processors and controllers (electronic integrated circuits) (2.39%).
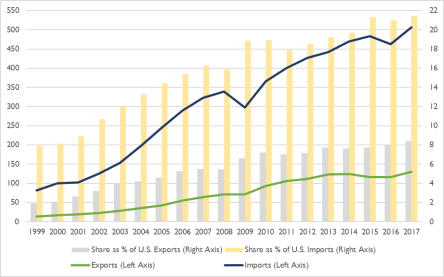
China is the largest, single-country source of U.S. merchandise imports. In 2017, U.S. merchandise imports from China totaled $506.2 billion, representing 21.44% of total U.S. goods imports that year. U.S. merchandise imports from China were up 9.3% relative to the year before. In 2017, the leading U.S. imports from China were telephones for cellular networks (cellphones) (8.82% of all U.S. imports from China), portable digital automatic data processing machines (laptops and tablets) (7.38%), machines for the reception, conversion, and transmission of voice, images, and data (telecommunications equipment) (4.54%), computer and tablet parts and accessories (2.97%), and tricycles, scooters, pedal cars, and similar toys (2.42%).
Trade in Services
In 2017, China was the United States' fourth-largest single-country trading partner based on two-way (exports plus imports) services trade, accounting for 5.60% of total U.S. services trade—unchanged from 2016. U.S. two-way services trade with China amounted to $75.0 billion in 2017, an increase of 5.74% from the $71.0 billion recorded in 2016. The U.S. services surplus with China in 2017 amounted to $40.2 billion. Its $1.3 billion (3.35%) increase relative to the year before reflected a $2.7 billion increase in U.S. services exports to China that outpaced a $1.4 billion increase in U.S. services imports from China in 2017.
China was the third-largest single-country destination for U.S. services exports in 2017, behind Canada and the UK. It accounted for 7.22% of total U.S. services exports, down slightly from 7.24% in 2016 (Figure 13). U.S. services exports to China amounted to $57.6 billion in 2017, increasing 4.89% ($2.7 billion) relative to 2016. In addition, U.S. services imports from China amounted to $17.4 billion, representing 3.21% of total U.S. services imports that year. U.S. services imports from China increased 8.65% ($1.4 billion) relative to the 2016 level.
Total Trade in Goods and Services
U.S. total exports (goods and services) to China increased $17.1 billion (10.02%) to $188.0 billion, while U.S. total imports from China increased $44.5 billion (9.28%) to $523.7 billion (Table 12). Overall, the U.S. trade deficit with China rose 8.87% ($27.3 billion) to $335.7 billion.
|
2014 |
2015 |
2016 |
2017 |
|||||||||
|
Exports |
|
|
|
|
||||||||
|
Imports |
|
|
|
|
||||||||
|
Balance (Deficit) |
|
|
|
|
Source: CRS calculations with data from the U.S. Department of Commerce, Bureau of Economic Analysis.
Canada
Trade in Goods
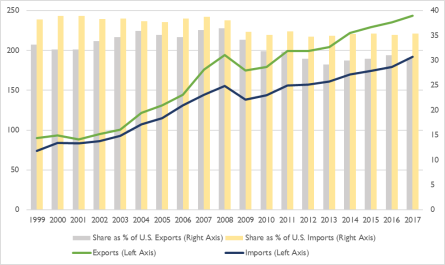
Since 2015, Canada has been the second-largest U.S. single-country trading partner, after China. The value of U.S. two-way (exports plus imports) merchandise trade with Canada rose 6.82% ($37.6 billion) in 2017 to $588.4 billion, accounting for 15.03% of total U.S. merchandise trade with the world—a share largely unchanged from 2016. Both U.S. merchandise exports and imports with Canada increased in 2017 from the previous year, but imports outpaced exports, resulting in a 38.46% ($6.3 billion) increase in the U.S. merchandise trade deficit with Canada, from $16.4 billion in 2016 to $22.7 billion in 2017.
In 2017, Canada was the United States' largest, single-country export market for goods, accounting for 18.21% of U.S. merchandise exports (Figure 14). U.S. exports to Canada increased 5.85% ($15.6 billion) to $282.9 billion in 2017. Leading U.S. exports to Canada included passenger motor vehicles (4.56% of all U.S. exports to Canada), motor vehicles for goods transport (2.99%), civilian aircraft, engines, and parts (2.91%), crude petroleum (2.40%), and light oils (1.97%).
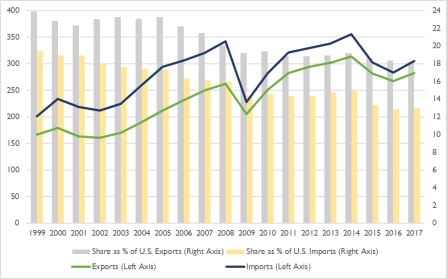
Canada was the third-largest single-country source of U.S. imports in 2017, after China and Mexico. U.S. imports from Canada were $305.5 billion in 2017, up 7.73% from $283.6 billion in 2016. Leading U.S. imports were crude petroleum (16.75% of all U.S. imports from Canada), passenger motor vehicles (14.01%), natural gas (2.31%), coniferous wood sawn or chipped (1.93%), petroleum and petroleum products (not including crude) (1.65%), and light oils (1.61%).
Trade in Services
Canada was the United States' second-largest single-country services trading partner in 2017. It reached $91.5 billion in two-way (exports plus imports) trade in services, behind the UK. U.S. two-way trade in services with Canada grew 7.68% in 2017. Canada accounted for 7.33% of total U.S. services exports and 6.09% of total U.S. services imports (Figure 15). U.S. exports of services to Canada increased 7.52% ($4.1 billion) to $58.4 billion in 2017, whereas U.S. services imports from Canada increased 7.97% ($2.4 billion) to $33.0 billion. Overall, the U.S. trade surplus in services with Canada grew 6.94% ($1.6 billion) in 2017 to $25.4 billion. While the surplus was up from 2016 ($23.8 billion), it remains below its 2013 peak ($32.1 billion).
Total Trade in Goods and Services
U.S. total exports (goods and services) to Canada increased $19.7 billion (6.13%) to $341.3 billion, while U.S. total imports from Canada increased $24.4 billion (7.75%) to $338.5 billion (Table 13). Overall, the U.S. trade surplus with Canada declined 62.72% ($4.6 billion) to $2.8 billion.
|
2014 |
2015 |
2016 |
2017 |
|||||||||
|
Exports |
|
|
|
|
||||||||
|
Imports |
|
|
|
|
||||||||
|
Balance (Deficit/Surplus) |
|
|
|
|
Source: CRS calculations with data from the U.S. Department of Commerce, Bureau of Economic Analysis.
Mexico
Trade in Goods
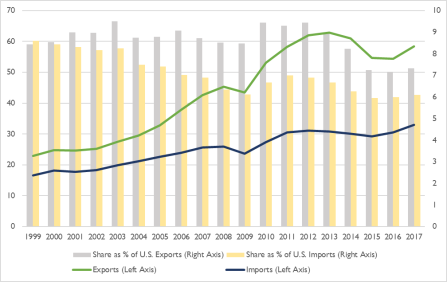
In 2017, Mexico was the United States' third-largest single-country merchandise trading partner, following China and Canada. U.S. two-way (exports plus imports) merchandise trade between the two countries increased 6.25% ($33.2 billion) to $563.8 billion in 2017, accounting for 14.41% of U.S. total merchandise trade with the world. While both imports and exports increased in 2017, the increase in U.S. imports outpaced that of exports. As a result, the U.S. merchandise trade deficit with Mexico rose 8.86% ($6.2 billion) to $76.1 billion.
Mexico was the United States' second-largest single-country export market after Canada in 2017, accounting for 15.70% of total U.S. exports to the world (Figure 16). U.S. merchandise exports to Mexico totaled $243.8 billion, an increase of 5.85% ($13.5 billion) from 2016. In 2017, the leading U.S. exports to Mexico were light oils (4.90% of all U.S. exports to Mexico), computer and tablet parts and accessories (4.29%), petroleum and petroleum products (not including crude) (3.70%), processors and controllers (electronic integrated circuits) (1.49%), and compression-ignition internal combustion piston engines (1.47%).
Mexico was the United States' second-largest single-country source of imports in 2017 after China, and it accounted for 13.55% of U.S. total imports. In 2017, U.S. merchandise imports from Mexico increased 6.55% ($19.7 billion) to $320.0 billion. Leading U.S. imports from Mexico included passenger motor vehicles (8.89% of all U.S. imports from Mexico), digital processing units (computers) (5.56%), motor vehicles for goods transport (4.89%), crude petroleum (3.20%), and machines for the reception, conversion, and transmission of voice, images, and data (telecommunications equipment) (3.03%).
Trade in Services
U.S. two-way (exports plus imports) services trade between the United States and Mexico increased 4.68% ($2.6 billion) to $58.4 billion in 2017, accounting for 4.36% of total U.S. services trade in 2017. Mexico was the United States' sixth-largest single-country services trading partner, and it accounted for 4.12% of total U.S. services exports and 4.70% of total U.S. services imports in 2017 (Figure 17). The U.S. trade surplus in services with Mexico decreased 2.35% ($178 million) to $7.4 billion in 2017, largely a result of increasing U.S. services imports from Mexico. U.S. services exports to Mexico increased 3.84% ($1.2 billion) to $32.9 billion in 2017, whereas U.S. services imports from Mexico increased 5.79% ($1.4 billion) to $25.5 billion. Mexico was the United States' sixth-largest single-country trading partner for services in 2017, after the UK, Canada, Japan, China, and Germany.
Total Trade in Goods and Services
U.S. total exports (goods and services) to Mexico increased $14.7 billion (5.61%) to $276.7 billion, while U.S. total imports from Mexico increased $21.1 billion (6.50%) to $345.4 billion (Table 14). Overall, the U.S. trade deficit with Mexico rose 10.22% to $68.7 billion.
|
2014 |
2015 |
2016 |
2017 |
|||||||||
|
Exports |
|
|
|
|
||||||||
|
Imports |
|
|
|
|
||||||||
|
Balance (Deficit) |
|
|
|
|
Source: CRS calculations with data from the U.S. Department of Commerce, Bureau of Economic Analysis.
Japan
Trade in Goods
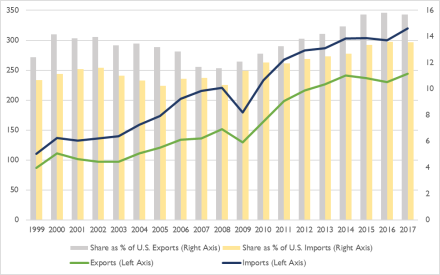
In 2017, Japan was the United States' fourth-largest single-country trading partner in terms of two-way (exports plus imports) trade, accounting for 5.28% of total U.S. merchandise trade with the world, slightly down from 5.40% in 2016. U.S. merchandise trade with Japan increased 4.36% ($8.6 billion), from $198.0 billion in 2016 to $206.6 billion in 2017. At the same time, the U.S. merchandise trade deficit with Japan rose 0.6% ($424 million) in 2017 to $70.0 billion. The increase in the bilateral merchandise trade deficit occurred even though the increase in U.S. exports to Japan (up $4.5 billion) outpaced that of imports from Japan (up $4.1 billion).
Japan was the fourth-largest destination for U.S. merchandise exports in 2017, accounting for 4.40% of total U.S. merchandise exports (Figure 18). Between 2016 and 2017, U.S. exports to Japan increased 7.10% ($4.5 billion), from $63.8 billion in 2016 to $68.3 billion in 2017. Leading U.S. exports to Japan were civilian aircraft, engines, and parts (8.47% of all U.S. exports to Japan), liquefied propane (4.28%), corn (maize) (3.19%), machines for the manufacture of semiconductor devices or of electronic integrated circuits (2.56%), and medicaments (2.45%).
In 2017, Japan was the fourth-largest source of U.S. merchandise imports, accounting for 5.86% of total U.S. merchandise imports. The value of U.S. imports from Japan increased 3.06% ($4.1 billion) in 2017, from $134.2 billion in 2016 to $138.36 billion in 2017. Leading U.S. imports from Japan were passenger motor vehicles (26.23% of all U.S. imports from Japan), parts of airplanes or helicopters (2.92%), gearboxes for motor vehicles (2.45%), and parts for printers and copying machines (1.87%).
Trade in Services
In 2017, Japan was the United States' third-largest single-country services trading partner, accounting for $79.5 billion or 5.9% of total U.S. two-way (exports plus imports) services trade. Japan accounted for 5.82% of U.S. services exports and 6.09% of imports (Figure 19). U.S. services exports to Japan increased $1.4 billion (3.07%) to $46.4 billion in 2017, while U.S. services imports from Japan increased $2.0 billion (6.43%) to $28.4 billion. As a result, the U.S. surplus in services trade with Japan declined 4.39% ($614 million) to $13.4 billion, from $13.9 billion in 2016.
Trade in Goods and Services
U.S. total exports (goods and services) to Japan increased $5.9 billion (5.43%) to $114.7 billion, while U.S. total imports from Japan increased $6.1 billion (3.69%) to $171.3 billion (Table 15). Overall, the U.S. trade deficit with Japan declined 0.34% ($190 million) to $56.6 billion.
|
2014 |
2015 |
2016 |
2017 |
|
|
Exports |
114.8 |
108.4 |
108.8 |
114.7 |
|
Imports |
168.5 |
163.7 |
165.2 |
171.3 |
|
Balance (Deficit) |
-53.7 |
-55.2 |
-56.4 |
-56.6 |
Source: CRS calculations with data from the U.S. Department of Commerce, Bureau of Economic Analysis.
South Korea
Trade in Goods
South Korea was the United States' sixth-largest single-country merchandise trading partner in 2017. U.S. two-way (exports plus imports) merchandise trade totaled $121.1 billion, up 6.82% ($7.7 billion) from $113.4 billion in 2016. The share of U.S. trade with South Korea remained at 3.10% of U.S. trade with the world. The United States recorded a merchandise trade deficit of $22.6 billion with South Korea in 2017, a 17.69% ($4.9 billion) decrease from the $27.4 billion deficit registered in 2016, as U.S. exports to South Korea increased more than U.S. imports from South Korea.
U.S. merchandise exports to South Korea were valued at $49.3 billion in 2017, increasing 14.65% ($6.3 billion) from 2016 (Figure 20). They accounted for 3.17% of total U.S. merchandise exports, up from 2.95% in 2016. Leading U.S. exports to South Korea were machines for the manufacture of semiconductor devices or of electronic integrated circuits (9.79% of all U.S. exports to South Korea), civilian aircraft, engines, and parts (5.92%), processors and controllers (electronic integrated circuits) (5.20%), crude petroleum (2.27%), telephones for cellular networks (cellphones) (1.96%), and liquefied propane (1.91%). In 2017, for the first time, crude petroleum and liquefied propane were among the top U.S. exports to South Korea.
U.S. merchandise imports from South Korea totaled $71.8 billion in 2017, increasing 2.05% ($1.4 billion) from the 2016 level. They accounted for 3.04% of total U.S. merchandise imports in 2017, down from 3.18% in 2016. Top U.S. imports from South Korea included passenger motor vehicles (20.01% of all U.S. imports from South Korea), telephones for cellular networks (cellphones) (7.78%), computer and tablet parts and accessories (3.72%), petroleum and petroleum products (not including crude) (3.61%), and electronic integrated circuits (1.94%).
Trade in Services
In 2017, South Korea was the United States' 9th-largest single-country services trading partner in terms of two-way (exports plus imports) trade, up from 10th largest in 2016. U.S. services exports to South Korea increased 11.24% ($2.4 billion) in 2017 to $24.2 billion, representing 3.03% of total U.S. services exports (Figure 21). U.S. services imports from South Korea decreased slightly in 2017, down 0.18% ($20 million) to $10.9 billion and amounting to 2.00% of total U.S. services imports. Because of the increase in U.S. services exports to the UK, the U.S. services trade surplus with South Korea increased 22.74% (2.5 billion), from $10.8 billion in 2016 to $13.3 billion in 2017.
Total Trade in Goods and Services
U.S. total exports (goods and services) to South Korea increased $8.7 billion (13.50%) to $73.4 billion, while U.S. total imports from South Korea increased $1.4 billion (1.75%) to $82.7 billion (Table 16). Overall, the U.S. trade deficit with South Korea declined 44.03% ($7.3 billion) to $9.3 billion.
|
2014 |
2015 |
2016 |
2017 |
|||||||||
|
Exports |
|
|
|
|
||||||||
|
Imports |
|
|
|
|
||||||||
|
Balance (Deficit) |
|
|
|
|
Source: CRS calculations with data from the U.S. Department of Commerce, Bureau of Economic Analysis.
Appendix A. Trade Surplus and Deficit Partners
|
Rank |
Trading Partner |
2015 |
2016 |
2017 |
|
WORLD |
-745.5 |
-736.6 |
-795.7 |
|
|
1 |
Hong Kong |
30.4 |
27.5 |
32.6 |
|
2 |
Netherlands |
23.4 |
23.5 |
23.7 |
|
3 |
United Arab Emirates |
20.5 |
19.0 |
15.8 |
|
4 |
Belgium |
14.7 |
15.1 |
14.9 |
|
5 |
Australia |
14.1 |
12.6 |
14.5 |
|
6 |
Singapore |
10.2 |
9.0 |
10.4 |
|
7 |
Brazil |
4.2 |
4.0 |
7.8 |
|
8 |
Panama |
7.3 |
5.7 |
5.9 |
|
9 |
Argentina |
5.4 |
3.9 |
4.8 |
|
10 |
United Kingdom |
-2.0 |
0.9 |
3.2 |
|
11 |
Dominican Republic |
2.4 |
3.1 |
3.1 |
|
12 |
Chile |
6.7 |
4.1 |
3.1 |
|
13 |
Guatemala |
1.7 |
1.9 |
2.9 |
|
14 |
Paraguay |
1.3 |
1.8 |
2.6 |
|
15 |
Bahamas |
1.9 |
1.8 |
2.5 |
|
16 |
Egypt |
3.4 |
2.0 |
2.4 |
|
17 |
Kuwait |
-1.9 |
0.0 |
2.2 |
|
18 |
Qatar |
2.9 |
3.8 |
1.9 |
|
19 |
Jamaica |
1.4 |
1.3 |
1.8 |
|
20 |
Costa Rica |
1.6 |
1.5 |
1.6 |
|
21 |
Peru |
3.7 |
1.7 |
1.4 |
|
22 |
Gibraltar |
2.0 |
1.6 |
1.1 |
|
23 |
Lebanon |
1.2 |
1.1 |
1.1 |
|
24 |
Uruguay |
0.7 |
0.6 |
1.0 |
|
25 |
Morocco |
0.6 |
0.9 |
1.0 |
|
26 |
Aruba |
1.1 |
0.8 |
0.9 |
|
27 |
Afghanistan |
0.5 |
0.9 |
0.9 |
|
28 |
Oman |
1.4 |
0.7 |
0.9 |
|
29 |
Cayman Islands |
0.6 |
0.7 |
0.8 |
|
30 |
Ukraine |
0.0 |
0.5 |
0.8 |
Source: CRS with data from the Global Trade Atlas.
|
Rank |
Trading Partner |
2015 |
2065 |
2017 |
|
WORLD |
-745.5 |
-736.6 |
-795.7 |
|
|
1 |
China |
-367.3 |
-347.0 |
-375.6 |
|
2 |
Mexico |
-60.0 |
-63.9 |
-71.0 |
|
3 |
Japan |
-69.1 |
-68.8 |
-68.9 |
|
4 |
Germany |
-74.9 |
-64.7 |
-63.7 |
|
5 |
Vietnam |
-30.9 |
-32.0 |
-38.4 |
|
6 |
Ireland |
-30.4 |
-36.0 |
-38.1 |
|
7 |
Italy |
-28.0 |
-28.6 |
-31.5 |
|
8 |
Malaysia |
-21.7 |
-24.8 |
-24.4 |
|
9 |
South Korea |
-28.3 |
-27.6 |
-23.1 |
|
10 |
India |
-23.3 |
-24.4 |
-22.9 |
|
11 |
Thailand |
-17.4 |
-19.0 |
-20.2 |
|
12 |
Canada |
-15.4 |
-11.0 |
-17.1 |
|
13 |
Taiwan |
-15.1 |
-13.2 |
-16.7 |
|
14 |
France |
-17.8 |
-15.6 |
-15.3 |
|
15 |
Switzerland |
-9.3 |
-13.5 |
-14.3 |
|
16 |
Indonesia |
-12.5 |
-13.2 |
-13.3 |
|
17 |
Russia |
-9.3 |
-8.8 |
-10.0 |
|
18 |
Iraq |
-2.4 |
-4.7 |
-9.5 |
|
19 |
Israel |
-11.0 |
-9.0 |
-9.4 |
|
20 |
Venezuela |
-7.2 |
-5.7 |
-8.2 |
|
21 |
Austria |
-7.3 |
-7.1 |
-7.5 |
|
22 |
Sweden |
-6.0 |
-5.9 |
-7.0 |
|
23 |
Denmark |
-5.6 |
-5.7 |
-5.5 |
|
24 |
Nigeria |
1.5 |
-2.3 |
-4.9 |
|
25 |
Spain |
-3.8 |
-3.0 |
-4.6 |
|
26 |
Finland |
-3.0 |
-3.0 |
-4.4 |
|
27 |
Bangladesh |
-5.0 |
-5.0 |
-4.2 |
|
28 |
Hungary |
-4.0 |
-3.5 |
-3.2 |
|
29 |
Philippines |
-2.3 |
-1.8 |
-3.2 |
|
30 |
Algeria |
-1.5 |
-1.0 |
-2.7 |
Source: CRS with data from the Global Trade Atlas.
Appendix B. U.S. Trade: Value and Share in the Economy
|
Year |
GDP |
Exports |
Imports |
Trade Balance |
||||
|
Goods and Services |
Goods |
Services |
Goods and Services |
Goods |
Services |
|||
|
1990 |
5,963.1 |
551.9 |
403.3 |
148.6 |
629.7 |
508.1 |
121.7 |
-77.9 |
|
1991 |
6,158.1 |
594.9 |
430.1 |
164.8 |
623.5 |
500.7 |
122.8 |
-28.6 |
|
1992 |
6,520.3 |
633.1 |
455.3 |
177.7 |
667.8 |
544.9 |
122.9 |
-34.7 |
|
1993 |
6,858.6 |
654.8 |
467.7 |
187.1 |
720.0 |
592.8 |
127.2 |
-65.2 |
|
1994 |
7,287.2 |
720.9 |
518.4 |
202.6 |
813.4 |
676.8 |
136.6 |
-92.5 |
|
1995 |
7,639.7 |
812.8 |
592.4 |
220.4 |
902.6 |
757.4 |
145.1 |
-89.8 |
|
1996 |
8,073.1 |
867.6 |
628.8 |
238.8 |
964.0 |
807.4 |
156.5 |
-96.4 |
|
1997 |
8,577.6 |
953.8 |
699.9 |
253.9 |
1,055.8 |
885.7 |
170.1 |
-102.0 |
|
1998 |
9,062.8 |
953.0 |
692.6 |
260.4 |
1,115.7 |
930.8 |
184.9 |
-162.7 |
|
1999 |
9,630.7 |
992.8 |
711.7 |
281.1 |
1,248.6 |
1,051.2 |
197.4 |
-255.8 |
|
2000 |
10,252.3 |
1,096.3 |
795.9 |
300.3 |
1,471.3 |
1,250.1 |
221.2 |
-375.1 |
|
2001 |
10,581.8 |
1,024.6 |
741.2 |
283.4 |
1,392.6 |
1,173.8 |
218.8 |
-367.9 |
|
2002 |
10,936.4 |
998.7 |
709.0 |
289.7 |
1,424.1 |
1,194.4 |
229.8 |
-425.4 |
|
2003 |
11,458.2 |
1,036.2 |
737.1 |
299.1 |
1,539.3 |
1,291.3 |
248.0 |
-503.1 |
|
2004 |
12,213.7 |
1,177.6 |
830.0 |
347.7 |
1,796.7 |
1,507.3 |
289.4 |
-619.1 |
|
2005 |
13,036.6 |
1,305.2 |
921.9 |
383.3 |
2,026.4 |
1,715.5 |
311.0 |
-721.2 |
|
2006 |
13,814.6 |
1,472.6 |
1,044.9 |
427.7 |
2,243.5 |
1,895.7 |
347.8 |
-770.9 |
|
2007 |
14,451.9 |
1,660.9 |
1,161.3 |
499.6 |
2,379.3 |
1,999.7 |
379.6 |
-718.4 |
|
2008 |
14,712.8 |
1,837.1 |
1,292.5 |
544.5 |
2,560.1 |
2,144.3 |
415.9 |
-723.1 |
|
2009 |
14,448.9 |
1,582.0 |
1,058.4 |
523.6 |
1,978.4 |
1,585.4 |
393.1 |
-396.5 |
|
2010 |
14,992.1 |
1,846.3 |
1,272.4 |
573.8 |
2,360.2 |
1,944.8 |
415.4 |
-513.9 |
|
2011 |
15,542.6 |
2,103.0 |
1,462.3 |
640.7 |
2,682.5 |
2,240.5 |
441.9 |
-579.5 |
|
2012 |
16,197.0 |
2,191.3 |
1,521.6 |
669.7 |
2,759.9 |
2,301.4 |
458.5 |
-568.6 |
|
2013 |
16,784.9 |
2,273.4 |
1,559.2 |
714.2 |
2,764.2 |
2,296.4 |
467.8 |
-490.8 |
|
2014 |
17,521.7 |
2,371.0 |
1,614.9 |
756.1 |
2,879.3 |
2,391.5 |
487.8 |
-508.3 |
|
2015 |
18,219.3 |
2,265.0 |
1,494.4 |
770.7 |
2,786.5 |
2,287.3 |
499.1 |
-521.4 |
|
2016 |
18,707.2 |
2,217.6 |
1,442.7 |
774.9 |
2,738.1 |
2,221.0 |
517.2 |
-520.6 |
|
2017 |
19,485.4 |
2,350.2 |
1,535.9 |
814.3 |
2,928.6 |
2,378.5 |
550.0 |
-578.4 |
Source: U.S. Department of Commerce, Bureau of Economic Analysis.
|
Year |
Exports |
Imports |
Trade Balance |
||||
|
Goods and Services |
Goods |
Services |
Goods and Services |
Goods |
Services |
||
|
1990 |
9.26 |
6.76 |
2.49 |
10.56 |
8.52 |
2.04 |
-1.31 |
|
1991 |
9.66 |
6.98 |
2.68 |
10.12 |
8.13 |
1.99 |
-0.46 |
|
1992 |
9.71 |
6.98 |
2.73 |
10.24 |
8.36 |
1.88 |
-0.53 |
|
1993 |
9.55 |
6.82 |
2.73 |
10.50 |
8.64 |
1.85 |
-0.95 |
|
1994 |
9.89 |
7.11 |
2.78 |
11.16 |
9.29 |
1.87 |
-1.27 |
|
1995 |
10.64 |
7.75 |
2.88 |
11.81 |
9.91 |
1.90 |
-1.18 |
|
1996 |
10.75 |
7.79 |
2.96 |
11.94 |
10.00 |
1.94 |
-1.19 |
|
1997 |
11.12 |
8.16 |
2.96 |
12.31 |
10.33 |
1.98 |
-1.19 |
|
1998 |
10.52 |
7.64 |
2.87 |
12.31 |
10.27 |
2.04 |
-1.80 |
|
1999 |
10.31 |
7.39 |
2.92 |
12.96 |
10.92 |
2.05 |
-2.66 |
|
2000 |
10.69 |
7.76 |
2.93 |
14.35 |
12.19 |
2.16 |
-3.66 |
|
2001 |
9.68 |
7.00 |
2.68 |
13.16 |
11.09 |
2.07 |
-3.48 |
|
2002 |
9.13 |
6.48 |
2.65 |
13.02 |
10.92 |
2.10 |
-3.89 |
|
2003 |
9.04 |
6.43 |
2.61 |
13.43 |
11.27 |
2.16 |
-4.39 |
|
2004 |
9.64 |
6.80 |
2.85 |
14.71 |
12.34 |
2.37 |
-5.07 |
|
2005 |
10.01 |
7.07 |
2.94 |
15.54 |
13.16 |
2.39 |
-5.53 |
|
2006 |
10.66 |
7.56 |
3.10 |
16.24 |
13.72 |
2.52 |
-5.58 |
|
2007 |
11.49 |
8.04 |
3.46 |
16.46 |
13.84 |
2.63 |
-4.97 |
|
2008 |
12.49 |
8.78 |
3.70 |
17.40 |
14.57 |
2.83 |
-4.91 |
|
2009 |
10.95 |
7.33 |
3.62 |
13.69 |
10.97 |
2.72 |
-2.74 |
|
2010 |
12.32 |
8.49 |
3.83 |
15.74 |
12.97 |
2.77 |
-3.43 |
|
2011 |
13.53 |
9.41 |
4.12 |
17.26 |
14.42 |
2.84 |
-3.73 |
|
2012 |
13.53 |
9.39 |
4.13 |
17.04 |
14.21 |
2.83 |
-3.51 |
|
2013 |
13.54 |
9.29 |
4.26 |
16.47 |
13.68 |
2.79 |
-2.92 |
|
2014 |
13.53 |
9.22 |
4.32 |
16.43 |
13.65 |
2.78 |
-2.90 |
|
2015 |
12.43 |
8.20 |
4.23 |
15.29 |
12.55 |
2.74 |
-2.86 |
|
2016 |
11.85 |
7.71 |
4.14 |
14.64 |
11.87 |
2.76 |
-2.78 |
|
2017 |
12.06 |
7.88 |
4.18 |
15.03 |
12.21 |
2.82 |
-2.97 |
Source: U.S. Department of Commerce, Bureau of Economic Analysis.
Below are some recent CRS reports and products on international trade developments:
- CRS Report R45420, U.S. Trade Trends and Developments, by Andres B. Schwarzenberg.
- CRS Report R44717, International Trade and Finance: Overview and Issues for the 115th Congress, coordinated by Mary A. Irace and Rebecca M. Nelson.
- CRS Report R45148, U.S. Trade Policy Primer: Frequently Asked Questions, coordinated by Cathleen D. Cimino-Isaacs.
- CRS Report R44546, The Economic Effects of Trade: Overview and Policy Challenges, by James K. Jackson.
- CRS Insight IN10972, Global Trade Imbalances, by James K. Jackson.
- CRS In Focus IF10619, The U.S. Trade Deficit: An Overview, by James K. Jackson.
- CRS Report R45243, Trade Deficits and U.S. Trade Policy, by James K. Jackson.
- CRS Report R44044, U.S. Trade with Free Trade Agreement (FTA) Partners, by James K. Jackson.
- CRS In Focus IF10161, International Trade Agreements and Job Estimates, by James K. Jackson.
- CRS Report R45198, Bilateral and Regional Trade Agreements: Issues for Congress, by Brock R. Williams.
- CRS In Focus IF10030, U.S.-China Trade Issues, by Wayne M. Morrison.
- CRS Report RL33536, China-U.S. Trade Issues, by Wayne M. Morrison.