Funding and Financing Highways and Public Transportation
For many years, federal surface transportation programs were funded almost entirely from taxes on motor fuels deposited in the Highway Trust Fund. The tax rates, which are fixed in terms of cents per gallon, have not been increased at the federal level since 1993. Meanwhile, motor fuel consumption is projected to decline due to improved fuel efficiency, increased use of electric vehicles, and slow growth in vehicle miles traveled. In consequence, revenue flowing into the Highway Trust Fund has been insufficient to support the surface transportation program authorized by Congress since 2008.
Congress has yet to address the surface transportation program’s fundamental revenue issues, and has given limited consideration to raising fuel taxes in recent years. Instead, since 2008 Congress has supported the federal surface transportation program by supplementing fuel tax revenues with transfers from the U.S. Treasury general fund. The most recent reauthorization act, the Fixing America’s Surface Transportation Act (FAST Act; P.L. 114-94), authorized spending on federal highway and public transportation programs through September 30, 2020. The act provided $70 billion in general fund transfers to the Highway Trust Fund for FY2016 through FY2020. This use of general fund transfers to supplement the Highway Trust Fund will have been the de facto funding policy for 12 years when the FAST Act expires. Congressional Budget Office (CBO) projections indicate that the Highway Trust Fund insufficiency relative to spending will reemerge following expiration of the FAST Act. The projections indicate a shortfall of $68.8 billion over the first five years following the FAST Act, and $90.7 billion over the first six years. These projections do not reflect the possible impact on revenues of the economic downturn related to the COVID-19 pandemic.
As the September 2020 expiration of the FAST Act approaches, Congress may again examine adjustments to the funding and financing of the federal role in surface transportation.
Raising motor fuel taxes could provide the Highway Trust Fund with sufficient revenue to fully fund the program in the near term, but may not be a viable long-term solution due to expected declines in fuel consumption. It would also not address the equity issue arising from the increasing number of personal and commercial vehicles that are powered electrically and therefore do not pay motor fuel taxes.
Replacing motor fuel taxes with a vehicle miles traveled (VMT) charge would need to overcome a variety of financial, administrative, and privacy barriers, but could be a solution in the longer term.
Treasury general fund transfers could continue to be used to make up for the Highway Trust Fund’s projected shortfalls but could require budget offsets of an equal amount.
The political difficulty of adequately funding the Highway Trust Fund could lead Congress to consider altering the trust fund system or eliminating it altogether. This might involve a reallocation of responsibilities and obligations among federal, state, and local governments.
Some surface transportation needs can be met by private investment, including public-private partnerships, and federal loans from the Transportation Infrastructure Finance and Innovation Act (TIFIA) program. If it desires to promote private investment in transportation infrastructure, Congress could consider asset recycling incentive grants to state and local governments for the sale or lease of government-owned infrastructure if the proceeds are committed to new infrastructure.
Tolling may be an effective way to finance specific roads, bridges, or tunnels that are likely to have heavy use and are located such that the tolls are difficult to evade. All revenue from tolls flows to the state or local agencies or private entities that operate tolled facilities; the federal government does not collect any revenue from tolls. However, a major expansion of tolling might reduce the need for federal expenditures on roads. Tolls and private investment are unlikely to provide broad financial support for surface transportation needs, and many projects are not well suited to alternative financing.
Funding and Financing Highways and Public Transportation
Jump to Main Text of Report
Contents
- Introduction
- The Highway Trust Fund Revenue Dilemma
- What Congress Faces
- The Underlying Problem: HTF Spending Exceeds Revenues
- The Resulting Funding Shortfalls
- Existing Highway Fuel Taxes
- How the Rates Have Been Raised Since 1983
- The "Great Compromise" and the Highway "User Fee"
- 50/50 Share: Deficit Reduction/Highway Trust Fund
- More for Deficit Reduction
- Alternatives for HTF Revenue
- "Fixing" the Gas Tax
- Switching to Sales Taxes
- Vehicle Miles Traveled Charges (VMT)
- A Truck-Only VMT
- VMT Charges and Non-highway Programs
- Carbon Taxes
- Electric Vehicle Fees/Taxes
- Other Options to Preserve the Highway Trust Fund
- The Future of the Trust Fund
- Making a General Fund Share Permanent
- Toll Financing of Federal-Aid System Highways
- Options for Expanded Use of Tolling
- Value Capture
- Public-Private Partnerships (P3s)
- Asset Recycling
- Municipal Bonds
- Transportation Infrastructure Finance and Innovation Act (TIFIA)
- National Infrastructure Bank
- State Infrastructure Banks
Summary
For many years, federal surface transportation programs were funded almost entirely from taxes on motor fuels deposited in the Highway Trust Fund. The tax rates, which are fixed in terms of cents per gallon, have not been increased at the federal level since 1993. Meanwhile, motor fuel consumption is projected to decline due to improved fuel efficiency, increased use of electric vehicles, and slow growth in vehicle miles traveled. In consequence, revenue flowing into the Highway Trust Fund has been insufficient to support the surface transportation program authorized by Congress since 2008.
Congress has yet to address the surface transportation program's fundamental revenue issues, and has given limited consideration to raising fuel taxes in recent years. Instead, since 2008 Congress has supported the federal surface transportation program by supplementing fuel tax revenues with transfers from the U.S. Treasury general fund. The most recent reauthorization act, the Fixing America's Surface Transportation Act (FAST Act; P.L. 114-94), authorized spending on federal highway and public transportation programs through September 30, 2020. The act provided $70 billion in general fund transfers to the Highway Trust Fund for FY2016 through FY2020. This use of general fund transfers to supplement the Highway Trust Fund will have been the de facto funding policy for 12 years when the FAST Act expires. Congressional Budget Office (CBO) projections indicate that the Highway Trust Fund insufficiency relative to spending will reemerge following expiration of the FAST Act. The projections indicate a shortfall of $68.8 billion over the first five years following the FAST Act, and $90.7 billion over the first six years. These projections do not reflect the possible impact on revenues of the economic downturn related to the COVID-19 pandemic.
As the September 2020 expiration of the FAST Act approaches, Congress may again examine adjustments to the funding and financing of the federal role in surface transportation.
- Raising motor fuel taxes could provide the Highway Trust Fund with sufficient revenue to fully fund the program in the near term, but may not be a viable long-term solution due to expected declines in fuel consumption. It would also not address the equity issue arising from the increasing number of personal and commercial vehicles that are powered electrically and therefore do not pay motor fuel taxes.
- Replacing motor fuel taxes with a vehicle miles traveled (VMT) charge would need to overcome a variety of financial, administrative, and privacy barriers, but could be a solution in the longer term.
- Treasury general fund transfers could continue to be used to make up for the Highway Trust Fund's projected shortfalls but could require budget offsets of an equal amount.
The political difficulty of adequately funding the Highway Trust Fund could lead Congress to consider altering the trust fund system or eliminating it altogether. This might involve a reallocation of responsibilities and obligations among federal, state, and local governments.
Some surface transportation needs can be met by private investment, including public-private partnerships, and federal loans from the Transportation Infrastructure Finance and Innovation Act (TIFIA) program. If it desires to promote private investment in transportation infrastructure, Congress could consider asset recycling incentive grants to state and local governments for the sale or lease of government-owned infrastructure if the proceeds are committed to new infrastructure.
Tolling may be an effective way to finance specific roads, bridges, or tunnels that are likely to have heavy use and are located such that the tolls are difficult to evade. All revenue from tolls flows to the state or local agencies or private entities that operate tolled facilities; the federal government does not collect any revenue from tolls. However, a major expansion of tolling might reduce the need for federal expenditures on roads. Tolls and private investment are unlikely to provide broad financial support for surface transportation needs, and many projects are not well suited to alternative financing.
Introduction
Almost every conversation about surface transportation finance begins with a two-part question: What are the "needs" of the national transportation system, and how does the nation pay for them? This report is aimed almost entirely at discussing the "how to pay for them" question. Since 1956, federal surface transportation programs have been funded largely by taxes on motor fuels that flow into the Highway Trust Fund (HTF). A steady increase in the revenues flowing into the HTF due to increased motor vehicle use and occasional increases in fuel tax rates accommodated growth in surface transportation spending over several decades. In 2001, though, trust fund revenues stopped growing faster than spending. In 2008 Congress began providing Treasury general fund transfers to keep the HTF solvent.1
Every year since 2008, there has been a gap between the dedicated tax revenues flowing into the HTF and the cost of the surface transportation spending Congress has authorized. Congress has filled these shortfalls by transfers, largely from the general fund, that have shifted a total of $143.6 billion to the HTF (roughly 22% of outlays).2 The last $70 billion of these transfers were authorized in the Fixing America's Surface Transportation Act (FAST Act; P.L. 114-94), which was signed by President Barack Obama on December 4, 2015.3 The FAST Act funds federal surface transportation programs from FY2016 through FY2020. When the act expires the de facto policy of relying on general fund transfers to sustain the HTF will be 12 years old.
Congressional Budget Office (CBO) projections indicate that the imbalance between motor fuel tax receipts and HTF expenditures will persist beyond FY2020. In consequence, funding and financing surface transportation is expected to continue to be a major issue for Congress.
The Highway Trust Fund Revenue Dilemma
The HTF has two separate accounts—highways and mass transit. The primary revenue sources for these accounts are an 18.3-cent-per-gallon federal tax on gasoline and a 24.3-cent-per-gallon federal tax on diesel fuel. Although the HTF has other sources of revenue, such as truck registration fees and a truck tire tax, and is also credited with interest paid on the fund balances held by the Treasury, fuel taxes in most years provide 85% to 90% of the amounts paid into the fund by highway users. The transit account receives 2.86 cents per gallon of fuel taxes, with the remainder of the tax revenue flowing into the highway account. An additional 0.1-cent-per-gallon fuel tax is reserved for the Leaking Underground Storage Tank (LUST) Fund, which is not part of the transportation program.
Since the trust fund was created in 1956, Congress has increased federal motor fuel taxes four times: in 1959, 1982, 1990, and 1993. Since the 1993 increase, additional changes to the taxation structure have modestly boosted trust fund revenues. However, since 2001, revenue flowing into the HTF has not met expectations in most years.4 The American Jobs Creation Act of 2004 (P.L. 108-357), for example, provided the trust fund with increased future income by changing elements of federal "gasohol" taxation. In 2005, the Safe, Accountable, Flexible, Efficient Transportation Equity Act: A Legacy for Users (P.L. 109-59; SAFETEA) sought to bolster the trust fund by addressing tax fraud. SAFETEA also provided for the transfer of some general fund revenue associated with transportation-related activities to the trust fund. It was believed at the time of SAFETEA's passage that the tax changes, a $12.5 billion unexpended balance in the trust fund, and higher fuel tax revenue due to expected economic growth would be sufficient to finance the surface transportation program through FY2009.5 This prediction proved to be incorrect. Trust fund revenue has generally lagged inflation since FY2007. The shortfalls resulting from the overly optimistic forecasts associated with SAFETEA were rectified by Treasury general fund contributions. In September 2008, Congress enacted a bill that transferred $8 billion from the general fund to shore up the HTF. Other transfers followed (see Table 1).
When the HTF was conceived, annual vehicle miles traveled (VMT), and therefore motor fuel tax revenue, were rising rapidly. That is no longer the case. The Federal Highway Administration (FHWA) projects that VMT will grow at an average of roughly 1.1% per year over the next 20 years.6 Meanwhile, other policy changes are weakening the link between driving activity and motor fuel tax revenues. Improved fuel economy is slowly reducing the average amount of fuel used per mile of travel. The expanding fleets of hybrid and electric vehicles, respectively, pay less or nothing by way of fuel taxes, raising equity issues that are likely to become more prominent as the electric/hybrid vehicle fleet expands.7 Under rules issued in 2012, new passenger cars and light trucks were expected to attain an average fuel economy of 41.0 miles per gallon in model year 2021 and 49.7 miles per gallon in model year 2025.8 However, on March 31, 2020, the Trump Administration finalized a modification of the rule that would now require a 1.5% annual increase in fuel economy for 2021-2026 manufactured vehicles, a substantial reduction form the 5% annual increase required under the previous rule.9 Over time, this change could slow the increase in the average fuel economy of the motor vehicle fleet, which could benefit fuel tax revenues.
An increase in the existing fuel tax rates would provide immediate relief to the trust fund. As a rule of thumb, adding a penny to federal motor fuel taxes provides the trust fund with roughly $1.7 billion to $1.8 billion per year.10 The prospect of reduced motor fuel consumption, however, casts doubt on the ability of the motor fuel taxes to support increased surface transportation spending beyond the next decade, even with significant increases in tax rates.
Table 1. Transfers to the Highway Trust Fund
(in billions of dollars; reflects sequestration for FY2013 and FY2014)
|
Public Law |
Effective Date |
Highway Account |
Mass Transit Account |
Highway Trust Fund Total |
||||||
|
Sept. 15, 2008 |
|
|
|
|||||||
|
Aug. 7, 2009 |
|
|
|
|||||||
|
Mar. 18, 2010 |
|
|
|
|||||||
|
July 6, 2012 |
|
|||||||||
|
From LUST |
For FY2012 |
|
|
|
||||||
|
From general fund |
For FY2013 |
|
|
|
||||||
|
From general fund |
For FY2014 |
|
|
|
||||||
|
Aug. 8, 2014 |
|
|
|
|||||||
|
From LUST |
Aug. 8, 2014 |
|
|
|
||||||
|
July 31, 2015 |
|
|
|
|||||||
|
|
|
|
||||||||
|
From general fund |
Dec. 4, 2015 |
|
|
|
||||||
|
From LUST |
Dec. 4, 2015 |
|
|
|
||||||
|
From LUST |
Oct. 1, 2016 |
|
|
|
||||||
|
From LUST |
Oct. 1, 2017 |
|
|
|
||||||
|
General fund total |
|
|
|
|||||||
|
LUST fund total |
|
|
|
|||||||
|
Total transfers |
|
|
|
|||||||
Sources: Public laws as indicated. Sequestration amounts from FHWA.
Notes: Transfers are from the Treasury's general fund unless indicated. LUST refers to the Leaking Underground Storage Tank Trust Fund administered by the Environmental Protection Agency.
What Congress Faces
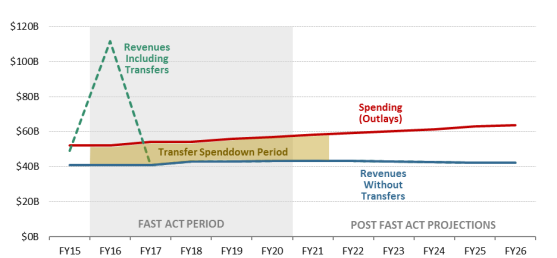
CBO projects that from FY2021 to FY2026 the gap between dedicated surface transportation revenues and spending will average roughly $18 billion annually (Table 2).11 In 2020, as Congress considers surface transportation reauthorization, it could again face a choice between finding new sources of income for the surface transportation program and settling for a smaller program, which might look very different from the one currently in place. Figure 1 shows the impact of the general fund transfers within the context of the underlying imbalance between HTF revenues and projected spending for FY2018-FY2026.
The closures and stay-at-home orders implemented in response to the COVID-19 pandemic may make the HTF's funding shortfall more severe. As many employers closed or shifted to telework and fewer Americans drove to work, gasoline tax revenues will likely fall below projections. If states continue road projects as planned, the highway account balance could approach zero sooner than previously expected unless Congress provides additional funds. CBO's March 2020 projection did not consider the impact of COVID-19 on HTF revenues and spending.
The Underlying Problem: HTF Spending Exceeds Revenues
Table 2 provides projections of the gap between HTF receipts and outlays following the expiration of the FAST Act at the end of FY2020. In recent decades, Congress has typically sought to reauthorize surface transportation programs for periods of five or six years. As the table indicates, a five-year reauthorization beginning in FY2021 faces a projected gap between revenues and outlays of $87.8 billion. A six-year reauthorization would face a gap of $109.7 billion.12 These projections assume that spending on federal highway and public transportation programs would remain as it is today, adjusted for anticipated inflation.
|
Fiscal Year |
HTF Revenue |
HTF Outlays |
Difference |
||||||
|
2021 |
|
|
|
||||||
|
2022 |
|
|
|
||||||
|
2023 |
|
|
|
||||||
|
2024 |
|
|
|
||||||
|
2025 |
|
|
|
||||||
|
2026 |
|
|
|
||||||
|
5-YR: FY2021-2025 total |
|
|
|
||||||
|
5-YR: FY2021-2025 average |
|
|
|
||||||
|
6-YR: FY2021-2026 total |
|
|
|
||||||
|
6-YR: FY2021-2026 average |
|
|
|
Source: CRS calculations based on CBO, Highway Trust Fund Projections: March 6, 2020 HTF Baseline 2019-2030.
Notes: Includes combined figures from both the highway account and the mass transit account. The "HTF Revenue" column includes interest on the HTF balances. Numbers may not add due to rounding. Revenue projections do not account for effects of COVID-19 pandemic.
The Resulting Funding Shortfalls
When the FAST Act expires at the end of FY2020, the balance in the HTF is expected to be $18.97 billion—an amount equal to about four months of outlays. CBO projects that this balance, plus incoming revenue, will allow the Federal Highway Administration (FHWA) and the Federal Transit Administration (FTA) to pay their obligations to states and transit agencies until late in FY2021. However, without a reduction in the size of the surface transportation programs, an increase in revenues, or further general fund transfers, the combined balance in the HTF is projected to be close to zero in the first month of FY2022 (see Table 3). However, the mass transit account is in worse condition than the highway account and is expected to approach zero earlier, near the end of FY2021. At that point, FTA would likely have to delay payments for completed work. FHWA would have likely have to delay payments sometime in October of 2022.13
|
2021 |
2022 |
2023 |
2024 |
2025 |
2026 |
|||||||||||||
|
Start-of-year HTF balancea |
|
|
|
|
|
|
||||||||||||
|
Revenues minus outlays |
|
|
|
|
|
|
||||||||||||
|
End-of-year HTF shortfall |
|
|
|
|
|
|
Source: CBO, Highway Trust Fund Projections: March 6, 2020 HTF Baseline 2019-2030.
Notes: Includes combined figures from both the highway account and the mass transit account. Numbers may not add due to rounding of the underlying data. Projections do not account for effects of the COVID-19 pandemic on HTF revenues.
a. Under current law, the HTF cannot incur negative balances.
These projections predate the impact of COVID-19 and its countermeasures. The sheltering in place and reduction in travel as well as the impact of an expected general recession will almost certainly lower the revenue flow to the HTF, which could mean that the balance in the fund could approach zero sooner.
Based strictly on projected income and expenses, the HTF would move from a positive balance of $18.97 billion at the start of FY2021 to a negative balance of $68.8 billion at the end of FY2025. However, current law does not allow the HTF to incur negative balances. Unless this is changed, $68.8 billion represents the minimum amount the House Ways and Means Committee and the Senate Committee on Finance would need to find over the FY2021-FY2025 period in some combination of additional revenue for general fund transfers, should Congress choose to continue funding surface transportation at the current, or "baseline," level, adjusted for inflation.14 Because the HTF currently provides all but about $2 billion of annual spending authorized for the highway and transit programs (the main exception being the FTA Capital Investment Grants Program), these numbers have implications for the size of the program Congress may approve to follow the FAST Act.
Highway and transit spending based solely on the revenue projected to flow into the HTF under current law would be limited to roughly $43.4 billion in FY2021, significantly less than the "baseline" FY2021 outlays of roughly $58.2 billion. The projected stagnation and eventual FY2026 decline in HTF revenue implies that once expected inflation is factored in, FHWA and FTA would have less contract authority in each year to spend on projects through FY2026.15
Reducing expenditures would not provide immediate relief from the demands on the HTF. Because transportation projects can take years to complete, both the highway and public transportation programs must make payments in future years pursuant to commitments that have already been incurred. As of FY2021, obligated but unspent contract authority for highway projects in progress is projected to be roughly $66 billion. This does not count another $19 billion in available but unobligated contract authority. For public transportation programs the equivalent figures for FY2021 are projected to be $20 billion in unpaid obligations and another $11 billion in unobligated contract authority.16 The obligated amounts represent legal obligations of the U.S. government and must be paid out of future years' HTF receipts.
On February 9, 2018, President Trump signed the Bipartisan Budget Act of 2018 (P.L. 115-123), which raised the ceilings on non-defense discretionary spending for FY2018 and FY2019 by $63.3 billion and $67.5 billion, respectively. House and Senate leaders agreed to work with the appropriators to ensure that at least $10 billion per year of these additional outlays would be provided for infrastructure, including surface transportation.17 The Consolidated Appropriations Act, 2018 (P.L. 115-141), provided additional infrastructure funding from the general fund in accordance with the Bipartisan Budget Act, including $2.834 billion for programs normally funded from the HTF. The Consolidated Appropriations Act, 2019 (P.L. 116-6), provided an additional $3.950 billion. The Further Consolidated Appropriations Act, 2019 (P.L. 116-94), provided an additional $2.166 billion for highways. These funds were not credited to the HTF, however, and have no impact on HTF solvency. After three years of such funding the case can be made that there are in effect two paths of highway funding: the authorization path and the appropriations path.
Existing Highway Fuel Taxes18
The first federal tax on gasoline (1 cent per gallon) was imposed in 1932, during the Hoover Administration, as a deficit-reduction measure following the depression-induced fall in general revenues. The rate was raised to help pay for World War II (to 1.5 cents per gallon) and raised again during the Korean War (to 2 cents per gallon). The Highway Revenue Act of 1956 (P.L. 84-627) established the HTF and raised the rate to 3 cents per gallon to pay for the construction of the Interstate Highway System. The Federal-Aid Highway Act of 1959 (P.L. 86-342) raised the rate to 4 cents per gallon. The gasoline tax remained at 4 cents from October 1, 1959, until March 31, 1983. During this period, revenues grew automatically from year to year as fuel consumption grew along with increases in vehicle miles traveled.
Since 1983 lawmakers have passed legislation raising the tax rates on highway fuel use three times. Although infrequent, these rate increases were quite large in a proportional sense. The gasoline tax was raised on April 1, 1983, from 4 to 9 cents per gallon, a 125% increase; on September 1, 1990, from 9 to 14 cents (not counting the additional 0.1 cent for LUST), or 55%; and on October 1, 1993, from 14 to 18.3 cents, or 31%.19
How the Rates Have Been Raised Since 1983
Increasing the rate of the fuel taxes has never been popular. The last three increases were accomplished with difficulty and were influenced by the broader budgetary environment and the politics of the time.20
The "Great Compromise" and the Highway "User Fee"
The increase in the fuel tax rate under the Surface Transportation Assistance Act of 1982 (STAA; P.L. 97-424, Title V) occurred in the lame-duck session of the 97th Congress. In the "Great Compromise," supporters of increased highway spending had come to an agreement with transit supporters (mostly from the Northeast) that a penny of a proposed 5-cents-per-gallon increase would be dedicated to a new mass transit account within the HTF. This meant that support for the bill during the lame-duck session was widespread and bipartisan. President Reagan's opposition to an increase in the "gas tax" softened during the lame-duck session. On November 23, 1982, he announced that he would support passage of STAA because "Our country's outstanding highway system was built on the user fee principle—that those who benefit from a use should share in its cost."21 Nonetheless, the bill faced a series of filibusters in the Senate, which were eventually overcome by four cloture votes. The conference report was again filibustered, and President Reagan helped secure the votes needed for cloture. President Reagan signed STAA into law on January 6, 1983, more than doubling the highway fuel tax to 9 cents per gallon.22
50/50 Share: Deficit Reduction/Highway Trust Fund
The Omnibus Budget Reconciliation Act of 1990 (OBRA90; P.L. 101-508), enacted November 5, 1990, was passed under the pressure of impending final FY1991 sequestration orders issued by President George H. W. Bush under Title II of P.L. 99-177, the Balanced Budget and Emergency Deficit Control Act of 1985, also known as the Gramm-Rudman-Hollings Act (GRH). OBRA90 included budget cuts, tax changes, and the Budget Enforcement Act (P.L. 101-508), which rescinded the FY1991 sequestration orders. OBRA90 also raised the tax on gasoline by 5 cents per gallon, to 14 cents. Half the increase went to the HTF (2 cents to the highway account and 0.5 cents to the mass transit account), with the other 2.5 cents per gallon to be deposited in the general fund for deficit reduction. This was the first time since 1957 the motor fuel tax had been used as a source of general revenue. Section 9001 expressed the sense of Congress that all motor fuel taxes should be directed to the HTF as soon as possible.
More for Deficit Reduction
The Omnibus Budget Reconciliation Act of 1993 (OBRA93; P.L. 103-66) Section 13241(a) made further changes in regard to fuel taxes
- The 2.5-cents-per-gallon fuel tax dedicated to deficit reduction in OBRA90 was redirected to the HTF beginning October 1, 1995, and its authorization was extended to September 30, 1999.
- The highway account received 2 cents per gallon and the mass transit account 0.5 cents per gallon of the rededicated amount.
- An additional permanent 4.3-cents-per-gallon fuel tax took effect in October 1993 and was dedicated to deficit reduction.
This brought the gasoline tax to 18.3 cents per gallon, although for two years (October 1, 1993, to October 1, 1995) 6.8 cents per gallon of this was deposited in the general fund. On October 1, 1995, the amount going to the general fund dropped to 4.3 cents per gallon, and the amount dedicated to the HTF increased to 14 cents per gallon. Subsequently, under the Taxpayer Relief Act of 1997 (P.L. 105-34), all motor fuel tax revenue was redirected to the HTF. (The LUST fund continues to receive the revenue from an additional 0.1 cents-per-gallon tax.)
Alternatives for HTF Revenue
The political difficulty of increasing motor fuel taxes has led to interest in alternative approaches for supporting the HTF. Among options that have been proposed are the following:
"Fixing" the Gas Tax
A differently designed gas tax might be indexed to both inflation (either inflation generally or highway construction cost inflation) and fuel-efficiency improvements.23 This new design could be imposed after raising the current gas tax rate to compensate for the loss in purchasing power since the last rate increase in 1993.24
If the motor fuel taxes for gasoline and diesel had been adjusted in 2019 to keep pace with the change in the Bureau of Labor Statistics' consumer price index (CPI) since 1993, the 18.3-cents-per-gallon gasoline tax would now be roughly 33 cents per gallon, and the 24.3-cents-per-gallon diesel tax would be 43.8 cents per gallon. Consequently, the first step in implementing this method of "fixing" the gas tax would be to raise the base tax rate for gasoline by roughly 14.7 cents per gallon and to raise the rate for diesel by roughly 19.5 cents per gallon. Future adjustments would depend on the inflation rate in future years. The CPI has nothing to do with road construction costs. Using an index based on road construction costs would require an even larger adjustment.25
Tax-rate adjustments to make up for revenue lost due to greater fuel efficiency could be determined by dividing miles driven by vehicle category by the total amount of fuel consumed by that category and comparing the quotient to the previous year. Although fuel-economy standards for new vehicles are to rise over the next few years, the average efficiency of the entire vehicle fleet will rise slowly because of the large number of older vehicles on the road.
Switching to Sales Taxes
Under the sales tax concept, the federal motor fuel taxes would be assessed as a percentage of the retail price of fuel rather than as a fixed amount per gallon. Some states already levy taxes on motor fuels in this way, either alongside or in place of fixed cents-per-gallon taxes on motor fuel purchases.
If fuel prices rise in the future, sales tax revenues could rise from year to year even if consumption does not increase. Conversely, however, a decline in motor fuel prices could lead to a drop in sales tax revenue. Many states that tied fuel taxes to prices after the price shocks of the 1970s encountered revenue shortfalls in the 1980s, when fuel prices fell dramatically. Over a 20-year period, most of these variable state fuel taxes disappeared.26 In 2013, Virginia eliminated its cents-per-gallon fuel taxes in favor of a sales tax on fuel and a general sales tax increase that was dedicated to transportation purposes. The Virginia law mandates that the tax be imposed on the average wholesale price (calculated twice each year) but sets price floors; if prices of motor fuels fall beneath those floors, the amount of fuel tax charged per gallon is not reduced further.27
A federal sales tax on motor fuel would likely be at best an interim solution to the long-term problem of financing transportation infrastructure because, as with the current motor fuel tax, it relies on fuel consumption to fund transportation programs. To the extent that improved vehicle efficiency or adoption of hybrid or electric vehicles leads to long-term declines in fuel usage, a sales tax on fuel may not lead to increases in trust fund revenues.28
Vehicle Miles Traveled Charges (VMT)
Economists have long favored mileage-based user charges as an alternative source of highway funding. Under the user charge concept, motorists would pay fees based on distance driven and, perhaps, on other costs of road use, such as wear and tear on roads, traffic congestion, and air pollution. The funds collected would be spent for surface transportation purposes.29
The concept is not new: federal motor fuel taxes are a form of indirect road user charge insofar as road use is loosely related to fuel consumption. Some states have charged trucks by the mile for many years, and toll roads charge drivers based on miles traveled and the number of axles on a vehicle, which is used as a proxy for weight. Recent technological developments, as well as the evident shortcomings of motor fuel taxes, have led to renewed interest in the user charge concept, including funding for pilot programs included in the FAST Act.
VMT charges, also referred to as mileage-based road user charges, could range from a flat cent-per-mile charge based on a simple odometer reading to a variable charge based on vehicle movements tracked by Global Positioning System (GPS). Other proposals envision VMT charges that would mimic the way Americans now pay their fuel taxes by collecting the charge at the pump, but a different method would be required to obtain payment from electric vehicle users.
Implementation of a VMT charge would have to overcome a number of potential disadvantages relative to the motor fuel tax, including public concern about personal privacy; higher collection and enforcement costs (estimates range from 5% to 13% of collections); the administrative challenge of collecting the charge from roughly 268 million vehicles;30 and the setting and adjusting of VMT rates, which would likely be as controversial as increasing motor fuel taxes. Another issue is how to collect the charge from drivers who have no bank accounts or credit/debit cards.
A nationwide VMT charge would be analogous to a national toll. This raises the prospect that vehicles using toll roads might be charged twice, although this effectively happens now in that toll-road users also pay tax on the motor fuel they consume while using the toll road. Technically, it would be possible for a VMT charge to replace an existing toll, but this could cause complications with respect to the servicing of bonds funded by toll-road revenue.
A Truck-Only VMT
Imposing a VMT on heavy trucks only,31 as has been done in Germany, might be less onerous to implement because it would avoid the privacy objections, would involve a much smaller number of collection points, and might avoid the equipment issues automobiles would face if commercial trucks' electronic logging devices prove adaptable to charging a VMT. A truck-only VMT concept has already run into stiff opposition from trucking interests, who object to being singled out for a tax that could logically be charged to all highway vehicles.32 A national VMT on heavy trucks could also face tax administration issues. To achieve the greatest savings in costs of collection, taking full advantage of the economies of scale available at the national level, the Internal Revenue Service would need to devise a means of collection that provides for direct payment to the federal government, that is easy to administer and difficult to evade. The cost of collection of the federal motor fuel taxes is less than 1 cent per dollar of revenue, while the cost to the German government of payments to Toll Collect, the contractor that collects its truck VMT, is estimated to be as high as 13% of annual revenues.33
VMT Charges and Non-highway Programs
Since 1982, the HTF has financed most federal public transportation programs as well as highway programs. If a VMT charge were to be used strictly for highway purposes, it might reasonably be characterized as a user fee even if the amount paid by each individual driver does not correspond precisely to the social cost (such as pollution and traffic congestion costs) of that user's driving. A VMT charge that funded both highways and public transportation might arguably be seen more as a tax than a user fee. This distinction raises a number of legal issues.34 Any legislation establishing a VMT charge would, at a minimum, have to clearly identify what the charge would be spent on. If the existing HTF were to be retained, legislation would have to specify what share of the revenue would be credited to the separate highway and mass transit accounts within the fund.
Carbon Taxes
A carbon tax would be assessed on emissions of carbon dioxide and other greenhouse gases. Its scope might include manufacturing facilities, power plants, and transportation.35 A share of revenues from a carbon tax could be dedicated to federal transportation programs, either directly or via existing transportation trust funds such as the HTF or the Airport and Airway Trust Fund. The revenues could either replace or supplement current transportation taxes such as the motor fuel taxes. CBO estimated that a carbon tax of $25 per metric ton in effect January 1, 2019, would increase federal revenues by $1.099 billion between 2019 and 2028 after adjusting for tax revenue losses related to increased business costs. The projection assumed the tax would increase at an annual rate of 2%, indexed for inflation. 36 The effect of a carbon tax on the HTF would depend on the design of the tax and the use of the revenue it generates.
Electric Vehicle Fees/Taxes
Since electric vehicles do not burn taxed motor fuels, their wider use could further weaken the sustainability of the HTF. In the near term, however, the impact of electric vehicles on HTF revenue is expected to be modest. In 2018 plug-in vehicles accounted for 2.1% of U.S. light vehicle sales. As of September 2019, roughly 1,447,000 plug-in vehicles had been sold in the United States since their 2010 introduction.37 They comprise roughly 1.3% of registered automobiles.38 If each electric vehicle is assumed to replace a light duty vehicle that consumes 475 gallons of petroleum-based fuel per year, roughly $126 million in annual revenue is lost to the HTF.39 Even if electric vehicle sales grow rapidly, a significant impact on annual HTF revenues is likely to be roughly eight to 10 years in the future.
As of 2019, 23 states had some form of tax or fee on electric vehicles.40 In most cases, the revenue from such fees is dedicated to transportation. Although sales and mileage fees have been considered, the most common form of tax is a flat fee paid annually at registration. Congress could consider imposing a similar federal fee. However, if Congress structures a federal registration fee in a way that mandates the states to implement the federal program, unrelated to the provision of federal funds, the fee might be challenged in court on constitutional grounds.41
Other Options to Preserve the Highway Trust Fund
A wide range of additional proposals has been suggested to generate revenue for the HTF. These proposals largely originated from the work of two commissions established pursuant to SAFETEA and of groups such as the American Association of State Highway and Transportation Officials (AASHTO) and the Transportation Research Board (TRB).42 For example, AASHTO's "Matrix of Illustrative Surface Transportation Revenue Options" lists 37 potential HTF revenue options with yield estimates in tabular form.43 Many of these options involve taxes on freight movements or energy. It should be emphasized that the revenue estimates from these exercises are merely suggestive; the revenue obtained from any given measure would depend on changes in the price of motor fuels, growth in the number of annual auto registrations, and other factors.
The Future of the Trust Fund
The HTF was set up as a temporary device that was supposed to disappear when the Interstate System was finished. It has endured, and its breadth of financing has expanded well beyond the Interstates, most significantly with the 1982 creation of the mass transit account within the HTF to support public transportation spending. But the HTF is not essential to a federal role in transportation funding. Congress routinely funds large infrastructure projects, such as those constructed by the Army Corps of Engineers, from general fund appropriations. Before 1956, it funded highway projects using annual appropriations. As recently as the 1990s, significant highway programs such as the Appalachian Development Highway System were funded from the general fund.
If Congress chooses not to impose new taxes and fees dedicated to the HTF, it could still maintain or expand the surface transportation program with general fund monies. Any of the revenues from the HTF financing options discussed above could also be deposited into the general fund rather than the HTF if Congress considers alternatives to the trust fund financing model. Possible alternatives include the following:
Eliminate the Trust Fund. This would do away with the complicated budget framework of contract authority, obligations, and apportionments.44 Surface transportation would be forced to compete with other federal programs for funding each year, possibly affecting the level of funding provided for transportation.
There could be advantages to moving away from trust fund financing of surface transportation. Until recently, one of the most intractable arguments in reauthorization debates concerned which states were "donors" to transportation programs and which were "donees." Donor states were states whose highway users were estimated to pay more to the highway account of the HTF than they received. Donee states received more than they paid. The donor-donee dispute was unique to the federal highway program, and occurred largely because of the ability to track federal fuel tax revenues by state. This issue has faded as HTF shortfalls have been resolved with injections of general fund transfers to the fund. These general fund monies transferred into the HTF have nothing to do with highway tax revenues, but have made nearly all states donees. The donor-donee issue would likely disappear entirely if transportation-related taxes were deposited into the general fund instead of the trust fund. This would provide Congress with greater flexibility to allocate funding among various transportation modes and between transportation and nontransportation uses. However, treating fuel taxes as just another source of federal revenue would weaken the long-standing link between road user charges and program spending.
Most trust-fund outlays take the form of formula grants over which states have a great deal of spending discretion. While there are numerous federal requirements attached to trust fund expenditures, there have been until recently relatively few performance-oriented goals that the states are required to meet in selecting projects to be undertaken with federal monies. Performance measures might be easier to implement without formula programs that automatically apportion funding to the states. However, this may not be the case; performance measures in recent years have been imposed on the Federal-Aid highway programs as they are currently structured, although implementation has been slow.45
Eliminating the trust fund might also allow for creativity in thinking about the provision of transportation infrastructure across the modal boundaries that now define much of federal transportation spending. Historically, important parts of U.S. transportation infrastructure, such as the transcontinental railroads and the Panama Canal, were authorized by specific congressional enactments rather than grant programs. Reconsidering the trust fund structure might reopen discussion of this approach.
Devote HTF Revenues Exclusively to Highways. This option would leave transit and other surface transportation programs to be funded entirely by annual appropriations of general funds or devolved to the states. However, even if all HTF revenues were dedicated to highways, the HTF is projected to face annual shortfalls beginning in FY2024. According to CBO, annual HTF revenue is projected to be almost $20 billion less than the cost of maintaining the present level of highway spending, adjusted for inflation, in FY2026, even if no HTF money goes to public transportation.46 Such a change would also have political implications. Since the early 1990s, public transportation and cycling advocates, environmentalists, and a wide range of other groups have become full-fledged supporters of the surface transportation program. They might be less enthusiastic about supporting a program that does not address their interests.
"Devolve" Surface Transportation Programs to the States. The federal government could devolve most federal responsibility for highways and public transportation to the states. Under devolution proposals, the federal taxes that now support surface transportation programs, mostly fuel taxes, would be reduced accordingly, leaving individual states to raise their own taxes to pay for highway and transit projects as they see fit. A small program, funded by much-reduced motor fuel taxes, would remain in place at the federal level to maintain roads on federal lands, fund highway safety efforts, and support other programs Congress decides not to devolve.47
By enacting the FAST Act, Congress chose to support the current funding model by transferring funds into the HTF, mostly from the Treasury general fund. Whether such general fund support should continue is likely to become a major point of contention when Congress debates reauthorizing surface transportation programs beyond FY2020.
Making a General Fund Share Permanent
By FY2020, the last year of the FAST Act, federal highway programs will have been funded for 12 years under a de facto policy of providing a Treasury general fund share. Congress could address the inadequacy of motor fuel taxes to meet surface transportation needs by making the general fund share permanent.
The public transportation titles of surface transportation bills already fund the Capital Investment Grants program through appropriations from the general fund. The Federal Aviation Administration (FAA) budget is also supported by a combination of trust funds and general funds; the general fund amount is supposed to approximate the value of the airways system to military and other government users and to "societal" nonusers (people who do not fly but, for example, benefit from the delivery of freight via aircraft).48 A similar argument could be made regarding the public good benefits of a well-functioning highway system to justify an annual general fund appropriation to support spending on roads.49
Should Congress agree on a future policy of providing an annual general fund share for federal highway funding, the financing structure of the federal-aid highways program could change. Congress would have the choice of appropriating the general fund share to the HTF and maintaining the programmatic status quo, or it could fund some programs from the trust fund and fund others via appropriations. Congress could also consider a two-pronged approach to authorization. It could authorize the trust funded programs separately from the appropriated programs. This would give Congress the option of approving a very long authorization for trust-funded projects that typically take many years to plan and complete. The long-term authorization could be paired with a series of short-term bills funded with appropriated general funds for programs whose projects are more likely to be completed quickly.50
Toll Financing of Federal-Aid System Highways
Toll roads have a long history in the United States, going back to the early days of the republic. During the 18th century, most were local roads or bridges that could not be built or improved with local government tax revenue alone. However, beginning with the Federal Aid Road Act of 1916 (39 Stat. 355), federal law has included a prohibition on the tolling of roads that benefited from federal funds.51 During the late 1940s and early 1950s, the prospect of toll revenues allowed states to build thousands of miles of limited-access highways without federal aid and much sooner than would have been the case with traditional funding. Despite this, the tolling prohibition was reiterated in the Federal-Aid Highway Act and Highway Revenue Act of 1956 (70 Stat. 374), which authorized funds for the Interstate System, created the HTF, and raised the fuel taxes to pay for their construction. Over the last three decades the prohibition has been moderated so that exceptions to the general ban on tolling now cover the vast majority of federal-aid roads and bridges. There remains a ban on the tolling of existing Interstate System highway surface lane capacity. While new toll facilities have opened in several states, some of those projects have struggled financially.
Generally, there are several levels of restrictions on tolling of federal-aid highways. Non-Interstate System highways and bridges may be converted to toll roads but only after reconstruction or replacement. Existing Interstate System surface lane capacity may not be converted to toll roads except under the auspices of two small pilot programs. Interstate System bridges and tunnels may be converted if they are reconstructed or replaced. New capacity on the federal-aid highway system, including Interstate Highways, generally may be tolled. There are no federal restrictions on tolling of roads that are not part of the federal-aid system.
Options for Expanded Use of Tolling
Highway toll revenue nationwide came to $14.457 billion in FY2016, according to FHWA. While the amount of toll revenue has grown significantly in recent years, toll revenue as a share of total spending on highways has been relatively steady for more than half a century, ranging from roughly 5% to 7%.52 On average, facility owners collected $2.41 million per mile of toll road or bridge in FY2016, but revenue per mile varies greatly among toll facilities.53 All revenue from tolls flows to the state or local agencies or private entities that operate tolled facilities; the federal government does not collect any revenue from tolls. However, a major expansion of tolling might reduce the need for federal expenditures on roads. There are three possible means of increasing revenue from tolling:
- Increase the Extent of Toll Roads. FHWA statistics identify 6,001 tolled miles of roads, bridges, and tunnels as of January 1, 2017,54 a net increase of 1,280 miles, or 27%, over 1990.55 Toll-road mileage comprises 0.6% of the 1,028,217 miles of public roads eligible for federal highway aid.56 While there may be many existing roads on which tolling would be financially feasible, the vast majority of mileage on the federal-aid system probably has too little traffic to make toll collection economically viable.
- Increase the Average Toll per Mile. Raising tolls can be politically challenging, especially when revenue is used for purposes other than building and maintaining the toll facility. Trucking interests frequently raise opposition to rate changes that increase truck tolls relative to automobile tolls. Where roads are operated by private concessionaires, the operators' contracts with state governments typically specify the maximum rate at which tolls can rise. Additionally, large increases can encourage motorists to use competing nontolled routes, thereby reducing their revenue-raising potential.
- Increase Toll-Road Usage. To a great extent, increasing toll road usage is dependent on policies that effectively increase the number of miles tolled and establish toll rates that maximize revenues without discouraging use. However, toll road use is also determined by broad economic and social trends. The financing of many of the toll roads constructed in the 20th century was based on the assumption that the new roads would lead to increased vehicle usage. Although vehicle miles traveled declined in the wake of the recession that began in 2007, vehicle use has been rising again since 2014. If this trend continues it bodes well for toll revenues, which would rise with increasing traffic. On the other hand, if demographic trends and social changes eventually lead to slower growth in personal motor vehicle use, then toll revenues may be constrained in the longer term.
The constraints on these means of increasing revenue from tolling suggest that imposing tolls on individual transportation facilities is likely to be of only limited use in supporting the overall level of highway capital spending. Furthermore, some states, particularly those with low population densities, may have few or no facilities suitable for tolling.57 Toll collection itself can be costly; collection costs on many existing toll roads exceed 10% of revenues. For these reasons, while tolls may be an effective way of financing specific facilities—especially major roads, bridges, or tunnels that are likely to be used heavily and are located such that the tolls are difficult to evade—they would likely be less effective in providing broad financial support for surface transportation programs.
Value Capture
Value capture represents an attempt to cover part or all of the cost of transportation improvements from landowners or developers who benefit from the resulting increase in the value of real property. Value capture revenue mechanisms include tax increment financing, special assessments, development impact fees, negotiated exactions, and joint development.58 The federal role in value capture strategies may be limited, as the Government Accountability Office (GAO) has noted,59 but it is worth describing these strategies to provide a fuller picture of the ways in which they might supplement or supplant more commonly used funding and financing mechanisms.
Value capture is not a new idea. Land developers built and operated streetcar systems in the late 19th century as a way to sell houses on the urban fringe, for example. Much of the recent experience with value capture has been associated with public transit. GAO found that the most widely used mechanism is joint development, in which a real estate project at or near a transit station is pursued cooperatively between the public and private sectors. An example might involve a transit agency leasing the unused space over a station, its "air rights," to a developer in exchange for a regular payment.
Joint development has generated relatively small amounts of money for transit agencies. For example, the Washington Metropolitan Area Transit Authority received about $10 million from joint development in FY2016, about 1% of its operating revenue.60 However, less widely used strategies, such as special assessment districts, are estimated to generate significant amounts of funding for specific projects. In a special assessment district, properties within a defined area are assessed a special tax for a specific purpose. A special assessment district in Seattle produced $25 million of the $53 million (47%) needed to fund the South Lake Union streetcar project.61
There has been less use of value capture in highway projects, but this appears to be changing. Texas, for example, has authorized the use of tax increment financing through the creation of transportation reinvestment zones to help fund highway projects.62 Special assessment districts also have been set up in several states, including Florida and Virginia, to fund highway projects. In Virginia a special assessment district was used to help fund the expansion of Route 28 near Washington Dulles International Airport beginning in the late 1980s.63
Public-Private Partnerships (P3s)
Growing demands on the transportation system and constraints on public resources have led to calls for more private-sector involvement in the provision of highway and transit infrastructure through public-private partnerships (P3s), which can be designed to lessen demands on public-sector funding.64 Private involvement can take a variety of forms, including design-build and design-build-finance-operate agreements. Typically, the "public" in public-private partnerships refers to a state government, local government, or transit agency. The federal government, nevertheless, exerts influence over the prevalence and structure of P3s through its transportation programs, funding, and regulatory oversight.65
To be viable, P3s involving private financing typically require an anticipated project-related revenue stream from a source such as vehicle tolls, freight container fees, or, in the case of transit station development, building rents. Private-sector resources may come from an initial payment to lease an existing asset in exchange for future revenue, as with the Indiana Toll Road and Chicago Skyway, or they may arise from a newly developed asset that creates a new revenue stream. Either way, a facility user fee, such as a toll, is often the key to unlocking private-sector participation and resources.
In some cases, private-sector financing is backed by "availability payments," regular payments made by government to the private entity based on negotiated quality and performance standards of the facility. Aversion in the private sector to the risk that too few users will be willing to pay for use of a new facility, known as demand risk, made availability payment P3s more common during and after the deep recession that began in December 2007.66 This suggests that state and local governments may retain demand risk more often when the economic outlook is more uncertain.
It is frequently asserted that hundreds of billions of dollars of private funds are available globally for infrastructure investment.67 To date, however, the number of transportation P3s in the United States is relatively small, as is the amount of long-term private financing provided. According to one source, from 1993 through September 2017 there were 30 surface transportation P3s involving long-term financing, with total project costs totaling $39 billion. This includes the 99-year lease of the Chicago Skyway; the I-595 managed lanes project in Florida; and the Purple Line light rail transit project in Maryland.68 P3s and private investment in infrastructure, including surface transportation, are relatively larger in many other countries, including Canada, Australia, and the United Kingdom.69
While private investment may grow in the future, many impediments remain. Some of the major ones include the relative attractiveness of the tax-exempt financing available to state and local government, political opposition to tolling and privatization, and difficulties associated with project development. Private-sector financing generated through P3s might best be seen as a supplement to traditional public-sector funding rather than as a substitute.
In addition to attracting private capital, P3s may generate new resources for highway and transit infrastructure in at least two ways. First, P3s may improve efficiency through better management and innovation in construction, maintenance, and operation—in effect providing more infrastructure for the same price. Private companies may be more able to examine the full life-cycle cost of investments, whereas public agency decisions are often tied to short-term budget cycles. Such cost reductions may not materialize, however, if the public sector has to spend a substantial amount of time on procurement, oversight, dispute resolution, and litigation.70
Second, P3s may reduce government agencies' costs by transferring the financial risks of building, maintaining, and operating infrastructure to private investors. These risks include construction delays, unexpectedly high maintenance costs, and the possibility that demand will be less than forecast. There is a danger, however, that this transfer of risk may prove illusory if major miscalculations force the public agency to renegotiate contracts or provide financial guarantees.71 Moreover, as GAO points out, not all the risks can or should be shifted to the private sector. For instance, private investors are unlikely to accept the risk of higher construction costs due to delays in the environmental review process.72
Asset Recycling
Asset recycling is the sale or lease to the private sector of government-owned infrastructure assets and the investment of the proceeds in new infrastructure. For a few years, the national government of Australia had a policy of making 15% incentive payments to state and territory governments if they agreed to sell or lease assets to the private sector and then "recycle" these payments to other infrastructure projects. Over the roughly three-year period the asset recycling initiative was in effect, the national government entered into three agreements with incentive payments totaling A$2.3 billion (approximately US$1.5 billion). According to a review of the program by the Australian Treasury, this led to A$15 billion in additional infrastructure. One of the agreements involved the 99-year lease of the electricity network businesses owned by the State of New South Wales and the investment of the proceeds in the Sydney Metro, Parramatta Light Rail, and several road projects.73 A similar program for the United States was proposed in a draft bill on infrastructure investment circulated by House Transportation and Infrastructure Committee Chairman Bill Shuster in 2018. The draft bill proposed to provide a federal payment of 15% of the assessed value of a leased infrastructure asset to eligible project sponsors, allotting $3 billion for this purpose from FY2019 through FY2023. Infrastructure assets that qualify for recycling in the draft bill include highways, public transit, airports, ports and port terminals, publicly owned railroads, intercity bus facilities, intermodal transportation facilities, and drinking and wastewater facilities.74
Municipal Bonds
Municipal bonds, debt instruments used by states and all types of local government, are a major source of financing for transportation infrastructure. The interest on municipal bonds is generally exempt from federal income tax; consequently, an investor will usually accept a lower interest rate than on a non-tax-exempt bond, and the borrower can finance a project at a lower cost. The forgone tax revenue is the federal government's contribution to a project financed with municipal bonds. CBO estimates that the cost to the federal government of tax-exempt bonds in state and local transportation and water infrastructure investment is 26 cents per dollar financed.75
Private activity bonds (PABs) are a type of municipal bond in which a state or local government acts as a financial intermediary for a business or individual.76 PABs are not eligible for federal tax exemption unless Congress grants an exception for a certain purpose and other requirements are met. Congress has approved limited use of tax-exempt private activity bonds for airports, docks and wharves, mass commuting facilities, high-speed intercity rail facilities, and qualified highway or surface freight transfer facilities (26 U.S.C. §142). In the case of qualified highway or surface freight transfer facilities, the Secretary of Transportation must approve the issuance of PABs, and the aggregate amount allocated must not exceed $15 billion (26 U.S.C. §142(m)(2)). The authorization for the sale of qualified highway or surface freight transfer facilities was a provision in SAFETEA, enacted in 2005. As of April 7, 2020, $12.12 billion of the $15 billion had been issued to finance 26 projects, and another $2.28 billion had been allocated to six other projects.77 There have been proposals to increase the bond issuance cap so that PABs, which are seen as an important support for P3 deals, can continue to be issued in the future.
While municipal bonds are a popular financing method, there are a number of potential disadvantages to their use. Because they are issued by state and local governments, the federal government has less control over the types of projects supported and the amount of the federal contribution than it does with grant and loan programs. Tax-exempt bonds, moreover, can be an inefficient way to subsidize state and local debt because borrowing costs are reduced by less than the forgone federal revenue. As CBO notes, "the remainder of that tax expenditure accrues to bond buyers in the highest income tax brackets."78 Also, tax-exempt bonds are unattractive to investors that do not have a federal tax liability, such as pension funds and foreign individuals and organizations, shrinking the potential funds available to state and local governments.
Tax credit bonds, an alternative type of tax-preferred municipal bond, might help to overcome some of these limitations. Tax credit bonds typically do not pay interest. Instead, the investor receives a tax credit, an amount that is the same for investors in different tax brackets. Tax credit bonds, therefore, are more efficient than tax-exempt bonds because the revenue forgone by the federal government equals the reduction in borrowing costs that state and local governments receive. Unused tax credits may be carried forward to another year or sold to another entity with tax liability. With some types of tax credit bonds known as issuer credit or direct pay bonds, the credit is paid to the issuer (a state or local government) by the Treasury, and the investor gets interest similar to taxable securities. Consequently, tax credit bonds can be attractive to investors with no federal tax liability.
Federal authority exists for state and local governments to issue some types of tax credit bonds, but under current authority none can be used to finance transportation projects. Tax credit bonds authorized by the American Recovery and Reinvestment Act of 2009 (P.L. 111-5), known as Build America Bonds, were used to finance a wide range of projects including transportation. The authorization to issue these bonds expired December 31, 2010.
Transportation Infrastructure Finance and Innovation Act (TIFIA)
An existing federal mechanism for providing credit assistance to relatively large transportation infrastructure projects is the Transportation Infrastructure Finance and Innovation Act (TIFIA) program, enacted in 1998.79 TIFIA provides federal credit assistance in the form of secured loans, loan guarantees, and lines of credit.80
Federal credit assistance reduces borrowers' costs and lowers project risk, thereby helping to secure other financing at rates lower than would otherwise be possible. Another purpose of TIFIA funding is to leverage nonfederal funding, including investment from the private sector. Loans must be repaid with a dedicated revenue stream, typically a project-related user fee, such as a toll, but sometimes dedicated tax revenue. Through FY2019, according to DOT, TIFIA had provided assistance of about $34 billion to more than 75 projects. The overall cost of the projects supported is estimated to be $124 billion.81
The FAST Act (P.L. 112-141) authorized $275 million for TIFIA in both FY2016 and FY2017, $285 million in FY2018, and $300 million in both FY2019 and FY2020.82 Because the government expects its loans to be repaid, an appropriation need cover only administrative costs and the subsidy cost of credit assistance. According to the Federal Credit Reform Act of 1990, the subsidy cost is "the estimated long-term cost to the government of a direct loan or a loan guarantee, calculated on a net present value basis, excluding administrative costs."83 According to DOT, $1 in TIFIA funding historically has provided about $10 in credit assistance, a 10% subsidy cost, although in recent years each dollar has provided closer to $16.84
The FAST Act also allowed states to use funds they receive from two other highway programs to pay for the subsidy and administrative costs of credit assistance. These two programs are the Nationally Significant Freight and Highway Projects Program (NSFHPP), authorized at $950 million in FY2019, and the National Highway Performance Program (NHPP), authorized at $23.7 billion in FY2019. If states decide to use their formula funding in this way, the potential amount of loans and other credit assistance may be much greater than would be possible using the $275 million direct authorization alone. The Better Utilizing Investments to Leverage Development (BUILD) Transportation Discretionary Grants program (formerly TIGER program), funded by general fund appropriations, also can be used by grant recipients to pay the subsidy and administrative costs of a TIFIA loan.85
Several changes to the TIFIA program in the FAST Act were aimed at making it easier to finance smaller projects, particularly those in rural areas. These provisions included
- providing authority for a TIFIA loan to a state infrastructure bank (SIB) to capitalize a "rural project fund";
- adding transit-oriented development (TOD) infrastructure as an eligible project (TOD infrastructure is a "project to improve or construct public infrastructure that is located within walking distance of, and accessible to, a fixed guideway transit facility,86 passenger rail station, intercity bus station, or intermodal facility");87
- allowing up to $2 million of TIFIA budget authority each fiscal year to pay the application fees for projects costing $75 million or less instead of requiring payment by the project sponsor;
- modifying or setting the minimum project cost thresholds for credit assistance at $10 million for TOD projects, the capitalization of a rural project fund, and local government infrastructure projects; and
- providing for a streamlined application process for loans of $100 million or less.
In addition, the FAST Act authorized the creation of a new National Surface Transportation and Innovative Finance Bureau within DOT to administer federal transportation financing programs, specifically the TIFIA program, the SIB program, the Railroad Rehabilitation and Improvement Financing (RRIF) Program, and the allocation of authority to issue private activity bonds for qualified highway or surface freight transfer facilities. To fulfill this mandate, DOT established the Build America Bureau in July 2016. The bureau also is responsible for establishing and promoting best practices for innovative financing and P3s, and for providing advice and technical expertise in these areas. The bureau administers the discretionary Nationally Significant Freight and Highway Projects grant program, known as INFRA grants, and has responsibilities related to procurement and project environmental review and permitting.
National Infrastructure Bank
Congress has considered several proposals to create a national infrastructure bank to help finance infrastructure projects. One purported advantage of a national infrastructure bank over other loan programs, such as TIFIA, is that it would have more independence in its operation, such as in project selection, and have greater expertise at its disposal. Additionally, a national infrastructure bank would likely be set up to help a much wider range of infrastructure projects, including water, energy, and telecommunications infrastructure. Proponents claim that the best projects, or at least those that are the most financially viable, would be selected from across these sectors.
In many formulations, capitalization of a national infrastructure bank comes from an appropriation, but in others the bank is authorized to raise its own capital through bond issuance. By issuing securities that are not tax exempt, it could tap pools of private capital that do not invest in tax-exempt bonds, such as pension funds and foreign citizens, the traditional source of much project finance. Tax-exempt municipal securities are unattractive to some investors, either because individual issues are too small to interest them or because the investors do not benefit from the tax preference. Taxable bonds with long maturities might be attractive to some of these investors.88 An infrastructure bank also might also choose to reduce the federal government's share of project costs, putting greater reliance on nonfederal capital and user fees.
Most infrastructure bank proposals assume the bank would improve the allocation of public resources by funding projects with the highest economic returns regardless of infrastructure system or type. Selection of the projects with the highest returns, however, might conflict with the traditional desire of Congress to ensure funding for various purposes. In the extreme case, major transportation projects might not be funded if the bank were to exhaust its lending authority on water or energy projects offering higher returns.
Limitations of a national infrastructure bank include its duplication of existing programs like TIFIA and the Wastewater and Drinking Water State Revolving Funds. An infrastructure bank may not be the lowest-cost means of increasing infrastructure spending. CBO has pointed out that a special entity that issues its own debt would not be able to match the lower interest and issuance costs of the U.S. Treasury.89 In some formulations, a national infrastructure bank exposes the federal government to the risk of default.90
State Infrastructure Banks
State infrastructure banks (SIBs) already exist in many states. In 32 states and Puerto Rico, SIBs were created pursuant to a federal program originally established in surface transportation law in 1995 (P.L. 104-59).91 Several other states, among them California, Florida, Georgia, Kansas, Ohio, and Virginia, have state investment banks that are unconnected to the federal program.92 Local governments have also begun to embrace the idea. Dauphin County, PA, has established an infrastructure bank funded from a state tax on liquid fuels to make loans to the 40 municipalities and private project sponsors within its borders.93 The City of Chicago established a nonprofit organization, the Chicago Infrastructure Trust, in 2012 as a way to attract private investment for public works projects. However, the mayor decided to initiate its dissolution in 2019 due to inactivity and other issues.94
One of the biggest stumbling blocks to federally authorized SIBs has been capitalization. States can capitalize the banks using some of their apportioned and allocated highway and transit funds, and any amount of rail program funds. Under the FAST Act, capitalization of a rural project fund may now be made by a loan from the TIFIA program. Federal funds have to be matched with state funds, generally on an 80% federal, 20% state basis.
Author Contact Information
Footnotes
| 1. |
Based on Federal Highway Administration (FHWA) data. Balances in the HTF accrued in previous years were large enough to keep the fund sufficient until FY2008. |
| 2. |
Based on actual and projected outlays FY2009 through late FY2021, when the HTF is projected to approach a zero balance. |
| 3. |
CRS Report R44388, Surface Transportation Funding and Programs Under the Fixing America's Surface Transportation Act (FAST Act; P.L. 114-94), coordinated by Robert S. Kirk. |
| 4. |
See Congressional Budget Office (CBO), How Would Proposed Fuel Economy Standards Affect the Highway Trust Fund? May 2012, p. 3. A drop in outlays in FY2006 helped bring the HTF briefly into balance in FY2006 and FY2007. |
| 5. |
Jeff Davis, "Ten Years of Highway Trust Fund Bankruptcy: Why Did It Happen, and What Have We Learned?" Eno Transportation Weekly, August 27, 2018, pp. 8-12. |
| 6. |
Federal Highway Administration, FHWA Forecasts of Vehicle Miles Traveled (VMT): Spring 2019, Washington, DC, May 2019, at https://www.fhwa.dot.gov/policyinformation/tables/vmt/vmt_forecast_sum.cfm. |
| 7. |
Congressional Budget Office, How Would Proposed Fuel Economy Standards Affect the Highway Trust Fund?, May 2012, at http://cbo.gov/sites/default/files/cbofiles/attachments/05-02-CAFE_brief.pdf. Because of the gradual turnover in the car and truck fleet and because the new standards were not to take effect until model year 2017, CBO estimated at the time that the standards would reduce "gasoline tax revenues between 2012 and 2022 by less than 1 percent." |
| 8. |
CRS Report R45204, Vehicle Fuel Economy and Greenhouse Gas Standards: Frequently Asked Questions, by Richard K. Lattanzio, Linda Tsang, and Bill Canis. |
| 9. |
CRS In Focus IF10871, Vehicle Fuel Economy and Greenhouse Gas Standards, by Richard K. Lattanzio, Linda Tsang, and Bill Canis. |
| 10. |
Congressional Budget Office, Budget and Economic Outlook: 2019 to 2029, Washington, DC, January 29, 2019, at https://www.cbo.gov/publication/54918. See revenue projections. |
| 11. |
Congressional Budget Office, Projections of Highway Trust Fund Accounts Under CBO's March 2020 Baseline, 2020, at https://www.cbo.gov/system/files/2020-03/51300-2020-03-highwaytrustfund.pdf. The $18 billion figure represents the average annual gap between projected receipts from the motor fuel and other excise taxes that flow into the Highway Trust Fund and the anticipated cost of maintaining the surface transportation program at its current "baseline" level. Because of beginning of year (BOY) HTF balances for FY2021, a five-year surface transportation bill (FY2021-FY2025) could be funded with roughly $68.8 billion in transfers or increased revenues. |
| 12. |
Since the early 1990s Congress has begun the reauthorization debates with a goal of a six-year bill. The most recent bill, the FAST Act, however, provided five years of funding. |
| 13. |
Federal Highway Administration, Action: Procedures for Reimbursements During a Cash Shortfall, July 1, 2014, at https://www.transportation.gov/sites/dot.gov/files/docs/Guidance-Memo-Cash-Allocation-Final-3.pdf. |
| 14. |
FHWA estimates that it must also maintain a working balance of $5 billion. Maintaining this working balance increases the funding shortfall five-year total to $73.8 billion. |
| 15. |
Contract authority is a type of budget authority that is available for obligation even without an appropriation. However, appropriators must eventually provide liquidating appropriation authority, which is not recorded as budget authority, to permit the eventual outlays. Contract authority is the type of budget authority used by the HTF. |
| 16. |
Office of Management and Budget, Budget of the U.S. Government FY2021: Appendix (Washington, DC: 2020), pp. 942, 971, at https://www.govinfo.gov/app/details/BUDGET-2021-APP/. |
| 17. |
"Bipartisan Budget Agreement: a Memorandum from the House and Senate Leaders," February 8, 2018. |
| 18. |
This discussion tracks the changes in the rate of the gasoline tax. Over time other fuels such as diesel have been taxed at different rates. For instance, the current tax on diesel fuel is 6 cents per gallon higher than the gasoline tax. For a tabular history of the rates of the various federal fuel taxes, see Federal Highway Administration, Highway Statistics: Table FE101-A, at https://www.fhwa.dot.gov/policyinformation/statistics/2015/fe101a.cfm. |
| 19. |
CRS Report RL30304, The Federal Excise Tax on Motor Fuels and the Highway Trust Fund: Current Law and Legislative History, by Sean Lowry. |
| 20. |
Federal Highway Administration, Funding Federal-aid Highways; Appendix K, Historical Federal Fuel Tax Rates, last modified January 2017, at https://www.fhwa.dot.gov/policy/olsp/fundingfederalaid/k.cfm. |
| 21. |
U.S. President (Reagan), "Remarks to Reporters Announcing the Administration's Proposal for a Highway and Bridge Repair Program: Nov. 23, 1982," The American Presidency Project; Public Papers. |
| 22. |
See Jeff Davis, Reagan Devolution: The Real Story of the 1982 Gas Tax Increase, Eno Center for Transportation, Washington, DC, 2015, pp. 1-40. |
| 23. |
There are many inflation indexes that could be used. Which one is most appropriate might become an issue of controversy. The most commonly used index is the U.S. Bureau of Labor Statistics' consumer price index (CPI), which, for example, is used to adjust certain aviation user fees. Other examples are the Bureau of Economic Analysis price indexes for gross government fixed investment and the Federal Highway Administration's National Highway Construction Cost Index (NHCCI). |
| 24. |
Institute on Taxation and Economic Policy, A Federal Gas Tax for the Future, Washington, DC, September 2013, pp. 1-13, at http://www.itep.org/pdf/fedgastax0913.pdf. |
| 25. |
Even with the passage of the 1993 taxes some of the revenues were directed to the Treasury general fund. It was in FY1998 that the full 18.3 cents per gallon were credited entirely to the HTF. Using the Bureau of Economic Analysis Highways and Streets price index, in 2018 a gasoline tax of approximately 45 cents per gallon would have been needed to equal the purchasing power of the 18.3 cents per gallon gasoline tax in 1998. |
| 26. |
Jeffrey Ang-Olson, Martin Wachs, and Brian D. Taylor, Variable-Rate State Gasoline Taxes, Institute of Transportation Studies, University of California, Berkeley, Working Paper, UCB-ITS-WP-99-3, July 1999. See also, M. Madowitz and K. Novan, "Gasoline taxes and revenue volatility: An Application to California," Energy Policy, vol. 59, 2013, pp 663-673, at http://www.sciencedirect.com/science/article/pii/S0301421513002577. |
| 27. |
Virginia House Bill 2313, 2013 session. As passed, the price floor was the wholesale price as of February 20, 2013. The taxes are paid when the fuel is removed from a refinery or tank farm terminal. This is often referred to as collecting at the "rack." |
| 28. |
A fuel price floor could be established, but its impact would depend on how high the floor is set and whether the floor is indexed to inflation. The outcome could still fail to meet revenue expectations. |
| 29. |
See CRS Report R44540, Mileage-Based Road User Charges, by Robert S. Kirk and Marc Levinson. For additional discussion of mileage-based charges, see Paul Sorensen, Liisa Ecola, and Martin Wachs, Mileage-Based User Fees for Transportation Funding: A Primer for State and Local Decisionmakers, Rand Corporation, 2012, pp. 1-34, at http://www.rand.org/content/dam/rand/pubs/tools/TL100/TL104/RAND_TL104.pdf. See also Asha Weinstein Agrawal, Hilary Nixon, and Ashley M. Hooper, Public Perception of Mileage-based User Fees, Washington, DC, Transportation Research Board, 2016, pp. 1-139, at https://www.nap.edu/download/23401. |
| 30. |
Federal Highway Administration, State Motor-vehicle Registrations: 2017, Table MV-1, January 2019, at https://www.fhwa.dot.gov/policyinformation/statistics/2017/mv1.cfm. |
| 31. |
Congressional Budget Office, Issues and Options for a Tax on VMT by Commercial Trucks, Washington, DC, October 2019. |
| 32. |
Sam Mintz, "Trucking Industry to Congress: Don't Use Us to Pay for Surface Bill," January 24, 2020, at https://www.politico.com/newsletters/morning-transportation/2020/01/24/trucking-industry-to-congress-dont-use-us-to-pay-for-surface-bill-784620. |
| 33. |
CRS Report R44540, Mileage-Based Road User Charges, by Robert S. Kirk and Marc Levinson, p. 12. |
| 34. |
There may be legal considerations depending on whether the VMT charge is structured as a fee or tax. See, for example, U.S. Const. Art. 1, §8, cl. 1 ("all Duties, Imposts and Excises shall be uniform throughout the United States"). Legally, the two are distinguished by the relationship between the amount charged by the government and the services rendered to the payor. For example, the Supreme Court has explained that a tax may be administered "arbitrarily and [without regard to] benefits bestowed by the Government on a taxpayer and go solely on ability to pay, based on property or income," while a user fee is a specific charge imposed for a benefit that accrues only to the payors. Nat'l Cable Television Ass'n v. United States, 119 U.S. 336, 340-41 (1974). |
| 35. |
CRS Report R42731, Carbon Tax: Deficit Reduction and Other Considerations, by Jonathan L. Ramseur, Jane A. Leggett, and Molly F. Sherlock. |
| 36. |
Congressional Budget Office, Options for Reducing the Deficit: 2019 to 2028, Publication 52142, Washington, DC, December 2018, pp. 292-293, at https://www.cbo.gov/budget-options/2018/54821https://www.cbo.gov/sites/default/files/114th-congress-2015-2016/reports/52142-budgetoptions2.pdf. |
| 37. |
Electric Drive Transportation Association, Electric Drive Sales Dashboard, September 2019, at https://electricdrive.org/index.php?ht=d/sp/i/20952/pid/20952. Sales since introduction are 1,447,235 through September 2019. |
| 38. |
Federal Highway Administration, Highway Statistics, State Motor-Vehicle Registrations—2018, Table MV-1, Washington, DC, December 2019, at https://www.fhwa.dot.gov/policyinformation/statistics/2018/mv1.cfm. |
| 39. |
Federal Highway Administration, Highway Statistics, Annual Vehicle Distance Traveled in Miles and Related Data—2018, Table VM-1, Washington, DC, November 2019, at https://www.fhwa.dot.gov/policyinformation/statistics/2018/vm1.cfm. |
| 40. |
American Road & Transportation Builders Association, State Electric Vehicle Fees, Washington, DC, 2019, at https://transportationinvestment.org/wp-content/uploads/2019/04/State-Electric-Vehicle-Fees_updated-20190405.pdf. |
| 41. |
CRS Report R45323, Federalism-Based Limitations on Congressional Power: An Overview, coordinated by Andrew Nolan and Kevin M. Lewis. |
| 42. |
The Transportation Research Board, through its research programs, has prepared several reports on future surface transportation finance that discuss VMT and other options, including National Cooperative Highway Research Program (NCHRP), Future Financing Options to Meet Highway and Transit Needs, NCHRP Project 20-24, Web-Only Document 102, December 2006, at http://onlinepubs.trb.org/onlinepubs/nchrp/nchrp_w102.pdf; and Transportation Research Board, The Fuel Tax and Alternatives for Transportation Funding, Special Report 285, January 2006, at http://onlinepubs.trb.org/onlinepubs/sr/sr285.pdf. |
| 43. |
American Association of State Highway and Transportation Officials, "Matrix of Illustrative Surface Transportation Revenue Options," January 2019, at https://fundingfinance.transportation.org/wp-content/uploads/sites/16/2019/02/Matrix_of_Funding_Options.pdf. |
| 44. |
Joshua Schank, "Life and Death of the Highway Trust Fund: How We Pay for Transportation," Eno Center for Transportation, December 2014, at https://www.enotrans.org/store/research-papers/the-life-and-death-of-the-highway-trust-fund-2. |
| 45. |
Jeff Davis, "Regulatory Freeze Continues as Agencies Extend Deadlines and Regroup," Eno Transportation Weekly, February 8, 2017, pp. 1-3. |
| 46. |
Congressional Budget Office, Highway Trust Fund Accounts, CBO's Baseline as of March 6, 2020, at https://www.cbo.gov/system/files/2020-03/51300-2020-03-highwaytrustfund.pdf. The $20 billion reflects an FY2021 start of year balance of nearly $19 billion. Without this balance the shortfall would be roughly $39.5 billion in FY2026. |
| 47. |
CRS Report R44811, Surface Transportation Devolution, by Robert S. Kirk. |
| 48. |
The provision of a general fund share for the FAA is not required by statute but is the historical norm. When the Airport and Airway Trust Fund was running sufficient balances to do so, it was not uncommon for presidential budgets to propose funding the entire FAA budget with trust fund revenues. Since the 1971 creation of the Airport and Airway Trust Fund, however, this only occurred in FY2000. |
| 49. |
Joseph E. Stiglitz, Economics of the Public Sector (New York, NY: W.W. Norton Co., 1986), p. 599. |
| 50. |
See Jeff Davis, Why Not a Ten-Year Year Surface Transportation Bill? (Executive Summary), Eno Center for Transportation, February 26, 2015, p. 1. |
| 51. |
CRS Report R44910, Tolling U.S. Highways and Bridges, by Robert S. Kirk. |
| 52. |
Federal Highway Administration, Highway Statistics: Summary to 1975, Table HF-211, 1977, pp. 107-136. Also Highway Statistics: Summary to 1995, Table SF-210; Highway Statistics, various years, Tables SF-21, HF-10, and HF-10a; Our Nation's Highways: 2010, Figure 6-6: Toll Facility Revenue: 1993-2008, at http://www.fhwa.dot.gov/policyinformation/pubs/pl10023/fig6_6.cfm. |
| 53. |
Federal Highway Administration, Highway Statistics, 2016, Table HF-10, August 2018, at https://www.fhwa.dot.gov/policyinformation/statistics/2016/hf10.cfm. |
| 54. |
Federal Highway Administration, Toll Facilities in the United States: Toll Mileage Trends—2007 to 2017, Washington, DC, April 4, 2018, at https://www.fhwa.dot.gov/policyinformation/tollpage/documents/chart.pdf. |
| 55. |
Federal Highway Administration, Toll Facilities in the United States: Bridges-Roads-Tunnels-Ferries, Publication No: FHWA-PL-91-009, 1991, p. v. |
| 56. |
Federal Highway Administration, Highway Statistics, Table HM-18, Washington, DC, August 23, 2018, at https://www.fhwa.dot.gov/policyinformation/statistics/2018/hm18.cfm. |
| 57. |
CRS Report R45250, Rural Highways, by Robert S. Kirk. |
| 58. |
Adeel Lari, David Levinson, and Zhirong Zhao, et al., Value Capture for Transportation Finance: Technical Research Report, Center for Transportation Studies, University of Minnesota, June 2009, at http://www.cts.umn.edu/research/featured/value-capture. Tax increment financing uses the increase in property tax revenue within a defined area resulting from an infrastructure improvement to cover the cost of the improvement. |
| 59. |
Government Accountability Office, Public Transportation: Federal Role in Value Capture Strategies for Transit Is Limited, but Additional Guidance Could Help Clarify Policies, GAO-10-781, July 2010, at http://www.gao.gov/new.items/d10781.pdf. |
| 60. |
Washington Metropolitan Area Transit Authority, FY2019 Proposed Budget, p. 17, at https://www.wmata.com/about/records/public_docs/upload/FY2019-Proposed-Budget-Book-12-12-2017-Final.pdf. |
| 61. |
Government Accountability Office, Public Transportation: Federal Role in Value Capture Strategies for Transit Is Limited, but Additional Guidance Could Help Clarify Policies, GAO-10-781, July 2010, pp. 16, 20, at http://www.gao.gov/new.items/d10781.pdf. |
| 62. |
Sharada Vadali, Rafael Manuel-Aldrete, and Arturo Bujanda, et al., Transportation Reinvestment Zone Handbook, Texas Transportation Institute, College Station, TX, 2011, at https://rosap.ntl.bts.gov/view/dot/20254/dot_20254_DS1.pdf; Texas Department of Transportation, "Transportation Reinvestment Zone," at http://www.txdot.gov/government/programs/trz.html. |
| 63. |
For more information, see Route 28 Corridor Improvements LLC, "Route 28 Public/Private Partnership: Moving Right Along," at http://www.28freeway.com. |
| 64. |
See, for example, Bipartisan Policy Center, Bridging the Gap Together: A New Model to Modernize U.S. Infrastructure, May 2016, at https://bipartisanpolicy.org/library/modernize-infrastructure/. |
| 65. |
CRS Report R45010, Public-Private Partnerships (P3s) in Transportation, by William J. Mallett. |
| 66. |
"Demand Risk P3s Are An Unhappy Family," Public Works Financing, September 2014, p. 19. |
| 67. |
Bipartisan Policy Center, Bridging the Gap Together: A New Model to Modernize U.S. Infrastructure, May 2016, p. 67, at https://bipartisanpolicy.org/library/modernize-infrastructure/. |
| 68. |
"U.S./Canada Transportation P3 Market 1993-2017," Public Works Financing, September 2017, pp. 9-12. |
| 69. |
EY, Public-Private Partnerships and the Global Infrastructure Challenge, 2015, figure 1. |
| 70. |
Congressional Budget Office, Public-Private Partnerships for Transportation and Water Infrastructure, January 2020, at https://www.cbo.gov/publication/56003. |
| 71. |
E. Engel, R. Fischer, and A. Galetovic, "Privatizing Highways in the United States," Review of Industrial Organization, vol. 29, 2006, pp. 27-53. |
| 72. |
Government Accountability Office, Highway Public-Private Partnerships, February 2008. |
| 73. |
Australian Government, The Treasury, Review of the National Partnership Agreement on Asset Recycling, January 29, 2019, https://treasury.gov.au/publication/p2019-t349382. |
| 74. |
"The Shuster Infrastructure Proposal," https://republicans-transportation.house.gov/building21/. |
| 75. |
Congressional Budget Office, Federal Support for Financing State and Local Transportation and Water Infrastructure, October 2018, p. 2, at https://www.cbo.gov/system/files?file=2018-10/54549-InfrastructureFinancing.pdf. |
| 76. |
Joint Tax Committee, Overview of Selected Provisions Relating to the Financing of Surface Transportation Infrastructure, June 23, 2015, JCX-97-15, at https://www.jct.gov/publications.html?func=showdown&id=4796. |
| 77. |
Department of Transportation, Build America Bureau, "Private Activity Bonds: Current Status," May 5, 2020, at https://www.transportation.gov/buildamerica/financing/private-activity-bonds-pabs/private-activity-bonds. |
| 78. |
Congressional Budget Office, "Answer to a Question for the Record Following a Hearing on the Long-Term Financing of the Highway Trust Fund Conducted by the House Committee on Ways and Means," July 24, 2015, at https://www.cbo.gov/sites/default/files/114th-congress-2015-2016/reports/50418-QFRs_HTF_1.pdf. |
| 79. |
23 U.S.C. §601 et seq. |
| 80. |
CRS Report R45516, The Transportation Infrastructure Finance and Innovation Act (TIFIA) Program, by William J. Mallett. |
| 81. |
Both dollar numbers were calculated by CRS in inflation-adjusted 2019 dollars. U.S. Department of Transportation, "Projects Financed by TIFIA," at http://www.dot.gov/tifia/projects-financed. |
| 82. |
Highway and Transportation Funding Act of 2014 (P.L. 113-159); Highway and Transportation Funding Act (P.L. 114-21); Surface Transportation and Veterans Health Care Choice Improvement Act of 2015 (P.L. 114-41). |
| 83. |
Federal Credit Reform Act of 1990 (§502 5A), enacted as §13201 of Omnibus Budget Reconciliation Act of 1990 (P.L. 101-508). |
| 84. |
Based on the original subsidy rate for FY2015 through FY2020. Office of Management and Budget, Budget of the U.S. Government, FY2020, Federal Credit Supplement, Tables 1 and 7, at https://www.whitehouse.gov/wp-content/uploads/2019/03/cr_supp-fy2020.pdf. |
| 85. |
A maximum of 20% ($300 million) of the funding appropriated in FY2018 was available to pay the subsidy and administrative costs of TIFIA credit assistance. Department of Transportation, "Notice of Funding Opportunity for the Department of Transportation's National Infrastructure Investments Under the Consolidated Appropriations Act, 2018," 83 Federal Register 18651-18661, April 27, 2018. |
| 86. |
Fixed guideway transit generally includes rail transit, passenger ferries, and bus rapid transit. |
| 87. |
FAST Act, §2001. |
| 88. |
U.S. Congress, Senate Committee on Banking, Housing, and Urban Affairs, Testimony of Felix Rohatyn, Co-Chair of the Commission on Public Infrastructure, Hearing on Condition of Our Nation's Infrastructure and Proposals for Needed Improvement, 110th Cong., 2nd Sess., March 11, 2008; U.S. Congress, House Committee on Transportation and Infrastructure, Testimony of Bernard Schwartz, President and CEO, BLS Investments, Hearing on Financing Infrastructure Investments, 110th Cong., 2nd Sess., June 10, 2008. |
| 89. |
U.S. Congress, House Committee of the Budget and Committee on Transportation and Infrastructure, Testimony of Peter R. Orszag, Director, Congressional Budget Office, Hearing on Financing Infrastructure Investment, 110th Cong., 2nd Sess., May 8, 2008. |
| 90. |
U.S. Congress, House Committee on Ways and Means, Subcommittee on Select Revenue Measures, Testimony of Samuel Staley, Hearing on the National Infrastructure Banks, 111th Cong., 2nd sess., May 13, 2010. |
| 91. |
Federal Highway Administration, "State Infrastructure Banks (SIBs)," at http://www.fhwa.dot.gov/ipd/finance/tools_programs/federal_credit_assistance/sibs/. |
| 92. |
Robert Puentes and Jennifer Thompson, Banking on Infrastructure: Enhancing State Revolving Funds for Transportation, Brookings Institution, September 2012, at https://www.brookings.edu/wp-content/uploads/2016/06/12-state-infrastructure-investment-puentes.pdf. |
| 93. |
Jeff Frantz, "Dauphin County Creates Infrastructure Bank for Road Improvements," PennLive, March 1, 2013, at http://www.pennlive.com/midstate/index.ssf/2013/03/dauphin_county_creates_infrast.html; Dauphin County, "Infrastructure Bank," at https://www.dauphincounty.org/government/departments/community_and_economic_development/industrial_development_authority/infrastructure_bank.php. |
| 94. |
A. D. Quig, "Lightfoot is Killing Emanuel's Infrastructure Trust," Crain's Chicago Business, November 18, 2019, at https://www.chicagobusiness.com/government/lightfoot-killing-emanuels-infrastructure-trust. |