Introduction
The international oil market has influenced U.S. domestic and foreign policy decisions for decades. The United States plays a significant role in the world oil market, not only as the top consumer of crude oil and petroleum products, but also as the largest producer. The U.S. Energy Information Administration (EIA) estimated that the United States surpassed Russia and Saudi Arabia as the world's number one crude oil producer in 2018.1 U.S. production is at an all-time high as a result of technological advancements and policy. Despite the recent surge in U.S. oil production, the United States remained a net importer of oil in 2018.
Oil availability associates with energy independence and energy security more than any other fuel. Supply, demand, the strength of currencies, and other factors link crude oil to the world market to determine the price. Because the United States is a top consumer and producer of oil, it has the ability to influence this world market. Trade agreements, regulation, sanctions, and unpredictable events all contribute to the flow of oil in the world market. Congress may consider policies that affect the world oil market, including sanctions, alternative fuel standards, emission controls, use of electric vehicles, and protection of international trade routes.
This report provides an introduction to the U.S. and world oil markets, with an overview of supply and demand, price considerations, and trade flows. The report also includes analysis on selected examples of international conditions that in the past have affected policy decisions in the United States. This report does not focus on trade associated with the entire crude oil and petroleum product value chain, the history of imports and exports, or provide an in-depth country trade balance analysis. The potential impacts of the world oil market on the climate and the environment are not within the scope of this report.
U.S. Oil Market
The United States has abundant reserves of various natural resources, including crude oil in both conventional and unconventional deposits, such as shale. Technological advancements and new policies have changed the outlook for oil production in the United States from perceived scarcity to abundance. The United States, both the top oil producer and the world's greatest consumer of crude oil and petroleum products (e.g., gasoline), remains a net oil importer.
U.S. Supply
The availability of the crude oil resource and more specifically the "proved" reserves limits the economic production, or supply.2 Proved reserves are identified, undeveloped resources in the ground that are both technically and economically recoverable under existing economic and operating conditions. This measurement can fluctuate depending on a number of factors such as technology costs, new discoveries, and local and international oil prices.
By the end of 2017, the United States had 39.2 billion barrels of proved reserves of oil, according to the U.S. Energy Information Administration (EIA).3 U.S. oil production has seen steady growth through the deployment of new oil extraction technologies. Production nearly doubled from around 5 million barrels per day (Mb/d) in 2008 to just over 10 Mb/d in 2018.4 In a world context, in September 2018, the EIA estimated that the United States surpassed Russia and Saudi Arabia as the number one crude oil producer.5
In 2018, nearly 3 Mb/d of U.S. crude oil production came from shale formations within the Permian basin, located in west Texas and southeastern New Mexico.6 The United States produces primarily light, sweet crude oil.7 In 2017, light, sweet crude oil accounted for over half of all U.S. production, primarily from the Bakken shale formation in North Dakota and Montana and the Permian Basin.8
|
A Note on Refineries and Crude Oil Types Not all crude oils are the same quality or type and not all refineries can efficiently process all types of crude oil. For instance, the Permian Basin predominately produces light, sweet crude oil, while most Texas refineries process heavier crude oils sourced from other places. Crude oil is generally classified by its sulfur content and density (gravity). The denser the crude oil, the more it is considered "heavy." The classification of sweet vs. sour refers to the sulfur content in the crude oil. Sour crude oils have a higher sulfur content compared to sweet crude oils.9 Furthermore, different types of crude oil, once refined, can have different product yields that are often a consideration when purchasing. The types of crude oil available and the capacity of the world refinery market affect the price of petroleum products. For many years, refiners in the United States invested in refining heavy, sour crude oils (e.g., Venezuelan, Mexican, and Canadian crude oils). These heavy crude oils are often the lowest priced because they require more expensive and complex refinery equipment to resist increased corrosion associated with their use. Complex, heavy oil refineries also include processing equipment that can convert heavy crude oil components into lighter products (e.g., gasoline and diesel fuel). These refineries are still able to process lighter crude oils, but not as efficiently. In the United States, many refineries along the East Coast are optimized for light, sweet crude oils while those processing heavy, sour crude oils are prevalent in the Gulf Coast. |
Hydraulic fracturing and horizontal drilling technologies largely drove the production growth of the past decade. Hydraulic fracturing allows crude oil trapped inside "tight" rock formations to be released. Fluid forced under high pressure into the formation fractures it, creating fissures through which the oil can flow.10 Horizontal drilling requires a single vertical wellbore at the surface and then drills out horizontally underground across numerous points of extraction.11 The use of these technologies has raised environmental concerns, particularly involving possible ground water contamination and earthquakes.12
U.S. Demand
The United States is the number one consumer of crude oil and refined petroleum products such as gasoline, diesel fuel, and aviation fuel. As Table 1 indicates, crude oil is both a raw ingredient for transportation fuels and a petrochemical feedstock to produce heating oil, lubricants, and other products. Due to this versatility, the price and supply of crude oil can directly affect other industries.
|
Product |
Description |
Million Barrels per Day |
|
|
Motor Gasoline |
Conventional gasoline; all types of oxygenated gasoline, including gasohol; and reformulated gasoline, but excludes aviation gasoline. |
9.326 |
|
|
Distillate Fuel Oil |
Diesel fuels and fuel oils used in on-highway diesel engines, such as those in trucks and automobiles, as well as off-highway engines, such as those in railroad locomotives and agricultural machinery; and space heating and electric power generation. |
3.932 |
|
|
Hydrocarbon Gas Liquids (HGL) |
A group of hydrocarbons including ethane, propane, normal butane, isobutane, and natural gasoline; and their associated olefins, including ethylene, propylene, butylene, and isobutylene. |
2.642 |
|
|
Other |
Still gas, asphalt and road oil, petroleum coke, residual fuel oil, petrochemical feedstock, lubricants, special napthas, aviation gasoline, kerosene, waxes, etc. |
2.374 |
|
|
Kerosene-type Jet Fuel |
Commercial and military turbo jet and turbo prop aircraft engines. |
1.682 |
Sources: U.S. Energy Information Administration, "Oil: Crude and Petroleum Products Explained Use of Oil," web page, September 19, 2017, https://www.eia.gov/energyexplained/index.php?page=oil_use; and "Oil: Petroleum and Other Liquids Product Supplied," online database, September 20, 2018, https://www.eia.gov/dnav/pet/pet_cons_psup_dc_nus_mbblpd_a.htm.
Note: Kerosene has a much higher flashpoint than gasoline, making it less volatile for use in a jet engine.
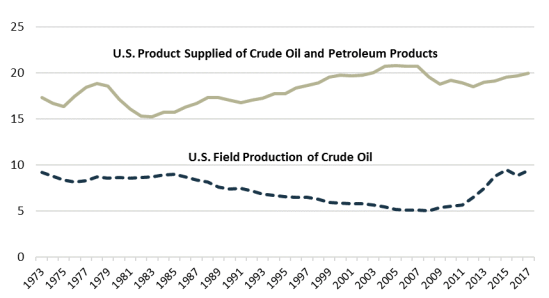
Figure 1 shows that U.S. crude oil and petroleum product supplied in 2017 was on average 19.96 Mb/d—which was 20% of total world consumption. According to EIA, consumption is inferred from measurements of products supplied.13 Domestic crude oil production in 2017 was 9.35 Mb/d. While the United States is at record levels of production, current U.S. production is not meeting U.S. consumption. This supply/demand gap is filled by imports (a constant, but sometimes not dependable source), natural gas liquids, and, if necessary, drawing down commercial crude oil stockpiles or from the Strategic Petroleum Reserve.
|
Figure 1. U.S. Crude Oil and Petroleum Product Consumption and Crude Oil Production 1973-2017 Million barrels per day |
 |
|
Sources: U.S. Energy Information Administration, "U.S. Field Production of Crude Oil," online database, September 10, 2018, https://www.eia.gov/dnav/pet/hist/LeafHandler.ashx?n=PET&s=MCRFPUS2&f=A; "U.S. Product Supplied of Crude Oil and Petroleum Products," online database, September 10, 2018, https://www.eia.gov/dnav/pet/hist/LeafHandler.ashx?n=PET&s=MTTUPUS2&f=A. Notes: Years selected based on data available for product supplied. Consumption is inferred from measurements of products supplied. For details, see U.S. Energy Information Administration, "Definitions, Sources and Explanatory Notes," web page, November 27, 2018, https://www.eia.gov/dnav/pet/TblDefs/pet_cons_psup_tbldef2.asp. |
The demand for crude oil and petroleum products links closely to economic conditions. Consumers use petroleum products for everyday needs, such as driving, making crude oil and petroleum products relatively inelastic.14 While the economy is often a reliable driver of petroleum product consumption, so too is policy. In 2007, Congress passed the Energy Independence and Security Act (P.L. 110-140), which directed the National Highway Traffic Safety Administration to promulgate new fuel economy standards to increase vehicle fleet efficiency. These standards demonstrate how federal policy choices can influence crude oil consumption in transportation.
U.S. Prices
Several different characteristics of oil determine the price of crude oil. Crude oil quality is one factor that determines a price. Lighter, sweeter crude oil prices, for example, are generally higher than heavy, sour crudes oils, because refineries (see textbox about refineries above) use lighter, sweeter crude oils to produce higher-value petroleum products, such as gasoline and diesel fuel.15
The spot price and future price are other ways to measure the price of crude oils. The spot market (i.e., where assets are traded for immediate delivery) has a benchmark representing trade of that crude oil. In the United States, the most commonly referenced benchmark is known as West Texas Intermediate or WTI. This benchmark is the price at which oil is traded on the spot market in Cushing, OK. Several world crude oils serve as price benchmarks for other crude oils. Other world reference price benchmarks for crude oil include Brent (Europe) and Dubai Crude. These price benchmarks often differ from one another (known as a spread) and reflect the varying type and quality of the oil, regional market conditions, infrastructure limitations, and transportation costs.
Crude oil prices commonly reported in newspapers are those of crude oil futures tied to a benchmark. Futures deal in the trade using contracts for the future delivery of oil, known as the futures market.16 The oil futures market provides customers the opportunity to hedge risk from price volatility, by contracting a price for production in the future.
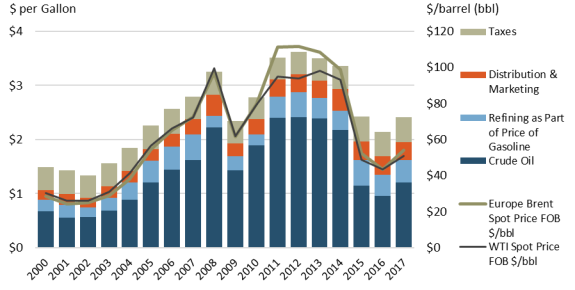
The pricing of crude oil contributes to the price consumers pay for petroleum products in the United States. Gasoline, for example, closely follows the trends in WTI and Brent. As illustrated by Figure 2, with the costs of refining, distribution, and taxes relatively stable, changes in crude price drive changes in gasoline price.
|
Figure 2. U.S. Price of Gasoline in Comparison to WTI and Brent Spot Pricing Indexes |
 |
|
Sources: CRS analysis of data from U.S Energy Information Administration, "Spot Prices," online database, September 10, 2018, https://www.eia.gov/dnav/pet/pet_pri_spt_s1_a.htm; U.S Energy Information Administration, "Gasoline Pump Components History," online database, September 10, 2018, https://www.eia.gov/petroleum/gasdiesel/gaspump_hist.php. Notes: Does not include price of diesel fuel. Annual data for 2018 are not yet complete and not represented; however, monthly data are available and can be furnished upon request. FOB = free on board, "without charge for delivery to and placing on board a carrier at a specified point." See Merriam-Webster, definition, website, https://www.merriam-webster.com/dictionary/free%20on%20board. |
The Permian Basin produces a significant amount of light, sweet crude at relatively low cost, because of its unique geologic structure. At the Permian Basin, according to the EIA, "operators can continue to drill through several tight oil layers and increase production even with sustained West Texas Intermediate (WTI) crude oil prices below $50 per barrel (bbl)."17 While also cost competitive, production from the Bakken and Eagle Ford (south Texas) formations may be more economic with sustained prices above $50/bbl (at 2018 infrastructure, market, technology, and cost conditions).18 In 2017, WTI crude oil averaged $50.80/bbl, down from an average of $99.67/bbl in 2008.
U.S. Oil Trade
The 1970s began the era of limited oil availability and rising oil prices. Following the 1973 Organization of Arab Petroleum Exporting Countries (OAPEC) oil embargo, Congress passed the Energy Policy and Conservation Act of 1975 (EPCA; P.L. 94-163). The EPCA, among many other things, restricted U.S. produced crude oil exports. Since its passage, crude oil exports occurred only in certain circumstances. For example, in 1985, President Reagan found it in the national interest to lift export restrictions on U.S. produced crude oil to Canada, following Canada's decision to remove price and volume controls on exports to the United States.19
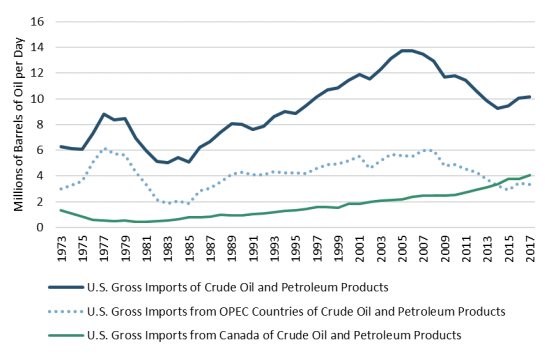
The oil sector in the United States has gone through several transformations since the 1970s. Trade policy with respect to oil has undergone significant changes in recent years to accommodate technological and world developments. U.S. crude oil and petroleum product gross imports have declined from average all-time highs of over 13 Mb/d in 2005 to 10 Mb/d average in 2017 (Figure 3).20 As the U.S. oil market moved toward higher production levels, policies that were put in place during a time of rapidly rising prices and perceived resource scarcity came into question. Consequently, in December 2015, Congress passed the Consolidated Appropriations Act, 2016 (P.L. 114-113), which repealed Section 103 of the EPCA (P.L. 94-163), removing any restrictions to crude oil exports.21
Crude oil and petroleum product imports from Canada have steadily increased since the 1980s. The United States, in 2017, imported roughly 4 Mb/d (or 40% of all U.S. crude oil and petroleum product imports) on average from Canada. In 2013, Canada surpassed the Organization of the Petroleum Exporting Countries (OPEC) as the number one supplier to the United States (see Figure 3). Much of Canada's crude oil exports go to the United States. If imports from Canada continue to grow, infrastructure demands will increase. According to the EIA, over half of Canada's production comes from oil sands (a gritty, semisolid form of petroleum) that, once separated from the sand and clay, is a heavy, viscous crude oil.22 A majority of Canada's crude oils usually end up in the Midwest due to pipeline capacity limitations to the Gulf of Mexico.23
|
Figure 3. U.S. Crude Oil and Petroleum Product Imports Average million barrels per day |
 |
|
Source: U.S. Energy Information Administration, "U.S. Imports by Country of Origin," online database, September 20, 2018, https://www.eia.gov/dnav/pet/pet_move_impcus_a2_nus_ep00_im0_mbblpd_a.htm. Notes: Organization of the Petroleum Exporting Countries (OPEC) totals based on affiliations for the stated period of time, which may differ from current affiliations. Crude oil includes imports for storage in the Strategic Petroleum Reserve. |
As mentioned above, not all crude oils are the same and refineries generally process different types of crude oil. In the United States, over half of all crude oil produced is light and sweet, while much of the U.S. refinery capacity processes heavy, sour crude oil grades. Prior to 2015, light, sweet crude oils were discounted domestically, sometimes by as much as $30/bbl, because of infrastructure constraints.24 With export restrictions removed, producers are now able to sell crude oil to the world market, not eliminating the discount, but lowering it.
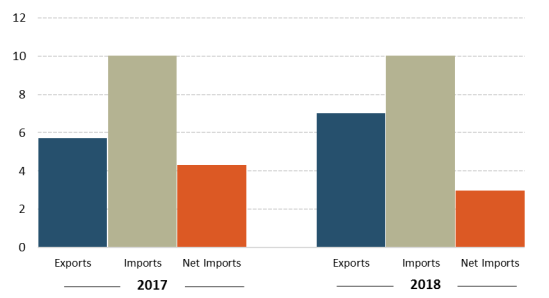
While U.S crude oil and petroleum product imports are declining, exports are breaking records. The EIA estimates that the United States exported around 7 Mb/d of crude oil and products combined in 2018 (Figure 4). EIA further projects that, in most modeling cases, the United States will become a net petroleum exporter around 2030.25 As Figure 4 indicates, from 2017 to 2018, gross imports remained constant while exports increased, reducing net imports.26 Top destinations for U.S. crude oil and petroleum product exports include Mexico, Canada, China, Brazil, and Japan. According to EIA data, these five countries received about half of all U.S. oil exports in 2017. On average, Mexico imported 1 Mb/d of U.S. crude oil and petroleum products in 2017 (nearly double from 2013 levels), due to Mexico's decreased production coupled with rising demand.27 Mexico has not kept up refining to meet domestic demand. In 2016, Mexico became a net oil importer from the United States for the first time.28 U.S. gasoline exports in 2018 were more than half of Mexico's gasoline consumption.29
|
Figure 4. U.S. Crude Oil and Petroleum Products Trade Balance Average million barrels per day |
 |
|
Source: U.S. Energy Information Administration, "Weekly Imports and Exports," online database, January 9, 2019, https://www.eia.gov/dnav/pet/pet_move_wkly_dc_NUS-Z00_mbblpd_4.htm. Note: Average of all available weekly EIA data for 2017 and 2018. |
World Oil Market
In general, the world oil market determines the price and supply of oil and petroleum products for U.S. consumers, which may impact policy decisions by Congress. In January 2019, the World Bank projected world gross domestic product growth of 2.9% in 2019 and 2.8% in 2020-2021.30 As developing economies grow, so too does their demand for fuel and consumer goods, including paints, lubricants, and plastics—many dependent on crude oil. Meanwhile, many countries are also trying to reduce greenhouse gas emissions, diversify their fuel mix, and enhance energy security and independence.
The world oil market historically follows the world economy as it grows or declines. Supply generally does not follow demand smoothly, and this results in price volatility. For example, supply bottlenecks can constrain open trade, which can conflate prices and access. The Government of Alberta instituted a crude oil curtailment policy in January 2019, as crude producers faced export infrastructure bottlenecks.31 The inability to export excess production had caused storage to increase to 35 million barrels of crude oil (nearly double the historical amount) for the Canadian province. Further, prices declined during this period of overproduction to $11.43/bbl from $58.49.32
In addition to economic growth or decline, the world oil supply is influenced by a number of drivers, including project investments, the price of oil, demand forecasts, and geopolitics. Oil producers attempt to match world demand projections by making new production investments and replacing exhausted or uncompetitive production sites.
World Supply
The EIA estimated the world's proved reserves in 2017 at approximately 1,645 billion barrels of oil. The world supplied approximately 98 Mb/d of petroleum and other liquids; this equates to roughly 50 years of production at 2017 levels.33 As noted above, proved reserves incorporates crude oil prices, domestic fiscal conditions, geology, and the technology available to economically produce from the reserve base. Often suppliers make decisions to maximize revenue without causing a corresponding decrease in demand. Similarly, volatility in oil prices can create swings in revenue that can disrupt or enable development plans among producers. Venezuela, according to EIA, holds the world's largest proved reserves at 301 billion barrels of oil in 2017, followed by Saudi Arabia (266 billion barrels) and Canada (170 billion barrels).
Proved reserves do not necessarily correlate with production levels. Venezuela, for example, has significantly decreased its crude oil production (due in part to a lack of investment and other contributing factors) while the United States has become the number one producer. The EIA estimated that the United States surpassed Russia and Saudi Arabia as the world's number one crude oil producer in 2018. National oil companies (NOCs) dominate Russian and Saudi Arabian oil production. NOCs operate under government ownership or are companies under influence by national governments. In contrast, oil companies in the U.S. private sector operate autonomously.
Saudi Arabia, historically the world's leading oil producer and a member of OPEC, has held enough spare capacity to influence the market when it has deemed it necessary.34 In September 2018, Saudi Arabia held an estimated 1.5 Mb/d of crude oil spare capacity, or 72% of world spare capacity.35 Spare capacity allows for swift adjustments to crude oil output that can affect the world oil market.36
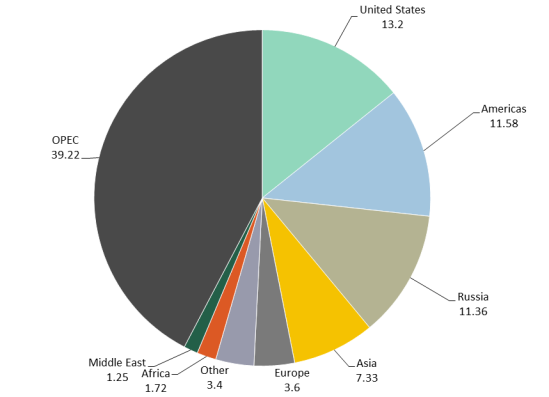
OPEC, through crude oil policy decisions, can influence the world's oil supply and as a result crude oil prices.37 OPEC is an organization of oil-producing nations that together represent nearly 40% of world oil production (see Figure 5).38 Saudi Arabia, a founding member of OPEC, holds the largest share of OPEC production.39 Although not an OPEC member, Russia recently has coordinated with OPEC on oil supply decisions, which can have a profound effect on the world market. For example, Russia is a participating country to the Declaration of Cooperation, an agreement between OPEC and non-OPEC countries to adjust world oil market production.40
OPEC countries, particularly Saudi Arabia, often maintain varying levels of spare oil capacity. Those with the greatest spare capacity may be referred to as "swing producers," as they may have the ability to more easily influence the oil market. Swing producers may use their spare capacity to bring balance to an often unstable market, but also may have the power to manipulate the price of oil by either flooding the market (causing downward pressure on price) or by reducing supply (resulting in an increase in price).
While OPEC dominates oil production, other non-OPEC countries will gain market share contributing to world supply growth through 2023. The International Energy Agency (IEA) estimates that the United States, Brazil, and Canada will provide the majority of world supply growth. Iraq, Iran, Norway, the United Arab Emirates, and Libya also are expected to contribute to oil supply growth through 2023, but to a smaller degree. Total non-OPEC supply growth is expected to increase by 5.2 Mb/d by 2023, accounting for 81% of 6.4 Mb/d of total world oil capacity growth during this period.41
|
Figure 5. 2017 World Oil Production Million barrels per day |
 |
|
Source: International Energy Agency, "Oil 2018," Market Report Series, March 5, 2018, https://www.iea.org/oil2018. Notes: IEA data on oil production comprises crude oil, condensates, natural gas liquids, oil from nonconventional sources, and nonoil inputs to Saudi Arabian Methyl Tertiary Butyl Ether (MTBE). Organization of the Petroleum Exporting Countries (OPEC) represents 2017 OPEC members; Congo joined in 2018 and is not included in OPEC. Chart does not include processing gains or biofuels. Other includes Asia Oceania and former USSR, excluding Russia. Americas include Latin America and North America, excluding the United States. |
While the EIA projects the United States, Brazil, and Canada to drive supply growth through 2023, a number of other countries may experience production declines. China, Mexico, and Venezuela have seen comparatively lower production for the past three years as a result of lower investments and other contributing factors. Venezuelan crude oil production has trended downward since 1998 from approximately 3.4 Mb/d to 2 Mb/d in 2018, with IEA forecasting continued declines to as low as 1 Mb/d through 2023.42
The IEA reports that globally new oil discoveries fell to a record low in 2017 with 4 billion barrels of new crude oil reserves discovered. Producers consider world demand growth forecasts when making investment decisions. If the prospects for increasing oil consumption appear minimal or if the price outlook looks uneconomical, then producers may be more hesitant to invest in new fields.43 Producers, however, are looking at ways to make existing mature fields more productive, as well as increasing production of alternatives to crude oil, such as biofuels. Mature fields with production that is declining or nearing retirement may not necessarily be fully exhausted, but rather, oil extraction costs may be at a point that is no longer profitable in the world market.
World Demand
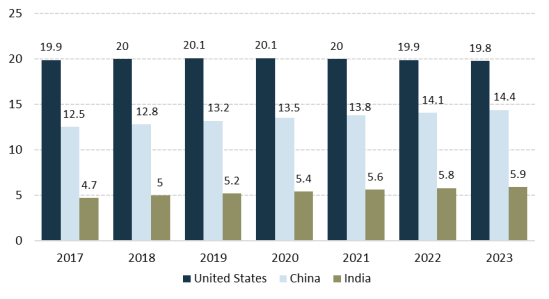
In 2018, world oil product demand was 99.2 Mb/d, and IEA projects that this will increase to 104.7 Mb/d by 2023.44 Countries seeing the strongest gains economically may also see growth in their demand for oil. The IEA projects China and India to contribute to a large portion of oil demand growth, representing around 20% of total world demand. IEA projects China's oil demand to grow from 12.5 Mb/d in 2017 to 14.4 Mb/d in 2023. India's demand projection is to grow by about 0.2 Mb/d annually to total demand of 5.9 Mb/d in 2023. As demonstrated by Figure 6, IEA projects relatively flat demand growth for the United States through 2023.
|
Figure 6. Projected U.S. Oil Demand Compared to China and India Average million barrels per day |
 |
|
Source: International Energy Agency, "Oil 2018," Market Report Series, March 5, 2018, p. 125. |
Several forecasts estimate that the transportation sector will continue to dominate oil demand. For example, British Petroleum (BP) estimates that transportation will comprise over half of world oil demand through 2040.45 IEA projects transportation sectors will represent 6.4 Mb/d of the 9.6 Mb/d total oil demand growth from 2017 through 2030.46 In addition to transportation, the IEA projects petrochemicals (e.g., a chemical product derived from petroleum refining) to contribute to nearly one-third of that total demand growth, at 3.2 Mb/d.
Oil demand forecasting for the transportation sector is subject to policy, regulation, and technological development (e.g., electric vehicles). Some countries or international organizations may enact regulations to increase efficiency or to diversify the fuel mix. For example, the International Maritime Organization has set a new world limit of sulfur content in fuel oil used in ships (0.5% down from 3.5%) beginning in 2020.47 It remains to be seen whether this limit will impact the overall oil market, but crude oils already low in sulfur content may be in higher demand. The shipping industry may even look toward alternative fuels, such as biofuels or liquefied natural gas (LNG, which has negligible sulfur emissions), depending on price and availability.48 Shippers could also install "scrubbers" (e.g., exhaust cleaning systems) onboard to reduce the sulfur emissions and avoid switching fuels.
Petrochemicals contribute to the manufacture of many everyday household items (e.g., paints, lubricants, cars, and plastics). The increase in availability of lighter crude oils in the United States (along with natural gas production in the form of natural gas liquids) contributes to this production industry. Crude oils of this quality can more easily produce ethane, a feedstock once processed becomes ethylene, most commonly used in the making of plastics. Efficiency gains and environmental policy considerations may affect forecasted petrochemical demand growth.
Forecast models predicting world oil demand rely on assumptions and can provide divergent results. Projections are highly dependent on their methodologies, assumptions, and available data. For instance, the IEA has multiple scenarios for forecasting (e.g., "Sustainable Development," "Current Policies," and "New Policies"), and each scenario results in different forecasts of future oil demand. In the Sustainable Development scenario, oil demand peaks (i.e., reaches its highest point) around 2020 and begins to decline through 2040, whereas the Current Policies scenario sees strong oil demand growth through 2040.49 Fuel efficiency standards, alternative fuels, and other policies can all contribute to varying oil demand forecasts across all sectors. These different forecast scenarios illustrate the complexity of oil demand, as well as the effect policy can have on it.
World Prices and Factors
Oil prices in the world market are determined fundamentally by supply and demand, which in turn depend on a number of other factors, such as currency exchange rates, the condition of the world economy, investments, and political environments. The market fluctuates over time with numerous often unforeseen circumstances, but responds to decisions and events occurring today.
As mentioned above, various hubs price and trade oil in different regions all over the world. These hubs, despite location, trade oil in the U.S. dollar (as is the case with many other commodities), as it serves as a reserve currency for the world economy. As a result, the U.S. dollar and the price of oil have had an inverse relationship, in which a weak dollar has made oil more attractive for purchase to buyers holding other currencies.50 However, in March 2018, China launched its first crude oil futures contract in Shanghai pegged to the Chinese yuan. As a recent development, it remains to be seen how this will impact oil trade. In the first six months of the Shanghai futures, trade volumes have surpassed the Dubai Mercantile Exchange's oil contract.51
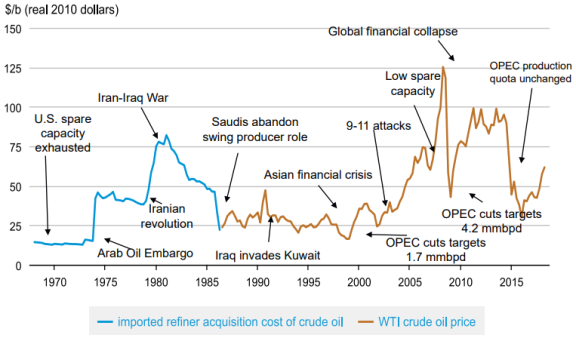
As Figure 7 demonstrates, several events have correlated to drastic changes in the oil sector. In late 2014, the price of oil decreased from a period of high prices (around $100/bbl in real 2010 dollars) to an annual average low (under $40/bbl in real 2010 dollars), causing producers to reconsider investments in new locations with higher production costs. The price decline was in part due to an oversupplied market, furthered by an OPEC decision to maintain production levels in November 2014, in part to defend market share. OPEC decisions, political destabilization, financial crisis, and war are some of the world events that can affect the supply and price of oil. Geopolitical events resulted in changes to the price of oil, just as the price of oil elicited changes in foreign policy.
|
Figure 7. Crude Oil Prices React to a Variety of Geopolitical and Economic Events |
 |
|
Source: U.S. Energy Information Administration, What Drives Crude Oil Prices?, slide presentation, September 11, 2018, https://www.eia.gov/finance/markets/crudeoil/reports_presentations/crude.pdf. |
World Trade Volumes
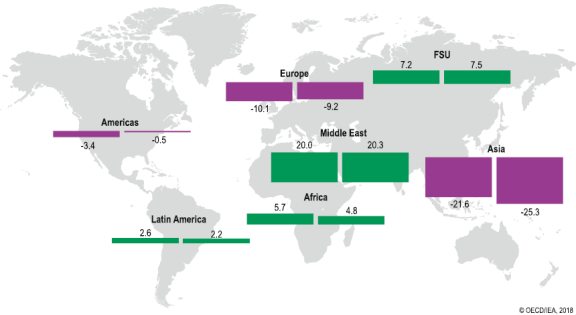
The IEA Oil 2018 report forecasts an almost near parity between domestic production and consumption in the Americas (down to -0.5 Mb/d) in 2023, while Asia's oil trade deficit (led by China's imports) may increase to about -25.3 Mb/d in 2023 (Figure 8). Middle Eastern (ME), Former Soviet Union (FSU), and European crude oil balances, according to IEA projections, will see only marginal changes—a slight increase in exports for ME and FSU, a slight decrease in imports for Europe (Figure 8). Furthermore, the IEA projects that Latin America may see a slight drop in exports as Venezuela continues to decline in production. In Africa, Nigeria and Egypt may increase domestic consumption, while Angola continues to decline. The IEA also forecasts countries in the Organisation for Economic Co-operation and Development (OECD) on average to trend toward import reduction, as a result of efficiency gains, emissions policies, and fuel diversification (e.g., natural gas in power generation in place of diesel).
According to IEA, Asia will increase imports 3.7 Mb/d by 2023. China's projection alone sees an increase in net imports of crude oil from just over 8 Mb/d in 2017 to 10 Mb/d in 2023.52 China's imports are likely to continue coming from current trading partners, but at higher volumes, with Russia being the top exporter to China. Largely due to an extensive pipeline infrastructure network, Russia exports oil directly to China. Two recently completed Russian pipelines now have a total capacity of 0.6 Mb/d to China.53
The IEA projects the United States, Norway, Brazil, and Canada to provide the largest new non-OPEC crude exports to the world market. The IEA projects Europe to reduce oil imports and diversify its imports away from reliance on Russia, bringing more imports of crude oil from the United States. According to the IEA, Brazil may increase exports by about 1 Mb/d and offset some of the reduction from Venezuela. Meanwhile, the IEA estimates that Canadian producers may be able to increase exports, but face transportation bottlenecks, limiting their export capacity. The largest outlet for Canadian crude is the United States, either via pipeline or rail. Should the United States reach capacity limits, Canadian producers may have to consider new opportunities. The United States, however, may continue to import Canadian heavy crude oil and export U.S. light crude oil. Canadian producers are attempting to bring oil via pipeline to its west coast for marine export to meet the growing demand in Asia. However, Canadian producers face opposition from environmental groups and from the provincial and local government, resulting in challenges for pipeline approvals.54
Policy Considerations
While the oil market directly affects the economy, oil-related policy has the power to influence geopolitics and can be utilized as a tool to influence other countries. Oil policy can be influential in a number of ways, for instance as a response to or in anticipation of undesirable international behavior or as a means to bring balance and stability to an otherwise volatile market. Decisions about energy conservation, environmental protection, and protection of strategic resources can also affect a country's oil supply and demand. The United States plays a multifaceted role in the world oil market, which may affect Congress's policy decisions.
International Policy Measures
Role of OPEC
As noted, individual countries or events may be able to affect the oil market. OPEC, especially in conjunction with other major producers (e.g., Russia), can exert a greater influence. OPEC produces 40% of world crude oil and maintains enough spare capacity to affect the market.
In November 2016, OPEC, Russia, and other non-OPEC members committed to reduce the supply of oil in the world market due to low prices.55 Since the production cuts began prices increased from around $45/bbl in January 2015 to $84/bbl in October of 2018.56 Overall, OPEC has exceeded the original production cuts of 1.2 Mb/d agreed to in November 2016, reaching 147% compliance in May 2018. Since 2017, the schedule and quota for production cuts has shifted, as the non-OPEC group has not been in full compliance, while other OPEC members have reached targets and even in some cases have exceeded them.57 In June 2018, recognizing this overcompliance and rising oil prices, OPEC and Russia agreed to increase production back to 100% group-level compliance with the November 2016 target.58 Prices have since declined to around $50/bbl in early January 2019.59
Addressing OPEC's Market Influence
OPEC's coordinated effort to adjust the world supply of oil has an effect on price. OPEC's spare capacity and willingness to adjust production levels gives the organization the ability to exert such influence. Several bills introduced in the 115th Congress addressed the U.S. relationship with OPEC, including the United States Commission on the Organization of Petroleum Exporting Countries Act of 2017 (H.R. 545); the OPEC Accountability Act of 2018 (S. 2929); and the No Oil Producing and Exporting Cartels (NOPEC) Act of 2018 (H.R. 5904 and S. 3214). Both the House and the Senate NOPEC bills would have amended antitrust law, known as the Sherman Act, to make oil cartels illegal and prosecutable by the U.S. Department of Justice.60 NOPEC would have revoked the sovereign immunity historically applied to OPEC members, allowing the United States to sue for collusion. It would have made production and price manipulation illegal.61 Similar bills have been introduced in other Congresses, but were not enacted.
Some private sector entities expressed opposition to H.R. 5904 and S. 3214. For instance, on August 22, 2018, the American Petroleum Institute (API) issued a letter to Congress opposing NOPEC. It stated the legislation may have unintended consequences for the U.S. oil and gas sectors and expressed concerns for U.S. diplomatic and military interests, reciprocal action by OPEC countries.62 Low oil prices are not necessarily ideal for all U.S. stakeholders throughout the oil supply chain. For example, refiners prefer lower oil prices since they are buying crude oil; however, U.S. producers (depending on their costs of extraction, transportation, etc.) may find extraction of crude oil uneconomic below a certain price. The pressure from these various stakeholders and their effect on government policy is an important factor in the oil market.
Oil-Targeted International Sanctions
Members of Congress and Presidents have sought to use oil policy as a foreign policy tool. Historically, Congress and the executive branch have placed sanctions on crude oil, the banking and the financial sectors, and other oil-related sectors in order to communicate favor or disfavor to the governments of certain countries. Often, oil-targeted sanctions have been on selected countries with NOCs, which finance and support government operations. Congress also has used sanctions against individuals, entities, and governments as a response to undesirable international behavior. For example, the 115th Congress passed the Countering America's Adversaries through Sanctions Act of 2017 (P.L. 115-44), which established requirements for, and granted the President authority to impose, sanctions on Iran, Russia, and North Korea.
Russia Sanctions
In 2014, in response to Russia's invasion and annexation of Ukraine's Crimea region and Russia's subsequent support of separatists in eastern Ukraine, the United States imposed sanctions on over 600 individuals, entities, and vessels.63 President Barack Obama, in initiating economic sanctions on Russian individuals, declared that these activities in Ukraine "threaten its peace, security, stability, sovereignty, and territorial integrity" and constitute a threat to U.S. national security.64 The United States worked with the European Union to amplify the effect of sanctions on Russia and since 2014 has widened their scope in response to election interference, illegal trade with North Korea, and other activities.65
The Russia sanctions target several different sectors, including energy, and specifically oil production. Known as "sectoral sanctions," they include restrictions on (1) financing to specific oil companies, and (2) engagement (trade, technology, support, etc.) in certain kinds of oil projects (shale, Arctic offshore, deepwater, etc.) under the directive of Executive Order 13662 and the Ukraine Freedom Support Act of 2014 (P.L. 113-272), as amended.66 Since 2014, the success of these sectoral sanctions has been difficult to ascertain, as the price of oil sharply declined during the same time period. Furthermore, Russia enacted changes in its tax system and devalued the ruble. Russian economic growth correlates with oil prices. The price collapse likely had an effect on Russia, as economic growth slowed and even contracted by 2.5% in 2015.67 With the price of oil strengthening, so too did Russia's economy, which grew by 1.5% in 2017.68 However, the technology-related sanctions aim to have a longer-term effect on Russian oil production by limiting access to U.S. and EU technology.69 The overall effect of these technological sanctions on Russian oil production may take years to come to fruition.
Iran Sanctions
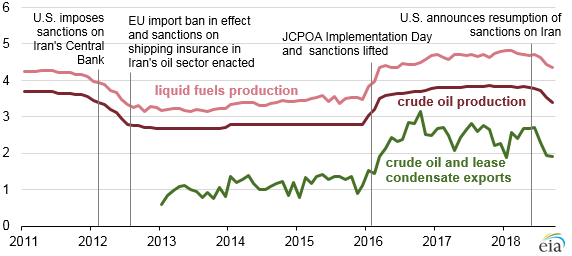
The United States has been utilizing sanctions on Iran for decades as part of an ongoing policy strategy to compel Iran to cease supporting terrorism, to provide transparency of Iran's nuclear program, and to limit strategic power in the Middle East.70 Starting midyear 2012, the United States and the European Union together enforced sanctions on Iran. These hindered Iran's economy and cut crude production by around 1 Mb/d through 2015, according to EIA (Figure 9). In 2016, these sanctions were lifted,71 and Iran increased its crude production back to presanctions levels of just under 4 Mb/d.
In May 2018, the Trump Administration announced its intention to withdraw from the Joint Comprehensive Plan of Action (which relieved Iran of the 2012-2015 sanctions). In August 2018, the Administration announced that sanctions would be resumed.72 Overall, these reinstated sanctions, although not adopted worldwide, have had an effect on the Iranian economy, as companies have moved to comply to avoid U.S. penalties for dealing with Iran. Iran's crude oil exports fell to their lowest in 2.5 years in September 2018 to 1.72 Mb/d.73
On November 5, 2018, China, India, Italy, Greece, Japan, South Korea, Taiwan, and Turkey were issued waivers to the Iranian oil sanctions with an expiration date set for May 2, 2019. The Trump Administration announced on April 23, 2019, that waivers would no longer be issued or extended beyond May 2. Secretary of State Mike Pompeo stated in a press release that this is to "apply maximum pressure on the Iranian regime until its leaders change their destructive behavior, respect the rights of the Iranian people, and return to the negotiating table."74 Iran's exports fell to just around 1 Mb/d in April 2019.75
Venezuela Sanctions
Venezuela has experienced production declines for many reasons, including sanctions. For years, the Venezuelan government has used revenues from the NOC Petróleos de Venezuela, S.A (PdVSA) to pay for social services and support government spending. When the price of oil collapsed, Venezuela's lack of investment, corruption, and a lack of technical expertise led to oil production declines from roughly 2.5 Mb/d in 2015 to IEA estimates of around 1.5 Mb/d in 2018.76
For over a decade the United States has imposed a range of sanctions on the Venezuelan government. The Trump Administration imposed sanctions restricting Venezuela's access to U.S. financial markets in August 2017, increasing fiscal pressure on the government.77 On March 21, 2018, through E.O. 13827, "Taking Additional Steps to Address the Situation in Venezuela," the Administration expanded on 2017 sanctions. Furthermore, on January 25, 2019, the Administration updated the executive orders by broadening "the definition of the term 'Government of Venezuela' to include persons that have acted, or have purported to act, on behalf of the Government of Venezuela."78 Under these updates, U.S. consumers can continue to purchase Venezuelan crude oil until April 28, 2019, but the payments will be held in blocked accounts.79
A prohibition on U.S. crude oil imports from Venezuela could result in a shock to the world oil market and a constraint in the world oil supply system, resulting in U.S. Gulf Coast refineries experiencing higher oil prices.80 However, this initial shock may be short term, as the market would eventually find alternative sources.
Protection of Trade Routes
While the oil market has changed in the past 40 years, physical threats to oil supply still exist, particularly along certain trade routes. Bottlenecks or disruptions along routes can affect the supply of oil and ultimately the price consumers pay. This section will highlight some examples.
A key waterway for the transit of oil and natural gas is the Strait of Hormuz in the Persian Gulf.81 This juncture is the only passage in the Persian Gulf with access to the open ocean and is surrounded by some of the world's largest oil-producing countries. Roughly 24% of the world oil market, almost 22 Mb/d of crude oil and petroleum products, transited the Strait of Hormuz in the first half of 2018.82 Saudi Arabia has other outlets for oil exports, including the Red Sea; however, the Bab al-Mandeb Strait (where the Red Sea and the Gulf of Aden meet just along the shores of Djibouti, across from Yemen) is another choke point. Saudi Arabia in the summer of 2018 temporarily announced a suspension of oil shipments (roughly 500,000-700,000 barrels per day) through the Bab al-Mandeb Strait after two ships were attacked by Yemen's Houthis.83 As introduced in the House, a previous version of the National Defense Authorization Act (NDAA) for Fiscal Year 2018 (P.L. 115-91) included language specific to defending critical choke points of interest to national security in the Persian Gulf. While P.L. 115-91 as enacted did not include this language, the House Committee on Armed Services, in H.Rept. 115-200, stressed that the U.S. military should maintain capabilities to "ensure freedom of navigation at the Bab al Mandab Strait and the Strait of Hormuz."
The political relationships of the United States with Iran, Saudi Arabia, other members of OPEC, and China have been strategically important when considering legislation that may affect the security of supply along major oil trade routes. Though most of the oil that flows through the Strait of Hormuz goes to Asia, the world oil market is integrated, so a disruption anywhere can contribute to higher oil prices everywhere. If a major disruption were to occur, depending on the size and cause, the supply shock to the international oil market would likely put upward pressure on oil prices. Some possible examples include escalating war in Yemen;84 armed confrontation with Iran; and increased tensions over Chinese control in South China Sea.85 The impact of oil price increases on other economic sectors is difficult to ascertain and challenging to predict, given the pervasive role of oil and oil-based products in the world economy. Despite a new era of abundance for the United States, a massive disruption to world supply along trade routes could permeate into geopolitical relationships, secondary industries (e.g., petrochemicals, agriculture), and the economy at large.
Selected Domestic Policy Measures
Congress over many years has enacted several laws intended to secure the nation's oil supply. The 1970s was an especially busy time for Congress in this area. Largely in response to the OAPEC oil embargo and exhausted U.S. spare capacity, Congress considered security-of-supply policy options. This time period initiated the perception of energy scarcity in the United States. Since then, Congress has continuously demonstrated interest in the oil market. This section identifies some of the ways in which Congress has addressed oil consumption and security.
Creation of the Strategic Petroleum Reserve
In response to the 1973 OAPEC oil embargo, the United States entered into the International Energy Program in 1974, an agreement that requires all members to hold a 90-day supply of petroleum (based on the previous year's net imports) for emergency use. The following year, Congress passed the EPCA of 1975 (P.L. 94-163), which authorized the creation of the SPR to address emergency supply shortages.86 The SPR originally was an up to 1 billion barrel petroleum reserve (a combination of crude oil, home heating oil, and gasoline), located around the Gulf of Mexico and in the Northeast. Congress, in 1990, amended the EPCA (P.L. 101-383) to authorize the President to initiate SPR drawdowns during times of economic stress, not necessarily considered an emergency. Congress has also authorized sales form the SPR for various purposes. Its current inventory is around 650 million barrels.87 Today the SPR's role has expanded to ensure ready oil supplies during natural disasters and to help stabilize the oil market.
Corporate Average Fuel Economy Standards
The EPCA of 1975 also established Corporate Average Fuel Economy (CAFE) standards that began in model year (MY) 1978 for passenger cars and for light trucks in MY 1979.88 CAFE standards require auto manufacturers to meet miles-per-gallon fuel economy targets for passenger vehicles and light trucks sold in the United States. If a manufacturer fails to do so, it is subject to financial penalties.
Vehicle miles per gallon have increased significantly since the institution of CAFE standards. For example, according to the Department of Energy's 2018 Transportation Energy Data Book, starting in 1978, passenger vehicle fuel use dropped from around 80 billion gallons of gasoline to just above 69 billion in 1982.89 Conversely, the number of registered vehicles increased from 116 million to 123 million during the same time period. While the number of registered passenger vehicles increased, the number of miles driven per vehicle stayed relatively flat (around 9,000 miles per vehicle) throughout the time period.
In August 2018, the Environmental Protection Agency and the National Highway Traffic Safety Administration proposed amendments to CAFE standards. These proposed amendments offer eight alternatives for MY 2021-2026. The agencies' preferred alternative is to retain the existing standards through MY 2020 and then to freeze the standards at this level for both programs through MY 2026.90
Electric Vehicles
Congress has passed several laws establishing tax credits for plug-in electric vehicles (EVs). The Energy Improvement and Extension Act of 2008, enacted as Division B of P.L. 110-343, established the credit for plug-in EVs. As first enacted, the credit phased out once 250,000 credit-eligible vehicles were sold. The plug-in EV phaseout threshold changed from a 250,000-vehicle limit to a 200,000-vehicle per manufacturer limit in the American Recovery and Reinvestment Act of 2009 (P.L. 111-5).
EVs may play an important role in the future of oil as the transportation sector diversifies fuel sources. In the United States, EVs had less than 4% market share in 2017.91 Competitive gasoline prices and the often higher cost of initial purchase for EVs may be factors contributing to the relatively slow growth in market share for EVs. In the 115th Congress, there were proposals to extend, as well as proposals to repeal, the plug-in EV tax credit.92
Renewable Fuel Standard
In 2005, Congress established the Renewable Fuel Standard (RFS) with the passage of the Energy Policy Act (P.L. 109-58), and expanded it in 2007 with the Energy Independence and Security Act (P.L. 110-140). The RFS requires transportation fuel to contain an increasing amount of renewable fuels, including conventional biofuel, advanced biofuel, cellulosic biofuel, and biomass-based diesel.93 At the time, transportation sector fuel diversity was negligible; the stronger the reliance of an economic sector on one fuel source, the more at risk it is to fuel supply disruptions. The RFS, in concept, intends to provide some diversification to transportation fuels away from a strong reliance on traditional gasoline or diesel derived from crude oil. Additionally, the focus on agriculture-derived fuels would support the U.S. biofuel industry and could reduce greenhouse gas emissions compared to traditional gasoline and diesel.94 Implementing the RFS has been challenging due to a number of factors (e.g., infrastructure, technology, and limited federal assistance). Some Members of Congress have expressed concerns about whether or not to amend or repeal the RFS.95
Other Considerations
This report has reviewed select policy issues from the full suite of legislative measures that may influence the world oil market. Domestically, for example, Congress could enact legislation to increase or reduce production by opening areas or restricting certain technologies. Furthermore, emissions controls and emissions-related policies could play a pivotal role in the world oil market. For instance, the Bipartisan Budget Act of 2018 (P.L. 115-123) expanded the 45Q tax credit from $10 to $35 per ton of carbon dioxide (CO2) for use in enhanced oil recovery.96 The 45Q tax credit demonstrated an interest in utilizing CO2 emissions, while at the same time expanding oil production in the United States. Furthermore, oil tends to affect many other sectors of the economy and vice versa. Policy changes in one sector could have intended or unintended consequences for the oil market. For instance, tariffs on steel could affect production transportation costs. Other major policy considerations could include international trade policies, infrastructure, diversification of transportation fuels, and funding in research and development.
