Cross-Border Energy Trade in North America: Present and Potential
The United States, Canada, and Mexico in many ways comprise one large, integrated market for energy commodities. Canada, for example, is the single largest foreign supplier of crude oil to the United States, and the United States is Canada’s sole crude oil customer. Both Mexico and Canada are major buyers of petroleum products refined in the United States. A growing trade in natural gas produced in the United States is also increasingly important to the energy relationship among the three countries. Trade in the other energy commodities—electricity, natural gas liquids, and coal—is comparatively small, but regionally important. Altogether, the value of the energy trade between the United States and its North American neighbors exceeded $140 billion in 2015, with $100 billion in U.S. energy imports and over $40 billion in exports.
The United States’ energy trade relationships with Canada and Mexico are increasingly complex. They have been undergoing fundamental change in recent years—largely due to technological advancements in the petroleum and natural gas sectors creating new competition for energy supplies and new market interconnections. Consequently, while energy policies in one country have inevitably affected the others, their cross-cutting effects in the future are difficult to predict. Nonetheless, a review of the recent trade data highlights several key market developments.
U.S. crude oil imports from both Canada and Mexico dominate the energy trade, but they support U.S. supplies of refined products to both those countries—by far the United States’ largest energy export commodity to its two neighbors.
U.S. development of shale gas resources has been substituting for Canadian natural gas imports and driving a rapid increase in natural gas exports to Mexico, where such supplies are in high demand to fuel that country’s growing electric power sector.
Canada and, to a lesser extent, Mexico have potential to provide significant future supplies of renewable electricity to U.S. markets, which could help the United States meet environmental policy objectives.
The expansion of cross-border energy transportation infrastructure—pipelines for oil and natural gas, and transmission lines for electricity—has been an ongoing enabler of increased energy trade. A number of new projects are currently under construction or proposed to further expand cross-border capacity, but their completion is not assured.
To date, Congress has favored a growing North American energy partnership—but ensuring that this partnership continues to be as mutually beneficial as possible will likely remain a key oversight challenge for the next decades. Congress has been facing important policy questions in the U.S.-Canada and U.S.-Mexico energy contexts on several fronts, including the siting of major cross-border pipelines, increasing petroleum supplies from Canadian oil sands, exporting natural gas production from United States’ shales, and meeting commitments to increase renewable energy supplies and reduce atmospheric emissions of greenhouse gases. Legislative proposals in the 115th Congress could directly influence these developments.
Cross-Border Energy Trade in North America: Present and Potential
Jump to Main Text of Report
Contents
- Introduction
- Crude Oil and Refined Products
- Crude Oil Proved Reserves
- Crude Oil Production
- Crude Oil Consumption and Export Capacity
- Crude Oil Trade
- Refined Petroleum Products Trade
- Cross-Border Oil and Refined Products Infrastructure
- Natural Gas
- Natural Gas Trade
- Cross-Border Natural Gas Infrastructure
- Natural Gas Liquids
- NGL Reserves and Production
- Cross-Border NGL Trade
- NGL Transportation Infrastructure
- Electricity
- Electric Power Resources
- U.S. Electric Power Import and Exports
- Prospects for Future Electricity Trade
- Renewable Electricity Resources, Generation, and Trade
- Coal
- Cross-Border Trade Volumes in Coal
- Coal Trade by Mode
- Projections for Future Trade and Key Drivers
Figures
- Figure 1. U.S. Energy Commodity Trade with Canada and Mexico—2015
- Figure 2. North American Crude Oil Proved Reserves
- Figure 3. North American Crude Oil Production
- Figure 4. Crude Oil Production Net of Domestic Consumption
- Figure 5. U.S. Net Import of Crude Oil by Country
- Figure 6. North American Crude Oil Trade by Mode
- Figure 7. Canadian Oil Export Pipelines and Selected U.S. Oil Pipelines
- Figure 8. North American Refined Products Trade by Mode
- Figure 9. North American Natural Gas Resources and Reserves 2015
- Figure 10. North America Natural Gas Production 2006-2020
- Figure 11. U.S. Exports and Imports of Natural Gas 2006-2020
- Figure 12. North American Natural Gas Pipeline Border Crossings
- Figure 13. U.S. Natural Gas Cross-Border Pipeline Capacity to Mexico
- Figure 14. U.S. NGL Production 2006-2020
- Figure 15. U.S. NGL Exports by Fuel
- Figure 16. Annual Electric Generation by Fuel Type
- Figure 17. U.S. Net Electricity Generation from Select Fuels
- Figure 18. U.S. Electricity Imports from and Exports to Canada and Mexico
- Figure 19. U.S.-Mexico Electric Transmission Interconnections
- Figure 20. Solar Energy Resources in North America
- Figure 21. United States Wind Resources
- Figure 22. Canadian Hydro Capacity and Potential
- Figure 23. Renewable Generation by Country
Summary
The United States, Canada, and Mexico in many ways comprise one large, integrated market for energy commodities. Canada, for example, is the single largest foreign supplier of crude oil to the United States, and the United States is Canada's sole crude oil customer. Both Mexico and Canada are major buyers of petroleum products refined in the United States. A growing trade in natural gas produced in the United States is also increasingly important to the energy relationship among the three countries. Trade in the other energy commodities—electricity, natural gas liquids, and coal—is comparatively small, but regionally important. Altogether, the value of the energy trade between the United States and its North American neighbors exceeded $140 billion in 2015, with $100 billion in U.S. energy imports and over $40 billion in exports.
The United States' energy trade relationships with Canada and Mexico are increasingly complex. They have been undergoing fundamental change in recent years—largely due to technological advancements in the petroleum and natural gas sectors creating new competition for energy supplies and new market interconnections. Consequently, while energy policies in one country have inevitably affected the others, their cross-cutting effects in the future are difficult to predict. Nonetheless, a review of the recent trade data highlights several key market developments.
- U.S. crude oil imports from both Canada and Mexico dominate the energy trade, but they support U.S. supplies of refined products to both those countries—by far the United States' largest energy export commodity to its two neighbors.
- U.S. development of shale gas resources has been substituting for Canadian natural gas imports and driving a rapid increase in natural gas exports to Mexico, where such supplies are in high demand to fuel that country's growing electric power sector.
- Canada and, to a lesser extent, Mexico have potential to provide significant future supplies of renewable electricity to U.S. markets, which could help the United States meet environmental policy objectives.
- The expansion of cross-border energy transportation infrastructure—pipelines for oil and natural gas, and transmission lines for electricity—has been an ongoing enabler of increased energy trade. A number of new projects are currently under construction or proposed to further expand cross-border capacity, but their completion is not assured.
To date, Congress has favored a growing North American energy partnership—but ensuring that this partnership continues to be as mutually beneficial as possible will likely remain a key oversight challenge for the next decades. Congress has been facing important policy questions in the U.S.-Canada and U.S.-Mexico energy contexts on several fronts, including the siting of major cross-border pipelines, increasing petroleum supplies from Canadian oil sands, exporting natural gas production from United States' shales, and meeting commitments to increase renewable energy supplies and reduce atmospheric emissions of greenhouse gases. Legislative proposals in the 115th Congress could directly influence these developments.
Introduction
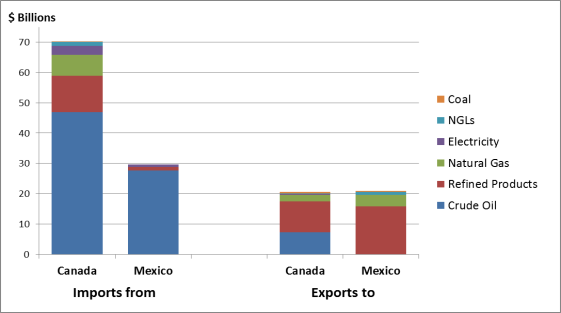
The United States, Canada, and Mexico in many ways comprise one large, integrated market for energy commodities. Canada, for example, is the single largest foreign supplier of crude oil to the United States, and the United States is Canada's sole crude oil customer. Both Mexico and Canada are major buyers of petroleum products refined in the United States. A growing trade in natural gas produced in the United States is also increasingly important to the energy relationship among the three countries. Trade in the other energy commodities—electricity, natural gas liquids (NGLs), and coal—is comparatively small, but regionally important. Altogether, the value of the energy trade between the United States and its North American neighbors exceeded $140 billion in 2015, with $100 billion in U.S. energy imports and over $40 billion in exports (Figure 1).
The energy trade of the United States with Canada and Mexico has helped to promote general economic growth and energy industry job creation on both sides of the U.S. border, although it has also prompted debate about the environmental impacts of energy resource development, the expansion of energy infrastructure, effects on domestic energy prices, and other market issues. Increased energy trade between the United States, Canada, and Mexico—stable, friendly neighbors—is also viewed by many as a major contributor to U.S. energy independence and security. These energy trade relationships are increasingly complex, however, and have been undergoing fundamental change in recent years, largely due to technological advancements in the petroleum and natural gas sectors creating new competition for energy supplies and new market interconnections. Consequently, while energy policies in one country have inevitably affected the others, their cross-cutting effects in the future are difficult to predict.
To date, the judgment of Congress has favored a growing North American energy partnership—but ensuring that this partnership continues to be as mutually beneficial as possible will likely remain a key oversight challenge for the next decades. Congress has been facing important policy questions in the U.S.-Canada and U.S.-Mexico energy contexts on several fronts, including the siting of major cross-border pipelines, increasing petroleum supplies from Canadian oil sands, exporting natural gas production from North American shales, and meeting commitments to increase renewable energy supplies and reduce atmospheric emissions of greenhouse gases.1 Legislative proposals in the 115th Congress could directly influence these developments.
This report provides an overview of the United States' energy trade with Canada and Mexico. For the principal energy commodities, it summarizes estimates of the resource potential for the three countries, recent energy production, and expectations for future production. The report quantifies current trends in U.S. energy trade across the fuel categories, the potential for future trade, and key factors that may affect that potential—especially energy transportation infrastructure. The report is organized by energy commodity. CRS has incorporated the most recent data available at the time of this analysis. However, data from the numerous sources we cite are often time-lagged and subject to frequent revision and updates. Therefore, our analysis should be viewed as an estimate of the U.S. cross-border trade relationships over the last 18 months, but not necessarily a precise accounting of trade. Although the subject of this report is linked to a number of related energy policy considerations—such as environmental policy, infrastructure regulation, trade agreements, and economic growth—examination of those issues is outside its scope.
Crude Oil and Refined Products
Crude oil is a key resource linking the Canadian, Mexican, and U.S. economies. The oil markets of both the United States and Canada are characterized by free enterprise, while constitutional restrictions historically have limited access by private firms to the Mexican industry. Recent reforms in Mexico may lead to an opening of the Mexican oil industry to private firms, however, potentially expanding North American oil market linkages. While no single North American country is likely to become independent of the world oil market, the emerging North American market is likely to provide increased opportunity for cross-border trade and greater energy independence for the continent.
Crude Oil Proved Reserves
The most widely used and recognized measure of oil resources2 is "proved" reserves.3 These reserves include identified, undeveloped resources in the ground that are both technically and economically recoverable under existing economic and operating conditions. This definition implies that reserve totals can increase over time because of new discoveries, but may also increase because of technological innovation or higher prices, which allow higher-cost projects to be profitable. Conversely, oil resource extraction, government regulations that limit (or prohibit) the use of certain production technologies, and low oil prices may reduce proved reserves. Some governments have also been accused of manipulating proved reserve values to enhance their importance within the world oil market. Therefore, crude oil reserve estimates are useful only as rough approximations of a country's resource base at any particular point in time. Nonetheless, proved reserves are the conventional measure of available resources in the oil industry and are the metric used in this report.
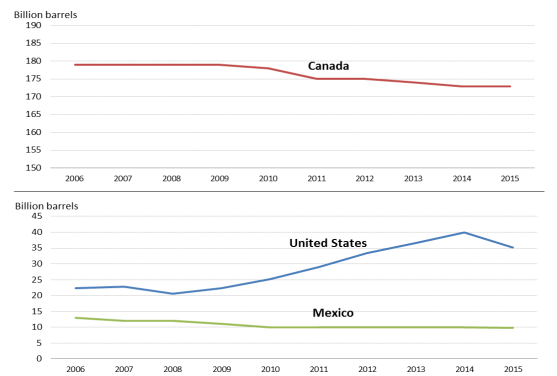
As Figure 2 shows, according to Energy Information Administration (EIA) estimates, North American crude oil reserves are dominated by Canada, with an estimated 173 billion barrels at the end of 2015, most of it in the form of bitumen in the Alberta oil sands. Reserves in the United States and Mexico are much smaller by comparison, at around 35 billion barrels and 10 billion barrels, respectively. However, reserves in the United States doubled between 2008 and 2014, primarily due to new technologies allowing economic production of shale oil in North Dakota, Texas, and Montana and from other shale oil deposits.
An alternative source4 of global crude oil reserve estimates places world reserves at 1,698 billion barrels at the end of 2015. This total represents a decline of 2 billion barrels from the end of 2014, but an increase of 323 billion barrels from the end of 2005. The North American portion of the 2015 world total was 238 billion barrels—of which the United States held 23%, Canada held 72%, and Mexico held 5%. (The comparable resource shares in 2005 were 10% for the United States, 81% for Canada, and approximately 7% for Mexico).
To put the above values in perspective, a measure called the reserve to production ratio (R/P) measures how long proved reserves would last at current rates of production. For the United States the R/P at the end of 2015 was 11.9 years, for Canada the R/P was 108 years, and for Mexico the R/P was 11.5 years. (The world as a whole currently has an R/P of about 51 years.) These ratios compare favorably to those in 2006, when the U.S. R/P was 11.9 years, the Canadian R/P was 14.9 years, and the Mexican R/P was 9.6 years (while the world as a whole had an R/P of 40.5 years). The data suggest that—even after 10 years of cumulative oil production—the United States, Canada, Mexico, and the rest of the world as a whole are at least as well off, and in most cases better off, than they were 10 years ago with respect to oil reserves.5
Crude Oil Resources Projections
Although U.S. oil reserves have increased relatively quickly since 2008, it is unclear if the same pace will continue, in large part because of a decline in global crude oil prices. U.S. oil reserves were adjusted downward by approximately 12% at the end of 2015, likely as a result of low oil prices, which have slowed capital expenditures on discovery and development.6 On the other hand, new, undeveloped reserves will likely be discovered, pushing estimates higher. For example, in November 2016, the U.S. Geological Survey announced a new assessment of shale oil resources (20 billion barrels) in the Texas Permian basin, which is nearly three times larger than its 2013 Bakken assessment.7 The newly identified oil resources may be factored into future proven reserve estimates.
While U.S. proved crude reserves have risen since 2008, Canada's and Mexico's have declined modestly during this period. Neither country has benefited from growth in shale oil production the way the United States has, and neither is expected to experience a similarly rapid growth in reserves due to shale resources. These expectations are heavily influenced by global oil prices, however. Higher prices lead to more exploration and lower prices lead to less exploration. The price of oil is statistically non-forecastable and subject to large, sudden upward or downward movement due to a wide variety of political, military, and economic variables. In addition, it is not possible to forecast the emergence of cost-reducing new technologies or entirely new technological processes and innovations.
While it is not possible to forecast increases in proved crude oil reserves, agencies may make estimates of undiscovered, technically recoverable, resources. Undiscovered, technically recoverable resources are highly uncertain, in that they are undiscovered, not economically recoverable today, even if the technology is thought to exist to recover them, and could not appear on the market in the near term.
Crude Oil Production
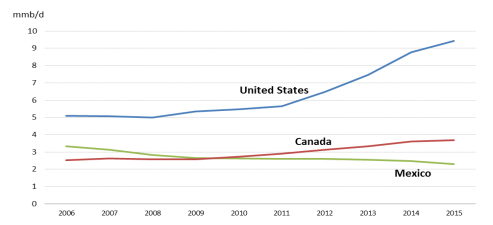
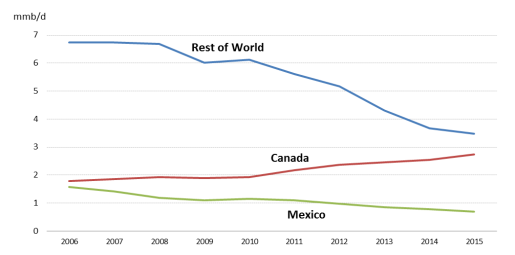
Although Canada has, by far, the largest crude oil reserves in North America, the United States is a much larger crude oil producer (Figure 3) and has been growing much faster. Due to the rapid growth in shale oil development, U.S. oil production increased by over 4.3 million barrels per day (mmb/d) from 2006 to 2015, an increase of approximately 85%. With over 9.4 mmb/d of production in 2015, the United States was the world's 3rd-largest oil producer—behind only Russia and Saudi Arabia. Canada stands as the 6th largest, with 3.7 mmb/d, and Mexico stands at 13th largest, with 2.3 mmb/d. Furthermore, while production in both the United States and Canada has increased since 2006, oil production in Mexico has declined about 1.0 mmb/d (31%) over the period.
U.S. and Canadian oil production have been enhanced by new technologies—hydraulic fracturing in the United States, and bitumen mining and processing in Canada—as well as oil prices sufficiently high to support resource development (at least until the oil price declines, which began in summer 2014). The price of oil is the key determinant of crude oil production growth, but usually with a time lag reflecting the nature of oil field development and production. For example, although Figure 2 does not appear to show declining U.S. production related to the price declines beginning in 2014, incomplete data for 2016 show a different pattern. In October 2016, U.S. oil production was down to 9.1 mmb/d, and averaged just above 9.0 mmb/d for the first 10 months of the year.8
|
Figure 3. North American Crude Oil Production Million barrels per day |
 |
|
Sources: U.S. Energy Information Administration, "U.S. Field Production of Crude Oil," online database, December 30, 2016, http://www.eia.gov/dnav/pet/hist/LeafHandler.ashx?n=PET&s=MCRFPUS2&f=A; and "International Energy Statistics," Online database, December 2016, https://www.eia.gov/beta/international/data/browser/#/?vs=INTL.44-1-AFRC-QBTU.A&vo=0&v=H&start=1980&end=2014. Notes: Includes lease condensate. |
The differing growth patterns among the three countries have caused problems in absorbing the increased oil production into the U.S. market, in large part due to transportation bottlenecks and refinery constraints. These problems resulted in sharp price discounts on transactions in some regions until transportation options were created.
Crude Oil Consumption and Export Capacity
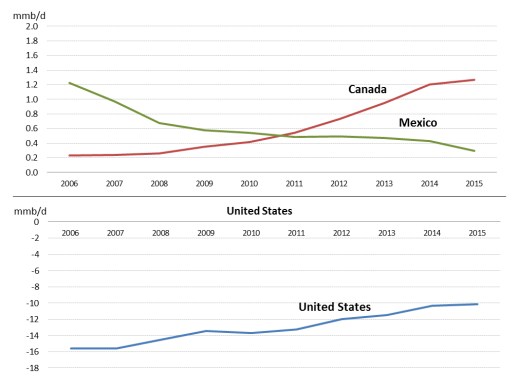
Fundamental to the oil trade capability between the United States, Mexico, and Canada is their domestic production in excess of domestic consumption—one measure of surplus production available for export. Figure 4 shows the trends in this statistic. Influenced by the recession of 1999, high prices until mid-2014, increased vehicle fuel efficiency, and perhaps changing behavioral patterns, U.S. and Mexican petroleum product consumption declined over the 2006 through 2015 period, while Canadian consumption increased by a small amount. However, Mexican production, as discussed above, has declined even faster than consumption, leading to the declining crude export potential in that country (Figure 4). Canada's "excess" crude production has increased by more than five times over this period, despite growth in domestic consumption. In the United States, growth in shale oil crude production reduced its production deficit by 5.5 mmb/d (35%) between 2006 and 2015. As Figure 4 shows, however, the United States' need for imports to supplement domestic crude oil production still far exceeds available excess supplies from Canada and Mexico.
|
Figure 4. Crude Oil Production Net of Domestic Consumption Million barrels per day |
 |
|
Source: U.S. Energy Information Administration, "International Energy Statistics," Online database, December 2016, https://www.eia.gov/beta/international/data/browser/#/?vs=INTL.44-1-AFRC-QBTU.A&vo=0&v=H&start=1980&end=2014. Notes: Note the scale difference in the vertical axis. |
Because of limited consumption growth and a production greater than consumption balance, Canada will continue to use extra production for the export market. Depending on demand and the availability of transportation facilities, more Canadian oil will either come to the United States or enter the world market, likely finding its way to Asia. Future net production in Mexico is highly uncertain, depending upon the rate of growth in domestic demand as its domestic economy develops, and potential changes in crude oil production in the wake of oil sector restructuring. U.S. crude oil production will likely keep increasing, further reducing future import requirements.
Crude Oil Trade
Over the period 2006-2015, imports of crude oil from Canada to the United States increased every year, from 1,802 thousand barrels per day (mb/d) in 2006 to 3,169 mb/d in 2015, an increase of over 75% (Table 1). Canada has become the United States' largest provider of imported crude oil; nearly all Canadian exports of crude oil have the United States as their destination. Although the United States has been a growing importer of Canadian crude, U.S. exports of crude oil to Canada also have grown dramatically in recent years, largely from production in the U.S. Midwest. U.S. exports of crude oil to Canada over the 2006-2015 period increased from 25 mb/d in 2006 to 427 mb/d in 2015, an increase of 1,700%.
|
Year |
Imports from Canada |
Exports to Canada |
Net Imports Canada |
Imports from Mexico |
Exports to Mexico |
Net Imports Mexico |
|
2006 |
1,802 |
25 |
1,778 |
1,577 |
0 |
1,577 |
|
2007 |
1,888 |
27 |
1,861 |
1,409 |
0 |
1,409 |
|
2008 |
1,956 |
29 |
1,928 |
1,187 |
0 |
1,187 |
|
2009 |
1,943 |
44 |
1,899 |
1,092 |
0 |
1,092 |
|
2010 |
1,970 |
42 |
1,929 |
1,152 |
0 |
1,152 |
|
2011 |
2,225 |
46 |
2,178 |
1,102 |
0 |
1,102 |
|
2012 |
2,425 |
67 |
2,358 |
975 |
0 |
975 |
|
2013 |
2,579 |
133 |
2,445 |
850 |
0 |
850 |
|
2014 |
2,882 |
331 |
2,551 |
781 |
0 |
781 |
|
2015 |
3,169 |
427 |
2,741 |
688 |
0 |
688 |
Source: U.S. Energy Information Administration, "Petroleum & Other Liquids," online database, December 2016, http://www.eia.gov/petroleum/data.cfm.
From 2006 to 2015, imports of crude oil from Mexico to the United States declined from 1,577 mb/d in 2006, to 688 mb/d in 2015, a decrease of 57%. Declining imports of crude oil from Mexico reflect primarily that nation's declining production. The United States has not exported any crude oil to Mexico over this period. The United States' net draw on crude oil from the world market declined by about 37% between 2006 and 2015, but it remains about 7,000 mb/d. Canada and Mexico currently supply about 50% of this total, contributing to U.S. energy independence from countries outside North America (Figure 5).
According to U.S. Census Bureau trade statistics, the total commodity value of U.S. crude oil exports to Canada in 2015 was $7.2 billion, while imports from Canada were worth approximately $47.0 billion. The value of crude oil imported to the United States from Mexico in 2015 was $12.5 billion.9
|
Figure 5. U.S. Net Import of Crude Oil by Country Million barrels per day |
 |
|
Source: U.S. Energy Information Administration, "U.S. Net Imports by Country," Online database, December 30, 2016, https://www.eia.gov/dnav/pet/pet_move_neti_a_epc0_IMN_mbblpd_a.htm. |
U.S. crude oil trade with both Canada and Mexico appears likely to expand in the coming years. Limits to this growth could include increases in domestic consumption or decreasing domestic production in Canada and Mexico, as well as the growth of U.S. domestic oil production. If the United States cannot continue to import the entire Canadian exportable oil surplus, Canada would need to build new pipeline infrastructure to deliver oil to the world petroleum market, as further discussed below.
Refined Petroleum Products Trade
The U.S. trade position in petroleum products differs markedly from that of crude oil. While the United States remains a net importer of crude oil, it has become a net exporter of petroleum products to the world market. This trend is reflected in recent trade volumes with Canada and Mexico. As Table 2 shows, Canada remains a small net exporter of petroleum products to the United States (68 thousand barrels per day (mb/d) in 2015), although the ratio of Canadian exports and imports to the United States has been shrinking rapidly. Mexico has long been a net importer of petroleum products from the United States, and those net imports have grown rapidly since 2006.
|
Year |
Imports from Canada |
Exports to Canada |
Net Imports Canada |
Imports from Mexico |
Exports to Mexico |
Net Imports Mexico |
|
2006 |
551 |
134 |
416 |
129 |
255 |
-126 |
|
2007 |
566 |
162 |
405 |
124 |
279 |
-155 |
|
2008 |
536 |
235 |
301 |
115 |
333 |
-218 |
|
2009 |
536 |
179 |
358 |
118 |
322 |
-204 |
|
2010 |
565 |
192 |
373 |
132 |
448 |
-316 |
|
2011 |
504 |
305 |
199 |
105 |
570 |
-465 |
|
2012 |
521 |
349 |
172 |
60 |
565 |
-505 |
|
2013 |
563 |
415 |
148 |
68 |
532 |
-463 |
|
2014 |
505 |
478 |
27 |
61 |
559 |
-497 |
|
2015 |
596 |
528 |
68 |
70 |
690 |
-620 |
Source: U.S. Energy Information Administration, "Petroleum & Other Liquids," online database, December 2016, http://www.eia.gov/petroleum/data.cfm.
Notes: A minus sign (-) indicates a net export.
Between 2006 and 2015, U.S. imports of petroleum products from Canada have averaged about 544 mb/d, with little variation as shown in Table 2. Over the same time period petroleum product exports by the United States to Canada have risen by about 300%, bringing the U.S. net import position close to balance. Petroleum product imports from Mexico have fallen over the time period by about 40%, and U.S. petroleum product exports to Mexico have risen by 170% over the 2006-2015 period, making the United States a net exporter to Mexico. The United States has also become a net exporter of petroleum products to the world as a whole, by almost 2.2 mmb/d. The ability of the United States to have a net export balance in petroleum products is due to the high efficiency, large capacity, and high utilization rates of the petroleum refining industry.
The Census Bureau reports the total commodity value of U.S. petroleum product exports to Canada in 2015 as $10.2 billion, while imports from Canada were worth approximately $12.0 billion. The value of product exports to Mexico in 2015 was $15.8 billion while imports from Mexico were valued at approximately $1.1 billion.10
Cross-Border Oil and Refined Products Infrastructure
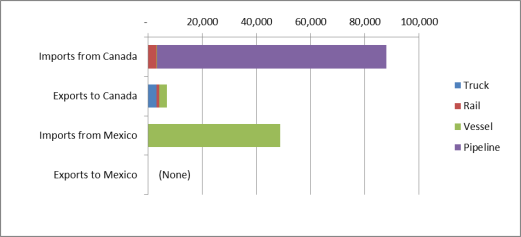
Crude oil moves between Canada, the United States, and Mexico through a combination of pipeline, rail, and marine transportation. As Figure 6 illustrates, pipelines dominate crude oil movements between Canada and the United States while marine vessels are the primary means of oil import from Mexico. No crude oil pipeline capacity currently exists or is proposed between the United States and Mexico.
|
Figure 6. North American Crude Oil Trade by Mode Thousand tons, average/year 2012-2015 |
 |
|
Source: U.S. Department of Transportation, Freight Analysis Framework (modal estimation model), 2016. |
Cross-Border Crude Oil Pipelines
The oil pipeline infrastructure in Canada and the United States is fully integrated (Figure 6), with major systems linking producing regions, refineries, and intermediate storage and transportation hubs in both countries.
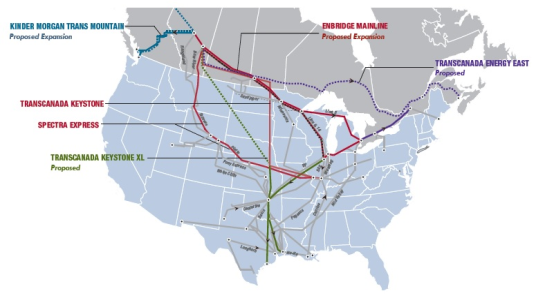
Although Canada-U.S. cross-border oil pipelines have been in place since the 1950s, pipeline capacity from Canada to the United States experienced a period of rapid growth between 2010 and 2015. During this time several cross-border pipelines were constructed and others were rebuilt or significantly expanded to provide increased takeaway capacity from the growing crude oil production in the Canadian oil sands. At present, six pipeline systems with approximately 4.22 mmb/d of combined capacity (Table 3) link the petroleum-producing regions in western Canada to markets in the United States. Three of these systems (Enbridge, Express, and Keystone) have been the primary conduits of expanded cross-border crude oil movements in recent years (Figure 7).
|
Pipeline |
Status |
mmb/d |
|
Enbridge Mainline System |
Operating since 1950 |
2.85 |
|
Kinder Morgan Trans Mountain |
Operating since 1953 |
0.30 |
|
Rangeland |
Operating since 1966 |
0.08 |
|
Plains Midstream–Milk River |
Operating since 1969 |
0.12 |
|
Spectra Express |
Operating since 1997 |
0.28 |
|
TransCanada Keystone |
Operating since 2010 |
0.59 |
|
Total Existing Capacity |
4.22 |
|
|
Enbridge Mainline—Line 3 Restoration |
Canada approved/U.S. in review |
0.37 |
|
TransCanada Keystone XL |
Canada approved/U.S. denied |
0.83 |
|
Total Proposed Capacity |
1.20 |
Source: Canadian Association of Petroleum Producers (CAPP), Crude Oil Forecast, Markets and Transportation, June 2016, Table 4.1; Trade press; National Energy Board (Canada); CRS analysis.
Notes: The Enbridge Mainline System comprises several distinct pipelines, including Line 67 (Alberta Clipper), originally constructed in 2010 and subsequently expanded twice, and Line 3, among others.
In addition to the existing cross-border capacity, two proposed pipeline projects have the potential to increase that capacity by another 1.2 mmb/d (Table 3). The larger of these projects, the proposed Keystone XL Pipeline, was approved by Canada but was denied a Presidential Permit for its border-crossing segment by the Obama Administration in 2015.11 However, on January 24, 2017, the Trump Administration invited the developer to resubmit its permit application for the pipeline and directed the relevant federal agencies to expedite their review of the application if resubmitted.12 TransCanada reportedly intends to accept the invitation and pursue development of the pipeline.13 The smaller proposed capacity expansion involves the restoration of Enbridge Line 3, currently de-rated, to its original operating capacity. The Line 3 project has been approved by Canadian regulators and is under review in the United States.14 Unlike Keystone XL, however, it does not need a new or amended Presidential Permit, because it would remain within the capacity limits of its existing permit.
As Table 3 shows, existing cross-border pipeline capacity between the United States and Canada is currently 4.22 mmb/d and could rise to 5.42 mm/d if the planned additions are completed. Canada actually supplied the United States 2.8 mmb/d on average in 2015, although preliminary data show average monthly volumes reaching nearly 3.3 mmb/d in 2016.15 Even at these levels, it appears that large increases in Canadian crude oil trade could ultimately be possible via pipeline, if there were sufficient available Canadian crude production. However, actual U.S. import capacity via pipeline may be significantly lower than the figures in Table 3 due to bottlenecks, service outages, and other constraints within the U.S. crude oil pipeline system away from the border. Due to such constraints, Canadian crude supplies have exceeded available pipeline takeaway at key points in the system.16 Pipeline projects are being pursued within the United States to further increase movements of Canadian crude to key U.S. market hubs, including refineries in the Midwest and on the Gulf Coast that employ complex technology in order to process "heavy" crude oils like those from Canada (as well as Mexico and Venezuela).
The recent expansion of crude oil pipelines from Canada has generated considerable controversy in both the United States and Canada. Proponents of these pipelines, including Canadian government agencies, petroleum industry stakeholders, and pipeline construction workers, have based their support primarily on increasing the diversity of the U.S. petroleum supply and on expected economic benefits to the United States, including near-term job creation associated with pipeline construction and operation. Opponents, primarily environmental groups and affected communities along pipeline routes, have objected to these projects principally on the grounds that Canadian oil sands development has negative environmental impacts and that it promotes continued U.S. dependency on fossil fuels. These issues have come into particular focus in the context of the Keystone XL pipeline proposal, which originally applied for a Presidential Permit in 2008 and has been the subject of ongoing public interest and debate in Congress.
Canadian Pipelines for Overseas Exports
Canadian developers are also pursuing two major export pipelines entirely within Canada to ship crude oil out of marine terminals on the Pacific and Atlantic coasts (Figure 7). The Trans Mountain Pipeline Expansion was approved by the Canadian federal government in November 2016, although it still requires additional provincial and First Nations approvals; it also faces legal challenges.17 The expansion would add 0.59 mmb/d of takeaway capacity for Canadian crude oil, most likely destined for Asian markets. The second proposed project, TransCanada's Energy East pipeline, would add 1.1 mmb/d of crude oil export capacity via Canada's Atlantic Coast, although this project is still under Canadian federal review and faces significant development challenges due to its route through Quebec and competition with the other expansions.18 If ultimately constructed, either of these two projects could reduce the quantities available for pipeline export to the United States.
Movements by Rail vs. Pipelines
Without access to sufficient pipeline capacity, some shippers of Canadian crude oil have resorted to railroads for transportation to U.S. (and Canadian) refineries. As Figure 5 indicates, this includes some cross-border rail movements of Canadian oil sands to U.S. refineries (most of which is shipped to refineries in the western Great Lakes region) as well as a lesser amount of Bakken oil exported to Canadian refineries. However, in 2016, crude-by-rail volumes have decreased by about a third from their peak in 2014.19 This decrease is largely attributable to pipeline projects coming online as well as changes in oil prices. There are approximately 14 crude-by-rail loading terminals in western Canada surrounding the oil sands deposits with a capacity of 0.75 mmb/d. Three terminal expansion projects in the region have been put on hold.20 Rail-loading capacity in Williston Basin, ND, is currently 1.52 mmb/d. The North Dakota Pipeline Authority, which tracks pipeline and rail loading terminal projects, does not foresee any planned increases in this capacity through 2020.21 As of September 2016, railroads were loading 0.3 mmb/d from the Williston Basin—about 20% of rail terminal capacity (down from their peak of 0.85 mmb/d in late 2014).22 Since late 2014, pipeline's share of crude oil movement from the Williston Basin has increased from 35% to 61% while rail's share has decreased from 59% to 29%.23
Rail Capacity
Rail carriers have largely left it to oil shippers to invest in crude-by-rail terminals and tank car fleets. The rail carriers themselves supply locomotives and their existing track and thus have largely avoided sunk costs in crude-by-rail infrastructure. At the peak of crude-by-rail movements in 2014, crude oil represented less than 2% of total rail car loadings. Rail car loadings of all commodities in 2016 are trailing their peak in 2014 by about 10% due to a drop in coal and international container shipments. Thus, over the immediate horizon, it would appear railroads have spare capacity if crude oil loadings were to pick up again. Much of the North American freight rail network, especially in low population areas in the West, is single tracked and lacking a signal system of the type used in more active rail corridors. This provides railroads ample opportunity to increase capacity over their rights-of-way by adding additional sidings for trains to pass, adding parallel tracks, and upgrading signal systems that reduce the required spacing between trains.24 Pinch-points can still occur at bridges, tunnels, and in canyons where sidings/double tracking can be more difficult. Chicago, the largest rail hub in North America, where five U.S. and two Canadian railroads interchange traffic, has long been a bottleneck for rail traffic. The federal government, the state of Illinois, and railroads are funding a series of projects intended to speed trains through the region, but rail congestion in the city would likely remain an issue if rail freight were to increase substantially. Minneapolis also emerged as a congested rail hub during the most recent uptick in rail traffic in 2014. Rail congestion at these two hubs is relevant to delivering Canadian oil sands to U.S. Midwest refineries.
Railroads do not require federal approval to improve their existing rights-of-way or terminal property that they own. Constructing track on additional rights-of-way (for instance, acquiring additional property to extend a rail line) does require federal approval, but substantial rail extensions have not occurred for many decades.25
Vessel Activity at Gulf Coast Ports
As Figure 6 shows, vessels are a principal mode of crude oil export from Mexico and the United States, and are a supplementary mode for Canadian exports. Much of this activity on the U.S. side occurs at Texas ports—namely Houston, Corpus Christi, and Port Arthur (including Beaumont). U.S. shale oil production in the Eagle Ford basin has significantly increased outbound tanker shipments at Corpus Christi,26 and, to a lesser extent, Houston. These Texas harbors have shipping-channel expansion projects underway by means of dredging administered by the Army Corps of Engineers.27 However, these expansions are primarily geared toward overseas trading ships rather than specific to North American vessel trade. On shorter voyages to and from Mexico, or even with Canada, smaller tankers are used which may not require the expanded channel dimensions.28 Ports on the West Coast that handle tanker ships (Seattle, San Francisco, and Los Angeles) are naturally deep and do not require much dredging.29 The Coast Guard is responsible for maintaining channel marking buoys and other navigation aids and may develop channel-specific navigation rules when traffic increases.30 Under the supervision of the Army Corps of Engineers and the Coast Guard, the federal role in harbor infrastructure is predominantly related to "waterside" infrastructure (shipping channels and navigation aids). "Landside" or terminal infrastructure, such as piers, wharfs, loading and unloading equipment, and pipelines and storage tanks in the case of petroleum terminals, are constructed by private industry and/or local port authorities.
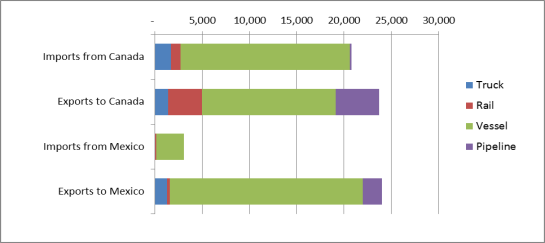
Refined Products Transportation
The primary means of refined products movement between Mexico, Canada, and the United States is via marine vessel.31 As Figure 8 shows, over 75% of overall refined products trade among the three countries uses this mode. Pipelines are a significant secondary mode for U.S. refined products exports, accounting for approximately 20% of volumes to Canada. Rail also carries a substantial share (15%) of U.S. exports to Canada, but it is a less important mode for the other cross-border trades. Pipelines appear to be an evolving mode for U.S. refined products exports to Mexico. At present, three pipelines with approximately 0.11 mmb/d ship refined products from Texas to markets in Mexico. The proposed Borrego Pipeline, which applied for a Presidential Permit in 2016, would add 0.15 mmb/d of capacity—more than doubling the existing refined products export capacity.32
Natural Gas
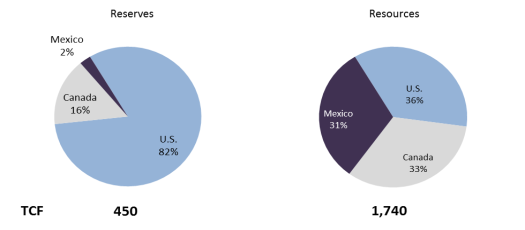
Natural gas trade in North America is in a state of rapid transformation and growth. Together, the United States, Mexico, and Canada account for just under 7% of the world's natural gas reserves, with the United States comprising the bulk of those reserves—over 80% of North America's contribution.33 However, the region makes up almost 30% of the world's natural gas production, with the United States, again, contributing the most. Despite the limited reserve estimates in Canada and (especially) Mexico today, the two countries have great potential for future production based on estimates of undiscovered, technically recoverable resources from the Energy Information Administration (EIA) as shown in Figure 9.
|
Figure 9. North American Natural Gas Resources and Reserves 2015 Trillion Cubic Feet (TCF) |
 |
|
Source: U.S. Energy Information Administration, Natural Gas Reserves Summary as of December 31, online database, December 14, 2016, http://www.eia.gov/dnav/ng/ng_enr_sum_a_EPG0_r21_BCF_a.htm; and BP Statistical Review of World Energy, 2016. Notes: The "Resources" pie chart refers to undiscovered, technically recoverable resources. |
Natural Gas Production
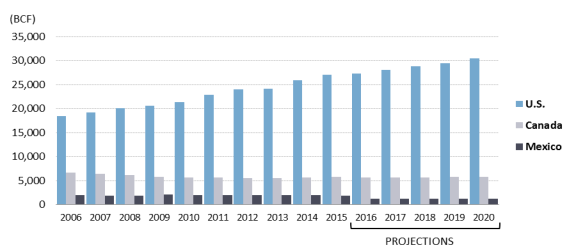
The United States has undergone the greatest transformation of any country in recent years when it comes to natural gas supply—due primarily to production from shale. U.S. natural gas production has grown each year since 2006; the EIA projects this growth to continue at least through 2020 (Figure 10).
|
Figure 10. North America Natural Gas Production 2006-2020 Billion Cubic Feet (BCF) |
 |
|
Source: BP Statistical Review of World Energy, 2016. |
In contrast to the United States, natural gas production in Canada and Mexico declined 13% and 7%, respectively, between 2006 and 2015 (Figure 10). This decline is probably not due to a lack of natural gas resources, however; as Figure 9 shows, the EIA places Mexico's and Canada's resources on par with those of the United States. Production costs and market issues have been the key factors in their production decline.
Producers in Canada are engaged in efforts to reverse the trend of declining natural gas production. Market conditions may also prove more favorable in the coming years. The EIA projects Canada's production to rise from 2015 to 2020, mostly from shale gas, tight gas, and coalbed methane. Canada's resource base has attracted increased investment in recent years, especially to utilize the advances in horizontal drilling and hydraulic fracturing that spurred U.S. production. Additionally, if oil prices rise, making Canadian oil sands production more viable, Canada may need more of its natural gas for oil sands production, where it is used as heating fuel in oil sands processing. Most of Canada's natural gas resources are located in relatively close proximity to oil sands production, particularly the Western Canada Sedimentary Basin.
Mexico's energy reforms, which were enacted in 2013, are intended in part to boost production by opening up the country to foreign investment. In December 2016, Mexico completed the fourth phase of its first round of auctions of blocks for oil and natural gas exploration. The process has had limited interest from outside developers, as both oil and natural gas prices worldwide have been depressed. Although Mexico has pushed through with each auction round during difficult market circumstances, it is too early to tell what the effect will be on its natural gas resources, reserves, or production. Consequently, projections made by EIA and other groups may be significantly different and may change as new information becomes available.
Natural Gas Trade
Natural gas has been traded between the United States and its North American neighbors for decades. Because the United States has free trade agreements with both Canada and Mexico, both countries also have preferential treatment for U.S. gas exports under provisions of the Natural Gas Act.34 Under these provisions, exports of natural gas to countries with which the United States has a free trade agreement are deemed in the public interest; the Department of Energy must permit the export of the commodity without delay. This expedited permitting process has facilitated the continental integration of the North American natural gas sector. In particular, the Canadian natural gas market and the U.S. natural gas market are integrally tied and viewed by the industry as one market. The integration of U.S. and Canadian natural gas markets makes it efficient for each country to supply certain markets across the border. It also is not uncommon for natural gas originating in Canada to be exported into the United States in one part of the country and re-exported back to Canada in another due to transportation efficiencies and lower costs.
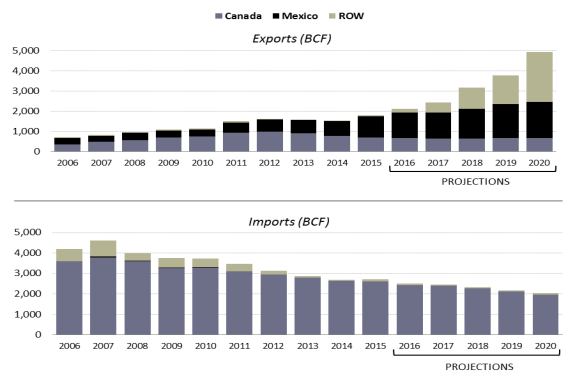
U.S. exports and imports of natural gas are illustrated in Figure 11. As the figure shows, with the advent of U.S. shale gas supplies around 2006, U.S. natural gas exports have risen and imports have declined significantly. At present, most U.S. natural gas exports are to Mexico, while nearly all of its imports come from Canada. Over the time period of 2006 to 2015, the United States also has moved from a projected growing importer of natural gas to possibly a long-term net exporter of natural gas. In November 2016, for example, the United States recorded monthly exports of natural gas being greater than imports for the first time in decades. The EIA projects U.S. exports of natural gas to continue to expand through 2020 and beyond (Figure 11).
|
Figure 11. U.S. Exports and Imports of Natural Gas 2006-2020 Billion Cubic Feet (BCF) |
 |
|
Source: U.S. Energy Information Administration, "Natural Gas," online database, http://www.eia.gov/naturalgas/data.cfm. Notes: ROW = Rest of the World |
Exports to Mexico
Because Mexico's natural gas production has not been able to keep pace with its demand—largely due to the rapid growth of natural gas-fired electricity generation—that country has had to rely ever more on imports. Most of these imports are from the United States. The United States has become Mexico's largest foreign supplier of natural gas, and Mexico's demand for imports continues to grow (Figure 11). Mexico imported a total of 1,307 billion cubic feet (BCF) of natural gas in 2015, of which 81% came from the United States. The value of these exports was $3.8 billion (down from 2014 values despite growing volume because of lower natural gas prices).35 Unlike the trade with Canada, natural gas trade between the United States and Mexico has been almost entirely in one direction; the United States imports a very small amount of natural gas from Mexico. The U.S. surplus in natural gas trade with Mexico is expected to widen, as recent supply and demand trends in both countries are expected to continue. However, competition between natural gas-fired electricity generation, nuclear power, and renewables—and potential growth in Mexican natural gas production—create uncertainty about future Mexican demand for U.S. natural gas.36 In 2006, Mexico also started importing liquefied natural gas (LNG) at very high costs from other countries, providing an alternative option to U.S. pipeline gas supplies.
Trade with Canada
U.S. natural gas imports from Canada in 2015 were valued at $6.8 billion, down about 46% from 2014. Canadian natural gas imports from the United States were valued at about $2.2 billion in 2015, down almost 50% from the prior year. These declines in value reflect both lower overall volumes of trade in both directions and lower prices. Although the United States continues to import significant volumes of Canadian natural gas, the reversal of Canada-U.S. natural gas export trends is driving fundamental changes in the North American natural gas industry. For example, due to sharply declining volumes on Canadian natural gas pipelines to the United States, TransCanada has had to drastically restructure its pipeline tariffs to maintain the economic viability of certain lines.37 Likewise, shale gas production has hurt prospects for Arctic natural gas development in both Alaska and Arctic Canada. On the other hand, low natural gas prices benefit the production of petroleum from oil sands, which requires large volumes of natural gas for extraction and processing. It remains to be seen how the development of additional North American natural gas reserves will turn out over time, as Canada seeks to develop its own resources (with the help of U.S. companies) in response to U.S. shale gas developments. In the near term, it appears that recent trends of reduced U.S. imports of Canadian natural gas will continue—a key reason Canada is pursuing natural gas exports to overseas markets in the form of LNG.
Global Exports from the United States
The EIA projects the United States to become a net exporter of natural gas in 2018, primarily driven by increased exports to Mexico, growing LNG exports overseas, and continued declining imports. Apart from the export approvals issued to Canada and Mexico noted above, the Department of Energy (DOE) also has approved almost 15 billion cubic feet per day (bcfd) of LNG exports to countries that do not have free trade agreements with the United States. The latter permits are important, as the number of LNG-importing countries with which the United States has free trade agreements is small.
However, the U.S. LNG export projects may face competition from Canadian projects that are being developed. A few U.S. and Canadian project proposals would utilize natural gas from the other country for export, highlighting the high degree of integration between the two markets.
Cross-Border Natural Gas Infrastructure
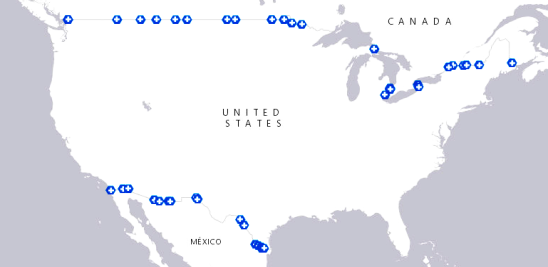
Transportation of natural gas among the United States, Canada, and Mexico is almost entirely by pipeline. There are over 50 natural gas pipelines linking the United States and its neighbors at 24 border crossings to Canada and 16 border crossings to Mexico (Figure 12).
|
Figure 12. North American Natural Gas Pipeline Border Crossings |
 |
|
Source: U.S. Energy Information Administration, "State Profiles and Energy Estimates," online database, updated July 7, 2016, http://www.eia.gov/state/. |
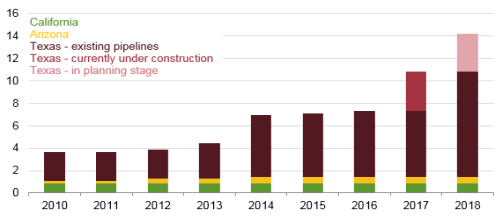
Over the last five years, natural gas pipeline capacity between the United States and Mexico has grown significantly—nearly doubling from approximately 3.7 bcfd in 2011 to 7.2 bcfd in 2016. As Figure 13 shows, most of the existing capacity and recent additions have been pipelines from Texas. According to the EIA, cross-border pipeline capacity to Mexico is projected to double again through 2018—to over 14 bcfd—based on four new projects currently under construction and two in the planning stage. All of these new projects are in Texas, primarily from the Eagle Ford production basin.38 While U.S.-Mexico cross-border capacity has been increasing, Mexico has been expanding its domestic pipeline network to accommodate U.S. imports and to facilitate gas movement within the country, in accordance with the energy ministry's five-year plan.39 Reportedly, over 3,300 miles of new gas pipeline are under construction or planned within Mexico, largely to support the electric power sector.40 New pipeline investments on both sides of the border have the potential to support a significant future expansion in cross-border natural gas trade, although such expansion would be contingent on having sufficient natural gas supply and transportation infrastructure from (or through) Texas.41 Growth of U.S. LNG exports from new or expanded LNG terminals along the Gulf of Mexico may increasingly influence regional natural gas supplies available for Mexico.
|
Figure 13. U.S. Natural Gas Cross-Border Pipeline Capacity to Mexico Billion cubic feet per day (bcfd) |
 |
|
Source: U.S. Energy Information Administration, "New U.S. Border-Crossing Pipelines Bring Shale Gas to More Regions in Mexico," December 1, 2016, http://www.eia.gov/todayinenergy/detail.php?id=28972. |
In contrast to U.S.-Mexico pipelines, cross-border natural gas pipeline capacity between the United States and Canada has not changed much in recent years. However, as a consequence of increased U.S. shale gas production, some historically south-flowing pipelines (e.g., TransCanada's pipelines at Niagara and Chippewa) have reversed direction in order to move more U.S. production north into Canada.42 Several new pipeline projects within the United States could increase U.S. Appalachian Basin natural gas supplies to markets in Ontario and Quebec, which could further supplant Canadian natural gas in favor of U.S. exports to Canada.43
Natural Gas Liquids
Natural gas liquids (NGLs) have taken on a new prominence in the United States' energy trade as shale gas production has increased and natural gas prices have fallen. "NGL" is a general term for a class of liquid products separated from natural gas at a gas field processing plant, including ethane, propane, butane, and pentanes. When NGLs are present with methane—the primary component of natural gas—the natural gas is referred to as either "hot" or "wet" gas. Once the NGLs are separated from the methane the natural gas is referred to as "dry" gas, which is what most consumers use. Each type of NGL has its own market and its own value depending upon the application in which it is consumed, such as for heating or as a chemical feedstock.44 When the price for dry gas has dropped due to changes in the supply-demand balance (e.g., during the warm winter of 2011 when gas demand dropped for heating), the natural gas industry has turned its attention to producing more wet gas in order to bolster the value it receives for a given level of methane production. Furthermore, because individual NGL products (except ethane) historically have been priced against oil, the period of high global oil prices through mid-2014 also drove growth in U.S. wet gas production. This growth, in turn, has increased the availability of NGLs for export to Canada and Mexico.
NGL Reserves and Production
Reserves of NGLs are inherently tied to natural gas. However, comprehensive and uniform data on NGL reserves—apart from associated natural gas reserves—are scant and further complicated by differences in the categorization of an NGL by industry sector. NGL production data are somewhat more reliable and are discussed below.
North American NGL Production
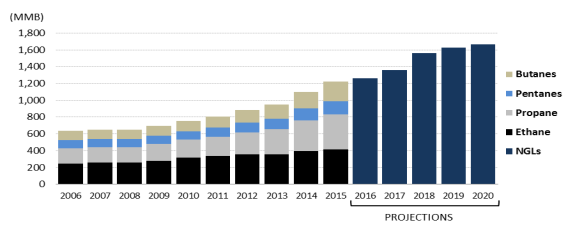
As Figure 14 shows, NGL production in the United States has grown rapidly since 2006 and is projected to continue its upward trajectory. According to the EIA, NGL production between 2006 and 2015 increased 90%; from 2015 to 2020 it is projected to rise by another 40%. As stated above, however, the actual and projected growth in NGLs are directly linked to the growth in U.S. natural gas production, so these projections cannot be viewed independently from overall trends in the natural gas (methane) market. Note that, while the heavier NGLs (e.g., pentanes) have tended to compete more with oil than with natural gas, the prices of the various fuels have somewhat de-linked from oil as NGL production has increased. These complex market dynamics continue to evolve and create considerable uncertainty for NGL projections.
|
Figure 14. U.S. NGL Production 2006-2020 Million barrels per year (MMb/y) |
 |
|
Source: U.S. Energy Information Administration, "Natural Gas Plant Processing," online database, December 30, 2106, http://www.eia.gov/dnav/ng/ng_prod_pp_a_EPL0_ygt_Mbbl_a.htm; and Annual Energy Outlook 2017, January 5, 2017, Table 14. Notes: Projections are available only for NGLs cumulatively, not by individual category. |
Mexico's production of natural gas liquids has declined between 2006 and 2013 (the latest year EIA has data), by approximately 16%, to 103 million barrels, which is around one-ninth the amount that the United States produced that year. Most of Mexico's production is of liquefied petroleum gases (LPG), which are a combination of propane and butane. The decline in Mexico's NGL production is a by-product of the declines in its overall natural gas production during this period.
Canada's production of natural gas liquids increased between 2006 and 2013 (the latest year for EIA data), by approximately 5% to 136 million barrels. Due to the nature of Canada's resources, most of its NGL production is in the form of ethane. Canadian NGL production was about 15% of the production of the United States in 2013, down from 21% of U.S. production in 2006. Thus, while Canada's NGL production rose, U.S. NGL production rose much faster during the time period.
Cross-Border NGL Trade
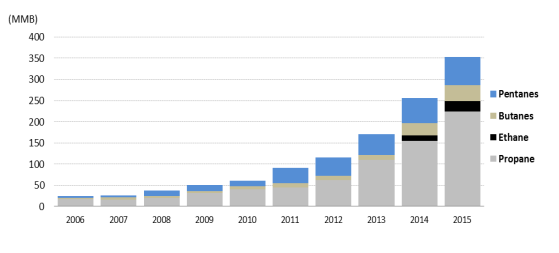
As U.S. natural gas production has increased, so has its NGL production and NGL exports. As shown in Figure 15, U.S. NGL exports increased rapidly between 2006 and 2015, rising by over 1,300%. Propane is the most prominent NGL export, accounting for over 60% of U.S. NGL exports in 2015. Propane trade is a global industry—often shipped overseas in large seagoing tankers—whereas other NGLs are traded regionally. In 2014, the United States began exporting ethane overseas, with most of it going to Europe.
|
Figure 15. U.S. NGL Exports by Fuel Million barrels per year (MMb/y) |
 |
|
Source: U.S. Energy Information Administration, "Petroleum & Other Liquids, Supply and Disposition," online database, December 30, 2016, http://www.eia.gov/dnav/pet/pet_sum_snd_d_nus_mbbl_a_cur.htm. Notes: The data in this table include hydrocarbons recovered from refinery processes and petrochemical processes, such as ethylene, butylene, and propylene. EIA's Annual Energy Outlook does not project NGL exports in the aggregate or by individual fuel. |
Mexico's NGL imports are mostly propane. In 2015, Mexico imported 35 million barrels of propane, 99% of which came from the United States. Most of the remaining 1% came from Canada. U.S. propane exports to Mexico in 2015 increased 31% over 2014. The value of U.S. propane exports to Mexico was approximately $1.0 billion in 2015. Mexico currently exports little, if any, NGL to the United States.
Canada's NGL trade with the United States consists of both exports and imports. All of Canada's NGL exports in 2015—approximately 50 million barrels of propane and butane—went to the United States. In 2006, however, both propane and butane exports were slightly higher than they were in 2015. During the time period, exports of both commodities declined before rebounding to current levels. In 2015, Canadian propane exports mostly went to the U.S. Midwest region followed by the U.S. East Coast and U.S. West Coast. Canada's butane also went mostly to the U.S. Midwest and East Coast. The value of Canadian NGL exports to the United States in 2015 was just over $1.4 billion.
As NGL (especially ethane) production in the United States has increased, Canada has imported more NGLs to supply its petrochemical facilities. The value of U.S. NGL exports to Canada was $238 million in 2015. Future expansion of Canada's petrochemical industry would likely increase its NGL imports from the United States.
NGL Transportation Infrastructure
Canada's NGL exports to the United States are shipped primarily by rail, although there are some deliveries from Ontario by an Enbridge cross-border pipeline (which also ships other liquid products).45 NGL exports from the United States to Canada also occur largely by rail. Several smaller cross-border pipelines also are available to ship U.S.-produced NGLs to Ontario, but their utilization is unclear and some are reportedly idle or slated for closure. Reliable shipment statistics on these lines are not publicly available. However, one particular NGL product—ethane—which has been in high demand in Canada, has driven up exports on other cross-border pipelines. In addition to an older, existing ethane pipeline (Sun-Canadian) from Michigan, two new pipelines for ethane export to Canada have been recently constructed. One of these (Vantage) links the Bakken region in North Dakota to markets in Alberta and was completed in 2014. The other (Genesis) ships NGLs from Michigan to Ontario and began operation in 2013. According to Canadian regulators, these two new lines have been operating at medium to high utilization, but detailed export statistics have not been published.46 Collectively, current NGL pipeline export capacity to Canada appears to exceed 200,000 barrels per day, although how much of this capacity is available for additional exports is unclear.
Five existing pipelines between Mexico and the United States (all in Texas) currently ship, or are capable of shipping, NGLs between the two countries. Collectively, these pipelines have capacity of between 150,000 and 175,000 barrels per day, depending upon the commodity—although some are also used to ship other liquid products. Reliable utilization data are not publicly available for these lines. The proposed New Burgos pipeline, which has applied to the State Department for a Presidential Permit, would add another 108,000 bpd of NGL export capacity to Mexico.47
Electricity
The electric power system of the United States is physically interconnected with the power systems of both Canada and Mexico, although it is much more integrated with the former. The U.S. and Canadian systems operate at synchronous (i.e., compatible) frequencies, with over 30 major transmission connections between the two countries. Conversely, there are only a handful of cross-border interconnections with Mexico—and only the connections with California are fully synchronized with the U.S. grid (as discussed below).48 The degree of grid integration has been a key determinant of historical electricity trade and prospects for future trade between the United States and its neighbors.
The changing nature of the generation portfolios among the United States, Canada, and Mexico has also been a factor affecting electricity trade and may represent an opportunity for increased trade in line with their pursuit of economic and environmental goals. Notably, in 2016, the United States signed an agreement with Canada and Mexico pledging to increase carbon-free sources of electricity, with a North American total goal of at least 50% of electric energy from "wind, solar, and other carbon-free sources of electricity."49 The growing role of renewable resources for domestic power production and potential export is, therefore, a topic of particular interest.
Electric Power Resources
The electricity generation profiles of Mexico, the United States, and Canada are quite different from one another in terms of overall size. Mexico has the smallest electricity sector, with 68 Gigawatts (GW) of available generating capacity, including both state-owned and other generators.50 Canada has an installed base of approximately 133 GW.51 The United States' electricity sector is massive by comparison, with total generation capacity around 1,100 GW—over five times the capacity of the other two countries combined.52
Existing Generation Capacity and Production
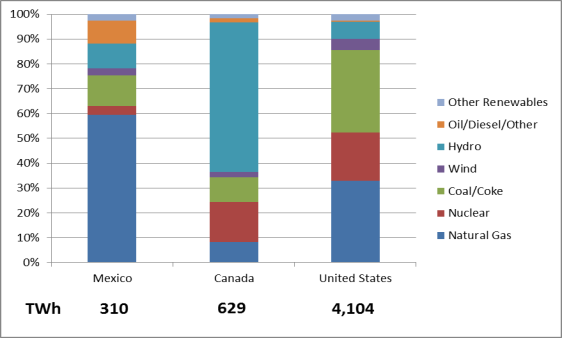
As Figure 16 shows, annual generation in each country reflects its installed capacity, although their generation portfolios vary. Mexico's annual generation is around 310 Terawatt-hours (TWh) followed by Canada at double its size, around 629 TWh, and the United States with total generation around 4,100 TWh. The three countries differ significantly in terms of the generation fuels they rely upon to produce power, driven by a mix of local resource availability, legacy generation investments, and environmental policies. As Figure 16 shows, natural gas is the dominant generation fuel in Mexico (59%), and hydro is the dominant fuel in Canada (60%). In 2015, the United States did not have a dominant fuel type, although it was the heaviest user of coal (33%). Natural gas accounted for a similar amount of generation to coal (also 33%) and is overtaking coal for the largest share of generation fuel.
Electricity Resource Projections—Mexico
Since 2010, annual electricity demand in Mexico has grown at an average rate of approximately 3% per year, with growth driven primarily by increased demand from residential and industrial customers.53 Self-supply (i.e., power generated by customers for their own use) has also grown since 2010.54 Because electricity prices are heavily subsidized in Mexico, however, growth in electricity demand does not provide as clear an indication of future generation additions as it might in less subsidized markets like the United States and Canada.55 Furthermore, the Mexican electricity pricing environment is changing as a result of regulatory restructuring. Through reforms passed in 1992 and expanded in 2014 the electric power sector in Mexico has been partially opened to private participation—including open access to transmission and allowing privately owned plants for self-generation, combined heat and power, small-scale generation (under 30 megawatt, MW), and import/export.56 Mexico's pricing structure, coupled with the ongoing regulatory transition in the generation market, creates uncertainty regarding electricity sector projections for Mexico.57
Mexico has undertaken a reform of its electricity sector because prices are too low to cover costs, which deters investment in new capacity and burdens the government with an expense that is politically difficult to eliminate. At the same time, industry pays prices significantly above those in the U.S. (industrial rates are $121/MWh [megawatt-hour] in Mexico and $68/MWh in the U.S.). Improving the competitiveness of industrial electricity tariffs without raising prices for residential customers poses significant challenges; it requires allowing cheaper generation to enter the market and displace more expensive units.58
According to the Mexico Secretería de Energía (SENER), Mexico authorized over 100 GW of new generation supplies since 2011, although it is an open question how much new capacity will eventually be constructed.59 Most new generation built in Mexico will likely be fueled by natural gas, due to global low prices for the commodity, or by renewable generation, discussed further below.60 Mexico's national energy policy has also established a non-fossil energy generation target of 35% by 2024.61
Electricity Resource Projections—Canada
According to energy supply and demand projections by Canada's National Energy Board (NEB), electricity production in Canada is projected to "grow steadily" through 2040.62 Although the NEB expects "considerable additions of natural gas and renewable capacity while coal capacity declines,"63 the board projects that hydropower will remain the dominant source of electricity supply in Canada over its projection period to 2040. Several major hydroelectric projects are currently under construction or planned in Quebec, Labrador, Manitoba, and British Columbia.64 Nuclear energy accounted for approximately 15% of Canadian annual electricity generation in 2014, but is expected to decline by 21%, from 98 TWh in 2014 to 77 TWh in 2040.65 The projected decline in coal-fired generation reflects various government and industry initiatives to reduce greenhouse gas emissions.
The NEB's expectation of a greater role for natural gas-fired power generation in Canada derives from several factors, including low natural gas prices, the lower GHG emissions of natural gas compared to coal-fired generation, and shorter construction times and lower capital costs for new plant construction. The ability for natural gas capacity to be built in smaller increments also allows it to better match load growth. Its ability for fast start-ups and ramping down to meet load changes throughout the day are also advantageous.
Electricity Resource Projections—United States
Electricity production is generally a function of several factors, including end-use demand; energy and environmental regulations; the efficiencies of the generation, transmission and distribution systems; and the technologies used to generate (or programs designed to conserve) electric power. Different regions of the United States, historically, saw different fuel mixes used to generate electricity, based in large part upon local resources. For example, U.S. hydropower production is highest in the Pacific Northwest, while states in the central plains have some of the best wind resources for U.S. wind power development. Coal was widely used in the Midwest and eastern coastal states because it was cheap and met goals for generating power with economies of scale. The type of regulatory regime governing electricity provision in different parts of the country (i.e., state regulation of vertically integrated electric utilities or competitive markets for power generation administered by regional transmission organizations) affects the types and levels of resources used for electric power production.66
For many years, the growth in sales of electric power in the United States could be directly related to growth in the U.S. economy. However, with the energy efficiency of homes and appliances increasing, a decoupling of growth in electricity demand from growth in Gross Domestic Product (GDP) has occurred. According to EIA, the linkage has been declining over the last 60 years, as U.S. economic growth outpaced growth in electricity use.67 However, EIA postulates that the recent trend of flat to no growth in demand for electricity in much of the country could be changing, as new technologies (for example, electric vehicles) could couple with new regulations (perhaps driven by climate change concerns) to increase electricity demand.68 The price of natural gas will likely be a key factor in the mix of fuels used to generate electricity in the next few decades. The EIA anticipates that low natural gas prices would continue to displace coal as a fuel for power generation in future decades.69
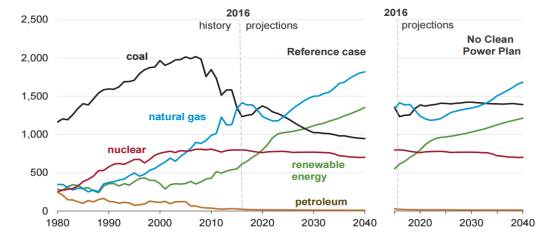
Figure 17 shows the EIA's projection for U.S. electricity generation (from select fuels) to 2050. The major influence on the projection concerns the implementation of the U.S. Environmental Protection Agency's Clean Power Plan (CPP), which would mandate emissions reductions from the electric power sector.70 As the figure shows, implementation of the CPP could potentially have a major effect on the fuels and technologies for power generation in the period.
|
Figure 17. U.S. Net Electricity Generation from Select Fuels Billion kilowatt-hours |
 |
|
Source: EIA, Annual Energy Outlook 2017 with projections to 2050, January 4, 2017, p. 70, http://www.eia.gov/outlooks/aeo/pdf/0383(2017).pdf. Notes: The Reference case projection assumes trend improvement in known technologies, along with a view of economic and demographic trends reflecting the current central views of leading economic forecasters and demographers. It generally assumes that current laws and regulations affecting the energy sector, including sunset dates for laws that have them, are unchanged throughout the projection period. The potential impacts of proposed legislation, regulations, or standards are not reflected in the Reference case. The Reference case includes the Clean Power Plan and assumes that states select the mass-based limits on CO2 emissions. |
The EIA expects that lower capital costs and the availability of tax credits will boost near-term wind power additions and sustain solar additions, whereas coal-fired unit retirements in the Reference Case are driven by low natural gas prices and the Clean Power Plan. Older, less efficient fossil fuel power plants are expected to face retirement decisions throughout the period, fostering new generating additions. The EIA projects that, after 2030, new generation will be mostly natural gas-fired or solar through 2040.71
U.S. Electric Power Import and Exports
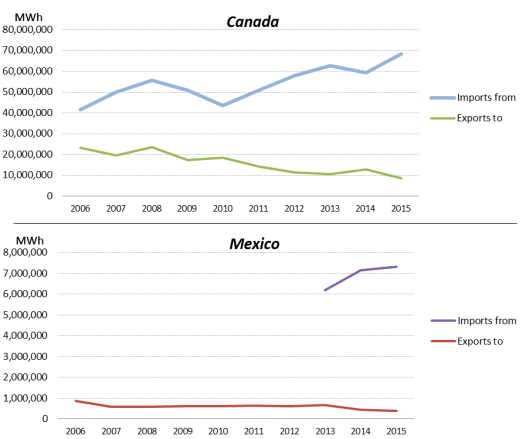
Over the last decade, the United States has experienced a marked trend of growing net electricity imports from both Canada and Mexico, although Canada is, by far, the greater trade partner. As Figure 18 shows, U.S. electricity imports have increased overall since 2006, while U.S. exports to Canada and Mexico have decreased over the same period. U.S. exports to Mexico have been relatively low and flat. The value of electricity imports from Canada to the United States rose (overall) from approximately $1.9 billion in 2011 to about $2.95 billion in 2015.72 U.S. electricity exports to Canada in 2015 were valued at approximately $300 million. Due to the limited grid integration between Mexico and the United States, overall volumes of electricity traded are much lower than electricity traded with Canada. In 2015, total U.S. electricity imports from Mexico were approximately 7.31 Terawatt-hours (TWh), accounting for approximately 2% of annual Mexican electricity generation, while total U.S. exports to Mexico were about 0.4 TWh.73 In 2015, the value of U.S. electricity imports from Mexico was approximately $810 million, while the value of U.S exports to Mexico was about $46.1 million.74
|
Figure 18. U.S. Electricity Imports from and Exports to Canada and Mexico Annual Megawatt-hours (MWh) |
 |
|
Source: U.S. Energy Information Administration, Online data, Table 2.13, December 20, 2016, http://www.eia.gov/electricity/annual/html/epa_02_13.html. Notes: Note the differences in MWh scale between Canada and Mexico. In 2013, EIA significantly revised its approach to estimating imports from Mexico. Earlier values are excluded to avoid inconsistency. |
Current Electricity Trade—Mexico
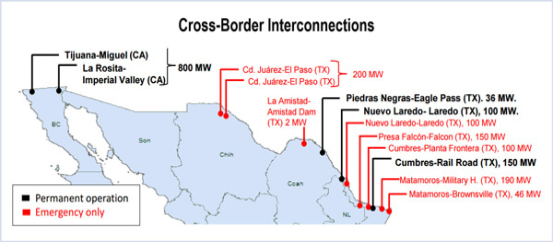
The United States and Mexico have traded electricity since 1905, but this trade is confined to the few places where transmission lines cross the U.S.-Mexico border. Between California and Mexico, electricity is imported from a handful of generators to supply the San Diego area. In the case of Texas, electricity trade has been somewhat episodic, occurring mainly during periods of constrained supply within the Texas or Mexican transmission systems.75 As Figure 19 shows, most of the cross-border interconnections are for emergency purposes and not used for regular trade. Overall U.S. electricity trade with Mexico is about one-tenth the volume of trade U.S. trade with Canada. Like the Canadian case, however, system reliability is an important benefit of the U.S.-Mexico transmission connections.
|
Figure 19. U.S.-Mexico Electric Transmission Interconnections |
 |
|
Source: Robert Mullin, "Mexico's Grid Operator to Explore Participation in EIM," RTO Insider, October 18, 2016. |
Current Electricity Trade—Canada
As Figure 18 shows, the United States' net imports of electricity from Canada have increased from 18.1 TWh in 2006 to 59.8 TWh in 2015. From the U.S. perspective, these imports can be locally important (e.g., to New York, Midwest states, and New England) because customers can access low-cost hydropower resources from north of the border. The northeastern United States is the largest recipient of Canadian electricity exports, receiving almost 60% of all exports.76 The majority of these exports are shared between the New England and New York markets. On a national basis these imports are small—equivalent to less than 1.5% of total U.S. electric power generation in 2015.
The cross-border electricity trade is a much higher percentage of the total Canadian electric power generation. In 2015, Canadian net exports represented nearly 10% of total Canadian power generation. Canada's electrical transmission system design facilitates the transport of electricity more easily on a north-south basis to the United States than it does on an east-west basis across Canadian provinces. Therefore, U.S. markets are an important outlet for Canadian generators in eastern Canada. Conversely, in western Canada, customers benefit from the import of low-cost U.S. hydropower resources from the Pacific Northwest.
In addition to trade benefits, the heavy integration of the U.S. and Canadian grids improves grid reliability in both countries—a critical benefit not necessarily reflected in electricity volumes. The Northeast Power Coordinating Council (NPCC), the Midwest Reliability Organization (MRO), and the Western Electricity Coordinating Council (WECC) ensure that power flowing across U.S.-Canada transmission lines helps maintain the stability of the North American eastern and western power grids.
Prospects for Future Electricity Trade
Future cross-border electricity trade will be a function of both the development of future generation capacity and the availability of cross-border transmission infrastructure to move electric power. These factors are, in turn, influenced by a complex set of commercial and government policy considerations which may vary across Mexico, Canada, and the United States. In the United States, the intersecting issues of renewable power development, transmission system expansion and reliability, and long-standing difficulties in multi-state permitting of new transmission generally make long-distance projects difficult. The Federal Energy Regulatory Commission (FERC) issued FERC Order 1000 to facilitate electric transmission planning for projects with public policy benefits (such as state renewable portfolio standards requiring electric utilities to provide varying amounts of renewable energy to customers), but implementation has been a challenge.77 While these proposals are limited to planning within the United States, they would inevitably have an impact on Canada and Mexico because of the grid connections, and the much larger size of the U.S. power system.
Overall, EIA projects in its Reference case that total U.S. imports of electricity from Canada and Mexico will decline from 75.6 billion kilowatt-hours (kWh) in 2015 to 54.5 billion kWh in 2050. However, EIA projects that total U.S. exports will grow modestly from 9.2 billion kWh in 2015 to 13.2 billion kWh in 2050.78 The following sections present a more detailed look at the prospects for electricity trade with Canada and Mexico.
Future Electricity Trade with Canada
Cross-border trade in electricity with Canada may be particularly intertwined with natural gas supplies, renewable energy development, and transmission planning. Over the projection period, due to competition with growing renewable and natural gas-fired generation in the United States, Canadian regulators project that net exports of Canadian electricity will "grow moderately ... reaching 48 TWh in 2040."79 Both nations currently have various state and provincial policies for the increased use of renewable electric power. In 2009, the United States and Canada established a "Clean Energy Dialogue" (CED) to facilitate the development of low carbon energy sources. Elements of the CED include, among other things, collaboration on expansion and modernization of the North American transmission grid to improve reliability and facilitate trade in low carbon power, advancement of smart grid technology, and development of electricity storage technology.80
Notwithstanding the CED and similar initiatives, the need for greater cross-border electricity trade has been thrown into question by declining U.S. natural gas prices, which have led to correspondingly lower power prices in the United States—reducing the relative value of low-cost hydropower from Canada. The ability of the United States to develop additional natural gas pipeline capacity in the Northeast will be a key factor for Canadian electricity exports going forward. If New England is able to develop sufficient pipeline capacity to support a larger portfolio of natural-gas fired power plants, its need to import electricity from Canada may be reduced.81
In addition to the impact of natural gas, Canadian officials state that construction costs, environmental regulations, government policies, and socioeconomic concerns also will have implications for new and refurbished electricity projects.82 Transmission planning and construction in the United States and Canada face similar challenges, particularly for long-distance projects. These challenges include permitting and siting approvals that often involve multiple jurisdictions, and finding the funding for the large investments in transmission (and power generation) that will be needed to meet demand growth.83
If constructed, new transmission projects have the potential to significantly increase electricity trade across the U.S.-Canada border. A recently completed example is the Montana-Alberta Tie Line completed in 2013. The project is a 230 kilovolt (kV) transmission line that allows bidirectional flow of power primarily for new wind generating units on both sides of the border.84 In December 2016, DOE issued a Presidential Permit (No. PP-400) for the construction and operation of the New England Clean Power Link, a high voltage direct current electric transmission line with a capacity of 320 kV to access more Canadian hydropower.85
A number of additional projects are still in the permit application phase. One example is the Great Northern Transmission line, a proposed 500 kV project connecting Minnesota Power with Manitoba Hydro, which is intended to support development of wind resources in the upper Midwest. Another example is the proposed Champlain Hudson Power Express, which developers say will relieve transmission congestion in the New York City area by sending hydropower directly from Quebec, potentially bringing up to 1,000 MW of additional power to the city. In total, there are 11 applications pending at the Department of Energy (DOE) seeking Presidential Permits for cross-border transmission lines to Canada.86 There are currently four applications pending with DOE for electricity commodity export authority—a separate authority—permitting exports to Canada.
Future Electricity Trade with Mexico
Prospects for future electricity trade with Mexico are tied to Mexico's overall economic growth. According to one report, Mexico accounts for one-fifth of all energy use in Latin America, and overall energy demand in Mexico is growing. The report estimated that generation capacity in Mexico could nearly double by 2030 to almost 118 GW.87 Some of Mexico's expected electricity sector needs could potentially be met by U.S. sources—or, conversely, could be developed in Mexico to supply U.S. markets as well as Mexican markets. As discussed above, Mexico is pursuing initiatives to reform its energy sector to allow limited private sector development of power generation. DOE expects that these reforms may offer an increased opportunity for electricity trading and sales.88
The United States and Mexico recently signed "a non-binding foundational document" to support a continued effort by both countries to assure reliability of the increasingly interconnected American and Mexican electricity grids.89 Transmission development and grid integration, requiring fully synchronous operations on both sides of the U.S.-Mexico border, are crucial to increasing future electricity trade between the countries. Developers are pursuing several new cross-border transmission projects. For example, DOE recently issued a Presidential Permit to a subsidiary of Sempra International for a new 230 kV transmission line to supply electricity from a Mexican wind farm to the California market.90 There is one pending request for a Presidential Permit for a new cross-border transmission line and there are seven applications pending with DOE for electricity export authority to Mexico.91
Renewable Electricity Resources, Generation, and Trade
Renewable generation is expected to account for a large percentage of generation capacity additions throughout the North American power grid in the coming decades. The United States, Canada, and Mexico are each well endowed with renewable resources that could be used to generate electricity to satisfy domestic demand or be traded with a bordering country. For example, the majority of electricity exported to the United States from Canada is from hydroelectric generation.92 The scale of renewable electricity generation varies considerably among the three North American countries, with U.S. renewable capacity being an order of magnitude larger than that of Mexico. Nevertheless, the mix of renewable electricity resources could potentially create future opportunities for trade across the north and south U.S. borders.
Renewable Electricity Resource Estimates
The potential for renewable electricity generation in North America is large. The National Renewable Energy Laboratory (NREL) estimates that the United States has the potential to annually generate as much as 481,800 Terawatt-hours of electricity from renewable sources.93 This is nearly 100 times the annual (as of 2015) total electricity generation in Canada, Mexico, and the United States combined.
Resource estimates for each country are available from different sources that use different assumptions and methodologies for various renewable energy sources. Additionally, these sources have varying degrees of detail. NREL provides estimates for the United States,94 the International Renewable Energy Agency (IRENA) assesses renewable potential for Mexico,95 and Canada's National Energy Board and industry associations provide estimates for Canada's renewables potential. As a result, it is difficult to compare resource estimates. However, the resource assessments indicate how resources differ in each country and what additional resources potentially could be developed to increase cross-border electricity trade. Solar, wind, and hydropower resources are briefly discussed in the following sections because of their large contribution to current capacity and potential generation. Other renewable energy sources (e.g., biomass and geothermal) are not discussed in detail in this report.
Solar Resources
Electricity generation from solar energy is one of the largest sources of non-nuclear zero-carbon electricity in the world. However, solar resources throughout the world and even within a single country are not uniform and can vary considerably over distances. Generally, locations that are closer to the equator have more potential for solar electricity generation. Solar electricity projects can be at different scales: residential, commercial, and utility. The type of solar project generally depends on factors such as the solar resource, land/surface area available, financial and market policies that support such projects, and either retail or wholesale electricity prices that will influence project revenues. Figure 20 illustrates how solar resources vary by location throughout North America.
|
Figure 20. Solar Energy Resources in North America Kilowatt-hours per square meter per day (kWh/m2/day) |
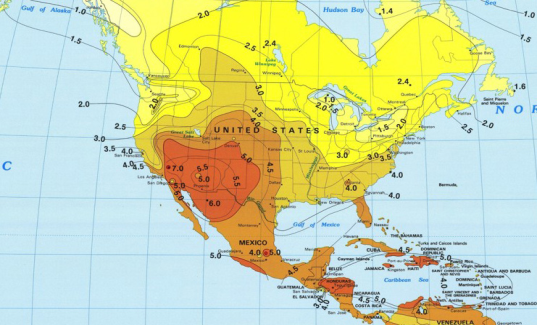 |
|
Source: BP Solar, "World Design Insolation," 2001, http://www.amerescosolar.com/sites/default/files/Insolation_MapWeb.pdf. Notes: For this map, the unit of measurement is kilowatt-hours per square meter per day. Electricity generation from this same area will be less, however, because it is a function of the conversion efficiency of the technology used to convert solar radiation into electrical energy. |
Wind Resources
Wind generation potential in North America varies by location. Most high quality resources are in the Great Plains region of the United States as well as the coastal areas. Parts of southern Canada also have wind generation potential. Figure 21 shows U.S. wind resource estimates.
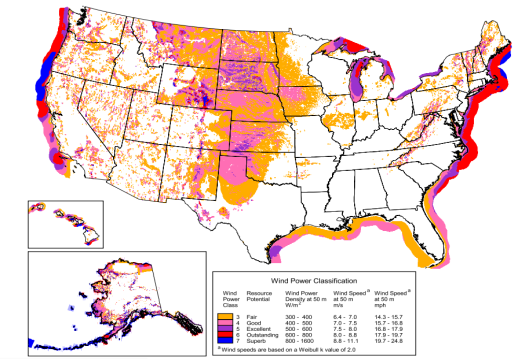 |
|
Source: National Renewable Energy Laboratory, "United States – Wind Resource Map," May 6, 2009, http://www.nrel.gov/gis/pdfs/windsmodel4pub1-1-9base200904enh.pdf. Note: The map shows the annual average wind power estimates at a height of 50 meters. |
Hydroelectric Resources
New hydroelectric generation, especially in Canada, is a potential source of renewable electricity generation that could be relevant to cross-border energy trade. The majority of U.S. electricity imports from Canada are generated from hydroelectric facilities. According to the Canadian Hydropower Association, there is potential to nearly triple the amount of hydroelectric generation in Canada. The majority of the potential new generation is estimated to be in the southern Canadian provinces (Figure 22).
|
Figure 22. Canadian Hydro Capacity and Potential Megawatts |
 |
|
Source: Canadian Hydropower Association, December 28, 2016, https://canadahydro.ca/wp-content/uploads/2015/08/CHA-map-CapacityPotential-2015-940px.jpg. |
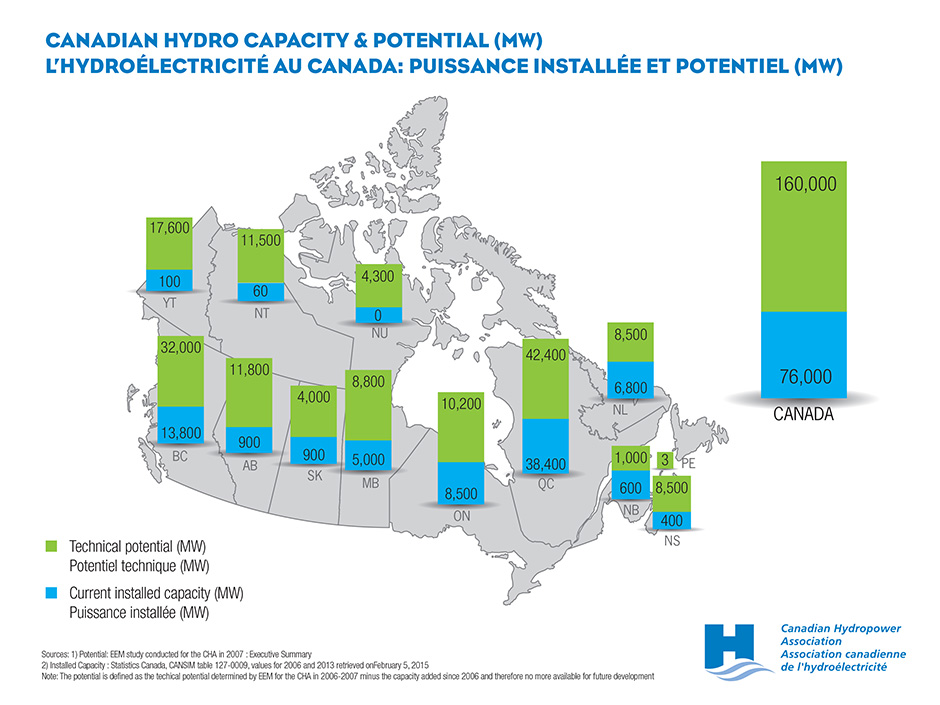
Renewable Electricity Generation Capacity
The scale of deployment and growth rates of renewable electricity generation varies dramatically among the United States, Canada, and Mexico. Figure 23 shows renewable electricity generation capacity for each country, by technology, for 2006 to 2015 and with projections to 2018.
|
Figure 23. Renewable Generation by Country 2006-2018 |
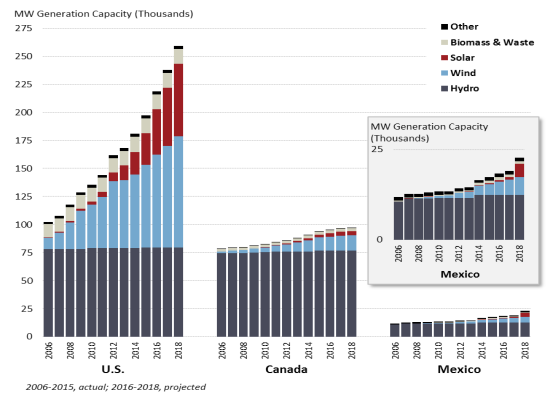 |
|
Source: CRS. Data from Bloomberg New Energy Finance, http://www.bnef.com (subscription required), accessed December 27, 2016. |
Since 2006, hydroelectric capacity has been stable for each of the countries. Wind and solar, by contrast, have experienced significant growth and have been the main contributors to renewable electricity capacity growth since 2006. The scale of renewable generation capacity is also different among the countries. The United States and Canada have nearly equivalent hydro generation capacity. However, deployment of wind and solar in the United States since 2006 has resulted in U.S. renewable capacity being more than double that of Canada in 2015. Mexico's renewable capacity remains relatively small, although solar generation capacity is projected to increase considerably in 2018.
Cross-Border Renewable Electricity Trade
Most of the North American cross-border renewable electricity trade is Canadian hydroelectricity exports to the United States. Most of these exports from Canada originate from the hydro resources located in the Manitoba, Ontario, and Quebec provinces and are provided to the upper Midwest and Northeast U.S. electricity markets. Hydroelectric power makes up the majority of electricity exports from Canada to the United States. To the extent that state- or federal-level policies incentivize the use of low-carbon electricity in the United States, it is possible that there may be additional opportunities for cross-border Canadian hydroelectricity trade in the future. Press reports indicate that Hydro-Quebec is looking to increase sales to the U.S. Northeast as a way to support carbon emission policies in the region.96
Based on North America resource estimates, the potential also exists for wind and solar trade between the countries. Wind resources exist near the borders of each of the countries, and large solar resources are shared across the U.S./Mexico border. To date, state-level renewable portfolio standards partially motivate construction of wind and solar electricity projects in the United States. As a result, the electricity generated is consumed in the domestic market. In June 2016 it was reported that the three countries agreed to a 50% clean power (including nuclear and renewables) target by 2025.97 Should this pledge be realized, it is possible that renewable electricity trade opportunities might develop through U.S. imports from Canada and Mexico and Mexican imports from the United States. Canada already generates more than 50% of its power from qualified clean sources, so there would likely be little or no opportunity for U.S. exports to Canada. Realizing these potential trade flows will be dependent on transmission infrastructure between the three countries.
Coal
The United States has the largest coal reserves and resources in the world. The EIA estimates there are about 255 billion tons of recoverable domestic coal reserves in the United States.98 In the United States, the total demonstrated resource base is estimated at about 477 billion tons.99 EIA statistics show that 55% of U.S. coal reserves are located in the West, of which Montana and Wyoming together account for 43%.100 The EIA reports Canada's recoverable coal reserves at 5 billion tons and Mexico's at less than 3.6 billion tons.101
U.S. coal production reached its highest level in 2008 (1.17 billion tons) before falling precipitously in 2015—a record decline of over 10% when compared to 2014 production levels (Table 4).102 EIA short-term projections show coal production under 800 million tons in both 2016 and 2017.103 As discussed above, the softening of demand for coal has been attributed to utilities opting for low-cost natural gas, declining costs for renewable energy options, and increasing regulatory cost associated with coal-fired power plants. A warmer than usual winter heating season in 2015 (resulting in high coal inventories) and lower demand for U.S. coal exports have also been factors.
|
Year |
United States |
Canada |
Mexico |
|||
|
2006 |
|
|
|
|||
|
2007 |
|
|
|
|||
|
2008 |
|
|
|
|||
|
2009 |
|
|
|
|||
|
2010 |
|
|
|
|||
|
2011 |
|
|
|
|||
|
2012 |
|
|
|
|||
|
2013 |
|
|
|
|||
|
2014 |
|
|
|
|||
|
2015 |
|
|
|
Source: U.S. Energy Information Administration, Coal Annual Report, various years for U.S. data.
Notes: Tons = short tons; na=not available.
Canada consistently produced over 70 million tons of coal over the past 10 years (except for 2015), reaching a high point of 76 million tons in 2007 and near 76 million tons in 2013. Canada has accounted for around 1%-1.5% of world coal production since 2006. Most of Canada's coal production occurs in the western provinces of Alberta and British Columbia. Mexico's coal production has fluctuated between 11 million tons and 18 million tons since 2006.
Cross-Border Trade Volumes in Coal
As a result of limited data availability, this section provides intra-North American coal trade data only for the recent past. Relative to coal traded globally, there is a small amount of coal traded among the three North American countries. The estimated value of U.S. coal exports to Canada in 2015 was approximately $490 million, while coal imports from Canada were approximately $137 million. Exports of U.S. coal to Mexico in 2015 had an estimated value of approximately $298 million; there were negligible U.S. imports of Mexican coal.104
Overall, U.S. coal exports peaked at 125.7 million tons in 2012 then declined to about 74 million tons in 2015. The EIA projects U.S. coal exports to be around 57 million tons in 2016—more than a 50% drop in four years.105 In 2013 (when total U.S. coal exports were 117.7 million tons), U.S. coal exports to Canada and Mexico accounted for 5.5% and 4.8% of the total, respectively.106 For the first three quarters of 2015 coal exports to Canada and Mexico were at 7.5% and 5.4% of the total, respectively. As U.S. coal exports have fallen, their relative share to Canada and Mexico has increased slightly. In the first three quarters of 2016, the share of coal exports to Canada and Mexico increased again to 8.2% and 6% of U.S. total coal exports, respectively.107 For the first three quarters of 2015 and 2016, the United States received about 10% of its coal imports from Canada and under 1,000 tons from Mexico. The United States has averaged about 11 million tons of coal imports annually over the past five years.108
By contrast, Canada has maintained over 40% of its coal production as exports, reaching over 50% from 2011 to 2013. In 2015, Canada exported about 33 million tons of coal, the majority (about two-thirds) of which went to Asia (South Korea, Japan, and China) and 4% (equal to about 1.2 million tons) to the United States. The U.S. coal export market has been heavily oriented toward Europe, as the Canadian market has been toward Asia.109 Also in 2015, Canada imported 8 million tons of coal, 75% (about 6 million tons) of which came from the United States.110 Canadian coal imports have fallen from over 20 million tons in 2006 to about 8 million tons in 2015.111 Mexico's coal exports in general rose from nearly zero in 2006 to 267,000 tons in 2011, or about 1.5% of Mexico's coal production. According to the EIA, Mexico is a net importer of coal, supplying 80% of its coal demand.
Coal Trade by Mode
The limited coal trade within North America is not likely to require any new infrastructure, although Canada has planned port expansion for exports to Asia and has invested $1.4 billion (CAD) in infrastructure projects. Canada's coal rail transport network and export facilities are well established, with sufficient capacity for the current coal export market. There are three coal export terminals in British Columbia, one at Thunder Bay, Ontario, and another in Nova Scotia. In 2013, the Canadian government invested over $1 billion (CAD) in the export facilities to improve their efficiency. The Canadian and U.S. rail system is well situated to move coal north and south between the two countries as well as into Mexico. Any additional port capacity in the United States or Canada would likely be centered on shipping coal to the Asian market.
Projections for Future Trade and Key Drivers
The key issue regarding coal use and trade in North America is centered on reducing carbon emissions and pursuing low-cost alternative energy sources. As discussed in the previous section, coal consumption in Canada and Mexico is already in decline. Canada projects further decline of coal consumption (which has seen coal consumption decline from 60 million tons in 2005 to 41 million tons in 2014—a 42% decline). Some of its provinces have decided to phase out coal completely. For example, Ontario completely phased out coal power in 2014 and Manitoba expects to phase out coal use for home space heating by 2017. Alberta (Canada's province using the most coal, with 18 coal-fired power plants) plans to phase coal power out by 2030.112 While the United States may continue to meet the majority of Canadian coal import needs, the amount of coal imported from the United States will likely continue to decline.
Mexico has made substantial investments in renewable energy projects over the past few years, particularly hydropower ($4 billion in 2015, $2 billion in 2014), and has planned huge investments in nuclear power, projecting three new nuclear power plants over the next 12 years. Additionally, natural gas consumption has risen significantly relative to coal consumption, and electricity generation from fuel oil has declined by about 50% since 2012.113
In Mexico, coal demand may grow slightly as the use of fuel oil for electricity generation declines and the country adopts other energy sources to meet its needs. There may be some room for incremental U.S. coal exports to Mexico in the short run, but it is not likely to be a destination for increased U.S. coal exports in the long run.
Author Contact Information
Footnotes
| 1. |
Greenhouse gases (GHG), according to the Environmental Protection Agency (EPA), are any gases that absorb infrared radiation in the atmosphere. There are six greenhouse gases addressed by EPA regulatory actions: carbon dioxide (CO2), methane (CH4), nitrous oxide (N2O), and fluorinated gases—sulfur hexafluoride (SF6), hydrofluorocarbons (HFCs), and perfluorocarbons (PFCs). Carbon dioxide is the most prevalent GHG produced by combustion of fossil fuels. See http://www.epa.gov/climatechange/ghgemissions/gases.html. |
| 2. |
Oil "resources" are the largest measure of the amount of oil underground, absent any constraints on potential production. They include oil that cannot be economically extracted, oil that is inaccessible due to geographic, legal, or property restrictions, and oil that is believed, but not proved, to be in place. |
| 3. |
In recent years, the definition of what constitutes an "oil reserve" has become more complicated. Crude oil is included in all definitions, but some sources, for example, the BP Statistical Review of World Energy, also include gas condensates and natural gas liquids (NGLs). Although these liquids enter oil refineries, they are not necessarily derived from oil exploration and development, and as a result may not respond to oil market price signals and incentives. |
| 4. |
Data were derived from the BP Statistical Review of World Energy, June 2016, p. 6. Oil data from different sources can vary somewhat due to definitional differences, measurement methodologies, and other factors. |
| 5. |
BP Statistical Review of World Energy, June 2016, and June 2006. |
| 6. |
U.S. Energy Information Administration, "U.S. Crude Oil and Natural Gas Proved Reserves, Year-End 2015," web page, December 14, 2016, http://www.eia.gov/naturalgas/crudeoilreserves/. |
| 7. |
U.S. Geological Survey, "USGS Estimates 20 Billion Barrels of Oil in Texas' Wolfcamp Shale Formation," press release, November 15, 2016. Note that the USGS assessment is not equivalent to an estimate of proven reserves. |
| 8. |
Energy Information Administration, "Crude Oil Production," online database, December 30, 2016, https://www.eia.gov/dnav/pet/pet_crd_crpdn_adc_mbbl_m.htm. |
| 9. |
U.S. Census Bureau, "Country and Product Trade Data," online database, January 12, 2016, https://www.census.gov/foreign-trade/statistics/country/index.html. |
| 10. |
U.S. Census Bureau, January 12, 2016. Values include the "Fuel Oil" and "Other Petroleum Products" categories. |
| 11. |
The construction, connection, operation, and maintenance of a pipeline connecting the United States with a foreign country requires executive permission through a Presidential Permit under Executive Orders 11423 and 13337. |
| 12. |
Executive Office of the President, "Construction of the Keystone XL Pipeline," memorandum, January 24, 2017, https://www.whitehouse.gov/the-press-office/2017/01/24/presidential-memorandum-regarding-construction-keystone-xl-pipeline. |
| 13. |
Dan Healing, "TransCanada to Reapply for Keystone XL Pipeline Permit after Trump Order," Canadian Press, January 24, 2017. |
| 14. |
Kyle Bakx, "NEB Approves Enbridge Line 3 Pipeline Replacement," CBC News, April 25, 2016. |
| 15. |
U.S. Energy Information Administration, "U.S. Imports by Country of Origin," online database, November 30, 2016, https://www.eia.gov/dnav/pet/pet_move_impcus_d_nus_NCA_mbblpd_m.htm. |
| 16. |
Sheela Tobben and Robert Tuttle, "Oil-Sands Glut Jams Pipes to U.S., Making Rail Next Option," Bloomberg, September 22, 2016. |
| 17. |
Kat Greene, "Canadian Gov't OKs $5.4B Trans Mountain Pipeline Project," Law 360, November 29, 2016. A second proposed export pipeline to the West Coast, Northern Gateway, was denied approval at the same time. |
| 18. |
Robert Tuttle, "Energy East is the Odd Pipeline Out after Federal Approval of Two Others," Bloomberg, December 2, 2016. |
| 19. |
Association of American Railroads, "Average Weekly Rail Carloads," "Originated Rail Traffic," http://www.aar.org. |
| 20. |
According to a June 2016 report by the Canadian Association of Petroleum Producers, "Crude Oil: Forecast, Markets and Transportation," p. 31. |
| 21. |
North Dakota Pipeline Authority, "Oil Transportation Table"; https://northdakotapipelines.com/oil-transportation-table/. |
| 22. | |
| 23. |
The remaining shares are consumed by a local refinery and truck transport. North Dakota Pipeline Authority, "Monthly Update"; https://northdakotapipelines.com/directors-cut/. |
| 24. |
Railroad rights-of-way are typically 200 feet in width. Over the 20th century, the discontinuance of much of their passenger service and improvements in signal systems allowed railroads to rip up parallel tracks, saving maintenance costs and greatly increasing the utilization of remaining track. |
| 25. |
The agency with jurisdiction is the Surface Transportation Board. |
| 26. |
For a description of new infrastructure projects underway at the Port of Corpus Christi, see http://portofcc.com/investments/. |
| 27. |
For further information, see CRS In Focus IF10455, Harbor Deepening: Federal Studies and Construction Projects, by Nicole T. Carter. |
| 28. |
Larger tankers are used on longer voyages (such as to Asia or the Middle East) because of economies of scale at sea. There are diseconomies for larger ships in port (they take longer to load/unload) so on shorter voyages, smaller vessels are used. However, ships on shorter routes also spend a greater portion of their total time in port. |
| 29. |
"Lightering" is a common practice that occurs at many ports receiving crude oil tankers—a large tanker will transfer its cargo to a smaller vessel outside the harbor (in deeper water). In some cases, tankers also transfer their cargo to an offshore pipeline connection. |
| 30. |
For further information on the Coast Guard's role in supporting navigation, see CRS Report R44566, The Coast Guard's Role in Safeguarding Maritime Transportation: Selected Issues, by John Frittelli. |
| 31. |
U.S. waterborne imports of refined products from Canada are largely destined for the ports of Boston, New York, and Portland, ME. |
| 32. |
U.S. Department of State, "Application of Borrego Crossing Pipeline, LLC for Presidential Permit," August 12, 2016, p. 4, https://www.state.gov/documents/organization/261363.pdf. |
| 33. |
As in the case of crude oil, in order for a deposit to be categorized as a reserve, there must be a 90% certainty that the deposit can be produced with existing technology, at current prices, and be able to be moved to market with existing infrastructure. |
| 34. |
15 U.S.C. §717b(c). |
| 35. |
Roberto Morales, "Crece participacion de EU en venta de gas natural a Mexico," El Economista, August 15, 2016, online, http://eleconomista.com.mx/industrias/2016/08/15/crece-participacion-eu-venta-gas-natural-mexico. |
| 36. |
U.S. Energy Information Administration, "U.S. Natural Gas Exports to Mexico Continue to Grow," November 29, 2016. |
| 37. |
This restructuring has been somewhat complicated across TransCanada's system. For an initial perspective, see Samantha Santa Maria, "TransCanada Files Final 2011 Mainline Tolls; Raises Rates Again," Platts, April 29, 2011. |
| 38. |
U.S. Energy Information Administration, "New U.S. Border-Crossing Pipelines Bring Shale Gas to More Regions in Mexico," December 1, 2016, http://www.eia.gov/todayinenergy/detail.php?id=28972. |
| 39. |
Secretaría de Energía (Mexico), Plan Quinquenal de Gas Natural 2015-2019, December 18, 2015, http://www.gob.mx/sener/acciones-y-programas/plan-quinquenal-de-gas-natural-2015-2019. |
| 40. |
Sheetal Nasta, "It Takes Two—Supplying Mexico's Growing Natural Gas Demand, Part 3," RBN Energy blog, October 30, 2016, https://rbnenergy.com/it-takes-two-supplying-mexico%E2%80%99s-growing-natural-gas-demand-part-3. |
| 41. |
Ibid. |
| 42. |
National Energy Board (Canada), "Canada's Pipeline Transportation System 2016," December 2, 2016, https://www.neb-one.gc.ca/nrg/ntgrtd/trnsprttn/2016/ppln-cpcty-eng.html. |
| 43. |
Ibid. |
| 44. |
Note that natural gas wells also produce "plant condensates," sometimes also referred to as "natural gasoline," which are mostly pentanes and heavier hydrocarbons also considered to be natural gas liquids. They have lower value than other NGLs. Natural gas plant condensates are used as diluents (thinners) in the extraction and production of heavy crude oils from oil sands deposits, among other uses. The classification of individual liquid products under the broad category of "NGLs" is not uniform across the industry and over time, however, so data about NGL production and markets should be interpreted with caution. |
| 45. |
https://www.neb-one.gc.ca/nrg/ntgrtd/trnsprttn/2016/ppln-cpcty-eng.html. |
| 46. |
National Energy Board (Canada), Canada's Pipeline Transportation System 2016, December 2, 2106, https://www.neb-one.gc.ca/nrg/ntgrtd/trnsprttn/2016/ppln-cpcty-eng.html#s2. |
| 47. |
U.S. Department of State, "Presidential Permit Application for the New Burgos Pipeline," December 18, 2014. |
| 48. |
U.S. Department of Energy, Quadrennial Energy Review Report: Energy Transmission, Storage, and Distribution Infrastructure, April 2015, http://www.energy.gov/sites/prod/files/2015/08/f25/QER%20Chapter%20VI%20North%20America%20April%202015.pdf. |
| 49. |
Jennifer A. Dlouhy and Angela Greiling Keane, U.S., Mexico, Canada Pledge 50 Percent Clean Power by 2025, Bloomberg, June 27, 2016, https://www.bloomberg.com/news/articles/2016-06-27/u-s-mexico-said-to-pledge-50-percent-clean-power-by-2025. |
| 50. |
Mexico Secretería de Energía, Informe Pormenorizado del Desempeño y las Tendencias de la Industria Eléctrica—2015, December 15, 2016, Gráfica 24. |
| 51. |
Statistics Canada, "Nuclear and Electric Power," online database, Tables 127-0009. |
| 52. |
U.S. Energy Information Administration, Electric Power Annual, November 21, 2016, Table 4.13. |
| 53. |
Mexico Secretería de Energía, 2015, Gráfica 1. |
| 54. |
Center for Energy Economics—Bureau of Economic Geology, The University of Texas at Austin, and Instituto Tecnológico y de Estudios Superiores de Monterrey, Guide to Electric Power in Mexico, August 2013, p. 2, http://www.beg.utexas.edu/energyecon/2013%20E.pdf (hereinafter, CEE). |
| 55. |
"In Mexico electricity prices are set below costs of production.... In 2006 electricity subsidies in Mexico totaled $9 billion and were among the largest in the world. Two-thirds of the subsidies go to residential customers and those subsidies increased by 46% between 2002 and 2006 in real terms. Industrial customers, especially large industrials, come closest to covering the costs of serving them. As a consequence of receiving the larger proportion of the total net subsidy, residential consumers in Mexico receive a tariff that is among the lowest in the world. These subsidies distort price signals and increases demand above what it would be if electricity prices reflected actual costs of production." CEE, p. 4. |
| 56. |
Sylvia Gaylord, "Mexico's Electricity Sector Reform in Perspective," POWER, January 1, 2015. |
| 57. |
During this transition period, Mexican regulators state that they will "continue to review the operations of private companies" [CRS translation]. See Mexico Secretería de Energía, 2015 p. 24. |
| 58. |
Sylvia Gaylord, "Mexico's Electricity Sector Reform in Perspective," POWER Magazine, January 1, 2015. |
| 59. |
Mexico Secretería de Energía, December 15, 2016, Gráfica 45. |
| 60. |
CEE, p. 2. |
| 61. |
Mexico Secretería de Energía, Estrategia Nacional de Energía 2013-2027, p. 7. |
| 62. |
National Energy Board (Canada), Canada's Energy Future 2016: Energy Supply and Demand Projections to 2040, January 2016, p. 3, https://www.neb-one.gc.ca/nrg/ntgrtd/ftr/2016/index-eng.html (hereinafter, NEB16). |
| 63. |
Ibid. |
| 64. |
Ibid, p. 80. |
| 65. |
Ibid, p. 82. |
| 66. |
EIA, About 60% of the U.S. Electric Power Supply Is Managed by RTOs, April 4, 2011, http://www.eia.gov/todayinenergy/detail.php?id=790. |
| 67. |
"In the 1950s, 1960s, and 1970s the use of electricity often increased more than 5% per year. It then slowed to 2% to 3% per year in the 1980s and 1990s, and over the past decade it has fallen to less than 1% per year." EIA, U.S. Economy and Electricity Demand Growth Are Linked, but Relationship Is Changing, March 22, 2013, http://www.eia.gov/todayinenergy/detail.php?id=10491. |
| 68. |
EIA, Annual Energy Outlook 2017, January 5, 2017, p. 76, http://www.eia.gov/outlooks/aeo/pdf/0383(2017).pdf. |
| 69. |
Ibid, p. 74. |
| 70. |
The Clean Power Plan (CPP), which is currently stayed pending judicial review, requires states to develop plans to reduce CO2 emissions from existing generating units that use fossil fuels. For further information, see CRS Report R44265, EPA's Clean Power Plan: Implications for the Electric Power Sector, by Richard J. Campbell. |
| 71. |
EIA, Annual Energy Outlook 2017, January 5, 2017, pp. 76 -77, http://www.eia.gov/outlooks/aeo/pdf/0383(2017).pdf. |
| 72. |
National Energy Board of Canada, 2015 Electricity Exports and Imports Summary, Annual Canadian Electricity Exports, Imports and Export Revenue, 2011-2015, December 1, 2016, https://www.neb-one.gc.ca/nrg/sttstc/lctrct/stt/lctrctysmmr/2015/smmry2015-eng.html. An average historical exchange rate of US$0.95 for CAD$1 was assumed for this period using data from http://www.canadianforex.ca/forex-tools/historical-rate-tools/historical-exchange-rates. |
| 73. |
EIA, U.S. Electricity Imports from and Electricity Exports to Canada and Mexico—Table 2.13, 2016, https://www.eia.gov/electricity/annual/html/epa_02_13.html. |
| 74. |
Assuming a price of electricity generated in Mexico of approximately $117.06 per MWh, and a price of electricity generated in the United States of approximately $69.57 per MWh. See International Energy Agency, Electricity Information 2012, Table 3.5, Electricity Prices for Industry in U.S. Dollars/MWh, p. III.55, http://www.iea.org/media/training/presentations/statisticsmarch/ElectricityInformation.pdf. |
| 75. |
Energy Information Administration, "Mexico Week: U.S.-Mexico Electricity Trade Is Small, with Tight Regional Focus," May 17, 2013, http://www.eia.gov/todayinenergy/detail.php?id=11311. |
| 76. |
National Energy Board, January 2016, p. 85. |
| 77. |
Rich Heidorn Jr., Transparency, ROFR Remain Challenges for Order 1000, Speakers Say, RTO Insider, October 10, 2016, https://www.rtoinsider.com/ferc-order-1000-eba-32554/. |
| 78. |
EIA, Annual Energy Outlook 2017 - U.S. Electricity Trade, Reference Case, January 10, 2017, http://www.eia.gov/outlooks/aeo/data/browser/#/?id=10-AEO2017®ion=0-0&cases=ref2017&start=2015&end=2050&f=Q&linechart=&sourcekey=0. |
| 79. |
National Energy Board, January 2016, p. 83. |
| 80. |
DOE, U.S.-Canada Clean Energy Dialogue, 2016, http://energy.gov/ia/initiatives/us-canada-clean-energy-dialogue-ced. |
| 81. |
National Energy Board, January 2016, p. 85. |
| 82. |
National Energy Board, January 2016, p. 85. |
| 83. |
National Conference of State Legislatures, Transmitting Electricity in an Increasingly Complex Energy Market: A Legislative Update, April, 2011, http://www.ncsl.org/research/energy/transmitting-electricity-in-an-increasingly-comple.aspx. |
| 84. |
EIA, U.S.-Canada electricity trade increases, July 9, 2015, http://www.eia.gov/todayinenergy/detail.php?id=21992. |
| 85. |
Hannah Northey, Obama Admin OKs Linking Canadian Hydro to New England, E&E News, December 6, p. 2016, http://www.eenews.net/eenewspm/stories/1060046756/print. |
| 86. |
Details of the applications are available on the DOE website. See DOE, Pending Export Authorization Applications, 2016, http://energy.gov/oe/services/electricity-policy-coordination-and-implementation/international-electricity-regulation/pending-applications. |
| 87. |
International Renewable Energy Agency, Renewable Energy Prospects: Mexico, May 2015, p. 2, http://www.irena.org/DocumentDownloads/Publications/IRENA_REmap_Mexico_report_2015.pdf. |
| 88. |
U.S. Department of Energy, April 2015, p. 6-2. |
| 89. |
U.S. Department of Energy, U.S. Energy Secretary and Mexico Energy Minister Sign Bilateral Principles to Promote Electricity Reliability of Interconnected Power Systems, January 9, 2017, https://energy.gov/articles/us-energy-secretary-and-mexico-energy-minister-sign-bilateral-principles-promote. |
| 90. |
Energy Information Administration, Mexico Week: U.S.-Mexico Electricity Trade Is Small, with Tight Regional Focus, May 17, 2013, http://www.eia.gov/todayinenergy/detail.php?id=11311. |
| 91. |
Details of the applications are available on the DOE website. See DOE, Pending Export Authorization Applications, 2016, http://energy.gov/oe/services/electricity-policy-coordination-and-implementation/international-electricity-regulation/pending-applications. |
| 92. |
Canadian Hydropower Association, https://canadahydro.ca/facts/, accessed December 28, 2016. |
| 93. |
National Renewable Energy Laboratory, U.S. Renewable Energy Technical Potentials: A GIS-Based Analysis, July 2012. |
| 94. |
Ibid. |
| 95. |
International Renewable Energy Agency, Renewable Energy Prospects: Mexico, May 2015. |
| 96. |
Bloomberg News, "Hydro-Quebec Eyes New Long-Term Power Accords in U.S." Northeast, December 6, 2016. |
| 97. |
Bloomberg News, "U.S., Mexico, Canada Pledge 50 Percent Clean Power by 2025," June 28, 2016. |
| 98. |
Reserves are known quantities that can be produced given current prices, policy, and technology. This report uses the term "tons" to mean short tons. |
| 99. |
U.S. EIA, IEO 2016, May 11, 2016, and data taken from EIA, "U.S. Coal Reserves," November 4, 2016. The demonstrated resource base is defined by the USGS as measured and indicated reserves plus sub-economic resources. |
| 100. |
U.S. Energy Information Administration, Annual Coal Report, 2014. p. 24. |
| 101. |
Mexico is placed in the "other" category, which also includes Japan, South Korea, the Middle East, and Greenland, together holding 3.6 billion tons of recoverable coal reserves. |
| 102. |
U.S. Energy Information Administration, Annual Coal Report, various years. |
| 103. |
U.S. Energy Information Administration, Short Term Energy Outlook, December 6, 2016. |
| 104. |
U.S. Energy Information Administration, Quarterly Coal Report (Abbreviated) July-September 2016, December 22, 2016. Trade value estimates are based on extrapolating the first three quarters of country of origin export data provided by the EIA but using total EIA coal export data for 2015 (74 million tons). |
| 105. |
U.S. Energy Information Administration, Annual Coal Report, November 3, 2016 and Short Term Energy Outlook, December 6, 2016. |
| 106. |
U.S. Coal Exports: The Long Road to Asian Markets, The Oxford Institute for Energy Studies, March 2015, p. 19. |
| 107. |
U.S. Energy Information Administration, Quarterly Coal Report, December 22, 2016, Table 7. |
| 108. |
Ibid, Table 18. |
| 109. |
Natural Resources Canada, Energy Fact Book—2016-2017, p. 65. |
| 110. |
Ibid. |
| 111. |
Natural Resources Canada data from: International Energy Agency, "The Role of Coal for Energy Security in World Regions," 2016, http://www.iea.org/ciab/The_role_of_coal_for_energy_security_in_world_regions.pdf. |
| 112. |
Joseph Quigley, "Coal in Canada: A By the Numbers Look at the Industry," CBC News, February 4, 2016. |
| 113. |
U.S. Energy Information Administration, Mexico Country Analysis, December 9, 2016. |