Domestic Food Assistance: Summary of Programs
Changes from March 22, 2018 to August 27, 2019
This page shows textual changes in the document between the two versions indicated in the dates above. Textual matter removed in the later version is indicated with red strikethrough and textual matter added in the later version is indicated with blue.
Domestic Food Assistance: Summary of Programs
Contents
- Background
- Hunger and Food Insecurity
- Program Variation
- USDA-FNS Programs
- Farm Bill
- WIC and Child Nutrition Programs
- HHS-ACL Programs
Figures
Summary
Over the years, Congress has authorized and the federal government has administered programs to provide food to the hungry and to other vulnerable populations in this country. This report offers a brief overview of hunger and food insecurity along with the related network of programs. The report is structured around three main tables that contain information about each program, including its authorizing language, administering agency, eligibility criteria, services provided, participation data, and funding information. In between the tables, contextual information about this policy area and program administration is provided that may assist Congress in tracking developments in domestic food assistance. This report provides a bird's-eye view of domestic food assistance and can be used both to learn about the details of individual programs as well as compare and contrast features across programs.
This report includes overview information for the U.S. Department of Agriculture's Food and Nutrition Service (USDA-FNS) programs as well as nutrition programs administered by the Administration on Aging (AOA), within the U.S. Department of Health and Human Services' Administration for Community Living (HHS-ACL). USDA-FNS nutrition programs include those most recently reauthorized by the 20142018 farm bill (the Agricultural Act of 2014; P.L. 113-79). Programs included in the farm bill areAgriculture Improvement Act of 2018; P.L. 115-334). Programs in the farm bill include the Supplemental Nutrition Assistance Program (SNAP), The Emergency Food Assistance Program (TEFAP), Commodity Supplemental Food Program (CSFP), Fresh Fruit and Vegetable Program (FFVP), and the Senior Farmers' Market Nutrition Program (SFMNP). USDA-FNS also administers programs not contained in the farm bill: the Special Supplemental Nutrition Program for Women, Infants, and Children (WIC) and Child Nutrition programs (School Breakfast Program [SBP], National School Lunch Program [NSLP], Summer Food Service Program [SFSP], Special Milk Program [SMP], and Child and Adult Care Food Program [CACFP]). HHS-ACL programs are the nutrition programs contained in the Older Americans Act (OAA)—Congregate Nutrition Program; Home Delivered Nutrition Program; Grants to Native Americans: Supportive and Nutrition Services; and the Nutrition Services Incentive Program (NSIP).
Background
This report gives an overview of the major federal programs that provide food assistance within the United States and the territories. The report begins by discussing common concepts and themes across the network of domestic food assistance programs. The report is split into two main parts: programs administered by the U.S. Department of Agriculture's Food and Nutrition Service (USDA-FNS), and programs administered by the Administration on Aging (AOA), within the U.S. Department of Health and Human Services' Administration for Community Living (HHS-ACL). Within the USDA-FNS section are two subsections of programs: Farm Bill programs (Table 1), and the Special Supplemental Nutrition Program for Women, Infants, and Children (WIC) and child nutrition programs (Table 2). Within the HHS-ACL section, Table 3 provides an overview of the Older Americans Act (OAA) nutrition programs.1 The tables within this report are intended to provide summary information, which can help illustrate the ways in which domestic food assistance programs are both similar and different.
Hunger and Food Insecurity
Congress has long been interested in issues of hunger and allocating federal resources to address hunger in this country. The federal programs discussed in this report pursue the goal of providing food to low-income and needy populations, seeking to prevent hunger. Some of these programs, such as the National School Lunch Program (NSLP), have deep roots dating to the Depression era. More recently, many policymakers are concerned not just with the economic challenges of purchasing enough food, but with the public health concerns of improving diet quality, reducing obesity, and preventing diet-related disease.2
Evaluating trends in hunger in our nation is crucial to understanding if the efforts to prevent hunger are working and in recognizing if there are particularidentifying vulnerable populations that need assistance. "Hunger," however, is a challenging concept to measure. For that reason, "food security" and "food insecurity," as opposed to "hunger," are the prevailing terms used to describe the ability to access adequate food.
"Food security" and "food insecurity," as defined by USDA, focus on those economic and other access-related reasons associated with an individual's ability to purchase or otherwise obtain enough to eat. They are also terms that can be objectively measured. For this reason, a 2006 panel convened by the National Research Council, at the request of USDA, reviewed USDA measurements related to food adequacy. The panel recommended that USDA make a clear distinction between food insecurity and hunger. According to the panel, hunger isUSDA's use of these terms came out of a decades-long collaboration between federal agencies and private-sector researchers to improve the measurement of hunger in the U.S. population.3 This consortium concluded that hunger, as an individual-level physiological condition that is not feasible, was difficult to measure through a household survey.3 Furthermore, the panel stated that it is difficult to capture gradations in hunger through individual assessment. Thus, the terms food security and food insecurity do not capture those noneconomic or other They recommended food security and food insecurity as alternative concepts that captured the economic reasons for inadequate food and/or nutritional intake, rather than individual behaviors that may result in the physical condition of being hungry. For example, these terms do not capture instances where an individual may have missed a meal due to illness or because they were otherwise too busy to eat.
Each year, the U.S. Department of Agriculture's Economic Research Service (USDA-ERS) conducts an analysis based on Current Population Survey (CPS) data to measure food security in the United States.4 Data from the USDA-ERS's 2016 study are included in this CRS report. USDA-ERS uses terminology that indicates whether a household was able to purchase or otherwise acquire enough to eat in 2016 ("food security") or not able to purchase or acquire enough to eat ("food insecurity") (for example, dieting or missing a meal due to illness). This new food security measure was deployed in a multiquestion "Food Security Supplement" to the Census's Current Population Survey (CPS) starting in 1995. In 2006, a National Academies panel convened at the request of USDA evaluated the measure, recommending its continued use with some refinements to the food security and insecurity definitions.4
Each year, USDA's Economic Research Service (USDA-ERS) conducts an analysis based on the Food Security Supplement data.5 Data from the USDA-ERS's 2017 study are included in this CRS report. Since 2006, USDA-ERS has recognized a spectrum of four levels of food security, listed below from highest to lowest:
Food Security:
High food security—Households had no problems, or anxiety about, consistently accessing adequate food.
Marginal food security—Households had problems at times, or anxiety about, accessing adequate food, but the quality, variety, and quantity of their food intake were not substantially reduced.
Food Insecurity:
Low food security—Households reduced the quality, variety, and desirability of their diets, but the quantity of food intake and normal eating patterns were not substantially disrupted.
Very low food security—At times during the year, eating patterns of one or more household members were disrupted and food intake reduced because the household lacked money and other resources for food.5
Note also that a recent congressional commission, the National Commission on Hunger6
Note that the National Commission on Hunger, a congressional commission that operated from 2014 to 2015, used "very low food security" as its working definition of "hunger" in its final report released in January 2016.6
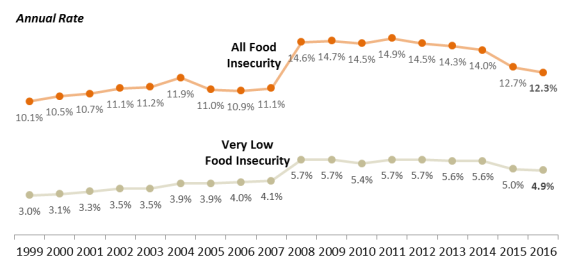
The annual rate of food insecurity for households was 11.1% in 2007, rose to as high as 14.9% in 2011, before declining to 12.7% in 2015.7 The 2016 rate of food insecurity is now estimated at 12.3%, which is not a statistically significant decline from 20157
In 2017, USDA-ERS found that 11.8% of U.S. households (where "household" includes one or more members) were food insecure—a statistically significant decline from 2016, when the rate was 12.3%, and recent highs of nearly 15% following the Great Recession.8 These rates, as well as the subset "very low food security," are shown in Figure 1. Specific measurements for 2016 are the following:
12.3In summary, in 2017
11.8% of U.S. households were food insecure (87.7% of U.S. households were food secure). This was not15.0 million households). This is a statistically significant decrease from201512.3% in 2016.- 4.
9%5% of U.S. households had very low food security; this is essentially unchanged from 5.0% in 2015. 59.0(5.8 million households), a statistically significant decline from 4.9% in 2016. (Households with very low food security are a subset of food insecure households.) 58.4% of food insecure households reported that theyhadparticipated in SNAP, WIC, or NSLP in the last month.(This rate is unchanged from the 2015 report.)
However, this may be an underestimate because survey respondents often underreport participation in assistance programs.
USDA-ERS also tabulatesanalyzes food insecurity rates for many different subpopulations and household types, finding subgroups above and below the national rates of food insecurity. Some examples of their 20162017 findings include the following:
- 7.
89% of households that included an elderly member (aged 65 or older) were food insecure.9Thisdecline from 2015increase from 2016's rate (8.37.8%) is not statistically significant. 16.515.7% of households that included children were food insecure. Food insecure households with children do not always include children who are themselves food insecure, as adults often shield children. Therefore, only8.07.7% of households with children included food insecure children.Figure 2, created by USDA-ERS, displays the food security and insecurity status of household members within the category of households with children. These changes from 2015. These changes from 2016 findings (which were 16.65% and7.88.0%, respectively) are not statistically significant.22.521.8% of households headed by black, non-Hispanics and 18.5% of households headed by Hispanics were food insecure. (These were not statistically significant changes from 2015 rates (21.5% and 18.5%, respectively).) 9.3% of white, non-Hispanic households were food insecure in the 2016 estimate, which was a statistically significant decrease from 2015 (10.5%).
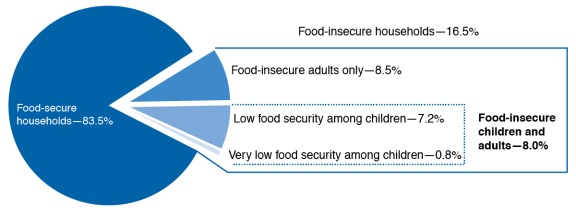
Hispanic individuals; 8.8% of households headed by white, non-Hispanic individuals; and 18.0% of households headed by Hispanic individuals were food insecure. These were not statistically significant changes from 2016 rates (22.5%, 9.3%, and 18.5%, respectively). Program Variation
There are a number of domestic food assistance programs. Although each of the 17 programs discussed in this report provides for food in some way, the ways in which each program accomplishes this goal vary. For example, programs vary with respect to the target population (e.g., pregnant women, children, older individuals), eligibility requirements, and types of assistance provided (e.g., commodity foods, prepared meals). In an April 2010 report, the Government Accountability Office (GAO) listed 70 programs that pertain to food and nutrition but ultimately narrowed their study to a smaller subset of 18 programs that focus on food assistance or coordination of food assistance activities.109
One way to examine this variation is to compare the populations eligible for these domestic food assistance programs. For instance, the WIC program is available to children under the age of five, while the school meals programs (NSLP and School Breakfast Program [SBP]) become available to school-age children. Another way to examine this variation is to compare the benefits that these programs provide. Within this constellation of programs, federal resources provide benefits redeemable for uncooked foods, cash assistance to support program operations, USDA-purchased commodity foods (discussed further in the next section), and prepared meals. While some programs provide specific foods (e.g., through the federal and state requirements for "food package" in the Commodity Supplemental Food Program [CSFP] and WIC), SNAP gives benefits that may be redeemed for a wide variety of foods at authorized retailers. OAA programs provide prepared meals that not only assist those who lack adequate resources to purchase food, but can also assist those who lack the functional capacity to prepare a meal on their own.
The following sections of the report and the accompanying tables provide more details about the services, eligibility, participation, and funding for each program. They help illustrate the similarities and differences between the programs, including the extent to which they provide similar or distinct forms of assistance to similar or distinct populations.
Note on Funding Data Used in This Report
FY2017 Data Displayed in This Report. Because FY2018 appropriations are not yet final, the tables to follow display FY2017 appropriations for the discretionary programs, including WIC and the OAA programs. For the USDA-FNS programs that are open-ended mandatory programs (e.g., SNAP and the child nutrition programs), the tables include FY2017 costs according to USDA-FNS, because that measure better reflects program spending. USDA programs that are funded through transfers and not appropriations (e.g., the Fresh Fruit and Vegetable Program (FFVP), Senior Farmers' Market Nutrition Program (SFMNP)) are noted accordingly. Appropriations for the USDA-FNS open-ended mandatory programs are listed in CRS Report R44588, Agriculture and Related Agencies: FY2017 Appropriations, coordinated by [author name scrubbed]. |
USDA-FNS Programs
authorized in the farm bill (Table 1),10 as well as WIC and Child Nutrition Programs (Table 2). Table 1 and Table 2 provide details on the USDA-FNS programs, including services provided, eligibility, participation, and funding.
The USDA-FNS national office works in concert with USDA-FNS's regional offices11 and state agencies. With respect to SNAP (formerly known as the Food Stamp Program), state agencies and legislatures have a number of options and waivers that can affect SNAP program operations from state to state. USDA-FNS's "SNAP State Options" report illustrates how states are administering the program.12 With respect to school meals programs (National School Lunch Program and School Breakfast Program), state departments of education and school districts play a role in administering these programs. WIC and the Child and Adult Care Food Program (CACFP) are often coadministered by state and local health departments.
|
USDA Food Assistance Resources
|
USDA's Food and Nutrition Service (FNS) administers domestic food assistance programs authorized in the farm bill (Table 1),13 as well as WIC and Child Nutrition Programs (Table 2). Table 1 and Table 2 provide details on the USDA-FNS programs, including services provided, eligibility, participation, and funding.
The USDA-FNS national office works in concert with USDA-FNS's regional offices14 and state agencies. With respect to SNAP (formerly known as the Food Stamp Program), state agencies and legislatures have a number of options and waivers that can affect SNAP program operations from state to state. USDA-FNS's "SNAP State Options" report illustrates how states are administering the program.15 With respect to school meals programs (National School Lunch Program and School Breakfast Program), state departments of education and school districts play a role in administering these programs. WIC as well as the Child and Adult Care Food Program (CACFP) are often co-administered by state and local health departments.
As mentioned above, USDA commodity16As mentioned above, USDA commodity13 foods are foods purchased by the USDA for distribution to USDA nutrition programs. The programs in this report that include USDA commodity foods are The Emergency Food Assistance Program (TEFAP), Commodity Supplemental Food Program (CSFP), National School Lunch Program (NSLP), Summer Food Service Program (SFSP), and Child and Adult Care Food Program (CACFP). USDA commodity foods are also provided to the HHS-ACL's Nutrition Services Incentive Program (NSIP) (Table 3). These programs distribute "entitlement commodities" (an amount of USDA foods to which grantees are entitled by law) as well as "bonus commodities" (USDA food purchases based on requests fromthe needs of the agricultural producer community).17
These domestic food assistance programs have a historical, and in most respects, ongoing relationship with farming and agriculture. For example, the first Food Stamp Program, a pilot program in the 1940s, sold orange and blue "food stamps" to program participants.1815 While $1 would provide a program participant with $1 in value of "orange stamps" that could be spent on any food, the program participant would also receive an additional 50 cents worth of "blue stamps," which could only be used to purchase agricultural products that were in surplus. Commodity donation programs that supported the post-Depression farm economy were precursors to the National School Lunch Program.1916 TEFAP and several of the child nutrition programs still benefit from USDA commodity foods as well as USDA's donation of bonus commodities, which USDA purchases based on agricultural producers' identification of surplus goods or need for price support. As aIn more contemporary exampleexamples, the 2014 farm bill (P.L. 113-79), most recent2010 child nutrition reauthorization (P.L. 111-296), and USDA initiatives include efforts to promote "farm-to-school" endeavors, seeking, for example, to facilitate school cafeterias' purchasing from local and regional farms.20
Farm Bill
Table 1 lists those programs that were most recently reauthorized by the 20142018 farm bill. The "farm bill" is an omnibus reauthorization and extension of dozens of farm, food, and nutrition laws. Most recently, Congress passed the Agricultural Act of 2014 (P.L. 113-79Agriculture Improvement Act of 2018 (P.L. 115-334), which is referred to as the "20142018 farm bill." The 20142018 farm bill included 12 titles on topics ranging from conservation, rural development, and research to horticulture.2118 The nutrition title, Title IV, included all of the programs listed in Table 1.
Farm bill nutrition programs have their authorizing language primarily in the
- Food and Nutrition Act of 2008 (originally P.L.
95-11388-525, most recently amended by P.L.113-128115-334), - Emergency Food Assistance Act of 1983 (originally P.L. 98-8, most recently amended by P.L.
113-79115-334), and - Agriculture Consumer and Protection Act of 1973 (originally P.L. 93-86, most recently amended by P.L.
113-79115-334).
The primary food assistance program in the farm bill is SNAP. The Congressional Budget Office (CBO), at the time of enactment, found that close to 7976% of the 2014forecasted 2018 farm bill spending was in the nutrition title, Title IV.2219 This is nearly all due to the mandatory moneyspending associated with SNAP. Formerly referred to as the Food Stamp Program, the federal program name change to SNAP was included in the 2008 farm bill (P.L. 110-246). Further detail on SNAP, beyond Table 1, is available in CRS Report R42505, Supplemental Nutrition Assistance Program (SNAP): A Primer on Eligibility and Benefits, by [author name scrubbed].
Farm bill nutrition programs have generally been under the jurisdiction of the House Agriculture Committee and the Senate Committee on Agriculture and Forestry.2320 The 20142018 farm bill was enacted on February 7, 2014December 20, 2018, and provides authorization (primarily authorizations of appropriations) through FY2023through FY2018 (September 30, 20182023) for most nutrition program activities. CRS In Focus IF11087, 2018 Farm Bill Primer: SNAP and Nutrition Title Programs, also summarizes these programs and policies.
WIC and Child Nutrition Programs
Table 2 lists the programs authorized by the Richard B. Russell National School Lunch Act (P.L. 79-396) and the Child Nutrition Act of 1966 (P.L. 89-642). Broadly, the programs contained in these laws are the Special Supplemental Nutrition Program for Women, Infants, and Children (WIC) as well as the "child nutrition programs." "Child nutrition programs" is a category used to describe the USDA-FNS programs that help to provide food for children in school or institutional settings.
The National School Lunch Program and School Breakfast programsProgram provide a per-meal subsidy for each meal that is served for free, for a reduced price, or for a full price (called a "paid" meal). The Child and Adult Care Food Program (CACFP) and Summer Food Service Program (SFSP) will, under certain circumstances, provide free meals or snacks to all the children at a site, because it is often the site (not the child) that is subject to eligibility criteria. The Fresh Fruit and Vegetable Program (FFVP), or snack program (see Table 1), is sometimes referred to as a child nutrition program. In this report, it is included in farm bill programs because FFVP was included in the 2008 farm bill.
Generallyhas been more often amended by omnibus farm bills than child nutrition reauthorization legislation.
Historically, the WIC and child nutrition programs' authorizing statutes arewere reauthorized for a five-year period. The most recent reauthorization as of the date of this report, the Healthy, Hunger-Free Kids Act of 2010 (P.L. 111-296), was signed into law in December 2010. It reauthorized these programs through FY2015. Policymakers have played an oversight role as USDA implements the legislation. Certain provisions from that law expired after September 30, 2015. As of the date of this report, Congress has not reauthorized the child nutrition and WIC statutesCertain provisions from that law expired after September 30, 2015, but the vast majority of child nutrition and WIC programs and activities continuehave continued due to the provision of funding in FY2016 and FY2017 appropriations laws and FY2018 continuing resolutions.24, FY2017, FY2018, and FY2019 appropriations laws.21
WIC and the child nutrition programs have generally been under the jurisdiction of the House Committee on Education and the WorkforceLabor and the Senate Committee on Agriculture, Nutrition and Forestry. For details (beyond Table 2 information) on these programs and their reauthorizations, see
- CRS In Focus IF10266, An Introduction to Child Nutrition Reauthorization
- CRS Report R43783, School Meals Programs and Other USDA Child Nutrition Programs: A Primer
- CRS Report R44115, A Primer on WIC: The Special Supplemental Nutrition Program for Women, Infants, and Children
- CRS Report R44373, Tracking the Next Child Nutrition Reauthorization: An Overview
- CRS Report R41354, Child Nutrition and WIC Reauthorization: P.L. 111-296
|
Authorizing Legislation |
Program Information |
|
|
Supplemental Nutrition Assistance Program (SNAP, formerly the Food Stamp Program) |
||
|
Food and Nutrition Act (7 U.S.C. §2011 et seq.) / Administered by the U.S. Department of Agriculture's Food and Nutrition Service (USDA-FNS) |
Description: Provides benefits (through the use of electronic benefit transfer cards) that supplement low-income recipients' food purchasing power. Benefits vary by household size, income, and expenses (like shelter and medical costs) and averaged nearly $ Eligibility: In general, eligible households must meet Data: In |
$ |
|
Food Distribution Program on Indian Reservations (FDPIR) |
||
|
Food and Nutrition Act, Section 4(b) (7 U.S.C. §2013(b)) |
Description: Provides, in lieu of SNAP benefits, a food package of USDA commodities to low-income households on Indian reservations and to Native American families residing in Oklahoma or in designated areas near Oklahoma. In Eligibility: In addition to geographic eligibility requirements, FDPIR has income requirements similar but not identical to SNAP's. Households that participate in FDPIR may not participate in SNAP and vice versa. Data: In |
$ |
|
The Emergency Food Assistance Program (TEFAP) |
||
|
The Food and Nutrition Act, Section 27 and The Emergency Food Assistance Act, Section 204(a) (7 U.S.C. §§2036 & 7508(a)) / Administered by USDA-FNS |
Description: Provides food commodities (and cash support for distribution costs) through states to local emergency feeding organizations (e.g., food banks, food pantries, soup kitchens) serving the low-income population. Eligibility: States designate local emergency feeding organization recipients and establish income standards for individual eligibility. Data: Information on the number of recipients or the average value of benefits under TEFAP is not available. |
$ |
|
Community Food Projects |
||
|
Food and Nutrition Act, Section 25 (7 U.S.C. §2034) / Administered by USDA-NIFA |
Competitive grants to nonprofit organizations for programs that improve access to locally produced food for low-income households. Eligibility for grants will vary according to |
$ |
|
Commodity Supplemental Food Program (CSFP) |
||
|
Agriculture and Consumer Protection Act of 1973, Section 4(a) (7 U.S.C. §612c note) / Administered by USDA-FNS |
Description: Provides supplemental monthly food packages to primarily low-income elderly persons. Eligibility: Elderly persons (age 60+) who have access to a local CSFP project and household income below 130% of the federal poverty guidelines. (Prior to 2014, women, infants, and children with income below 185% of the federal poverty guidelines had been eligible for CSFP. P.L. 113-79 reauthorized the program as seniors-only; women, infants, and children may continue to participate only if they had been participating prior to implementation of this change.) Data: In |
$ |
|
Fresh Fruit and Vegetable Program (FFVP) |
||
|
Russell National School Lunch Act, Section 19 (42 U.S.C. §1769a) (expanded in Section 4304 of the Food, Conservation, and Energy Act of 2008 (P.L. 110-246) / Administered by USDA-FNS |
Description: Provides grants to schools to purchase fresh fruit and vegetable snacks to be provided during the school day. Eligibility: Program is nationwide in select schools. States are required to select elementary schools in which 50% or more of the students are eligible for free or reduced price meals. Priority is placed on schools where the highest proportion of children are eligible for free and reduced-price meals. Data: Information on the number of FFVP recipients is not available. |
$ |
|
Senior Farmers' Market Nutrition Program (SFMNP) |
||
|
Food, Conservation, and Energy Act of 2008 (P.L. 110-246), Section 4231 (7 U.S.C. §3007) / Administered by USDA-FNS |
Description: Provides grants to participating states to offer vouchers/coupons to low-income seniors that may be used at farmers' markets, roadside stands, and other approved venues to purchase fresh produce. Eligibility: Income eligibility criteria are established by states, within a framework established by FNS (e.g., participants must be at least 60 years old, household income no greater than 185% of federal poverty). Data: In FY2016, about 816,000 individuals in 42 states, the District of Columbia, Puerto Rico, and eight Indian Tribal Organizations received annual SFMNP vouchers/coupons worth an average of $32. |
$21e |
Source: Prepared by CRS based on FY2017FY2019 appropriations information provided by P.L. 115-31116-6 and the Appropriations Committees' accompanying joint explanatory statement; exceptions and further details are provided in the notes below. USDA-FNS FY2017FY2018 total program costs other program data are from USDA-FNS data sources found through http://www.fns.usda.gov/data-and-statistics (as of February 1, 2018May 2019) or the FY2019 USDA-FNS Budget Explanatory Notes (http://www.obpa.usda.gov/32fns2019notes.pdf).
a. For a summary of the nonfinancial eligibility rules, see CRS Report R42505, Supplemental Nutrition Assistance Program (SNAP): A Primer on Eligibility and Benefits, by [author name scrubbed]Randy Alison Aussenberg.
b. USDA-FNS FY2017FY2018 "Total Costs" data (not appropriations) are included here. Data as of February 1, 2018August 2, 2019, available on USDA-FNS website, https://www.fns.usda.gov/sites/default/files/pd/SNAPsummary.pdfresource-files/annual.xls. As an open-ended appropriated mandatory program, SNAP's and FDPIR's funding is largely based on the demand for program's benefits and services.
c. Total displayed includes FY2017FY2019 appropriated mandatory funding for entitlement commodities ($297294.5 million) and discretionary funding for administrative costs ($59.4 million109.6 million, includes transfer of $30.0 million in CSFP prior-year funds); total does not include USDA's bonus commodity donations.
d. FFVP funding is permanently authorized to receive an annual transfer of $150 million (plus an annual adjustment for inflation) from the Section 32 account. However, since FY2009, appropriations laws have delayed the transfer, which impacts the amount of funding actually available for the program in a given fiscal year. Amount shown in the table is based on USDA-FNS's 2016-2017 school year funding information for this program (https://www.fns.usda.gov/ffvp-allocation-funds-school-year-2016-2017).
e. Senior Farmers' Market Nutrition Program (SFMNP) funding is provided by a transfer from the Commodity Credit Corporation; the transfer is authorized by the program's authorizing language. SFMNP is not funded by appropriations. Amount shown is authorized transfer amount for FY2017.
f. For the duration of the FY2018 CR, Section 116 increases funding for CSFP. Instead of basing funding for the program on the FY2017 funding level ($236.1 million), this CR provision would use a base of approximately $238.1 million.
|
Authorizing Legislation / Federal Administrative Entity |
Program Information |
|
|
Special Supplemental Nutrition Program for Women, Infants, and Children (WIC) |
||
|
Child Nutrition Act, Section 17 (42 U.S.C. §1786) / Administered by USDA-FNS |
Description: Provides supplemental, nutrient-rich foods; nutrition education and counseling; and breastfeeding promotion and support to low-income women, infants, and children. WIC benefits are redeemable for a list of nutrient-rich foods specific to the participant's eligibility category and medical needs (for example, foods specifically recommended for an anemic pregnant woman). These foods are specified in USDA-FNS regulations, although state agencies may further specify. Eligibility: Pregnant, postpartum, and breastfeeding women, infants, and children up to age five with household income at or below 185% of the federal poverty guidelines may be WIC eligible. Applicants must be individually determined to be at "nutritional risk" by a health professional and must meet state residency requirements. Applicants may also be categorically eligible based on receipt of TANF cash assistance, SNAP, or Medicaid. (States are prohibited from allowing dual participation in both WIC and CSFP.) Data: In |
$6, |
|
WIC Farmers Market Nutrition Program (FMNP) |
||
|
Child Nutrition Act, Section 17(m) (42 U.S.C. §1786(m)) / Administered by USDA-FNS |
Description: Provides grants to participating states to offer vouchers/coupons/EBT to WIC participants that may be used in farmers' markets, roadside stands, and other approved venues to purchase fresh produce. Eligibility: Women, infants over four months old, and children who are certified to receive WIC Program benefits or who are on a waiting list for WIC certification are eligible to participate in the FMNP. Data: In |
$18.5 |
|
School Breakfast Program (SBP) |
||
|
Child Nutrition Act, Section 4 (42 U.S.C. §1773) / Administered by USDA-FNS |
Description: Provides federal cash assistance for elementary and secondary schools that provide breakfast to school children. Federal subsidies currently range from about 30 cents to $2.00 per meal (depending on the type of meal/snack and the income of the recipient, with subsidies higher in Alaska and Hawaii). Total amount of assistance is based on the number of free, reduced-price, and paid lunches served. Eligibility: Children are eligible to receive free school breakfasts if their family income is below 130% of federal poverty guidelines, or if they receive TANF or SNAP benefits or services, or if they are migrant, runaway, homeless, or are in foster care. Children are eligible to receive reduced-price school breakfasts if their family income is between 130% and 185% of federal poverty guidelines. Schools with 40% or more of students identified as categorically eligible for free meals may serve free meals to all students at the school. Data: In |
$4, |
|
National School Lunch Program (NSLP) |
||
|
Russell National School Lunch Act (42 U.S.C. §1751 et seq.) / Administered by USDA-FNS |
Description: Provides federal assistance, in the form of cash and commodities, to elementary and secondary schools that provide lunch to school children. Federal subsidies currently range from about 30 cents to $3.00 per meal (depending on the type of meal/snack and the income of the recipient, with subsidies higher in Alaska and Hawaii). Total amount of assistance is based on the number of free, reduced-price, and paid lunches served. Eligibility: Children are eligible to receive free school lunches if their household income is below 130% of federal poverty guidelines, or if they receive TANF or SNAP benefits or services, or if they are migrant, runaway, homeless, or are in foster care. Children are eligible to receive reduced-price school lunches if their household income is between 130% and 185% of federal poverty guidelines. Schools with 40% or more of students identified as categorically eligible for free meals may serve free meals to all students at the school. Data: In |
$13, |
|
Summer Food Service Program (SFSP) |
||
|
Russell National School Lunch Act, Section 13 (42 U.S.C. §1761) / Administered by USDA-FNS |
Description: Provides federal cash assistance and some commodity foods to local public and private nonprofit "service institutions" running summer youth programs, camps, or other recreation sites that serve low-income children during their summer break or during lengthy school-year breaks. Sites may be schools, camps, community centers, and other organizations. Sponsors receive per-meal/snack subsidies as well as assistance with operating costs. Eligibility: Children age 18 or younger and certain individuals with disabilities over the age of 18, who live in low-income areas where at least half the children are from families with incomes below 185% of federal poverty guidelines (open sites), or who are enrolled in an activity program where half the children are from families with incomes below 185% of federal poverty guidelines (enrolled sites), and children from families with incomes below 185% of federal poverty guidelines at participating camps. Automatically eligible are homeless or runaway children and children in Head Start, Early Head Start, Even Start, or state-funded prekindergarten programs that have received authorized waivers. Data: In |
$ |
|
Special Milk Program |
||
|
Child Nutrition Act, Section 3 (42 U.S.C. §1772) / Administered by the USDA-FNS |
Description: Provides public or nonprofit schools or child care institutions that do not participate in other federal meal programs with a per-half pint reimbursement for part of the cost of milk served to children/students. Eligibility: Any child at a participating school or half-day prekindergarten program can receive milk through the Special Milk Program. Children may either buy milk or receive it free, depending on the school's choice of program options. Data: In |
$8b |
|
Child and Adult Care Food Program (CACFP) |
||
|
Russell National School Lunch Act, Section 17 (42 U.S.C. §1766)) / Administered by the USDA-FNS |
Description: Provides cash subsidies to participating child care centers, family day care homes, after-school programs, and nonresidential adult-care centers for the meals and snacks they serve to children, the elderly, and chronically disabled persons. In child care centers and nonresidential adult-care settings, per-meal/snack subsidy payments are the same as those for school meals and child care centers. Family day care homes are reimbursed according to a tiered system. Federal subsidies currently range from about 25 cents to $2.80 (depending on the type of meal/snack and the income of the recipient, with higher subsidies in Alaska and Hawaii). Eligibility: (Child care centers) Children's eligibility for free and reduced-price meals and snacks is the same as for school meals programs. (Day care homes) There is no requirement that meals and snacks be served free or at reduced price. Instead, the homes receive a subsidy for every meal served; the size of the subsidy is based on whether the home is a Tier I or Tier II home. Tiering is based on the low-income status of the child care provider or the community in which the provider is located. (Adult services) Elderly (age 60+) or chronically disabled persons attending participating nonresidential adult-care centers. Both for-profit and nonprofit centers are eligible to participate. Adults are eligible for free or reduced meals based on income guidelines that are the same as in school meals programs. Data: In |
$3, |
Source: Prepared by CRS based on FY2016FY2019 appropriations information provided by P.L. 114-113116-6 and the Appropriations Committees' accompanying joint explanatory statement; exceptions and further details are provided in the notes below. USDA-FNS FY2017FY2018 total program costs other program data are from USDA-FNS data sources found through http://www.fns.usda.gov/data-and-statistics (as of February 1,November 2018) or the FY2018FY2019 USDA-FNS Budget Explanatory Notes (https://www.obpa.usda.gov/32fnsexnotes201832fns2019notes.pdf).
a. P.L. 115-31 (§745116-6 (§723) also rescinded $850500 million in WIC carryover funds.
b. USDA-FNS FY2017FY2018 "Total Costs" data (not appropriations) are included here. Data as of February 1, 2018August 5, 2019, available on USDA-FNS website, https://www.fns.usda.gov/pd/child-nutrition-tables. As an open-ended appropriated mandatory program, these child nutrition programs' funding is largely based on the demand for the programs' benefits and services.
HHS-ACL Programs
The Administration on Aging (AOA) within the U.S. Department of Health and Human ServiceServices (HHS), Administration for Community Living (ACL) administers domestic food assistance programs authorized under the Older Americans Act (OAA). These programs provide formula grants to states, U.S. territories, and Indian tribal organizations to support congregate meals in group settings (i.e., senior centers, community centers, and houses of worship) and home-delivered meals to older Americans.2522 AOA also administers the Nutrition Services Incentive Program (NSIP), which provides funds to the same entities to purchase food for these programs. While OAA's nutrition programs provide food assistance in the form of a prepared meal to older individuals living in the community, the stated purpose of the program is not only to reduce hunger and food insecurity, but also to promote socialization, as well as the health and well-being of older individuals.2623 Table 3 provides details on the HHS-ACL programs, including eligibility, services provided, and funding.
Older individuals who meet certain income and other requirements may also be eligible for other domestic food assistance programs administered by USDA, such as the Supplemental Nutrition Assistance Program (SNAP), the Senior Farmers' Market Nutrition Program (SFMNP), and the Commodity Supplemental Food Program (CSFP). Moreover, other services funded under OAA provide outreach, education, and referral to assist eligible older individuals in accessing these USDA benefits and programs. While senior nutrition programs are administered by AOA, there continues to be program coordination between HHS-ACL and USDA-FNS. At the federal level, states and other entities may choose to receive all or part of their NSIP allotments in the form of USDA commodities.2724 Obligations for NSIP commodity procurement are funded under an agreement between HHS-ACL and USDA-FNS.2825
At the state level, HHS-ACL and USDA-FNS nutrition services programs that target seniors may be jointly administered under state aging and disability agencies, who are primarily responsible at the state level for administering OAA-funded programs. According to findings from an evaluation of the OAA nutrition services programs, 8 in 10 State Units on Aging (SUAs)—designated state-level agencies2926—had a nutrition program administrator (NPA) who plans, develops, administers, implements, and evaluates OAA nutrition services. In 40% of SUAs with an NPA, the NPA has program responsibilities for OAA nutrition services as well as USDA programs such as SNAP and SFMNP.3027 Whether a state agency has some responsibility for administering HHS-ACL and USDA-FNS programs and services may depend on whether the agency functions as an independent administrative agency or part of an umbrella agency that also has responsibility for other health and human services.
SUAs may also collaborate with USDA-FNS programs. Most SUAs reported that they also collaborate with SNAP (56%) and SFMNP (62%), but collaborate less so with other USDA-FNS programs, such as CSFP, Child and Adult Care Food Program (CACFP), and The Emergency Food Assistance Program (TEFAP).3128 Collaboration activities with SNAP and SFMNP included promoting older-adult access to these programs, participating in committees and workshops as well as training and assistance programs, and policy planning activities. Also, older adults participating in SNAP can use their benefits as a voluntary contribution toward the OAA meal if the nutrition service provider is authorized by USDA to accept SNAP benefits for this purpose and the older adults choose to do so.32
Congress has reauthorized and amended the OAA numerous times since it was first enacted in 1965. The last OAA reauthorization occurred in 2016, when the 114th Congress enacted the Older Americans Act Amendments of 2016 (P.L. 114-144), which extended the act's authorization of appropriations for most programs, including senior nutrition, through FY2019. The 2016 OAA reauthorization made two changes to the nutrition services programs. First, it required states to "utilize" the expertise of a dietician or other individuals with equivalent education and training in nutrition science, or an individual with comparable expertise (rather than "solicit"). Second, where feasible, it added language for states to ensure that the nutrition project encourages the use of locally grown foods in meals programs and identifies potential partnerships and contracts with local producers and providers of locally grown foods.33
|
Authorizing Legislation / Federal Administrative Entity |
Program Information |
|
|
Congregate Nutrition Program |
||
|
Older Americans Act, Title III, Part C, Subpart 1 (42 U.S.C. §3030e) / Administered by HHS-ACL |
Description: Provides meals to seniors in settings such as senior centers, schools, and adult day care centers. Offers social services such as nutrition education and screening, nutrition assessment, and counseling at meals sites. Provides seniors with opportunities for social engagement and volunteerism. Eligibility: The following groups are eligible: (1) persons age 60 or older and their spouses of any age; (2) persons under age 60 with disabilities who reside in housing occupied by seniors where meals are served; (3) persons with disabilities who reside at home with, and accompany, seniors to meals; and (4) volunteers. Data: In |
$ |
|
Home Delivered Nutrition Program |
||
|
Older Americans Act, Title III, Part C, Subpart 2 (42 U.S.C. §3030f) / Administered by HHS-ACL |
Description: Provides meals to seniors who are homebound. Offers services such as nutrition screening and education, nutrition assessment, and counseling. Eligibility: Persons age 60 or older and homebound and their spouses of any age. May be available to individuals who are under age 60 with disabilities if they reside at home with the homebound senior. Data: In |
$ |
|
Grants to Native Americans: Supportive and Nutrition Services |
||
|
Older Americans Act, Title VI, (42 U.S.C. §3057c) / Administered by HHS-ACL |
Description: Provides for the delivery of supportive and nutrition services comparable to services provided under Title III (i.e., congregate and home-delivered meals) to older Native Americans. Eligibility: Older individuals who are Indians, Alaskan Natives, and Native Hawaiians. Data: In |
$ |
|
Nutrition Services Incentive Program (NSIP) |
||
|
Older Americans Act, Title III, Part A, Section 311 (42 U.S.C. §3030a) / Administered by HHS-ACL |
Description: Provides funds to states, territories, and Indian Tribal Organizations to purchase food or to cover the costs of food commodities provided by USDA for the congregate and home-delivered nutrition programs. Funds are allotted to states and other entities based on each state's share of total meals served during the prior year. Most states choose to receive their share of funds in cash, rather than commodities.a |
$160 |
Source: Prepared by CRS based on FY2017FY2019 Labor-Health and Human Services (HHS)-Education Appropriations acts and accompanying report and explanatory statement language available at the CRS appropriations status table. Program data are from the Administration on Aging, AGing Integrated Database (AGID), https://agid.acl.gov/.
Notes: For more information on programs and funding under the OAA, see CRS Report R43414, Older Americans Act: Background and Overview, by [author name scrubbed] and [author name scrubbed]Overview and Funding.
a. In FY2017FY2018, seven states chose to receive a portion of their share of the nutrition services incentive funds in commodities: Delaware, Idaho, Kansas, Massachusetts, Montana, Nevada, and Oklahoma. The FY2017FY2018 total value for these commodities was $3.17 million (USDA, FNS, 2019 Explanatory Notes, ppp. 32-136161 and 32-162).
Author Contact Information
Acknowledgments
[author name scrubbed], a Research Associate in CRS's Domestic Social Policy division, assisted with updating this report.
|
Area of Expertise |
Name |
Phone |
|
|
USDA-FNS Programs |
[author name scrubbed] |
[phone number scrubbed] |
[email address scrubbed] |
|
HHS-ACL Programs |
[author name scrubbed] |
[phone number scrubbed] |
[email address scrubbed] |
Footnotes
| 1. |
There are additional federal programs that may provide food or meal assistance but these programs fall outside of what is typically considered to be the domestic food assistance programs. For example, while the early childhood education program, Head Start, may provide funds that go, in part, to providing meals, Head Start is not considered a food assistance program and is not included in this discussion. Similarly, emergency disaster relief programs administered by the Department of Homeland Security may in part provide sustenance as part of disaster recovery, but those programs are also not included in this overview. |
|
| 2. |
See, for example, USDA-FNS website, "About FNS," https://www.fns.usda.gov/about-fns. |
|
| 3. |
For further background, see National Research Council, Food Insecurity and Hunger in the United States: An Assessment of the Measure, Washington, DC, 2006, pp. 23-51, https://www.nap.edu/catalog/11578/food-insecurity-and-hunger-in-the-united-states-an-assessment. |
|
|
|
||
|
USDA-ERS website, http://www.ers.usda.gov/topics/food-nutrition-assistance/food-security-in-the-us/measurement.aspx. |
||
|
National Commission on Hunger, Freedom from Hunger: An Achievable Goal for the United States of America, 2015, p. iv. |
||
|
| ||
| 8. | 90022. The percentages shown in this report are estimates, based on a sample. A different randomly drawn sample from the same population would likely produce a slightly different estimate. ERS performed statistical tests to avoid mistaking sampling variability for real differences. A difference between estimates is "statistically significant" if it is large enough that fewer than 10% of all possible survey samples would show a difference of that size, even if there were no real change in the population. |
|
| 9 |
USDA-ERS report defines elderly as 65 years of age or older. |
|
|
This GAO report focused on the 17 programs also covered by this report, as well as the U.S. Department of Homeland Security (DHS) Federal Emergency Management Agency's (FEMA) Emergency Food and Shelter Program (EFSP). U.S. Government Accountability Office, Domestic Food Assistance: Complex System Benefits Millions, but Additional Efforts Could Address Potential Inefficiency and Overlap among Smaller Programs, GAO-10-346, April 2010, pp. 51-53. |
||
| 11. |
To learn more about the funding levels and anomalies for these programs, see CRS Appropriations products: for USDA programs, see CRS Report R44588, Agriculture and Related Agencies: FY2017 Appropriations, coordinated by [author name scrubbed]; for HHS programs, see CRS Report R44478, Status of FY2017 Labor-HHS-Education Appropriations, by [author name scrubbed], [author name scrubbed], and [author name scrubbed]. |
|
| 12. |
For the duration of the CR, Section 116 increases funding for the Commodity Supplemental Food Program. Instead of basing funding for the program on the FY2017 funding level ($236.1 million), this CR provision would use a base of approximately $238.1 million. |
|
|
The Community Food Projects Competitive Grant Program is administered by the USDA's National Institute of Food and Agriculture (NIFA). |
||
|
See also USDA-FNS website, "FNS Regional Offices," http://www.fns.usda.gov/fns-regional-offices. |
||
|
USDA-FNS, State Options Report: Supplemental Nutrition Assistance Program: February 6, 2018 (Options as of October 1, 2016), https://fns-prod.azureedge.net/sites/default/files/snap/13-State_Options-revised.pdf. |
||
|
"Commodity" or "commodities" in the context of food assistance is broader and distinct from the term used to describe corn, wheat, soybeans, etc. in the context of commodity support programs such as described in CRS Report R43448, Farm Commodity Provisions in the 2014 Farm Bill (P.L. 113-79) |
||
|
For more on the procurement of USDA foods, see CRS Report RL34081, Farm and Food Support Under USDA's Section 32 Program |
||
|
USDA-FNS website, "A Short History of SNAP," |
||
|
Gordon W. Gunderson, USDA-FNS website, "The National School Lunch Program: Background and Development," |
||
|
|
||
|
For more information on the Omnibus Farm Bill, please consult CRS In Focus IF10187, Farm Bill Primer: What Is the Farm Bill? |
||
|
|
20See CRS Report R45425, Budget Issues That Shaped the 2018 Farm Bill; compiled using the CBO Baseline by Title (unpublished; April 2018), and the CBO cost estimate of the conference agreement for H.R. 2 (December 11, 2018). |
Table 3 of CBO estimate of H.R. 2642, Agricultural Act of 2014, http://cbo.gov/publication/45049 (January 28, 2014). Using CBO's June 2017 baseline for FY2018-FY2027, CRS tabulates that nutrition title spending is forecasted to be 77% of farm bill spending forecasted for programs. CRS In Focus IF10783, Farm Bill Primer: Budget Issues, by [author name scrubbed]. |
|
The Fresh Fruit and Vegetable Program, described in the table, was passed and financed by the 2008 farm bill. It amended the Russell National School Lunch Act—a statute typically reauthorized elsewhere and in the jurisdiction of the House Education and the Workforce committee. |
||
|
These concepts are discussed in CRS |
||
|
The Older Americans Act (OAA) statute defines "older individual" as an individual aged 60 and older. For more information on programs and funding under the OAA, see CRS Report R43414, Older Americans Act: |
||
|
42 U.S.C. §3030e. |
||
|
The Nutrition Services Incentive Program (NSIP) was originally established by the OAA in 1974 as the Nutrition Program for the Elderly and administered by USDA. Congress transferred the administration of NSIP from USDA to HHS-AOA in 2003. In 2006, pursuant to P.L. 109-365, Congress rescinded states' option to receive commodities. However, in 2007, this option was reinstated through P.L. 110-19 (effective April 23, 2007), which authorized the transfer of NSIP funds from HHS to USDA for the purchase of commodities and related expenses. |
||
|
Most entities choose to receive their share of NSIP funds in cash, rather than commodities. In |
||
|
At the state-level, a State Unit on Aging (SUA) may be referred to as a Department, Office, Bureau, Commission, Council, or Board for older adults, seniors, aging, the elderly, and/or adults with physical disabilities. |
||
|
James Mabli, Nicholas Redel, Rhoda Cohen, et al., "Final Report: Process Evaluation of Older Americans Act Title III-C Nutrition Services Program," Mathematica Policy Research, September 30, 2015, p. 15. |
||
|
Ibid. pp. 43-44. |
||
|
Administration for Community Living, "The Older Americans Act Nutrition Program Did You Know…?" May 2015, at https://www.acl.gov/sites/default/files/programs/2016-11/OAA-Nutrition-Program-FAQ.pdf. |
||
|
For more information about the OAA 2016 Reauthorization see CRS Report R44485, Older Americans Act: 2016 Reauthorization. |