Poverty Among the Population Aged 65 and Older
Changes from July 1, 2019 to April 14, 2021
This page shows textual changes in the document between the two versions indicated in the dates above. Textual matter removed in the later version is indicated with red strikethrough and textual matter added in the later version is indicated with blue.
Poverty Among Americans the Population Aged 65 and
April 14, 2021
Older
Zhe Li
Among the aged population (persons aged 65 and older) in the United States, the poverty rate
Analyst in Social Policy
(the percentage of individuals living in poverty, or economic hardship characterized by low
income) has declined by over two-thirds in the past five decades. In 2019, approximately 8.9% of
Joseph Dalaker
aged individuals had income below the poverty thresholds (dollar amounts used to determine
Analyst in Social Policy
poverty status). However, the number of aged poor has increased since the mid-1970s as the total
number of the aged population has grown. In 2019, 4.9Aged 65 and Older
Contents
- Introduction
- How the Official Poverty Measure Is Computed
- Poverty Status of the Aged
- Poverty Among the Aged by Demographic Characteristics
- Age
- Marital Status
- Race and Hispanic Origin
- Federal Programs for the Aged Poor
- The Supplemental Poverty Measure
- Income Sources' Impact on Poverty of the Aged Per the SPM
- Additional Considerations
- Poverty Not Measured for Certain Populations
- Health Status Not Directly Included in Poverty Measures
Figures
- Figure 1. Number of Individuals Aged 65 and Older Below Poverty and Poverty Rate, 1966-2017
- Figure 2. Poverty Rates, by Age Group: 1966 to 2017
- Figure 3. Poverty Status of Individuals Aged 65 and Older, by Age Group, 1975-2017
- Figure 4. Poverty Status of Individuals Aged 65 and Older in 2017, by Age Groups and Gender
- Figure 5. Poverty Rates of Individuals Aged 80 and Older in 2017, by Living Status
- Figure 6. Poverty Status of Individuals Aged 65 and Older, by Marital Status, 1975-2017
- Figure 7. Poverty Status of Individuals Aged 65 and Older in 2017, by Marital Status and Gender
- Figure 8. Poverty Status of Individuals Aged 65 and Older in 2017, by Marital Status, Gender, and the Presence of Children
- Figure 9. Poverty Status of Individuals Aged 65 and Older, by Race and Hispanic Origin, 1975-2017
- Figure 10. Poverty Status of Individuals Aged 65 and Older in 2017, By Race, Hispanic Origin, and Gender
- Figure 11. The Effects of Resources and Costs on the SPM Poverty Rate for the Population Aged 65 and Older: 2017
Summary
The poverty rate among Americans aged 65 and older has declined by almost 70% in the past five decades. In 2017, approximately 9.2% of Americans aged 65 and older had income below the poverty thresholds. However, the number of aged poor has increased since the mid-1970s as the total number of elderly has grown. In 2017, 4.7 million people aged 65 and older lived in poverty.
The poverty rate for Americans aged 65 and olderthe aged population historically was higher than the rates for younger groups, but the aged have experienced lower poverty rates than children under age 18 since 1974 and lower rates than adults aged 18 to -64 since the early 1990s. In 20172019, the 9.28.9% poverty rate among Americansindividuals aged 65 and older was lower than the 11.29.4% poverty rate among adults aged 18 to -64 and the 17.514.4% poverty rate among children under 18 years old.
Although the poverty rate has generally declined for older Americansthe aged population in most demographic groups, certain subgroups of the aged population still had disproportionately higher poverty rates as of 2019. For example:
aged people still live in poverty. For example,
- People aged 80 and older have a higher poverty rate than other
elderly Americans. In 2017, approximately 11.6aged people. Approximately 11.1% of% ofpeople aged 80 and older lived in poverty, compared with poverty rates of 9.32% among individuals aged 75-79,8.67.4% among those aged 70-74, and7.98.4% among those aged 65-69. Women aged 80 and older had the highest poverty rate amongelderlyolder women and men in all age groups,at 13.5% in 20176% for women aged 80 andolder, and 18.6% for those living alone. Americansolder. Individuals aged 65 and older who weremarried and living together with spousesnot married at the time of the survey generally had alowerhigher poverty rate than those who werenot marriedmarried and living together with spouses. Among women aged 65 and older, about4.3% of14.4% of widows, 15.8% of divorced women, and 16.9% of never-married women had total incomes below the official poverty thresholdin 2017, compared with 13.9% of widows, 15.8% of divorced women, and 21.5% of never-compared with 4.7% of married women. Among individuals aged 65 and older, poverty rates were also high among never-married men, at 22.5% in 2017.- at 18.6%.
Poverty rates vary by race and Hispanic origin. Hispanic origin is distinct from race, and people may
identify with one or more races.
From 1975 to 2017, the poverty rate for Americans aged 65 and older has decreased for those identifying as non-Hispanic white alone, black alone, and Hispanic. In 2017, the poverty rate was lowest among the non-Hispanic white population (5.8% for men and 8.0% for women) and highest among those identifying as black or African American (16.1% for men and 21.5% for women).
The official poverty measureIn 2019, the poverty rate was 18.0% among those identifying as Black or African American compared with 17.1% for those identifying as Hispanics, 9.3% for the Asian population, and 6.8% for the non-Hispanic White population.
The official poverty measure used in the United States is defined using cash income only, before taxes, and wasis computed based on food consumption in 1955 and food costs in 1961, indexed to inflation. That definition prevents the official measure from gauging the effects of noncash benefits, taxes, or tax credits on the low-income population, and it does not consider how certain other costs, such as housing or medical expenses, might affect them as well. After decades of research, the Supplemental Poverty Measure (SPM) was developed to address some of the official poverty measure'’s limitations. The SPM poverty rate for the aged population is higher than the official poverty rate (14.112.8% compared with 9.28.9% in 20172019). This higher poverty rate results largely from higher medical out-of-pocket costs among the aged.
Social Security and Supplemental Security Income (SSI) are the main federally funded programs that provide cash benefits to the aged poor; they. They accounted for almost 90% of total money income received by Americans aged 65 and olderthe aged population whose incomes were below the poverty thresholds in 20172019. The federal government also provides certain noncash benefits to help the elderlyaged poor, such as housing subsidies and the Supplemental Nutrition Assistance Program (SNAP). TheIn 2019, the SPM poverty rate among individuals aged 65 and older would increase by more than 3432 percentage points if Social Security benefits were excluded from their income resources, holding other economic behaviors constant. Among the other resources, eliminating SSI, housing subsidies, or SNAP from income would each increase the SPM poverty rate by about one percentage point.
Introduction
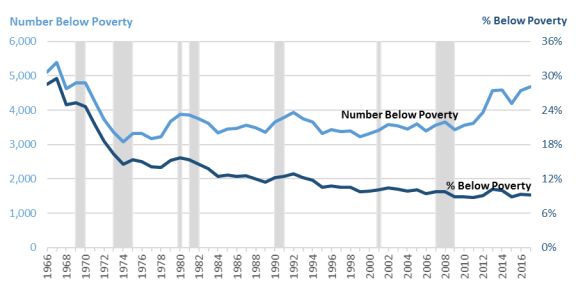
The poverty rate among Americans aged 65 and older has declined by almost 70% in the past five decades. In 2017, 4.7 million people aged 65 and older had income below the federal poverty thresholds. The poverty rate (i.e., the percentage who were in poverty) among the aged fell from 28.5% in 1966 to 9.2% in 2017.1
Several government programs have contributed to older Americans' increased incomes
Congressional Research Service
link to page 5 link to page 6 link to page 7 link to page 10 link to page 10 link to page 13 link to page 16 link to page 18 link to page 21 link to page 23 link to page 24 link to page 24 link to page 25 link to page 8 link to page 8 link to page 9 link to page 11 link to page 12 link to page 12 link to page 13 link to page 14 link to page 15 link to page 15 link to page 16 link to page 16 link to page 17 link to page 17 link to page 18 link to page 18 link to page 24 link to page 24 link to page 19 link to page 19 Poverty Among the Population Aged 65 and Older
Contents
Introduction ................................................................................................................... 1 How the Official Poverty Measure Is Computed .................................................................. 2 Poverty Status of the Aged................................................................................................ 3 Poverty Among the Aged by Demographic Characteristics .................................................... 6
Age ......................................................................................................................... 6
Marital Status ........................................................................................................... 9 Race and Hispanic Origin ......................................................................................... 12
Federal Programs for the Aged Poor................................................................................. 14 The Supplemental Poverty Measure (SPM) ....................................................................... 17
Income Sources’ Impact on Poverty of the Aged per the SPM......................................... 19
Additional Considerations .............................................................................................. 20
Poverty Not Measured for Certain Populations ............................................................. 20 Health Status Not Directly Included in Poverty Measures .............................................. 21
Figures Figure 1. Number of Individuals Aged 65 and Older Below Poverty and Poverty Rate,
1966-2019................................................................................................................... 4
Figure 2. Poverty Rates, by Age Group: 1966-2019 .............................................................. 5 Figure 3. Poverty Status of Individuals Aged 65 and Older, by Age Group, 1975-2019............... 7 Figure 4. Poverty Status of Individuals Aged 65 and Older in 2019, by Age Groups and
Sex ............................................................................................................................ 8
Figure 5. Poverty Rates of Individuals Aged 80 and Older in 2019, by Living Status ................. 9 Figure 6. Poverty Status of Individuals Aged 65 and Older, by Marital Status, 1975-2019 ....... 10 Figure 7. Poverty Status of Individuals Aged 65 and Older in 2019, by Marital Status and
Sex .......................................................................................................................... 11
Figure 8. Poverty Status of Individuals Aged 65 and Older in 2019, by Marital Status,
Sex, and the Presence of Children ................................................................................. 12
Figure 9. Poverty Status of Individuals Aged 65 and Older, by Race and Hispanic Origin,
1975-2019................................................................................................................. 13
Figure 10. Poverty Status of Individuals Aged 65 and Older in 2019, by Race, Hispanic
Origin, and Sex .......................................................................................................... 14
Figure 11. Effects of Resources and Costs on the SPM Poverty Rate for the Population
Aged 65 and Older: 2019............................................................................................. 20
Tables Table 1. Share of Total Money Income from Specified Sources for Poor Individuals Aged
65 and Older, 2019 ..................................................................................................... 15
Congressional Research Service
link to page 25 Poverty Among the Population Aged 65 and Older
Contacts Author Information ....................................................................................................... 21
Congressional Research Service
Poverty Among the Population Aged 65 and Older
Introduction The aged population (persons age 65 and older) has been and continues to be of interest to Congress for various federal policies. Several government programs have contributed to increased
incomes among the aged, including Old Age, Survivor and Disability Insurance (OASDI, commonly known as Social Security) and Supplemental Security Income (SSI).1 However, certain groups of older Americans, the aged population—such as widows, divorced women, and never -married men and women—are stil vulnerable to poverty. In light of those facts, Congress may be interested in
the incidence of poverty among the aged and the effect of existing programs that reduce poverty.2
To address that interest, this report presents time trends and the most recently available poverty rates (percentages of individuals that are in poverty, or economic hardship characterized by low income) among the aged population in the United States both as a whole and by demographic
group.3 This report also discusses how federal programs that may provide assistance to the aged
poor affect estimates of poverty among the aged.
Most of this report wil examine poverty among the aged population using the official measure of
poverty, because it has been in use for over 50 years and provides a consistent time series for examining demographic trends. Analysis of aged poverty in this report is for the time period from 1966 to 2019, before the onset of COVID-19. The poverty rate among the aged has declined by over two-thirds over the past five decades from 28.5% in 1966 to 8.9% in 2019.4 In 2019, 4.9 mil ion aged individuals had incomes below the poverty thresholds (dollar amounts used to
determine poverty status).5
The official measure has some limitations, among them a limited ability to gauge the impact of federal programs on the wel -being of the poor. Researchers inside and outside the government
developed a newer measure, the Supplemental Poverty Measure (SPM), to address the
1 See CRS Report R42035, Social Security Primer; and CRS In Focus IF10482, Supplemental Security Income (SSI). 2 Congress has seen proposals to improve income among vulnerable groups of the older population, such as changing the factors used in the Social Security benefit formula, revising the minimum benefit for long-term low-wage earners, increasing Social Security benefits for certain survivors, increasing the Social Security cost -of-living adjustments, and modifying the SSI program to increase payment amounts by changing income exclusions and resource thresholds. 3 For details on the definition and measurement of poverty, see CRS Report R44780, An Introduction to Poverty Measurem ent.
4 In this report, numbers and percentages of those in poverty are based on the U.S. Census Bureau’s estimates. National-level data in this report are obtained from the Current Population Survey Annual Social and Economic Supplement (CPS ASEC) conducted by t he U.S. Census Bureau. Age is measured at the time of the interview (February, March, or April), but annual income is based on the previous year. While the official poverty measure is often regarded as a statistical yardstick rather than a complete descrip tion of what people and families need to live, it offers a measure of economic hardship faced by the low-income population by comparing family income against a dollar amount called a poverty threshold, a level below which a family is considered to be poor. Research indicates that, due to COVID-19, the nonresponse to the 2020 CPS ASEC increased substantially compared to surveys in prior years. T his nonresponse likely biased income estimates up and poverty statistics down. For more information, see Jonathan Rothbaum and Adam Bee, Coronavirus Infects Surveys, Too: Nonresponse Bias During the Pandem ic in the CPS ASEC, U.S. Census Bureau, September 15, 2020, https://www.census.gov/content/dam/Census/library/working-papers/2020/demo/sehsd-wp2020-10.pdf.
5 T he poverty thresholds vary by family size and composition. For example, in 2019, a single individual under age 65 was considered to be living in poverty if that person’s income was less than $13,300; for an individual 65 and over, $12,261; for a person 65 or older living with one child under 18, $17,555; for an adult (of any age) and two children, $20,598; and for two adults and two children, $25,926. In all, 48 thresholds are used. T hese thresholds do not vary geographically, but they are updated annually for inflation using the Consumer Price Index. For further explanation, see CRS Report R44780, An Introduction to Poverty Measurem ent.
Congressional Research Service
1
Poverty Among the Population Aged 65 and Older
weaknesses of the official measure. Statistics on the aged population using the SPM are presented at the end of this report in order to better il ustrate the impact of federal programs on the aged poor. This report compares official poverty data for the aged population with data from the SPM and women, are still vulnerable to poverty. Congress may be interested in the effect of existing programs that reduce poverty, as well as potential proposals aimed at improving income among vulnerable groups of older Americans.
This report presents the time trends and current status of poverty rates among Americans aged 65 and older, as well as poverty rates among different demographic groups of the aged.2 This report also summarizes federal programs that may provide income to the aged poor.
Over the past several decades, criticisms of the official poverty measure have led to the development of an alternative research measure called the Supplemental Poverty Measure (SPM), which the Census Bureau also computes and releases. This report compares the official aged poverty measure with the SPM and provides statistics measuring the impact of federal cash benefits (mainly Social Security and
SSI), taxes, and in-kind benefits (such as housing, energy, and food assistance) on aged poverty.
While it received scrutiny from the academic and federal research community, the SPM is considered a research measure—it addresses many, but not al , of the limitations of the official measure, and its methodology is refined periodical y to make use of newer data sources and
improved measurement techniques.6
How the Official Poverty Measure Is Computed How the Official Poverty Measure Is Computed
Poverty status is determined by comparing a measure of a family'’s resources against a measure of its needs.3 7 Families whose resources are less than a dollar amount representing an austere level of "needs"
“needs” are considered to be in poverty. However, defining8
Defining resources and needs is not straightforward. The official poverty measure is based on 48 dollar amounts calledcal ed poverty thresholds that vary by family size and composition, but not by geographic area.49 These official thresholds were developed in the 1960s, were based on food consumption in 1955 and food costs in 1961, and are updated annually for inflation. As such, they reflect a level of deprivation based on a restrictive food budget, but are not based on a full measurement of families' and individuals' needs and their associated costs. Family resources are measured in dollars and are based on cash income before taxes. All poverty data presented in this report are estimates based on a survey, and like all using data available at the time and are updated annual y for inflation. Rather than by determining amounts for al major
goods and services a family could possibly need, the thresholds were based on the average amount of a family’s budget that was spent on food. (As of 1955, this was one-third of a family’s budget.) Food costs were represented in the thresholds by a U.S. Department of Agriculture food budget designed for families in economic stress. The entire family budget was the cost of this plan multiplied by three, with some adjustments for couples and individuals. As such, the
thresholds reflect a level of deprivation based on a restrictive food budget and their associated costs but are not based on a full enumeration of al items families and individuals need. Family resources are measured in dollars and are based on cash income before taxes. That is, income from al sources—such as Social Security, earnings, pensions, and other cash benefits—are included in their pre-tax amounts but not the value of noncash benefits such as housing subsidies
or the Supplemental Nutrition Assistance Program (SNAP). Al poverty data presented in this
6 A more thorough description of the SPM methodology may be found in CRS Report R45031, The Supplemental Poverty Measure: Its Core Concepts, Developm ent, and Use.
7 T he CPS ASEC is conducted among the civilian, noninstitutional population of the United States. It does not include residents of prisons or nursing homes or military personnel living on base. According to the National Center for Health Statistics, an estimated 1.4 million persons resided in nursing homes in 2016. Of this number, almost 1.2 million (83%) were aged 65 or older. See Centers for Disease Control and Prevention, National Center for Health Statistics, Vital and Health Statistics, February 2019, T able 9, https://www.cdc.gov/nchs/data/series/sr_03/sr0343-508.pdf. For a thorough discussion of poverty measurement, see CRS Report R44780, An Introduction to Poverty Measurem ent. 8 All members of a family have the same poverty status. For persons not living with family members, poverty status is determined using their own needs and resources as if they were a “one-person family.” 9 T he measure described and used in this report is a statistical measure of poverty —the official poverty thresholds published by the Census Bureau—and is different from another set of dollar figures called poverty guidelines published by the U.S. Department of Health and Human Services. T he poverty guidelines are a simplification of the poverty thresholds, are used for administrative (not statistical) purposes, and are sometimes referred to (somewhat ambiguously) as the federal poverty level. Unlike the official poverty thresholds used by the Census Bureau, the poverty guidelines include separate dollar amounts for Alaska and Hawaii. For details see CRS Report R44780, An Introduction to Poverty Measurem ent.
Congressional Research Service
2
link to page 21 Poverty Among the Population Aged 65 and Older
report are estimates based on a survey, and like al survey estimates, they are subject to sampling
survey estimates, they are subject to sampling and nonsampling error.5
10
The poverty research community has discussed the official poverty measure'’s limitations for
decades. Its use of pretax income renders it unhelpful in gauging tax credits'general y does not al ow for estimating tax credits’ effects on the low-income population. It also does not consider in-kind (noncash) benefits, such as housing subsidies as income, and as a result (e.g., housing subsidies) as income and, as a result, cannot (on its own) illustrateil ustrate such benefits'’ effects on the poor population. Although the measure of need represented by the thresholds is updated every year for overall overal inflation, it may not accurately reflect the current costs of basic needs,needs. This is because
prices for goods and services related to basic needs may not rise at the same rate as prices for luxury itemsthe other items measured in the Consumer Price Index—the tool used to adjust the official poverty thresholds for inflation. Since the official measure'’s initial development, new data sources have offered more detail on the goods and services families consume, but developing an approach that defines basic needs and determines available resources for families to spend on those needs has taken decades of research and discussion. The SPM resulted from that research, and is described
briefly in the section, " “The Supplemental Poverty Measure."6
.”11
Poverty Status of the Aged Notwithstanding the official measure'poverty measure’s limitations, for more than 50 years, it has provided a consistent measure of poverty in the United States, with few methodological changes over that time, and it is based on empirical measures of need (food budgets and food
consumption, albeit in 1961 and 1955, respectively)7..12 For these reasons, trends for the aged
population based on the official measure are discussed below.
Poverty Status of the Aged
throughout the rest of the report.
The proportion of Americans aged 65 and olderthe aged population who lived in poverty has declined significantly in the past
50 years. In 1966, 28.5% of Americansindividuals aged 65 and older had family incomes below the poverty thresholds.8 By 2017, the poverty rate among older Americans had dropped to 9.2
10 Estimates computed using different survey samples will likely differ from one another and from the “true” population value, even when the samples are drawn from the same population. T he margin of error is a measure of an estimate’s variability due to sampling. T he larger the margin of error is in relation to the size of the estimate, the less reliable is the estimate. T he Census Bureau’s estimates from the Current Population Survey (CPS), like estimates from other surveys, likely contain nonsampling error—error due to causes other than the fact that a sample was used in place of the entire population (for instance, respondents misremembering or misreporting income amounts, respondents failing to answer the questionnaire, or errors during t he processing of the data file). For example, some researchers have expressed concerns that the CPS ASEC records may underreport pension income to a certain extent, particularly income from periodic (irregular) distributions from defined contribution plans and individual retirement accounts. See Adam Bee and Joshua Mitchell, Do Older Am ericans Have More Incom e Than We Think? U.S. Census Bureau, July 2017, https://www.census.gov/content/dam/Census/library/working-papers/2017/demo/SEHSD-WP2017-39.pdf; and Anqi Chen, Alicia H. Munnell, and Geoffrey T . Sanzenbacher, How Much Incom e Do Retirees Actually Have? Evaluating the Evidence from Five National Datasets, Center for Retirement Research, November 2018, http://crr.bc.edu/working-papers/how-much-income-do-retirees-actually-have-evaluating-the-evidence-from-five-national-datasets/. 11 A more comprehensive discussion of how the SPM differs from the official poverty measure is available in CRS Report R45031, The Supplem ental Poverty Measure: Its Core Concepts, Developm ent, and Use .
12 T he use of 1961 food budgets as the basis of the official poverty measure was documented in Betty Peterkin, The Measure of Poverty: Food Plans for Poverty Measurem ent, T echnical Paper XII, Department of Health, Education, and Welfare, 1976, p. 1, https://www.census.gov/content/census/en/library/publications/1976/demo/measure-of-poverty.html. Documentation of Mollie Orshansky’s use of the 1955 Household Food Consumption Survey is available in Gordon Fisher, The Developm ent of the Orshansky Poverty Thresholds and Their Subsequent History as the Official U.S. Poverty Measure, U.S. Census Bureau, September 1997, https://www.census.gov/library/working-papers/1997/demo/fisher-02.html.
Congressional Research Service
3
link to page 8
Poverty Among the Population Aged 65 and Older
thresholds.13 By 2019, the poverty rate among the aged population had dropped to 8.9% (see Figure 1). One study suggests that increased Social Security retirement benefits explained most of the decline in poverty among the aged that occurred during 1967-2000.14 . However, whereas the proportion of persons aged 65 and older who live in poverty has fallenfal en over the past five decades, the number of aged poor has increased since the mid-1970s as the total number of elderly peoplethe aged population has grown. In 1974, 3.1 millionmil ion people aged 65 and older had income below the federal poverty thresholds, lived in poverty,
whereas in 2017, 4.7 million2019, 4.9 mil ion people aged 65 and older had income below the thresholds.
lived in poverty. This is partly because many persons in the large cohort of baby boomers (people born between 1946 and 1964) have
moved into the 65+ age category and people are living longer than before, on average.15
Figure 1. Number of Individuals Aged 65 and Older Below Poverty and Poverty Rate,
|
 |
. Notes: The Census Bureau implemented |
The poverty rate for Americans aged 65 and older historicallyDue to COVID-19,
13 A family is defined in the CPS as a group of two people or more related by birt h, marriage, or adoption and residing together. Fam ily incom e in the CPS is the sum of income for all family members. T he person’s income is counted as family income if the person is living alone. 14 Gary V. Engelhardt and Jonathan Gruber, Social Security and the Evolution of Elderly Poverty, National Bureau of Economic Research (NBER), Working Paper no. 10466, May 2004, https://www.nber.org/papers/w10466. T he study showed that the aged poverty rate declined rapidly as the Social Security program expenditures per capita grew quickly in the 1960s and 1970s and then declined more slowly as program growth slowed in the 1980s and 1990s.
15 T he average remaining life expectancy at age 65 of Americans born in 1975 was 13.7 years for men and 18.0 years for women. It has been estimated that those born in 20 19 will live for an average of 18.1 years after age 65 for men and 20.6 years for women. See Social Security Board of T rustees, The 2020 Annual Report of the Board of Trustees of the Federal Old-Age and Survivors Insurance and Federal Disability Insurance Trust Funds, 2020, T able V.A4, https://www.ssa.gov/OACT /T R/2020/index.html.
Congressional Research Service
4
link to page 9
Poverty Among the Population Aged 65 and Older
the nonresponse to the 2020 CPS ASEC (regarding 2019 poverty status) increased substantial y compared to surveys in prior years. This nonresponse likely biased income estimates up and poverty statistics down.
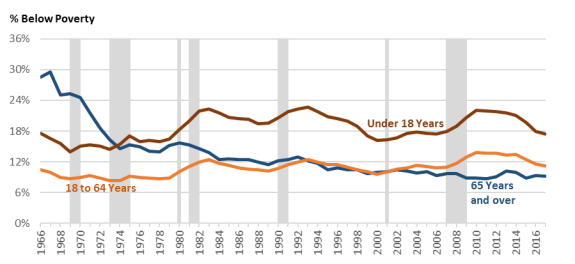
The poverty rate for individuals aged 65 and older historical y was higher than the rates for adults aged 18 to 64 and children under the age of 18, but today it is the lowest among those three age groups.9
groups.16 (See Figure 2.) For example:
In 1966, the poverty rate among persons aged 65 and older was 28.5%, compared
with 10.5% among adults aged 18 to -64 and 17.6% among children under the age of 18.
In 1974, the aged poverty rate fell fel below the rate among children under the age of
18, and by the early 1990s, the aged poverty rate had fallenfal en below the rate among adults aged 18 to -64. The elderlyaged poverty rate has remained lower than the nonelderly adult poverty ratepoverty rate for adults aged 18-64 since that time.
The poverty rate among Americansindividuals aged 65 and older was 9.28.9% in 20172019, which
was lower than the 11.29.4% poverty rate among adults aged 18 to -64 and the 17.5% 14.4% poverty rate among children under 18 years old (see Figure 2).10
Poverty Among the Aged by Demographic Characteristics
Poverty status among Americans aged 65 and older generallyDue to COVID-19, the nonresponse to the 2020 CPS ASEC (regarding 2019 poverty status) increased substantial y compared to surveys in prior years. This nonresponse likely biased income estimates up and poverty statistics down.
Poverty Among the Aged by Demographic Characteristics Poverty status among the aged population general y varies across different demographic groups. This section describes the aged population'’s poverty status for selected demographic
characteristics based on age groups, gendersex, marital status, and race and Hispanic origin.
Age
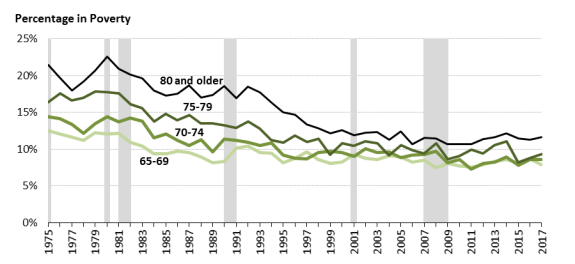
People aged 80 and older
Age The poverty rate for al age groups among the older population general y declined in the past four decades. People aged 80 and older, however, have a higher poverty rate than older Americans aged individuals under the age of 80. Figure 3 displays the percentage of Americans aged 65 and olderthe aged population who were in poverty by age groups from 1975 to 20172019. In 1975, the poverty rate among individuals who were in the oldest age group (80 and older) was 21.5%, compared with 16.4% among Americansthose aged 75-79,
14.4% among those aged 70-74, and 12.5% among those aged 65-69. Poverty rates declined over the past 40 years, and in 20172019, approximately 11.61% of people aged 80 and older lived in poverty (a 10 percentage- point reduction from 1975), but the share was still stil higher than the 9.32% poverty rate among individuals aged 75-79, 8.67.4% among those aged 70-74, and 7.98.4% among those aged 65-69.1118 Individuals aged 80 and older might be more vulnerable to income risks because they are more likely to have lower or no earnings (as they phase out of the labor force),12 exhaust existing 19 exhaust existing
18 Some legislative proposals have been introduced to increase income for those very old people (e.g., those aged 80 and older). For example, the Social Security Enhancement and Protection Act of 2019 (H.R. 5392, 116th Congress) included a provision to provide additional benefits to certain very old or long-term Social Security beneficiaries.
19 In 2019, about 7% of individuals aged 80 and older had some earnings, com pared with 28% of individuals aged 65-79. In the same year, the median earnings among those with any earnings was $24,440 for individuals aged 80 and older, compared with $35,000 for those aged 65 -79. Data are based on CRS analysis of the 2020 CPS ASEC.
Congressional Research Service
6
link to page 12
Poverty Among the Population Aged 65 and Older
retirement resources,20retirement resources,13 have reduced purchasing power in certain defined benefit pensions,1421 and
incur higher medical expenses.15
22
Figure 3. Poverty Status of Individuals Aged 65 and Older, by Age Group, 1975-
|
 |
Source: CRS analysis of data from . Notes: The Census Bureau implemented |
Due to COVID-19, the nonresponse to the 2020 CPS ASEC (regarding 2019 poverty status) increased substantial y compared to surveys in prior years. This nonresponse likely biased income estimates up and poverty statistics down.
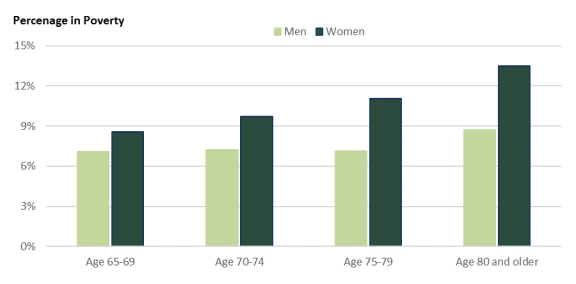
Women aged 80 and older had the highest poverty rate among elderlyolder women and men in all al age groups (seesee Figure 4). In 19752019, the poverty rate amongof women aged 80 and older was 25.1%, declined to 13.6%,
compared with 15.27.6% among men in the same age group and 14.99.3% among women aged 65-69.
20 In 2019, about 35% of households headed by those aged 80 and older had some retirement assets, compared with 49% of households headed by those aged 65-79. T he median retirement asset level among households with any assets was $62,000 for households headed by those aged 80 and older, compared with $146,000 for households headed by those aged 65-79. Data are based on CRS analysis of the 2019 Survey of Consumer Finances, which includes the following tax-advantaged accounts in retirement assets: defined contribution plans and Individual Retirement Account s, Profit Sharing Plan, Supplementary Retirement Annuity, Cash Balance Plan, Portable Cash Option Plan, and etc. For more information, see Federal Reserve, “ Codebook for 2019 Survey of Consumer Finances,” https://www.federalreserve.gov/econres/files/codebk2019.txt ; and Federal Reserve, “ Macro-Variable Definitions,” https://www.federalreserve.gov/econres/files/bulletin.macro.txt .
21 A cost-of-living adjustment to mitigate the effects of inflation is provided in Social Security but is not provided in many defined benefit pensions. In defined benefit pensions where the benefits are not adjusted regularly by the cost of living, the purchasing power of periodic benefit payments will be eroded over time. 22 T he average amount of personal health care spending was $32,903 for individuals aged 85 and older in 2014, compared with $16,977 for those aged 65-84. See Department of Health and Human Services, Centers for Medicare and Medicaid Services, NHE Fact Sheet, 2019, T able 7, https://www.cms.gov/Research-Statistics-Data-and-Systems/Statistics-T rends-and-Reports/NationalHealthExpendData/NHE-Fact-Sheet .
Congressional Research Service
7
link to page 13 link to page 13 link to page 13
Poverty Among the Population Aged 65 and Older
In 2017, the poverty rate of women aged 80 and older declined to 13.5%, compared with 8.7% among men in the same age group and 8.6% among women aged 65-69.
Figure 4. Poverty Status of Individuals Aged 65 and Older in |
 |
Source: CRS analysis of data from |
the 2020 CPS ASEC. Note: Due to COVID-19, the nonresponse to the 2020 CPS ASEC (regarding 2019 poverty status) increased substantial y compared to surveys in prior years. This nonresponse likely biased income estimates up and poverty statistics down.
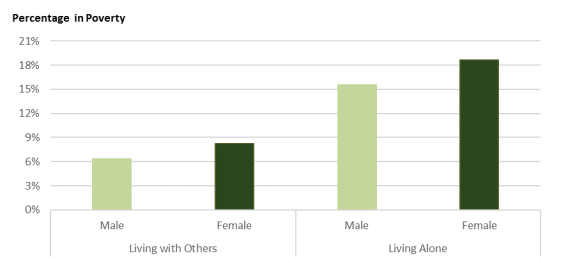
Poverty status among individuals aged 80 and older varies depending on whether the person is living living with other family members. or nonrelatives.23 Poverty rates for those living with other family members in 2017 were less than
people in 2019 were about half the rates for those living alone. In 20172019, the poverty rate for men aged 80 and older was 6.34% if they lived with other family members, and 15.5others and 11.2% if they lived alone (seesee Figure 5). In the same year, the poverty rate for women aged 80 and older was about 8.26% if they lived
with others and 18.9% if they lived alone.
23 Among the aged population, individuals younger than age 80 who lived with family members were more likely to be married and living with spouses than those aged 80 and older. In 2019, about 81.8% of individuals aged 65 -79 who lived with other family members or nonrelatives were married and living together with spouses, compare d with 69.5% of individuals aged 80 and older. Because of the correlation between living arrangement and marital st atus for the population aged 65-79, this report discusses poverty for this age group based on marital status only. For more information, see the section “ Marital Status.”
Congressional Research Service
8
link to page 14
Poverty Among the Population Aged 65 and Older
% if they lived with other family members and 18.6% if they lived alone.
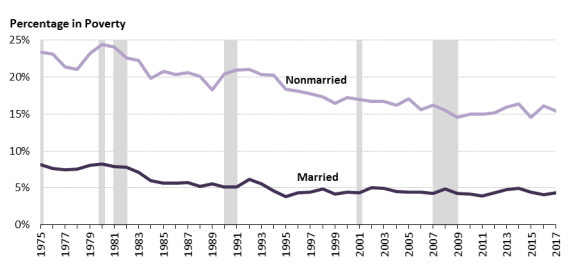
Marital Status
Americans aged 65 and older who were married and living together at the time of the survey generallygeneral y had a lower poverty rate than those who were not married (see Figure 6).16, including those widowed, divorced, never married, separated, or married but living apart (see Figure 6).24 In 1975, about 53.0% of individuals aged 65 and older were married and living together, and this percentage was slightly higher at 56.8% in 20172019. Approximately 8.2% of married Americanspersons aged 65 and older and living living together had family incomes below the federal poverty threshold in 1975, and this rate
declined to 4.45% in 20172019. During the same period, the poverty rate among aged nonmarried Americans
persons decreased from 23.4% to 15.5%.
(Shaded bars indicate recessions.) |
 |
. Notes: Married individuals are those married |
Due to COVID-19, the nonresponse to the 2020 CPS ASEC increased substantial y compared to surveys in prior years. This nonresponse likely biased 2019 income estimates up and poverty statistics down.
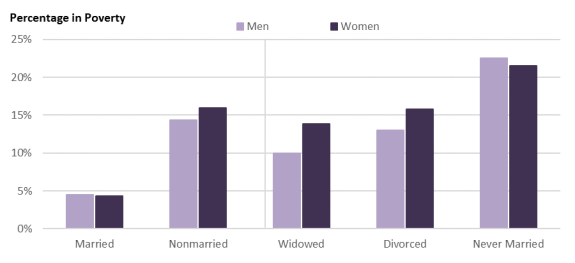
Figure 7 shows the poverty rate in 2017 by gender2019 by sex and marital status at the survey time. Married couples generally have significantly lower poverty rates than nonmarried individuals, and widowed and divorced women aged 65 or older are more likely to be in poverty than their male counterparts. Among women aged 65 and older, about 4.37% of married women (and living together with the spouse) had total incomes below the official poverty threshold in 2017, 2019, compared with 13.914.4% of widows, 15.8% of divorced women, and 21.516.9% of never-married women.17
women.25 In contrast with the widowed and divorced men in this age group, who are less likely to be poor than widowed and divorced women, poverty rates are also high among never-married
menmen, at a rate of 22.5% in 2017.
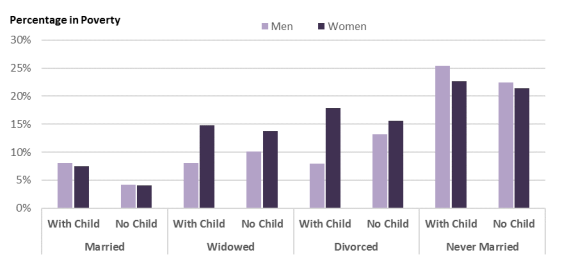
In 2017, roughly 10% of individuals aged 65 and older lived in families with children under 18 years old. Poverty rates among aged men and women varied by the presence of children in the family (see Figure 8), although not always in the same direction. Among married men and women, a relatively higher share of those with children lived in poverty (8.0% for men and 7.5% for women) than those without any child (4.2% for men and 4.1% for women). Similarly, among never-married individuals, those with children also had higher poverty rates (25.4% for men and 22.7% for women) than those without children (22.4% for men and 21.4% for women). However, while widows and divorced women with children had higher poverty rates (14.8% and 17.9%, respectively) than those without children (13.8% and 15.6%, respectively), among men the pattern was reversed: 8.1% of widowers with children and 7.9% of divorced men with children were in poverty, lower than their childless counterparts (10.1% and 13.2%, respectively).
|
 |
Source: CRS analysis of data from the U.S. Census Bureau, 2018 CPS ASEC.
|
Race and Hispanic Origin18
Poverty rates vary by race and Hispanic origin, as shown inin Figure 9. In surveys, Hispanic origin is asked separately from race; accordingly. Accordingly, persons identifying as Hispanic may be of any race. The poverty rate for Americans aged 65 and olderthe aged population has decreased among persons identifying as blackBlack or
or African American alone, non-Hispanic whiteWhite alone, and Hispanic from 1975 to 20172019. Among aged African Americans, the poverty rate decreased from 36.3% in 1975 to 19.318.0% in 2017; 2019; among the aged non-Hispanic whiteWhite population, from 13.0% to 7.06.8%; and among the aged Hispanic population, from 27.732.6% to 17.01%. During the period for which data are available (since
32 Since 2002, federal surveys have asked respondents to identify with one or more races. Previously they could choose only one. T he groups in this section represent those who identified with one race alone. Another approach is to include those who selected each race group either alone or in combination with one or more other races. T hose data are also available in Jessica Semega et al., Incom e and Poverty in the United States: 2019 , Census Bureau, September 15, 2020, https://www.census.gov/library/publications/2020/demo/p60-270.html, in Appendix B and accompanying historical data tables.
Congressional Research Service
12
link to page 17
Poverty Among the Population Aged 65 and Older
1987)%. During the period for which data are available, the poverty rate for the aged Asian population ranged between 10.07.4% and 16.07% with no
consistent directional trend.19
33
Figure 9. Poverty Status of Individuals Aged 65 and Older, by Race and
|
 |
Source: U.S. Census Bureau, 1976- . Notes: People of Hispanic origin may be of any race. |
As shown in Figure 10, among the racial and Hispanic origin groups, in 2017 Due to COVID-19, the nonresponse to the 2020 CPS ASEC increased substantial y compared to surveys in prior years. This nonresponse likely biased 2019 income estimates up and poverty statistics down.
33 Margins of error tend to be larger for smaller demographic groups, and the Asian population is smaller than the other demographic groups shown. T he larger margins of error help to explain why the line for the Asian population is less smooth than for the other demographic groups: T he estimates are affected by sampling variability to a greater degree than for the other groups. Estimates for the American Indian and Alaska Native population, the Native Hawaiian and Other Pacific Islander population, and the population identifying with two or more races are not sho wn because the CPS ASEC sample size is not large enough to produce reliable estimates for these groups. Estimates for poverty rates by race and Hispanic origin are also available based on the American Community Survey (ACS), which is conducted by the Census Bureau for a much larger sample size. (About 3.5 million addresses are sampled every year.) In 2019, the proportion of individuals who lived in poverty was about 7.2% for the aged non -Hispanic White population, 17.6% for the aged Black or African American alone population, 12.6% for the aged Asian alone population, 17.7% for the aged population identifying as Hispanic or Latino, 16.4% for the aged American Indian and Alaska Native population, 11.9% for the aged Native Hawaiian and Other Pacific Islander p opulation, and 12.5% for the aged population identifying with two or more races. ACS estimates are not available for the period shown in Figure 9 because it is a newer survey. For more information about the ACS, see Census Bureau, “American Community Survey,” https://www.census.gov/programs-surveys/acs.
Congressional Research Service
13
link to page 18 link to page 19
Poverty Among the Population Aged 65 and Older
As shown in Figure 10, among the racial and Hispanic origin groups, in 2019, the poverty rate was lowest among the aged non-Hispanic whiteWhite population (5.84% for men and 8.07.9% for women)
and highest among the aged blackBlack population (16.114.9% for men and 21.520.2% for women).
% for women).
Federal Programs for the Aged Poor
Social Security and Supplemental Security Income (SSI) are the two main federal programs that provide cash benefits to the aged poor. Social Security is a federal social insurance program that
provides benefits to insured workers and their eligible family members, provided the workers worked in jobs covered by Social Security for a sufficient number of years and meet certain other criteria.34 SSI is a federal assistance program that provides monthly cash benefits to aged, blind, and disabled individuals who have limited income and assets.35 In 2019provide cash benefits to the aged poor. In 2017, Social Security accounted for 78.376.9% of total money income among aged individuals whose family incomes were
below 100% of the poverty threshold and 81.380.8% among those with family incomes below 125% of the poverty threshold (seesee Table 1).2036 In the same year, SSI and other cash public assistance accounted for 11.09.8% of the total money income for aged individuals whose family incomes were
34 See CRS Report R42035, Social Security Primer. 35 See CRS In Focus IF10482, Supplemental Security Income (SSI). 36 Some studies find that the CPS ASEC underreported income from pensions (including retirement saving accounts) and assets. T hus the share of total money income from Social Security might be overestimated. See Bee and Mitchell, Do Older Am ericans Have More Incom e Than We Think?; and Chen, Munnell, and Sanzenbacher, How Much Incom e Do Retirees Actually Have?
Congressional Research Service
14
link to page 19 link to page 19 link to page 20 Poverty Among the Population Aged 65 and Older
% of the total money income for aged individuals whose family incomes were below 100% of the poverty threshold21 and 7.6threshold37 and 6.3% for those with family incomes below 125% of
the poverty threshold.22
38
Table 1. Share of Total Money Income from Specified Sources for Poor Individuals
Aged 65 and Older, 2019
Aged 65 and Older, 2017
| Below 100% of the Poverty
Below 125% of the Poverty
Thresholda
Thresholdb
Total Percentage
100.0%
100.0%
Percentage of Income from—
Earnings
4.3%
5.4%
Social Security
76.9%
80.8%
Pensions
4.0%
2.9%
Asset Income
2.3%
2.1%
SSI and Other Public Assistance
9.8%
6.3%
Other Income
2.6%
2.5%
Number of Observationsc
2,404
3,575
Population (thousands)
4,858
7,285
Source: CRS analysis of data from the 2020 CPS ASEC. Notes: Al | |
|
Total Percentage |
100.0% |
100.0% |
|
Percentage of Income from— |
||
|
Earnings |
3.8% |
4.1% |
|
Social Security |
78.3% |
81.3% |
|
Pensions |
2.8% |
2.9% |
|
Asset Income |
2.1% |
2.1% |
|
SSI and Other Public Assistance |
11.0% |
7.6% |
|
Other Income |
1.8% |
2.1% |
|
2,544 |
3,906 |
|
Population (thousands) |
4,681 |
7,179 |
Source: Congressional Research Service (CRS) analysis of data from the U.S. Census Bureau, 2018 CPS ASEC.
Notes: All values displayed in the table have been adjusted for population weights provided by the CPS. The CPS ASEC was designed to collect col ect information on money income received on a regular basis. Money income is measured measured on a pre-tax basis and does not include noncash benefits and transfers. Earnings are the sum of income from wages and salaries and net income from self-employment. Social Security includes retired-worker benefits, dependents'dependents’ or survivor benefits, and disability benefits. Pensions include Railroad Retirement income, government employee pensions, and private pensions or annuities. Lump-sum or irregular distributions from retirement retirement saving accounts (employer-sponsored defined contribution plans and Individual Retirement Accounts [IRAs]) individual retirement accounts) may not be properly captured in the survey. Asset income includes income from interest, dividends, rent, royalties, and estates and trusts. Other public assistance includes cash public assistance payments to people with low income, such as Temporary Assistance for Needy Families (TANF), , general assistance, and emergency assistance. Other income includeincludes worker's ’s compensation, unemployment insurance, alimony, child support, and financial assistance from friends and relatives.
a. The official poverty thresholds in 2017 were $11,756 for single elderly persons and $14,816 for elderly couples with no children. In larger families, thresholds are not distinguished by the householder's age; persons 65 and older in larger families use the same thresholds as young families. For all Due to COVID-19, the nonresponse to the 2020 CPS ASEC increased substantial y compared to surveys in prior years. This nonresponse likely biased income estimates up and poverty statistics down. a. The official poverty thresholds in 2019 were $12,261 for single individuals aged 65 and older and $15,453
for couples aged 65 and older with no children. In larger families, thresholds are not distinguished by the householder’s age: Persons 65 and older in larger families use the same thresholds as young families. For al 48 poverty thresholds see https://www2Census Bureau, “Poverty Thresholds,” https://www.census.gov/data/.census.gov/programs-surveys/cps/tables/time-series/demo/income-poverty/historica l-poverty-thresholds.html.
b. The dol arseries/historical-poverty-thresholds/thresh17.xls.
b. The dollar amounts representing 125% of the poverty threshold are the poverty thresholds multiplied by
1.25. For example, in 2017 in 2019, for a single person aged 65 or older not living in a family, $14,695 $15,327 was 125% of the poverty level. More people fall fal below 125% of poverty than below 100% of poverty because the income cutoff is higher.
37 Based on the reported information in the 2020 CPS ASEC, SSI accounted for 96% of total cash public assistance received by individuals aged 65 and older. Other public assistance includes cash public assistance payments to people with low income, such as T emporary Assistance for Needy Families, general assistance, and emergency assistance.
38 Some research has shown that survey respondents at the bottom of the income distribution frequently confuse cutoff is higher.
c. The number of observations is the number of individuals in the survey.
Social Security with SSI such that SSI plays a larger role among the low-income aged population than the survey suggests. See Bee and Mitchell, Do Older Am ericans Have More Incom e Than We Think?
Congressional Research Service
15
Poverty Among the Population Aged 65 and Older
c. The number of observations is the number of individuals in the survey who are age 65 or older and below
the poverty cutoff shown.
Security is a federal social insurance program that provides benefits to insured workers and their eligible family members, provided the workers worked in jobs covered by Social Security for a sufficient number of years and meet certain other criteria.23 Social Security is not designed solely for the poor, but benefits are weighted to replace a greater
share of career-average earnings for low-paid workers than for high-paid workers. One study suggests that increased Social Security benefits explained most of the decline in poverty among the aged that occurred during 1967 to 2000 (see Figure 1).24
Social Security benefits alone, however, would not be sufficient to eliminate poverty for a large number of older Americans. The poverty rate among Social Security beneficiaries aged 65 and older was 6.58% in 2019.39% in 2017.25 Although the Social Security program contains a special minimum benefit provision that increases benefits to workers who have many years of low earnings and
meet certain other criteria, this provision has virtuallyvirtual y no effect on the benefits paid to today's ’s new retirees.2640 According to the Census Bureau'’s analysis, 30.0% of Americans aged 65 and older in 2019, 35.8% of the aged population would live in poverty without Social Security benefits, holding other resources and expenses constant.27
SSI is a federal assistance program that provides monthly cash benefits to aged, blind, and disabled individuals who have limited income and assets. The program
constant.41
SSI is intended to provide a minimum level of income to adults who have difficulty meeting their basic living expenses due to age or disability and who have little or no Social Security or other income.2842 Some studies show that the SSI program does not provide effective income protection for the oldest Americans. For example, the maximum SSI benefit in 20172019 was 75% of the poverty
threshold for an elderlya single person and 89aged 65 and older and 90% of the poverty threshold for an elderly married couple.29a married couple aged 65 and older.43 Thus, aged SSI recipients may still stil be impoverished. Furthermore, the maximum SSI benefit is more generous for married couples, who are less likely to need
assistance than elderly single individuals. Some researchers also suggest that restructuring the Social Security special minimum benefit provision could be more effective in alleviating poverty than making certain reforms to the SSI program, although a combination of reforms to both programs could be useful if regular Social Security benefits are greatly reduced in the future.30
The federal government also provides certain noncash benefits to help the elderly poor, such as housing subsidies and Supplemental Nutrition Assistance Program (SNAP) benefits.31 Congress funds housing subsidy programs, ranging from public housing to government subsidies to renters, to help poor and vulnerable populations meet their housing needs.32 SNAP is designed primarily to increase the food purchasing power of eligible low-income households to help them buy a nutritionally adequate low-cost diet.33
Individuals aged 65 and older may also receive a small portion of income from some other federal programs, including refundable tax credits, school meals, Temporary Assistance for Needy Families (TANF), the Low Income Home Energy Assistance Program (LIHEAP), unemployment insurance, workers' compensation, and the Special Supplemental Nutrition Program for Women, Infants and Children (WIC). 34 The official poverty measure is of limited value for analyzing various federal programs' effects on poverty status among the aged population, but the Supplemental Poverty Measure (SPM), discussed in the following section, addresses some of those impacts.
The Supplemental Poverty Measure
The official poverty measure was developed in the 1960s and was established by the Bureau of the Budget (later the Office of Management and Budget, OMB) for measuring the official poverty rate in the United States.35 Under the official poverty measure, an individual is counted as poor if his or her family's pretax money income falls below the poverty threshold. One of the main criticisms of the official poverty measure is that pretax money income excludes the value of government noncash benefits (such as health insurance, SNAP, or housing assistance) provided either privately or publicly.36 It also does not consider taxes paid to federal, state, or local governments, or tax benefits (such as the Earned Income Tax Credit) that families might receive.37
The Census Bureau's SPM was designed to address the official poverty measure's limitations and has been published since 2011.38 The SPM poverty thresholds measure a standard of living based on expenditures for food, clothing, shelter, and utilities (FCSU) and "a little more" for other expenses.39 Its thresholds—dollar amounts related to the level of need for a family—vary by whether the family rents, owns a home with a mortgage, or owns a home without a mortgage (the latter of which is more common among the aged population than it is among younger populations). It computes the amount of resources available after taxes, includes the values of noncash benefits, and subtracts some expenses (such as work-related expenses and medical out-of-pocket expenses, the latter of which tend to be higher among the aged than among younger populations).
In 2017, the most recent data available, the SPM poverty rate for persons aged 65 and older was 14.1% in 2017,40 compared with 9.2% using the official poverty measure.41 This higher poverty rate results largely from higher medical out-of-pocket costs among the aged, in spite of lower housing expenses among the aged, who are more likely to have paid off their mortgages.
Income Sources' Impact on Poverty of the Aged Per the SPM
The data presented in Figure 11 illustrate how changing the definition of the SPM to exclude a particular resource or expenditure can affect the SPM poverty rate among Americans aged 65 and older. The data do not consider the behavioral effects that may occur if the resource or cost were to be eliminated in reality.
Social Security has the greatest effect, by far, on the poverty status of the aged population. Removing Social Security as a resource while holding the other resources and expenditures constant would increase the SPM aged poverty rate by more than 34.6%. Among the other resources, SSI, housing subsidies, and SNAP had the next-largest impacts on the SPM poverty rate, but were a full order of magnitude smaller (around a single percentage point instead of tens of percentage points). The remaining resources affected the SPM poverty rate by much less than one percentage point. Three of the resources shown are related to child rearing (child support, school lunch, and WIC), and tax credits are often targeted to families with children. Households headed by people aged 65 and older are less likely than nonelderly households to have children present in the family.42
Among the expenses considered in the SPM but not considered in the official measure, medical out-of-pocket costs had the largest effect: deducting those costs from family income raised the SPM poverty rate by 5.4%. Given that the aged population tends to have greater medical need and higher out-of-pocket health care costs than younger populations,43 it is perhaps not surprising that medical costs had a larger effect than the other costs shown in the figure. The remaining costs were largely related to work, and, congruent with the aged population's lower likelihood to be working compared with younger populations,44 these costs affected the aged population's SPM poverty rate by less than one percentage point.
(Poverty rates [in percentages] that would result if the SPM were computed without including the element labeled at left. Each element's numerical contribution to the SPM poverty rate is shown without considering any behavioral changes that may result from its removal as an actual cost or resource.) |
 |
|
Additional Considerations
Poverty Not Measured for Certain Populations
Approximately 1.2 million persons in nursing homes are aged 65 or older.45 Poverty status is not measured for the institutionalized population, which includes persons in nursing homes, prisons, or military personnel living on base. This exclusion is not trivial considering that the population in nursing homes is about one-fourth as large as the 4.7 million persons aged 65 or older who were in poverty in 2017.46
Health Status Not Directly Included in Poverty Measures
Poverty is used as a measure of well-being, but it measures only economic well-being and does not directly include a person's health status. Health status may influence the amount and types of income a person receives (by affecting, for example, ability to work or receive disability benefits) and is thus considered indirectly.47 However, the noneconomic aspect of well-being that comes from good health is not considered in the poverty measures discussed in this report. Furthermore, in the SPM, medical out-of-pocket expenses are considered, but the overall value of health insurance programs to the individual, which may well exceed out-of-pocket costs for medical care or insurance premiums, is not. Considering that Medicaid is an important vehicle for long-term care, the benefits Medicaid provides to the aged population could be characterized as fulfilling needs that are not solely medical in nature, but have economic value as well.
Author Contact Information
Footnotes
| 1. |
In this report, numbers and percentages of those in poverty are based on the Census Bureau's estimates. National-level data in this report are obtained from the Current Population Survey Annual Social and Economic Supplement (CPS ASEC) conducted by the U.S. Census Bureau. Age is measured at the time of the interview (February, March, or April) but annual income is based on the previous year. While the official poverty measure is often regarded as a statistical yardstick rather than a complete description of what people and families need to live, it offers a measure of economic hardship faced by the low-income population by comparing family income against a dollar amount called a poverty threshold, a level below which a family is considered to be poor. |
| 2. |
This report may use "aged" and "elderly" interchangeably to refer to people aged 65 and older. |
| 3. |
The CPS ASEC is conducted among the civilian, noninstitutional population of the United States. It does not include residents of prisons, nursing homes, or military personnel living on base. According to the National Center for Health Statistics, an estimated 1.4 million persons resided in nursing homes in 2014. Of this number, almost 1.2 million (85%) were aged 65 or older. For a thorough discussion of poverty measurement, see CRS Report R44780, An Introduction to Poverty Measurement. |
| 4. |
The measure described and used in this report is a statistical measure of poverty—the official poverty thresholds published by the Census Bureau—and is different from another set of dollar figures called poverty guidelines published by the U.S. Department of Health and Human Services. The poverty guidelines are a simplification of the poverty thresholds, are used for administrative, not statistical, purposes, and are sometimes referred to (somewhat ambiguously) as the federal poverty level. Unlike the official poverty thresholds used by the Census Bureau, the poverty guidelines include separate dollar amounts for Alaska and Hawaii. For details see CRS Report R44780, An Introduction to Poverty Measurement. |
| 5. |
|
| 6. |
A more comprehensive discussion of how the Supplemental Poverty Measure (SPM) differs from the official poverty measure is available in CRS Report R45031, The Supplemental Poverty Measure: Its Core Concepts, Development, and Use. |
| 7. |
The use of 1961 food budgets as the basis of the official poverty measure was documented in The Measure of Poverty (Department of Health, Education, and Welfare, 1976) Technical Paper XII (Betty Peterkin), "Food Plans for Poverty Measurement," p. 1, at https://www.census.gov/content/census/en/library/publications/1976/demo/measure-of-poverty.html. Documentation of Mollie Orshansky's use of the 1955 Household Food Consumption Survey is available in Gordon Fisher, The Development of the Orshansky Poverty Thresholds and Their Subsequent History as the Official U.S. Poverty Measure, U.S. Census Bureau, Census Working Paper, September 1997, at https://www.census.gov/library/working-papers/1997/demo/fisher-02.html. |
| 8. |
A family is defined in the Current Population Survey (CPS) as a group of two people or more related by birth, marriage, or adoption and residing together. |
| 9. |
See CRS Report R45397, Poverty in the United States in 2017: In Brief. |
| 10. |
The 2014 redesign of the CPS ASEC improved the income questions on pension withdrawals and asset income, and reduced nonresponses. However, some studies of the redesign find modest improvements in median incomes and no evidence of any change in poverty of elderly Americans. See Jessica L. Semega and Edward Welniak, Jr., The Effects of Changes to the Current Population Survey Annual Social and Economic Supplement on Estimates of Income, U.S. Census Bureau, Census Working Paper, January 2015, at https://www.census.gov/content/dam/Census/library/working-papers/2015/DEMO/ASSA-Income-CPSASEC-Red.pdf; and Joshua Mitchell and Trudi Renwick, A Comparison of Official Poverty Estimates in the Redesigned Current Population Survey Annual Social and Economic Supplement, U.S. Census Bureau, SEHSD Working Paper no. 2014-35, January 4, 2015, at https://www.census.gov/content/dam/Census/library/working-papers/2014/demo/SEHSD-WP2014-35.pdf. |
| 11. |
Some legislative proposals have been introduced to reduce poverty among Americans aged 80 and older. For example, the Elderly Poverty Release Act (S. 2653, 115th Congress) proposed to establish a new "poverty relief benefit" for Social Security beneficiaries aged 82 and older and for certain elderly or long-term Social Security beneficiaries and Supplemental Security Income (SSI) recipients. |
| 12. |
In 2017, about 8% of individuals aged 80 and older had some earnings, compared with 28% of individuals aged 65 to 79. In the same year, the median earnings among those with any earnings was $23,940 for individuals aged 80 and older, compared with $30,000 for those aged 65 to 70. Data are based on the Congressional Research Service (CRS) analysis of the 2018 CPS ASEC. |
| 13. |
In 2016, about 42% of households headed by those aged 80 and older had some retirement assets (including defined benefit plans, Individual Retirement Accounts, and other tax-advantaged accounts), compared with 47% of households headed by those aged 65 to 79. The median retirement asset level among households with any assets was $100,000 for households headed by those aged 80 and older, compared with $130,000 for households headed by those aged 65 to 79. Data are based on CRS analysis of the 2016 Survey of Consumer Finances. |
| 14. |
A cost-of-living adjustment (COLA) is provided in Social Security to mitigate the effects of inflation, but not in many defined benefit pensions. In defined benefit pensions where the benefits are not adjusted regularly by the cost of living, the purchasing power of periodic benefit payment will be eroded over time. |
| 15. |
The average amount of personal health care spending was $32,411 for individuals aged 85 and older in 2012, compared with $16,872 for those aged 65 to 84. See U.S. Centers for Medicare and Medicaid Services, NHE Fact Sheet, 2017, Age and Gender Tables, Table 7, at https://www.cms.gov/Research-Statistics-Data-and-Systems/Statistics-Trends-and-Reports/NationalHealthExpendData/Downloads/2012GenderandAgeTables.zip. |
| 16. |
Married individuals are those married and living together at the time of the survey. Nonmarried individuals include those widowed, divorced, never married, separated, and married living apart. In the 2017 CPS ASEC, the Census Bureau added separate opposite-sex and same-sex categories for the spouse and unmarried partner categories. Married-couple families now include same-sex married couples. For details, see https://www.census.gov/topics/families/same-sex-couples/library/working-papers.2019.html. For an overview of the effects of the proposed changes on poverty statistics, see Ashley Edwards, The Presence and Impact of Same-Sex Married Couples on Poverty Rates in the Current Population Survey, Census Bureau, Working Paper no. 2017-25, April 27, 2017, at https://www.census.gov/content/dam/Census/library/working-papers/2017/demo/SEHSD-WP2017-25.pdf. |
| 17. |
Recent Congresses have introduced legislative proposals to increase Social Security benefits for certain widow(er)s, disabled widow(er)s, and surviving divorced spouses: in the 116th Congress, H.R. 1540 and S. 345, and in the 115th Congress, H.R. 4593, H.R. 4594, H.R. 1583, S. 3457, H.R. 6247, H.R. 2855, and H.R. 6929. Note the widowed and divorced definitions in this report are based on marital status, but not Social Security benefit types. |
| 18. |
Since 2002, federal surveys ask respondents to identify with one or more races; previously they could choose only one. The groups in this section represent those who identified with one race alone. Another approach is to include those who selected each race group either alone or in combination with one or more other races. Those data are also available on the Census Bureau's website at https://www.census.gov/library/publications/2018/demo/p60-263.html, in Appendix B in Income and Poverty in the United States: 2017 and in accompanying historical data tables. |
| 19. |
Margins of error tend to be larger for smaller demographic groups and the Asian population is smaller than the other demographic groups shown. The larger margins of error help to explain why the line for the Asian population is less smooth than for the other demographic groups: the estimates are affected by sampling variability to a greater degree than for the other groups. |
| 20. |
|
| 21. |
Based on the reported information in the 2018 CPS ASEC, SSI accounted for 98% of total cash public assistance received by individuals aged 65 and older. Other public assistance includes cash public assistance payments to people with low income, such as Temporary Assistance for Needy Families (TANF), general assistance, and emergency assistance. |
| 22. |
Some research has shown that survey respondents at the bottom of the income distribution, frequently confuse Social Security with SSI such that SSI plays a larger role among the low-income aged population than the survey suggests. See Adam Bee and Joshua Mitchell, Do Older Americans Have More Income Than We Think?, Census Bureau, SESHD Working Paper no. 2017-39, July 2017, at https://www.census.gov/content/dam/Census/library/working-papers/2017/demo/SEHSD-WP2017-39.pdf. |
| 23. |
See CRS Report R42035, Social Security Primer. |
| 24. |
Gary V. Engelhardts and Jonathan Gruber, Social Security and the Evolution of Elderly Poverty, National Bureau of Economic Research (NBER), Working Paper no. 10466, May 2004, at https://www.nber.org/papers/w10466. |
| 25. |
CRS analysis of data from the U.S. Census Bureau, 2018 CPS ASEC. |
| 26. |
The special minimum benefit (also known as the special minimum primary insurance amount [PIA]) is linked to prices, whereas the regular Social Security benefit is linked to wages. Because wages generally grow faster than prices, the special minimum benefit affects fewer beneficiaries every year. The Social Security Administration (SSA) estimates that the provision will have no effect on workers who attain 62 in 2019 or later. See CRS Report R43615, Social Security: Minimum Benefits. |
| 27. |
See U.S. Census Bureau, Impact on Poverty of Alternative Resource Measure by Age: 1981-2017, at https://www.census.gov/library/publications/2018/demo/p60-263.html. Social Security benefits are based on a worker's career-average earnings in Social Security-covered employment (i.e., jobs in which the worker's earnings were subject to Social Security payroll taxes). If the Social Security program had been abolished, people would not receive Social Security income during their retirement years, but they also would have incurred fewer payroll taxes during their working years—which in turn implies that they would have had additional money for other purposes such as consumption, retirement savings, and investment. The values presented above do not reflect the effect of reducing payroll taxes or other behavioral changes. |
| 28. |
See CRS In Focus IF10482, Supplemental Security Income (SSI). In 2018, the SSI program paid out nearly $54.5 billion in federal benefits, of which about 20% (or $10.9 billion) was paid to recipients aged 65 or older. See SSA, "SSI Monthly Statistics, 2018," Table 6, at https://www.ssa.gov/policy/docs/statcomps/ssi_monthly/2018/index.html. |
| 29. |
Center on Budget and Policy Priorities, 2014, "Introduction to the Supplemental Security Income (SSI) Program," Washington, DC: CBPP, at https://www.cbpp.org/sites/default/files/atoms/files/1-10-11socsec.pdf; and Pamela Herd et al., "A Targeted Minimum Benefit Plan: A New Proposal to Reduce Poverty Among Older Social Security Recipients," The Russell Sage Foundation Journal of the Social Sciences, vol. 4, no. 1, (February 2018), pp. 74-90, at https://www.urban.org/research/publication/targeted-minimum-benefit-plan-new-proposal-reduce-poverty-among-older-social-security-recipients. |
| 30. |
|
| 31. |
Housing subsidies and Supplemental Nutrition Assistance Program (SNAP) benefits are provided to poor individuals of all ages, although the share of the poor population that receives these benefits is usually smaller among individuals aged 65 and older relative to those under age 65. See, for example, April Yanyuan Wu, Why Do So Few Elderly Use Food Stamps?, the Harris School of Public Policy Studies, the University of Chicago, October 2009, at http://citeseerx.ist.psu.edu/viewdoc/download?doi=10.1.1.167.6663&rep=rep1&type=pdf. |
| 32. |
See CRS Report RL34591, Overview of Federal Housing Assistance Programs and Policy. |
| 33. |
See CRS Report R42505, Supplemental Nutrition Assistance Program (SNAP): A Primer on Eligibility and Benefits. |
| 34. |
For additional information on each program, see CRS Report R43783, School Meals Programs and Other USDA Child Nutrition Programs: A Primer; CRS Report R43634, Temporary Assistance for Needy Families (TANF): Eligibility and Benefit Amounts in State TANF Cash Assistance Programs; CRS Report RL31865, LIHEAP: Program and Funding; CRS Report R41777, Antipoverty Effects of Unemployment Insurance; CRS Video WVB00014, Introduction to Workers' Compensation; and CRS Report R44115, A Primer on WIC: The Special Supplemental Nutrition Program for Women, Infants, and Children. |
| 35. |
Office of Management and Budget (OMB) in Statistical Policy Directive 14, May 1978, at https://www.census.gov/topics/income-poverty/poverty/about/history-of-the-poverty-measure/omb-stat-policy-14.html. This directive replaced Circular A-46, issued by the Bureau of the Budget in 1969. For a history of the official poverty measure, see https://www.census.gov/topics/income-poverty/poverty/about/history-of-the-poverty-measure.html. |
| 36. |
Another criticism of the poverty measure's use of money income is that income amounts are underreported in household surveys. One proposed solution, not discussed in detail in this report, is to use a consumption-based poverty measure. Some scholars argue that quantifying the value of goods and services people consume provides a clearer picture into their economic well-being, and consequently, their poverty status, because people may have access to credit, savings, or other resources besides income. However, as with income, survey data on consumption also come with technical challenges, and other scholars have questioned consumption-based poverty measurement by comparing the method's theoretical strengths and weaknesses. For a discussion of one approach to consumption-based poverty measurement, see Bruce D. Meyer and James X. Sullivan, Annual Report on U.S. Consumption Poverty: 2017, American Enterprise Institute, October 31, 2018, at https://www.aei.org/wp-content/uploads/2018/11/2017-Consumption-Poverty-Report-Meyer-Sullivan-final.pdf. For a comparison of the strengths and weaknesses of income-based and consumption-based poverty measures, using examples of families in various economic situations, see David S. Johnson, "Measuring Consumption and Consumption Poverty: Possibilities and Issues," prepared for Seminar 4 of the Reconsidering the Federal Poverty Measure conference series co-hosted by the University of Maryland and American Enterprise Institute, November 18, 2004, at http://www.welfareacademy.org/pubs/poverty/Johnson.pdf. For an analysis that presents serious criticisms of consumption-based poverty measures, see Appendix D of National Academies of Sciences, Engineering, and Medicine, 2019, A Roadmap to Reducing Child Poverty, National Academies Press, https://doi.org/10.17226/25246. |
| 37. |
Constance F. Citro and Robert T. Michael, eds., Measuring Poverty: A New Approach, (Washington, DC: National Academies Press, 1995); Rebecca Blank, "Presidential Address: How to Improve Poverty Measurement in the United States," Journal of Policy Analysis and Management, vol. 27, no. 2 (Spring 2008), pp. 233-254; and Trudi Renwick and Liana Fox, The Supplemental Poverty Measure: 2015, Census Bureau, September 2016, pp. 60-258. |
| 38. |
The SPM has been published as a research measure, per the guidance of an interagency technical working group (ITWG) organized by OMB. As the ITWG observed, "The SPM would not replace the official poverty measure. The Working Group has designed it as an experimental measure that defines thresholds and resources in a manner different from the official poverty measure. The SPM should be considered a work in progress, with the expectation that there will be improvements to it over time." See "Observations from the Interagency Technical Working Group on Developing a Supplemental Poverty Measure," March 2010, published on the Census Bureau's website at https://www.census.gov/content/dam/Census/topics/income/supplemental-poverty-measure/spm-twgobservations.pdf. |
| 39. |
See CRS Report R45031, The Supplemental Poverty Measure: Its Core Concepts, Development, and Use. |
| 40. |
Liana Fox, The Supplemental Poverty Measure: 2017, U.S. Census Bureau, September 2018, at https://www.census.gov/library/publications/2018/demo/p60-265.html. |
| 41. |
The SPM poverty rate for persons aged 18 - 64 was 13.2% in 2017, compared with an official poverty rate of 11.2% in the same year. Liana Fox, The Supplemental Poverty Measure: 2017, U.S. Census Bureau, September 2018, https://www.census.gov/library/publications/2018/demo/p60-265.html. |
| 42. |
In 2017, the average number of children per family was 0.13 children among all households headed by people aged 65 and older, and 0.39 children among poor households headed by those aged 65 and older. The corresponding averages for all households and poor households headed by those aged 25-34 were 1.41 and 2.29 children, respectively. The corresponding averages for all households and poor households headed by those aged 35-44 were 1.73 and 2.27 children, respectively. See U.S. Census Bureau, Table POV33, "Mean Number of Related Children per Family, by Family Structure, Age of Householder and Poverty Status: 2017," at https://www.census.gov/data/tables/time-series/demo/income-poverty/cps-pov/pov-33.html. |
| 43. |
Greater health care utilization among the population aged 65 and older, compared with younger populations, is documented among several metrics in National Center for Health Statistics, Health, United States, 2016, pp. 25-28, "Utilization," at https://www.cdc.gov/nchs/data/hus/hus16.pdf. Also, see more information at U.S. Centers for Medicare and Medicaid Services, "NHE Fact Sheet," 2017, at https://www.cms.gov/research-statistics-data-and-systems/statistics-trends-and-reports/nationalhealthexpenddata/nhe-fact-sheet.html. |
| 44. |
In 2017, nonworkers outnumbered workers among people aged 65 and older by a factor of more than three (39.3 million compared with 11.8 million). Among people aged 18- 64, the ratio was reversed (152.2 million workers compared with 45.9 million nonworkers). See U.S. Census Bureau, Table POV22, "Work Experience During Year by Age, Sex, Household Relationship and Poverty Status for People 16 Years Old and Over: 2017," at https://www.census.gov/data/tables/time-series/demo/income-poverty/cps-pov/pov-22.html. |
| 45. |
According to the National Center for Health Statistics, an estimated 1.4 million persons resided in nursing homes in 2014. Of this number, almost 1.2 million (85%) were aged 65 or older. For a thorough discussion of poverty measurement, see CRS Report R44780, An Introduction to Poverty Measurement. |
| 46. |
|
| 47. | 63 According to a Kaiser |