Addressing the Long-Run Deficit: A Comparison of Approaches
Changes from May 14, 2019 to June 7, 2022
This page shows textual changes in the document between the two versions indicated in the dates above. Textual matter removed in the later version is indicated with red strikethrough and textual matter added in the later version is indicated with blue.
Addressing the Long-Run Deficit: A Comparison of Approaches
Contents
- Introduction
- The Long-Run Budget: An Overview
- Long-Run Budget Issues: Overview
- Federal Spending: Patterns over Time
- Addressing the Long-Run Deficit:
June 7, 2022
A Comparison of Approaches
Jane G. Gravelle
The growth of the national debt, which is considered unsustainable under current policies,
Senior Specialist in
continues to be one of the central issues of domestic federal policymaking.
Economic Policy
Addressing a federal budget deficit that is unsustainable over the long run involves choices.
Donald J. Marples
Fundamentally, the issues require deciding what government goods, services, and transfers are
Specialist in Public Finance
worth paying taxes for. Most people would agree that the country benefits from a wide range of
government services—air traffic controllers, border security, courts and corrections, and so forth—provided by the federal government. Yet federal government provision of goods and
services comprises only a modest portion of the federal budget. Transfers, including interest payments, account for around 75% of the federal budget.
Central findings of this analysis include the following:
A comparatively small share of federal spending is for the direct provision of domestic government goods
and services.
Transfers and payments to persons and to state and local governments constitute most of federal spending,
about 75% of all federal spending.
Defense spending, accounting for about 15% of federal spending, has declined as a share of output over the
past 35 years, but it also tends to vary depending, in part, on the presence and magnitude of international conflicts.
The problem with the debt lies not in the past but in the future, as growth in spending for health and Social
Security is projected to continue faster than the economy as a whole. The increase in deficits and debt, in turn, leads to a significant increase in interest payments.
Because much of the pressure on future spending arises from imbalances in Social Security and Medicare
Part A (Hospital Insurance) trust funds, keeping these funds and their sources of financing intact is a concern that could constrain choices.
Preserving entitlements would likely require significant increases in taxes, such as raising rates, reducing
tax expenditures, increasing other taxes, or introducing new revenue sources.
Reductions in discretionary spending are insufficient to reduce the deficit to a sustainable level, so limiting
taxes as a percentage of output or constraining the overall size of the government to current levels would likely require significant cuts in mandatory spending, including entitlement programs such as Social Security, Medicare, and Medicaid.
Because the federal government provides about one-fifth of the revenue for state and local governments,
cutbacks in transfers to these governments may, in part, shift the burden of providing services from the national to subnational governments rather than altering the overall size of government services.
Congressional Research Service
link to page 5 link to page 5 link to page 6 link to page 8 link to page 9 link to page 9 link to page 11 link to page 14 link to page 15 link to page 15 link to page 17 link to page 17 link to page 19 link to page 21 link to page 22 link to page 24 link to page 24 link to page 24 link to page 26 link to page 27 link to page 27 link to page 28 link to page 28 link to page 29 link to page 30 link to page 33 link to page 5 link to page 9 link to page 9 link to page 12 link to page 12 link to page 14 link to page 14 link to page 16 link to page 21 link to page 22 link to page 23 link to page 23 Addressing the Long-Run Deficit: A Comparison of Approaches
Contents
Introduction ..................................................................................................................................... 1 The Long-Run Budget: An Overview ............................................................................................. 1 Long-Run Budget Issues: Overview ............................................................................................... 2 Federal Spending: Patterns over Time ............................................................................................. 4
Distribution of Spending by Fundamental Economic Form: Government Goods and
Distribution of Spending by Fundamental Economic Form: Government Goods and Services Versus Transfers - Distribution of Federal Spending by Mandatory and Discretionary Categories
- Distribution of Spending by Function
- Federal Taxes: Patterns over Time
- Tax Revenues
- Tax Structure
- Tax Expenditures
- Earmarked Revenues and Trust Funds
- Growth in the Debt
- Deficit Challenges Going Forward
- Addressing the Long-Run Deficit
- The Timing of Deficit Reductions
- Deficits Under Alternative Baselines
- Deficit Reduction Strategies
- Challenges to Reducing Budget Deficits
- How Much Can Discretionary Spending Cuts Reduce the Budget Deficit?
- Are Social Security and Medicare Hospital Insurance Trust Funds to Be Preserved?
- Services Versus Transfers ....................................................................................................... 5
Distribution of Federal Spending by Mandatory and Discretionary Categories ....................... 7 Distribution of Spending by Function ..................................................................................... 10
Federal Taxes: Patterns over Time .................................................................................................. 11
Tax Revenues ........................................................................................................................... 11 Tax Structure ........................................................................................................................... 13 Tax Expenditures ..................................................................................................................... 13 Earmarked Revenues and Trust Funds .................................................................................... 15
Growth in the Debt ........................................................................................................................ 17 Deficit Challenges Going Forward ................................................................................................ 18 Addressing the Long-Run Deficit ................................................................................................. 20
The Timing of Deficit Reductions ........................................................................................... 20 Deficits Under Alternative Baselines ...................................................................................... 20 Deficit Reduction Strategies ................................................................................................... 22 Challenges to Reducing Budget Deficits ................................................................................ 23
How Much Can Discretionary Spending Cuts Reduce the Budget Deficit? ..................... 23 Are Social Security and Medicare Hospital Insurance Trust Funds to Be
Preserved? ...................................................................................................................... 24
Can Long-Run Budget Issues Be Addressed by Keeping Tax Levels Constant? ............. 25
Can Long-Run Budget Issues Be Addressed by Keeping Tax Levels Constant? - What Would Be Required to Protect Entitlements? A Review of Tax Options
- Effects on State and Local Governments
Figures
- ................. 26 Effects on State and Local Governments .......................................................................... 29
Figures Figure 1. Federal Revenue and Spending,
FY1969-FY2018 as a %FY1970-FY2021, as a Percentage of GDP................... 1of GDP - Figure 2. Federal Spending by Economic Form,
CY1968-CY2018 as a % of GDP - CY1970-CY2021, as a Percentage of
GDP .............................................................................................................................................. 5
Figure 3. Federal Spending by Budget Category,
FY1969-FY2018 as a % of GDP - FY1970-FY2021, as a Percentage of
GDP .............................................................................................................................................. 8
Figure 4. Federal Spending by Functional Form,
FY1969-FY2018 as a % of GDP - Figure 5. Federal Revenues, FY1969-FY2018 as a % of GDP
- Figure 6. Federal Debt, FY1969-FY2023 as a % of GDP
- Figure 7. Federal Revenues and Spending, FY1968-FY2048 as a % of GDP
- Figure 8. Federal Spending, Selected Years FY1968-FY2048 as a % of GDP
- Figure 9. Federal Revenues, Selected Years FY1968-FY2048 as a % of GDP
Tables
- Table 1. Fiscal Situation, FY2018 as a % of GDP
- Table 2. Federal Spending by Fundamental Form, CY1980, CY2007, and CY2018 as a % of GDP
- FY1970-FY2021, as a Percentage of
GDP ............................................................................................................................................ 10
Figure 5. Federal Revenues, FY1970-FY2021, as a Percentage of GDP ...................................... 12 Figure 6. Federal Debt, FY1970-FY2027, as a Percentage of GDP.............................................. 17 Figure 7. Federal Revenues and Spending, FY1970-FY2051, as a Percentage of GDP ............... 18 Figure 8. Federal Revenue and Spending, Selected Years FY2006-FY2051, as a
Percentage of GDP ..................................................................................................................... 19
Congressional Research Service
link to page 6 link to page 11 link to page 11 link to page 13 link to page 13 link to page 14 link to page 14 link to page 18 link to page 18 link to page 20 link to page 20 link to page 20 link to page 20 link to page 25 link to page 25 link to page 26 link to page 26 link to page 34 Addressing the Long-Run Deficit: A Comparison of Approaches
Tables Table 1. Fiscal Situation, FY2020, as a Percentage of GDP ........................................................... 2 Table 2. Federal Spending by Fundamental Form, CY1980, CY2007, CY2019, and
CY2021, as a Percentage of GDP ................................................................................................ 7
Table 3. Federal Spending by Mandatory and Discretionary Categories, FY1980,
FY2007, and FY2019, as a Percentage
Table 3. Federal Spending by Mandatory and Discretionary Categories, FY1980, FY2007, and FY2018 as a % of GDP Tableof GDP ........................................................................... 9 Table 4. Federal Spending by Functional Form, FY1980, FY2007, andFY2018 as a %FY2019, as a Percentage of GDP .............................................................................................................. 10of GDP- Table 5. Federal Spending and Tax Expenditures by Function,
FY2018 as a % of GDP - FY2019, as a Percentage
of GDP ....................................................................................................................................... 14
Table 6. Financing and Benefits in the Social Security and Medicare Hospital Insurance
Trust Funds, FY1973, FY2007, and
FY2018FY2019, as a%Percentage of GDP ..................................... 16of GDP - Table 7. Supplementary Medical Insurance Trust Fund Income and Outflow, FY1973,
FY2007, and
FY2018FY2019, as a%Percentage of GDP ......................................................................... 16of GDP - Table 8. Long-Run Federal Budget Projections Under Extended and Alternative Extended
Baselines, FY2018, FY2028, and FY2038, as a
%Percentage of GDP ......................................... 21 Table 9. Projected Budgetary Effects of Alternative Budget Plans in FY2040 as a Percentage of GDP .............................................................................................................. 22 Contacts Author Information ........................................................................................................................ 30 Congressional Research Service link to page 5 Addressing the Long-Run Deficit: A Comparison of Approaches Introductionof GDP - Table 9. Projected Budgetary Effects of Alternative Budget Plans in FY2040 as a % of GDP
Summary
The growth of the national debt, which is considered unsustainable under current policies, continues to be one of the central issues of domestic federal policymaking.
Addressing a federal budget deficit that is unsustainable over the long run involves choices. Fundamentally, the issues require deciding what government goods, services, and transfers are worth paying taxes for. Most people would agree that the country benefits from a wide range of government services—air traffic controllers, border security, courts and corrections, and so forth—provided by the federal government. Yet federal government provision of goods and services comprises only a modest portion of the federal budget. Transfers, including interest payments, accounted for around 75% of the federal budget.
Central findings of this analysis include the following:
- A comparatively small share of federal spending is for the direct provision of domestic government goods and services.
- Transfers and payments to persons and to state and local governments constitute most of federal spending, about 75% of all federal spending.
- Defense spending, accounting for about 15% of federal spending, has declined as a share of output over the past 35 years, but it also tends to vary depending, in part, on the presence and magnitude of international conflicts.
- The problem with the debt lies not in the past but in the future, as growth in spending for health and Social Security is projected to continue faster than the economy as a whole. The increase in deficits and debt, in turn, leads to a significant increase in interest payments.
- Because much of the pressure on future spending arises from imbalances in Social Security and Medicare Part A (Hospital Insurance) trust funds, keeping these funds and their sources of financing intact is a concern that could constrain choices.
- Preserving entitlements would likely require significant increases in taxes, such as raising rates, reducing tax expenditures, increasing other taxes, or introducing new revenue sources.
- Reductions in discretionary spending are insufficient to reduce the deficit to a sustainable level, so limiting taxes as a percentage of output or constraining the overall size of the government to current levels would likely require significant cuts in mandatory spending, including entitlement programs such as Social Security, Medicare, and Medicaid.
- Because the federal government provides about one-fifth of the revenue for state and local governments, cutbacks in transfers to these governments may, in part, shift the burden of providing services from the national to subnational governments rather than altering the overall size of government services.
Introduction
The growth of the national debt, which is considered unsustainable under current policies, continues to be one of the central issues of domestic federal policymaking.
This report examines alternative approaches to reducing annual budget deficits and decisions about how to bring the national debt under control over the long term. To do this, the report first examines historical trends in federal spending and revenue policy to illustrate both the challenges and trade-offs inherent to making choices between (1) limiting the provision of defense and domestic public goods, (2) reducing transfers to persons including entitlements for the elderly and those with low income, (3) reducing support for state and local governments, and (4) raising taxes. Using projections of the debt and deficit, the report then addresses how limiting reliance on one source of deficit reduction creates pressure on other sources.
The Long-Run Budget: An Overview
The federal government incurs a budget deficit when total spending exceeds revenues over the course of a fiscal year.11 Over the past 50 years, the federal government has, on average, run budget deficits of 2.9% of gross domestic product (GDP), though as seen inin Figure 1, thethe amount has fluctuated from a surplus of 2.3% of GDP in 2000 to a deficit of 9.814.9% of GDP in 2020.
% of GDP in 2009.
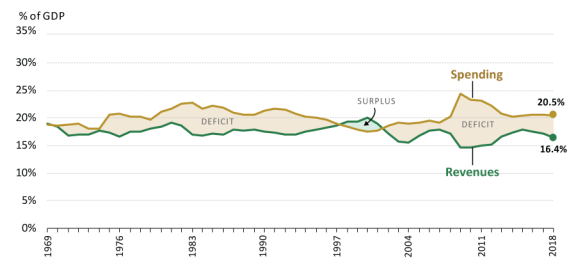
May 2022. A portion of the budget outcomes is a function of general economic conditions, and the remainder is a function of policy choices. For example, deficits tend to rise during recessions (through a combination of decreased revenues and increased spending on programs like unemployment), whereas the opposite is generally true during economic expansions. Policy choices, such as the decline in defense spending after the dissolution of the Soviet Union in 1991, may change the budget situation due to changes in national priorities.
Spending rose significantly during the
1 See CRS Report R45202, The Federal Budget: Overview and Issues for FY2019 and Beyond, by Grant A. Driessen, for detailed information on the federal budget.
Congressional Research Service
1
link to page 6 Addressing the Long-Run Deficit: A Comparison of Approaches
COVID-19 pandemic in 2020 to support individuals and businesses adversely affected by measures taken to limit the spread of the virus by governments, businesses, and individuals.
The accumulation of net deficits over time results in the federal debt. As shown inin Table 1, the the cumulative federal debt in 2018FY2020 was 78100% of GDP.
% of GDP.
Table 1. Fiscal Situation, FY2018FY2020, as a %Percentage of GDP
FY2020
Spending
31.2%
Revenue
16.3%
Deficit
14.9%
Debt
100.1%
Source: CBO Historical Budget Data, February 2021.
of GDP
|
FY2018 |
|
|
Spending |
20.3 |
|
Revenue |
16.4 |
|
Deficit |
3.9 |
|
Debt |
77.8 |
Source: CBO Historical Budget Data, January 2019.
Of concern is that the federal budget deficit has resulted in the growth of the federal debt that has regularly exceeded the growth rate of the economy. The debt can grow without increasing the ratio of debt to GDP as long as it rises at a rate less than or equal to GDP growth. For example, if the debt is 80% of GDP, as was the case prior to the pandemic, and the economy is growing at 1.6%, a deficit of 1.28% of GDP (1.6% of 80%) will maintain the debt-to-GDP ratio. The FY2018 FY2019 deficit is 4was 4.6% of GDP—a situation viewed by most economists as unsustainable.2
2 The response to the COVID-19 pandemic, while transitory, accelerated the growth in the debt-to-GDP ratio to 100%, which means a smaller deficit would be needed to return the ratio to 80%.
Long-Run Budget Issues: Overview Long-Run Budget Issues: Overview
Addressing a federal budget deficit that is unsustainable over the long run involves strategic choices.33 Fundamentally, the issues require deciding what government goods, services, and transfers are worth paying taxes for. Most people would agree that the country benefits from a wide range of government services—air traffic controllers, border security, courts and corrections, and so forth—provided by the federal government. Yet, as shown below, in 2007, the federal government provision of goods and services, outside of defense, constituted 10% of federal spending and 2% of GDP. Transfers, including interest payments, accounted for around 70% of the federal budget. Finding budget savings by reducing nondefense federal government services alone would fall short of what is needed to address the deficit.
In 2018
2 Some economists have argued that the growing level of debt will not only interfere with economic growth, but lead to a fiscal crisis where the United States loses access to credit markets. Others have suggested that too much attention is currently placed on the long-run outlook for the debt, particularly given low interest rates, and concerns about the long-run debt have limited worthwhile investments in education, infrastructure, and health and that these low interest rates mean that these fiscal constraints can be ignored. See Jason Furman and Lawrence H. Summers, “Who’s Afraid of Budget Deficits?” Foreign Affairs, March/April 2019, at https://www.foreignaffairs.com/articles/2019-01-27/whos-afraid-budget-deficits, for a discussion of these issues. They point out that there is no evidence that the United States will face a fiscal crisis but acknowledge that the debt cannot be allowed to grow forever. They suggest a middle road of ensuring that new spending and tax cuts do not add to the deficit in nonrecession years and that existing public services over time will require more revenues.
3 For further discussion of the unsustainability of the federal budget trajectory, see Congressional Budget Office (CBO), The 2021 Long-Term Budget Outlook, March 4, 2021, https://www.cbo.gov/publication/56977.
Congressional Research Service
2
Addressing the Long-Run Deficit: A Comparison of Approaches
In 2019, the latest year before the pandemic, transfers, including interest payments, accounted for 76% of the federal budget, up from 70% in 2007. Outside of the 9% provision for domestic goods, defense spending for goods and services constitutes about 15% of federal spending.4 In this area as well, there are limits to the savings that might be found without compromising national security. Therefore, to address the budget shortfalls facing the country over the long run, it is likely that (1) transfer payments, such as Social Security, Medicare, and Medicaid, to or on behalf of individuals (which already account for half of federal spending and are growing) must be reduced; (2) transfers to state and local governments must be reduced (which would shift the budget decisions to a different level of government); (3) taxes must be raised; or some combination of the three.
The next section of this report examines the government'’s spending allocation, the method of its financing, and how these shares and sources have changed over time. It demonstrates that the surge in the debt is a recent phenomenon that has occurred with the recession and is inherently transitory. Going forward, however, as shown in the subsequent section, the growth in transfers to the elderly and spending for health care—a trend that has been under way for some time but was offset by a decline in spending for other purposes, relative to GDP—will increasingly contribute to unsustainable deficits. The following section addresses philosophies for approaching deficit reduction, as embodied in a number of proposals. It discusses how different approaches to and constraints imposed on deficit reduction will have consequences for the menus of other available choices. For example, if deficit reduction begins with a constraint that taxes will not rise, policy would almost certainly require significant cutbacks in Social Security and Medicare. If the benefits of these programs are to be maintained, an increase in taxes would likely be required.
Central findings of this analysis include the following:
-
A comparatively small share of federal spending is for the direct provision of
domestic government goods and services.
- Transfers and payments to persons and to state and local governments constitute most of federal spending, about 75% of all federal spending.
- Defense spending, accounting for about 15% of federal spending, has declined as a share of output over the past 35 years, but it also tends to vary depending, in part, on the presence and magnitude of international conflicts.
- The problem with the debt lies not in the past but in the future, as spending growth for health and Social Security is projected to continue faster than the economy as a whole. The increase in debt, in turn, leads to a significant increase in interest payments.
-
Because much of the pressure on future spending arises from imbalances in
Social Security and Medicare Part A (Hospital Insurance) trust funds, keeping these funds and their sources of financing intact is a concern that could constrain choices.
- Preserving entitlements would likely require significant increases in taxes, such as raising rates, reducing tax expenditures, increasing other taxes, or introducing new revenue sources.
- Reductions in discretionary spending are insufficient to reduce the deficit to a sustainable level; thus, limiting taxes as a percentage of output or constraining the overall size of the government to current levels would likely require 4 Transfers rose during the pandemic, constituting 83% of spending in 2021, but this increase is temporary. Congressional Research Service 3 Addressing the Long-Run Deficit: A Comparison of Approaches significant cuts in mandatory spending, including entitlement programs such as Social Security, Medicare, and Medicaid.
- Because the federal government provides about one-fifth of the revenue for state and local governments, cutbacks in transfers to these governments may, in part, shift the burden of providing services from the national to subnational governments rather than altering the overall size of government services.
Federal Spending: Patterns over Time
The objectives of government spending and taxes are generally viewed as providing for public and quasi-public goods,45 such as defense, law enforcement, infrastructure, and education; correcting market failures,56 including externalities (both negative, such as pollution, and positive, such as research and development); achieving distributive justice; and managing business cycles. Measured by the amount of spending, defense is the most important pure public good the federal government provides. Many public and quasi-public goods, as well as income-support programs, are provided by state and local governments, and some federal spending is through grants to state and local governments for these programs. For example, in FY2016FY2019, state governments received 29.126.7% of total revenues from federal transfers, and local governments received 3.8%.64%.7 States also provide transfers to local governments, and local governments provide transfers among themselves as well. These intergovernmental transfers are important in evaluating budget proposals, because a reduction in transfers to state and local governments may in large part shift the burden to these governments rather than reduce the overall government role.
Spending in the U.S. budget can be divided in various ways that are relevant to considering deficit reduction. In the discussion that follows, government spending is divided by whether the spending is to provide public goods or transfers, whether it is discretionary or mandatory (and the major categories within those divisions), and by function. The first approach to presenting spending distinguishes between the provision of goods and services (defense and nondefense) and transfers to persons or to state and local governments. This approach is not a typical way of presenting budget data. It is important to divide spending in this way, however, to address concerns about potential inefficiency in federal government operations, especially outside of defense, as it indicates the scope for cutbacks relative to the deficit. The second approach divides spending into discretionary (provided in annual appropriations acts) and mandatory (controlled by permanent laws, and including entitlements to benefits). It is associated with the procedures needed to alter spending. The third, a common way of presenting budget data, divides spending by function (defense, education, energy, health, etc.). Later, this section also discusses trends in
5 A pure public good is one for which there is no marginal cost to an additional consumer and is non-excludible. The classic example is a lighthouse, but the most important one in terms of federal spending is national defense. Quasi-public goods do not necessarily have these pure characteristics, but they experience large spillover effects. For example, it is possible to charge subscriptions for fire protection, but subscribers benefit from putting out fires in adjacent properties. Allowing a nonsubscriber’s property to burn is not only generally viewed as unacceptable (especially if lives are at risk) but also endangers other properties and their inhabitants.
6 A market failure is not the lack of a market but the failure of a market to achieve the optimal outcome in which marginal costs equal marginal benefits. Market failures are ubiquitous, and many such failures may be too small or too difficult to correct to justify government intervention. Market failures arise from many sources, including externalities, monopoly power, imperfect information, and incomplete markets (in which contracts cannot be made, such as those between generations). Some kinds of insurance, in particular, tend to suffer from many market failures. A large part of federal government spending relates to insurance against various contingencies, such as spending on Social Security, unemployment, and health.
7 See U.S. Census Bureau, 2019 State and Local Government Finances, October 8, 2021, https://www.census.gov/data/datasets/2019/econ/local/public-use-datasets.html.
Congressional Research Service
4
link to page 9
Addressing the Long-Run Deficit: A Comparison of Approaches
by function (defense, education, energy, health, etc.). Later, this section also discusses trends in federal taxes by source, tax structure, tax expenditures, and receipts and payments in the major trust funds.
Distribution of Spending by Fundamental Economic Form: Government Goods and Services Versus Transfers
One way to look at spending is to examine the extent to which spending involves actual government consumption or production (that is, spending on the direct provision of goods and services) as compared with transfers, subsidies, and interest. The discussion in this section indicates that although total spending as a percentage of GDP fluctuated around 20% of GDP between 1973 and 2007, government involvement in the economy—narrowly defined as using resources to provide public goods directly—had fallen by a third and outside of defense had remained roughly constant and small (at around 2% of GDP). At the same time, transfers to persons increased by more than 40%, and transfers to state and local governments increased by less than 5%. Spending rose nearly 2% of GDP by 20182019, primarily due to transfers to persons, whereas consumption continued to decline. The increase in transfers and subsidies in 2020 and 2021 is expected to be temporary and was largely a response to the pandemic. Figure 2 shows how the economic form of federal spending has shifted since 1968.
Figure 2. Federal Spending by Economic Form, |
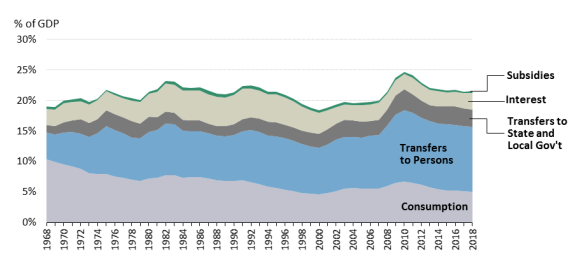 |
CY1970-CY2021, as a Percentage of GDP Source: National Income and Product Accounts (NIPA), Tables 1.1.5 and 3.2. |
In calendar year 2007, 28% of government spending was categorized as consumption and involved the direct provision of goods and services. Of the remaining amount, 44% were transfers to persons, 13% transfers to state and local governments, 14% interest payments, and 2% subsidies.7 8 Although federal government spending amounted to 19.9% of output in 2007, federal government spending on the provision of public and quasi-public goods was 5.5% of output.8 9
8 Data in this section are from the Bureau of Economic Analysis (BEA), “National Income and Product Accounts,” Tables 1.1.5 and 3.3, https://apps.bea.gov/iTable/index_nipa.cfm. Note that some numbers may not add up due to rounding.
9 These goods include goods such as national defense, infrastructure provided by the corps of engineers, the federal courts and prisons, the national forestry service and national parks, embassies and consulates in other countries, and similar goods.
Congressional Research Service
5
link to page 11 Addressing the Long-Run Deficit: A Comparison of Approaches
Based on budget data reported subsequently, 3.8% was for defense, leaving 1.7% for nondefense. Because total nondefense discretionary spending was 3.4% of GDP, half of this amount was transfers.
By 2018
By 2019, before the pandemic, with the economy at or near full employment, federal government consumption spending had declined to 5.2% of output, whereas transfers had increased. Government spending on nondefense goods and services was 1.92.0% of GDP, and defense spending was 3.2% of GDP. Budget data for FY2017FY2019 indicate that discretionary spending was 6.3% of GDP, with defense spending at 3.12% of GDP and nondefense at 3.21% of GDP. Thus, roughly 60% 35% of nondefense spending, about 1.9% of GDP, was transfers at that time.
State and local government spending (netting out transfers between these remaining two levels of government spending) in 2007 was 14% of output, and total spending by all forms of government (after netting out federal transfers) was 31.533.2% of output. A larger share of state and local spending (which includes federal government transfers), 69%, was in government provision of goods and services (consumption), with 21% in transfers to persons, 9% in interest payments, and less than 1% in subsidies. In the third quarter of 20182019, state and local spending net of federal transfers was 14was 13.6%, for a total of 32.530.8% for all government spending. Provision of goods and services was 64%; transfers were 26%; and interest was 9%.
10%.
Combining all levels of government, in 2007, government production of goods and services was 15.2% of output, thus the federal government share (5.5%) was about one-third of the total provided by all levels of government. Subtracting 3.8% from the federal government share and the total share to eliminate national defense spending (shown subsequently), the federal share of nondefense provision of goods and services by all levels of government was 11%. In 20182019, the nondefense share had risen to 14was 10%, with the federal share (5.2% of output) remaining at 36%.
at 37.4%.
Similar results are found when examining employment levels. Total government civilian employment in 2007 was 16% of total nonagricultural employment, with the federal government accounting for 2%, the state government accounting for 3.7%, and local government accounting for the remaining 10.4%.9 By September 201810 By March 2022, the employment share remained atwas about 15%, and each level of government maintained approximately the same shares (with local government falling to 9.6%).
1.9%, 3.4%, and 9.3%).
The share of federal government spending that goes to the direct provision of public or quasi-public goods (consumption) has declined over time, as shown in Table 2, whichwhich compares 1980 with 2007, 2019, and 2021 and 2018. The decline from 7.2% of GDP in 1980 to 5.5% of GDP in 2007 is largely due to a reduction in defense spending.
The latest data available, 2021, are affected by pandemic spending, which is not expected to continue.
10 Data from Bureau of Labor Statistics (BLS), Establishment Data, Table B-13, https://www.bls.gov/news.release/empsit.t17.htm.
Congressional Research Service
6
link to page 12 Addressing the Long-Run Deficit: A Comparison of Approaches
Table 2. Federal Spending by Fundamental Form, CY1980, CY2007, and CY2018 as a %CY2019, and
CY2021, as a Percentage of GDP
Category
1980
2007
2019
2021
Consumption
7.2%
5.5%
5.1%
5.2%
Transfers to Persons
7.7%
8.7%
10.8%
15.8%
Transfers to State and Local Governments
2.4%
2.5%
2.8%
4.8%
Interest
3.8%
2.8%
2.7%
2.2%
Subsidies
0.3%
0.3%
0.3%
2.1%
Total
21.4%
19.9%
21.5%
30.1%
of GDP
|
Category |
1980 |
2007 |
2018 |
|
Consumption |
7.2 |
5.5 |
5.0 |
|
Transfers to Persons |
7.7 |
8.7 |
10.6 |
|
Transfers to State and Local Governments |
2.4 |
2.5 |
2.8 |
|
Interest |
3.8 |
2.8 |
2.7 |
|
Subsidies |
0.3 |
0.3 |
0.3 |
|
Total |
21.4 |
19.9 |
21.5 |
Source: Bureau of Economic Analysis (BEA), National Income and Product Accounts (NIPA), Tables 1.1.5 and 3.2.
and 3.2.
The discussion in this section indicates that although total spending as a percentage of GDP fluctuated around 20% of GDP between 1973 and 2007, federal government involvement in the economy—narrowly defined as using resources to provide public goods directly—had fallen by a third and outside of defense had remained roughly constant and small (at around 2%small (2% or less of output). At the same time, transfers to persons increased by more than 40% and transfers to state and local governments increased by less than 5%. Spending rose nearly 2% of GDP by 20182019, primarily due to transfers to persons, whereas consumption continued to decline.
Distribution of Federal Spending by Mandatory and Discretionary Categories10
Discretionary Categories11 Budget accounts often classify spending in budget documents as mandatory or discretionary spending, along with subcategories of spending. Though technically classified as mandatory spending, interest payments tend to be listed separately because they are a consequence of past spending and tax policies. Discretionary spending is controlled by the annual appropriations process and is normally divided into defense and nondefense categories. Discretionary spending is where most of the public provision of goods and services occurs, but some discretionary spending is in the form of transfers. Mandatory spending is generally governed by a set of permanent statutory provisions, and some of these programs (such as Social Security and Medicare) are referred to as entitlements.
Since the late 1960s, as shown inin Figure 3, defensedefense spending has declined as a share of output, first as a result of the ending of the Vietnam War (by FY1981, defense spending was 5.2% of output). It rose in the 1980s and then fell, reaching 3.0% by 2001, before rising again with the Afghanistan and (second) Iraq wars. This pattern suggests that although defense spending may generally grow with the economy and be affected by other factors (such as moving to an all-volunteer force or the peacetime buildup in the 1980s), it also fluctuates depending on whether the United States is engaged in prolonged international conflicts.
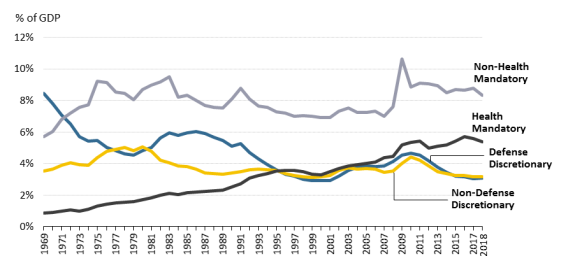
FY1970-FY2021, as a Percentage of GDP Source: Created by CRS. Data from CBO Historical Budget Data, May 2022. Nondefense discretionary spending has fluctuated much less, although it rose in the late 1970s, then reverted to historical levels. Nondefense discretionary funding, although small as a share of the budget and of GDP, is largely the spending that many people think of when they think of the direct provision of goods and services by the federal government.
What Does Federal Nondefense Discretionary Spending Cover?
Nondefense discretionary spending covers a broad array of programs:
12
As noted in the discussion above, nontransfer domestic spending is 2% of GDP. In Thus, any one program area is modest as a share of output, which means that cuts in a particular area would also be small. For example, total spending on the entire federal domestic enforcement program, including immigration and the border patrol, federal courts and prosecutors, federal prisons, and the FBI, constitutes three-tenths of 1% of output, and even a significant cutback in this spending would be small compared with projected deficits of 4.3 percentage points of GDP by FY2024. |
12 Calculations are based on Office of Management and Budget, Historical Tables, Table 5.6, https://www.whitehouse.gov/omb/budget/historical-tables/. Data are for FY2019, since FY2020 and FY2021 are atypical years due to spending related to COVID-19.
Congressional Research Service
8
link to page 13 link to page 6 Addressing the Long-Run Deficit: A Comparison of Approaches
Mandatory spending, although it varies over time, has generally increased as a share of the economy since the 1960s.1213 The increase is most pronounced for health spending and has grown relative to GDP due to rising health care costs, certain other benefit changes, aging, and increased life spans.
Table 3 further disaggregates mandatory spending for selected years since the FY1980 (FY1980, FY2007, and FY2018FY2019). Overall discretionary spending over this time period declined from 9.9% of GDP to 6.23% of GDP, or a change of 36.93% (with declines of 35.433.3% for defense and 37.339.2% for nondefense discretionary spending), whereas total mandatory spending has increased by 35.9% 40.2% over the same time period.
The substantial, but presumably temporary, increase in federal spending in FY2020 (see Table 1) was primarily in income security and other (mandatory), with smaller increases in nondefense discretionary, Social Security, Medicare, and Medicaid.14
Table 3. Federal Spending by Mandatory and Discretionary Categories, FY1980,
FY2007, and FY2018FY2019, as a %Percentage of GDP
Percentage
Change
Category
FY1980
FY2007
FY2019
FY1980-FY2019
Discretionary
9.9%
7.2%
6.3%
-36.3%
Defense
4.8%
3.8%
3.2%
-33.3%
Nondefense
5.1%
3.4%
3.1%
-39.2%
Mandatory
9.2%
10.2%
12.9%
+40.2%
Social Security
4.2%
4.1%
4.9%
+16.7%
Medicare
1.2%
2.3%
3.7%
+208.1%
Medicaid
0.5%
1.2%
1.9%
+280.0%
Income Security
1.6%
1.4%
1.4%
-12.5%
Other Retirement and
1.7%
1.1%
1.4%
-17.6%
Disability
Other
1.2%
0.4%
0.9%
-25.0%
Offsetting Receipts
-1.2%
-0.8%
-1.3%
33.3%
Interest
1.9%
1.7%
1.8%
-5.2%
Total
21.0%
19.1%
21.0%
-0.0%
Source of GDP
|
|
|
|
| ||||||
|
Discretionary |
9.9 |
7.2 |
6.2 |
-36.9 |
||||||
|
Defense |
4.8 |
3.8 |
3.1 |
-35.4 |
||||||
|
Nondefense |
5.1 |
3.4 |
3.2 |
-37.3 |
||||||
|
Mandatory |
9.2 |
10.2 |
12.5 |
+35.9 |
||||||
|
|
Social Security |
4.2 |
4.1 |
4.9 |
+16.7 |
|||||
|
|
Medicare |
1.2 |
2.3 |
3.6 |
+191.7 |
|||||
|
|
Medicaid |
0.5 |
1.2 |
1.9 |
+290.0 |
|||||
|
|
Income Security |
1.6 |
1.4 |
1.4 |
-12.5 |
|||||
|
|
Other Retirement and Disability |
1.7 |
1.1 |
1.3 |
-23.5 |
|||||
|
|
Other |
1.2 |
0.4 |
0.8 |
-33.3 |
|||||
|
|
Offsetting Receipts |
-1.2 |
-0.8 |
-1.3 |
33.3 |
|||||
|
Interest |
1.9 |
1.7 |
1.6 |
-15.7 |
||||||
|
Total |
21.0 |
19.1 |
20.3 |
-3.3 |
||||||
Source: CBO Historical Tables, February 2021, https://www.cbo.gov/data/budget-economic-data#2.
https://www.cbo.gov/system/files/2018-06/51134-2018-04-historicalbudgetdata.xlsx.
Within mandatory spending, health spending (Medicare and Medicaid)—which has increased 223.5229.4% since FY1980—primarily drives the overall increase in mandatory spending. This increase is attributed to changes in demographics from an aging population and medical cost growth primarily, although benefit changes also contribute to the increase. Spending for Social Security also rose 16.7% over this period—primarily due to the number of Social Security beneficiaries and increased life expectancies. Other mandatory programs that provide benefits for low-income individuals, the unemployed, retirement programs for federal workers, and other
13 See CRS Report R44641, Trends in Mandatory Spending: In Brief, by D. Andrew Austin; and CRS Report R44763, Present Trends and the Evolution of Mandatory Spending, by D. Andrew Austin.
14 Overall spending increased to 31.2%, with an increase to 5% in income security and 5% in other mandatory and to 4.4% in nondefense discretionary. These increases reflected programs such as the increased unemployment compensation (both due to job loss and enhanced benefits) and the paycheck protection program.
Congressional Research Service
9
link to page 14 link to page 14 link to page 14
Addressing the Long-Run Deficit: A Comparison of Approaches
purposes (such as agricultural support payments) have remained relatively constant or declined since FY1980.
Distribution of Spending by Function
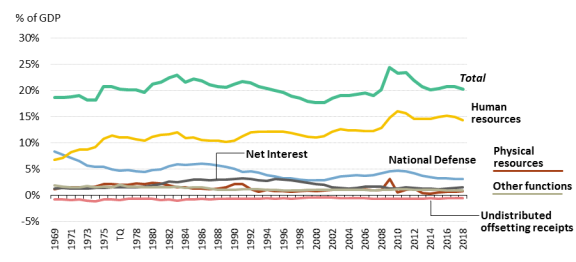
Another traditional way of viewing the budget is by budget function relating to the purpose of spending (education, health, etc.).1315 Figure 4 shows federal spending by budget function since 1969.
1970.
Figure 4. Federal Spending by Functional Form, |
 |
|
These comparisons, shown inFY1970-FY2021, as a Percentage
of GDP
Graphic is interactive in the web version of the report.
Source: Created by CRS. Data from FY2023 President’s Budget, Historical Table 3.1.
These comparisons, shown in Table 4, provide a similar picture to the previous allocation: although total spending as a share of output has fluctuated somewhat from FY1980 to FY2018, FY2021, the federal government has an increasing share of output in health and programs for the elderly, with declining shares for almost every other functional category. In FY2007, 64% of spending was for human resources, with 20% for defense, 9% for interest, and 5% for all other functions. In FY2019In FY2018, the share devoted to human resources had further risen, whereas the share spent on national defense had declineddeclined. Table 4 presents these categories as a percentage of GDP and illustrates that the subcategories for many types of spending, which are those that represent direct provision of government goods and services, are small as a percentage of GDP.
The presumably temporary increase in FY2020 for total government spending to 31.3% of GDP was primarily due to increased spending on human resources (which rose to 20.7%) and to a lesser extent for physical resources (which rose to 4.1%).
Table 4. Federal Spending by Functional Form, FY1980, FY2007, and FY2018 as a %FY2019,
as a Percentage of GDP
Budget Function
FY1980
FY2007
FY2019
National Defense
4.8%
3.9%
3.2%
15 See CRS Report R41726, Discretionary Budget Authority by Subfunction: An Overview, by D. Andrew Austin, for additional detail.
Congressional Research Service
10
Addressing the Long-Run Deficit: A Comparison of Approaches
Budget Function
FY1980
FY2007
FY2019
Human Resources
11.2%
12.3%
14.8%
Education
1.1%
0.6%
0.7%
Health
0.8%
1.9%
2.8%
Medicare
1.1%
2.6%
3.1%
Income Security
3.1%
2.6%
2.4%
Social Security
4.2%
4.1%
0.9%
Veterans’ Benefits
0.8%
0.5%
1.0%
Physical Resources
2.4%
0.9%
0.7%
Energy
0.4%
0.0%
0.0%
Natural Resources and the
0.5%
0.2%
0.2%
Environment
Commerce and Housing Credit
0.3%
0.0%
-0.1%
Transportation
0.8%
0.5%
0.5%
Community and Regional
0.4%
0.2%
0.1%
Development
Net Interest
1.9%
1.7%
1.8%
Other
1.6%
0.9%
1.1%
International Activities
0.5%
0.2%
0.3%
General Science and Space
0.2%
0.2%
0.2%
Agriculture
0.3%
0.1%
0.2%
Administration of Justice
0.2%
0.3%
0.3%
General Government
0.5%
0.1%
0.1%
Offsetting Receipts
-0.7%
-0.6%
-0.5%
Total
21.2%
19.1%
21.1%,
Source of GDP
|
Budget Function |
FY1980 |
FY2007 |
FY2018 |
|
|
National Defense |
4.8 |
3.9 |
3.1 |
|
|
Human Resources |
11.2 |
12.3 |
14.3 |
|
|
Education |
1.1 |
0.6 |
0.5 |
|
|
Health |
0.8 |
1.9 |
2.7 |
|
|
Medicare |
1.1 |
2.6 |
2.9 |
|
|
Income Security |
3.1 |
2.6 |
2.4 |
|
|
Social Security |
4.2 |
4.1 |
4.9 |
|
|
Veterans' Benefits |
0.8 |
0.5 |
0.9 |
|
|
Physical Resources |
2.4 |
0.9 |
0.8 |
|
|
Energy |
0.4 |
0.0 |
0.0 |
|
|
Natural Resources and the Environment |
0.5 |
0.2 |
0.2 |
|
|
Commerce and Housing Credit |
0.3 |
0.0 |
0.0 |
|
|
Transportation |
0.8 |
0.5 |
0.5 |
|
|
Community and Regional Development |
0.4 |
0.2 |
0.2 |
|
|
Net Interest |
1.9 |
1.7 |
1.6 |
|
|
Other |
1.6 |
0.9 |
0.9 |
|
|
International Activities |
0.5 |
0.2 |
0.2 |
|
|
General Science and Space |
0.2 |
0.2 |
0.2 |
|
|
Agriculture |
0.3 |
0.1 |
0.1 |
|
|
Administration of Justice |
0.2 |
0.3 |
0.3 |
|
|
General Government |
0.5 |
0.1 |
0.1 |
|
|
Offsetting Receipts |
-0.7 |
-0.6 |
-0.5 |
|
|
Total |
21.2 |
19.1 |
20.3 |
|
Source: Office of Management and Budget, Budget of the U.S. Government Historical Tables FY2020, https://www.whitehouse.gov/wp-content/uploads/2019/03/hist03z1-fy2020.xlsx.
omb/budget/historical-tables/. Federal Taxes: Patterns over Time
This section discusses four issues related to taxes: (1) the sources of tax revenue and their growth over time; (2) the differences in structure and distribution of revenue sources; (3) the size and distribution of tax expenditures (special income tax provisions such as exclusions, deductions, and credits); and (4) taxes that are specified as the revenue source for certain spending.14
16 Tax Revenues
The federal income tax system has several components. The largest component, in terms of revenue generated, is the individual income tax. For FY2018, an estimated $1.7 trillion, or 50% of the federal government'’s revenue, came from the individual income tax. The corporate income 16 See CRS Report R45145, Overview of the Federal Tax System in 2020, by Molly F. Sherlock and Donald J. Marples, for additional detail on the sources of revenues, their growth over time, and tax structure.
Congressional Research Service
11
link to page 16
Addressing the Long-Run Deficit: A Comparison of Approaches
The corporate income tax was estimated to generate another $218 billion in revenue in FY2018, or just under 7% of total revenue. Social insurance or payroll taxes generated an estimated $1.2 trillion, or 35% of revenue in FY2018. Estimates indicate that the remainder of federal revenue collected in FY2018 came from excise taxes (3%) or other sources (6%).15
17
The relative importance of these components can change over time, as seen in Figure 5. The individual income tax, the largest single source of revenue as a percentage of GDP, has fluctuated considerably over time. Individual income tax revenues grew in the late 1970s due to bracket creep, reaching 9.4% in FY1981.1618 The tax cuts induring the Reagan Administration are the major reason revenues declined, falling to 7.9% in FY1990. Revenues increased slightly with the 1993 Clinton Administration tax increase (tax increase during the Clinton Administration (P.L. 103-66), but the more significant growth occurred with the strong economic performance in the late 1990s, leading to a ratio of 9.9% in FY2000. They declined during the first decade of the 21st21st century following the tax cuts during the George W. Bush Administration tax cuts ((P.L. 107-16) and JGTRRA (P.L. 108-27). Along with the individual income tax, total taxes have also fluctuated. Prior to the Bush tax cutstax cuts during the Bush Administration, total taxes dropped as low as 17.1% in FY1977 and rose as high as 20.6% in FY2001. During the 2007-2009 recession, taxes fell to less than 15% of GDP.
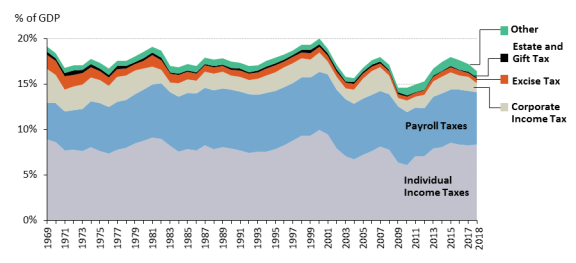
Corporate taxes have fluctuated as well, although largely due to economic conditions, whereas payroll taxes rose to around their current levels as a percentage of GDP by the mid-1980s, reached a peak of 6.8% in 2001, and have since declined slightly. Excise taxes have declined by two-thirds, and other revenue sources have remained about the same. Part of the decline in excise taxes is because these taxes are imposed on a per-unit basis and not indexed for inflation and, with the exception of tobacco taxes, have generally not been increased.
17 Other sources include estate and gift taxes, customs duties and fees, and deposits of earnings by the Federal Reserve System.
18 Bracket creep refers to the increase in the effective tax rate as nominal income grows because exemptions and rate brackets were not indexed for inflation at that time. There is also some amount of real bracket creep that causes effective tax rates to rise over time as real income grows.
Congressional Research Service
12
Addressing the Long-Run Deficit: A Comparison of Approaches
Tax Structure Tax Structure
These revenue sources differ in some important ways. Individual income taxes are progressive, have graduated rates, and can be revised in a variety of ways, including changing rates, deductions, exclusions, and credits. Income taxes are the main source of revenue for most federal spending outside of Social Security and Medicare Hospital Insurance (HI, whose benefits are less than half of Medicare spending).1719 Corporate income taxes are levied at a flat rate after allowing for various deductions and credits. Estate taxes are also progressive, but they are a small share of government revenues and have been declining in magnitude over the past 20 years.
Payroll taxes tend to fall more heavily on middle- and lower-income individuals.20 Payroll taxes, the next-largest source of revenue after individual income taxes, have flat rates (except for the Additional Medicare Tax) with an earnings cap for Social Security (but not Medicare). These taxes tend to be proportional, with a reduced burden on high-income taxpayers. Because of their simple structure, the main options for increasing revenues from this source are increasing rates and raising or eliminating the earnings cap.
Social Security payroll taxes are the basic source of finance for the Social Security program, and they are linked to benefits so that larger taxes lead eventually to larger benefits, although there are progressive elements in the benefit formula. Medicare payroll taxes qualify individuals for Medicare HI coverage, but the Medicare benefits are the same for all recipients.
Excise taxes, which largely apply to alcohol, tobacco, and transportation fuels, tend to be regressive and fall more heavily on middle- and lower-income individuals, but are also a smaller revenue source.21 Transportation fuel taxes are a major source of finance for highways, airports, and other transportation needs.
Tax Expenditures
Tax expenditures are revenue losses attributable to federal income tax laws that allow a special exclusion, exemption, deduction, credit, preferential tax rate, or deferred tax liability. The special tax credits and deductions in the income tax can also be viewed as a form of spending through the tax code. That is, one can view revenues as receipts without the special benefits and the special benefits from tax expenditures as spending. According to an FY1974-FY2004a Government Accountability Office (GAO) study, tax expenditures averaged 7.5% of GDP during that period.18FY1974-FY2004.22 In FY2007, tax expenditures were 7.2% of GDP and about 36% of total government direct spending.19 In FY201823 In FY2019, tax expenditures were 7.21% of GDP and about 3534% of government spending.20
24
19 The Medicare Payment Advisory Commission (MedPAC), REPORT TO THE CONGRESS: Medicare Payment Policy, March 2019, http://medpac.gov/docs/default-source/reports/mar19_medpac_entirereport_sec.pdf?sfvrsn=0.
20 For more information on payroll taxes, see CRS Report R47062, Payroll Taxes: An Overview of Taxes Imposed and Past Payroll Tax Relief, by Anthony A. Cilluffo and Molly F. Sherlock.
21 For more information on excise taxes, see CRS Report R46938, Federal Excise Taxes: Background and General Analysis, by Anthony A. Cilluffo.
22 GAO, Tax Expenditures Represent a Substantial Federal Commitment and Need to be Reviewed, GAO-05-690, September 2005, http://www.gao.gov/new.items/d05690.pdf.
23 Joint Committee on Taxation (JCT), Estimates of Federal Tax Expenditures for Fiscal Years 2007-2011, September 24, 2007, JCS-3-07, https://www.jct.gov/publications.html?func=startdown&id=1198.
24 Joint Committee on Taxation (JCT), Estimates of Federal Tax Expenditures for Fiscal Years 2019-2023, October 4, 2018, JCX-55-19, https://www.jct.gov/publications/2019/jcx-55-19/, and CBO, 10-Year Economic Projections, August 2019, https://www.cbo.gov/about/products/budget-economic-data#4.
Congressional Research Service
13
link to page 11 link to page 13 link to page 14 link to page 18 Addressing the Long-Run Deficit: A Comparison of Approaches
From the perspective of dividing government activity between transfers and direct provision of public goods, as in Table 2, tax expenditures are transfers and subsidies that go to persons, as is the case with the bulk of federal spending. From the perspective of discretionary versus mandatory spending, as inin Table 3, theythey are similar to a mandatory form of spending. Finally, from the perspective of budget function, as inin Table 4 and as shown inin Table 5, whichwhich compares spending and tax expenditures by budget function for FY2018FY2019, the pattern of tax expenditures is quite different from that of spending. A much larger share of tax expenditures is for physical resources. For specific subcategories, the largest share of tax expenditures is for commerce and housing, a category that attracts a small share of spending. The size of this category reflects special benefits for earnings from capital income. It also reflects benefits for housing in the form of mortgage interest and property tax deductions and, to a lesser extent, exemption from capital gains taxtaxes on owner-occupied housing and the low-income housing credit. The relatively large share for general government reflects tax-exempt bonds and itemized deductions for state and local income and sales taxes. (These amounts could also be distributed across the functional categories of state spending and thus would be more broadly distributed.) Much of the benefit for tax-exempt bonds goes to education and highways, where funds are borrowed for capital improvements.) Tax expenditures also provide significant benefits for health through the exemption of employer-provided health insurance and for income security, largely through benefits for pensions and other retirement savings.
|
Budget Function |
Spending |
Tax Expenditures |
|
|
National Defense |
3.14 |
0.03 |
|
|
Human Resources |
14.39 |
4.34 |
|
|
Education, Training, Employment, Social Services |
0.48 |
1.23 |
|
|
Health |
2.90 |
1.14 |
|
|
2.87 |
— |
||
|
Income Security |
2.43 |
1.74 |
|
|
Social Security |
4.84 |
0.18 |
|
|
Veterans' Benefits |
0.86 |
0.05 |
|
|
Physical Resources |
0.97 |
1.87 |
|
|
Energy |
0.02 |
0.06 |
|
|
Natural Resources and the Environment |
0.20 |
0.00 |
|
|
Commerce and Housing |
0.02 |
1.76 |
|
|
Transportation |
0.46 |
0.03 |
|
|
Community and Regional Development |
0.26 |
0.02 |
|
|
Net Interest |
1.51 |
0.01 |
|
|
Other |
0.98 |
0.90 |
|
|
International Activities |
0.23 |
0.47 |
|
|
General Science and Space |
0.15 |
0.06 |
|
|
Agriculture |
0.13 |
0.00 |
|
|
Administration of Justice |
0.34 |
— |
|
|
General Government |
0.13 |
0.38 |
|
|
Offsetting Receipts |
-0.50 |
— |
|
|
Total |
20.49 |
7.16 |
|
Source: Budget of the U.S. Government Historical Tables FY2019, https://www.govinfo.gov/content/pkg/BUDGET-2019-TAB/pdf/BUDGET-2019-TAB.pdf and JCX-81-18.
FY2019, as a
Percentage of GDP
Budget Function
Spending
Tax Expenditures
National Defense
3.25%
0.03%
Human Resources
14.82%
4.02%
Education, Training, Employment, Social
0.65%
1.00%
Services
Health
2.77%
1.13%
Medicare
3.08%
—
Income Security
2.44%
1.67%
Social Security
4.94%
0.17%
Veterans’ Benefits
0.95%
0.05%
Physical Resources
0.66%
2.06%
Energy
0.02%
0.11%
Natural Resources and the Environment
0.18%
0.00%
Commerce and Housing
-0.12%
1.89%
Transportation
0.45%
0.03%
Community and Regional Development
0.13%
0.03%
Net Interest
1.78%
0.00%
Other
1.01%
1.01%
International Activities
0.25%
0.46%
General Science and Space
0.15%
0.07%
Agriculture
0.18%
0.00%
Congressional Research Service
14
link to page 20 Addressing the Long-Run Deficit: A Comparison of Approaches
Budget Function
Spending
Tax Expenditures
Administration of Justice
0.31%
—
General Government
0.11%
0.47%
Offsetting Receipts
-0.47%
—
Total
21.05%
7.12%
Source: Budget of the U.S. Government Historical Tables, https://www.whitehouse.gov/omb/budget/historical-tables/; JCT, Estimates of Federal Tax Expenditures For Fiscal Years 2019-2023, JCX-55-19; and CBO, 10-Year Economic Projections, August 2019, https://www.cbo.gov/about/products/budget-economic-data#4.
Earmarked Revenues and Trust Funds Earmarked Revenues and Trust Funds
As noted above, dedicated revenues finance spending on certain categories of services, some of which are termed trust funds and some special federal funds. There are about 200 trust funds, but only a few of them are important in terms of magnitude or for considering budgetary reform.21
25
In some cases, the trust funds lead to questions about addressing the deficit. Although some of these funds rely on contributions from general revenues, the Social Security and the Medicare HI trust funds primarily rely on payroll taxes.2226 The largest trust funds relate to Social Security, which is divided into Old Age and Survivors Insurance (OASI) and Disability Insurance (DI), and Medicare, which is divided into Hospital Insurance Part A and Supplementary Medical Insurance (SMI) Parts B and D.23
27
Payroll taxes are the primary source of finance for Social Security and Medicare HI (also known as Medicare Part A). The funding of these programs is organized through trust funds that can also hold assets and earn interest. Medicare SMI, which pays for physician services and outpatient drugs, is financed primarily by a combination of premiums and general revenues.
Table 6 shows the inflow of revenues and the payment of benefits in the three trust funds financed by payroll taxes. (This table does not include earnings from interest on government securities held by the funds and transfers of income taxes collected on Social Security benefits; it also does not reflect administrative costs.) As indicated in the table, OASI payroll tax revenue (as a percentage of GDP) has declined over the past 11 yearsperiod of FY2007-FY2019, while payments have increased substantially. In contrast, DI and HI payroll tax revenues have been flat or increasing (as a percentage of GDP) over the same time period, while payments have been flat or increasing more modestly than OASI. By FY2018, payments for Social Security and Medicare benefits exceeded payroll tax collections. Because initial Social Security benefits are indexed to wages (and subsequently to prices), they tend to be a relatively constant share of output. Benefits have grown because of increasing longevity and an aging population. Revenues also tend to be a relatively constant share of output but were increased in the mid-1980s.
25 The 12 largest trust funds are Social Security (including Old-Age and Survivors Insurance and Disability Insurance), Medicare (including Supplementary Medical Insurance and Hospital Insurance), Civil Service Retirement and Disability, Military Retirement, Unemployment Insurance, Highway, Federal Employees Health Benefits, Foreign Military Sales, Airport and Airway, and Railroad Retirement.
26 Transfers are made to the Social Security and Medicare HI trust funds in the amount of income taxes collected on Social Security benefits. A temporary transfer was also made for the temporary two-percentage-point reduction in the employee share of Social Security taxes for 2011 and 2012.
27 See CRS Report RL33028, Social Security: The Trust Funds, by Barry F. Huston; and CRS Report R40425, Medicare Primer, coordinated by Patricia A. Davis, for further details on the history of these programs.
Congressional Research Service
15
link to page 20 Addressing the Long-Run Deficit: A Comparison of Approaches
Table 6. Financing and Benefits in the Social Security and Medicare Hospital
Table 6. Financing and Benefits in the Social Security and Medicare Hospital Insurance Trust Funds, FY1973, FY2007, and FY2018FY2019, as a %Percentage of GDP
Payroll Taxes
Benefits Payments
Program
FY1973
FY2007
FY2019
FY1973
FY2007
FY2019
of GDP
|
Program |
Payroll Taxes |
Benefits Payments |
||||
|
FY1973 |
FY2007 |
FY2018 |
FY1973 |
FY2007 |
FY2018 |
|
Social Security Old Age and Survivors Insurance (OASI)
3.0%
3.8%
3.6%
3.1%
3.4%
4.2%
|
3.0 |
3.8 |
3.4 |
3.1 |
3.4 |
4.1 |
Social Security Disability Insurance (DI)
0.4%
0.6%
0.7%
0.4%
0.7%
0.7%
|
0.4 |
0.6 |
0.8 |
0.4 |
0.7 |
0.7 |
Medicare Hospital Insurance (HI)
0.6%
1.3%
1.3%
0.5%
1.4%
1.5%
|
0.6 |
1.3 |
1.3 |
0.5 |
1.4 |
1.5 |
Source: Budget of the U.S. Government Historical Tables FY2020, , https://www.whitehouse.gov/wp-content/uploads/2019/03/hist13z1-fy2020.xlsx.
omb/budget/historical-tables/. Note: This table does not show the period beginning in the mid-1980s when sizable surplus revenues were collectedcol ected for Social Security.
Table 7 provides information on the income and outflow for the SMI trust fund. In FY1971, this fund was nearly equally financed by premiums paid by beneficiaries and federal contributions from general revenues. Although premiums have increased as a percentage of output, the vast majority of financing is now from general revenues. The premium share for Medicare Part B (physicians) fluctuated over time, but it is now set by law at 25% of the cost of funding Medicare Part B; the premiums share for Medicare Part D (drug) program is set at 25.5% of the estimated cost of the standard benefit.24
28
Table 7. Supplementary Medical Insurance Trust Fund Income and Outflow, FY1973,
FY2007, and FY2018FY2019, as a %Percentage of GDP
Income or Outflow
FY1973
FY2007
FY2019
Premiums
0.1%
0.4%
0.5%
Federal Contributions
0.1%
1.3%
1.6%
Benefits
0.2%
1.6%
2.1%
Source: White House, Budget of the U.S. Government Historical Tables, of GDP
|
Income or Outflow |
FY1973 |
FY2007 |
FY2018 |
|
Premiums |
0.1 |
0.4 |
0.5 |
|
Federal Contributions |
0.1 |
1.3 |
1.6 |
|
Benefits |
0.2 |
1.6 |
2.0 |
Source: White House, Budget of the U.S. Government Historical Tables FY2020, https://www.whitehouse.gov/wp-content/uploads/2019/03/hist13z1-fy2020.xlsx.
https://www.whitehouse.gov/omb/budget/historical-tables/. As these tables indicate, the size of these programs, particularly Medicare, has grown over time. SMI has grown faster than HI, and general revenue contributions have grown at a similar pace. SMI currently accounts for more than half the cost of Medicare.
One open question surrounding the formulation of a long-run budget policy is whether to continue financing Social Security and Medicare HI from payroll taxes. In this case, both programs'programs’ future benefits are expected to outstrip future receipts and eventually draw down all the assets. The Social Security (OASI) trust fund is projected to run out of accumulated assets in 2034,2529 and the HI trust fund is predicted to run out in 2026.26
30
28 See CRS Report R43122, Medicare Financial Status: In Brief, by Patricia A. Davis. 29 See CRS Report RL33028, Social Security: The Trust Funds, by Barry F. Huston, for additional discussion. 30 See CRS Report RS20946, Medicare: Insolvency Projections, by Patricia A. Davis; and CRS Report R43122, Medicare Financial Status: In Brief, by Patricia A. Davis, for additional discussion.
Congressional Research Service
16
link to page 21
Addressing the Long-Run Deficit: A Comparison of Approaches
Since its implementation in 1935, Social Security has been treated as a separate program, similar to a retirement plan, in which contributions (e.g., payroll taxes) during the working years create an entitlement to benefits in old age. A similar approach has been used for the more recently established Medicare HI. If these programs are to be kept separate, then they must be brought into balance separately and, to maintain the historic source of financing, any shortfall not addressed through benefit cuts or delayed eligibility must be addressed through increases in a specific tax—the payroll tax.27
31 Growth in the Debt
Federal debt may be divided into two major categories: (1) debt held by the public, which is the sum of accrued net deficits and outstanding money from federal credit programs; and (2) intragovernmental debt, which is the amount of federal debt held by other federal agencies. As of February 28, 2019April 30, 2022, the amount of federal debt outstanding was $22.11630.4 trillion, with 7378.5% of that debt held by the public and 2621.5% held as intragovernmental debt.2832 Figure 6 shows the federal debt as a share of the economy from FY1969FY1970 projected through FY2023.
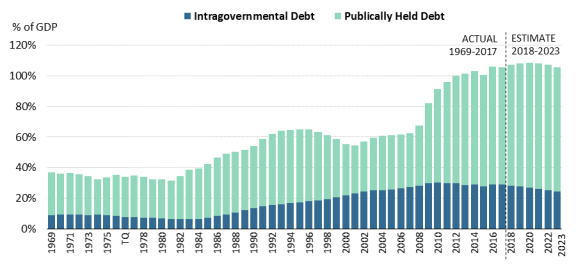
Individuals, firms, the Federal Reserve, state and local governments, and foreign governments are eligible to purchase publicly held debt. Such debt may be acquired directly through the auction process from which most publicly held debt is initially sold or on the secondary market if the debt is deemed "“marketable,"” or eligible for resale. As of February 28, 2019April 30, 2022, the total amount of publicly held debt outstanding was $16.25123.4 trillion. Publicly held debt is the measure of concern for the sustainability of the debt since it measures debt owned outside of the government. This debt grew rapidly as a percent of GDP during the 2007-2009 recession and afterward and has continued to grow (while intergovernmental debt relative to GDP has declined).
31 Money can be moved from the general fund to the trust funds, as in the case of income taxes on Social Security benefits, but such actions may weaken the relationship between benefits and payments in the underlying programs.
32 The Bureau of the Fiscal Service, Monthly Statement of the Public Debt of the United States, April 30, 2022, https://www.treasurydirect.gov/govt/reports/pd/mspd/2022/opds042022.pdf.
Congressional Research Service
17
link to page 22
Addressing the Long-Run Deficit: A Comparison of Approaches
The majority of publicly held debt is marketable, and it includes all Treasury notes, bonds, bills, Treasury Inflation Protected Securities (TIPS), and Treasury-issued Floating Rate Notes (FRNs). Nonmarketable debt held by the public is composed of U.S. savings bonds, State and Local Government Securities (SLGS), and other, smaller issues.2933 As of February 28, 2019, 96.6April 30, 2022, 97.4% of publicly held issues, or $15.74123.2 trillion, was marketable.
Unlike publicly held debt, intragovernmental debt issuances are almost exclusively nonmarketable. As of February 28, 2019April 30, 2022, of the $5.8656.5 trillion in total intragovernmental debt, $0.029 02 trillion (0.53%) was marketable debt. Intragovernmental debt is held by components of the federal government, with the majority of nonmarketable debt held by trust funds devoted to Social Security and military and federal worker retirements and marketable debt held by the Federal Financing Bank (a government corporation created to reduce the cost of federal borrowing). Intragovernmental debt has declined in recent years as major trust funds have begun to finance benefits from assets.
Because intragovernmental debt is held only in federal government accounts, such debt cannot be accessed by the outside institutions. Conversely, the bonds that finance publicly held debt activity may compete for assets in private and financial markets. Public debt issues may be a particularly attractive collateral option on the secondary market if the federal government is perceived as a safe credit risk.
Deficit Challenges Going Forward
The CBO budget baseline projects that over the next 10 years, the deficit will average roughly 4.4% of GDP. This is 1.5% of GDP more than the average deficit (i.e., 2.9% of GDP) over the preceding 50 yearsyears. Figure 7 shows the federal budget deficit (surplus) from FY1968FY1970 through projected deficits in FY2048.
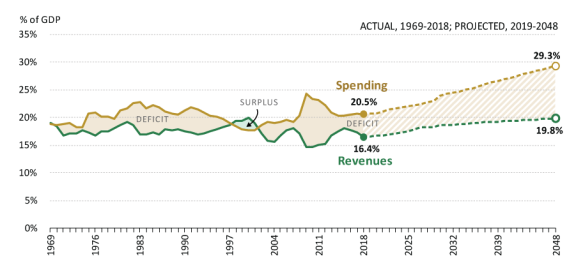
Most economists agree that deficits are sustainable as long as the deficits as a share of the economy are less than the growth rate of the economy. The CBO budget baseline assumes that economic growth will be just under 1.8% over the next 10 years. This growth rate is less than both the average deficit over the preceding 50 years (2.9% of GDP) and the projected federal deficits over the next 10 years (4.4% of GDP).
Although the budget situation over the next 10 years is challenging, the long-term outlook is even more daunting—with the budget deficit estimated to be an average of 8.411.5% of GDP from FY2039 to FY2048FY2041 to FY2051. As deficits are a result of the combination of spending and tax decisions, examining them separately may offer some insightsinsights. Figure 8 shows CBO'’s analysis of federal revenue and spending projected for selected years from FY2006 through FY2051.
Revenue trends in the long-run projections show continued growth in the share of federal revenue from the individual income tax. The share of federal revenue from the individual income tax is projected to increase from 49.6% in FY2019 to 53.7% in FY2031 and 55.7% in FY2051. During the same time period, the share of federal revenue from payroll taxes is projected to decrease from 35.9% in FY2019 to 33.2% in FY2031 and 30.5% in FY2051. The shares of federal revenue from the corporate income tax and other sources are roughly flat over the same time period.
Figure 8. Federal Revenue and Spending, Selected Years FY2006-FY2051, as a
Percentage of GDP
Source: Created by CRS. Data from CBO, The 2021 Long-Run Budget Outlook, March 2021.
Spending trends in the long-run projections show continued growth in the share of federal spending on Social Security and health programs. Spending on these categories is projected to increase from 48.7% of federal spending in FY2019 to 55.9% of federal spending in FY2031. During the same time period, other mandatory spending and discretionary spending is projected to decrease from 42.9% of federal spending in FY2019 to 33.7% of federal spending in FY2031. The FY2051 spending projections are presented for informational purposes only, as the underlying data are not comparable to the other years due to the Social Security projection incorporating the effects of the depletion of the Social Security Trust Fund.34
34 The Social Security trustees project that the asset reserves held by the Social Security trust funds will be depleted in 2034. At that point, the program will continue to operate with incoming receipts to the trust funds. Incoming receipts are projected to be sufficient to pay about three-fourths of scheduled benefits through the end of the projection period in 2095. See CRS Report RL33028, Social Security: The Trust Funds, by Barry F. Huston, for further information.
Congressional Research Service
19
link to page 25 Addressing the Long-Run Deficit: A Comparison of Approaches
Addressing the Long-Run Deficit
spending projected for FY2028 and FY2048 compared with the selected historical level of spending—showing total spending growing by 14.6% as a percentage of GDP in FY2028 and 42.2% in FY2048 compared with FY2018. Breaking down the categories shows projected spending increases on Social Security of 28.6% (1.4% of GDP),30 health programs of 76.9% (4.0% of GDP), and interest payments of 293.8% (4.7% of GDP) over the next 30 years. During the same period, other projected spending (including both defense and nondefense discretionary spending) is projected to decrease 14.6% (1.3% of GDP).
|
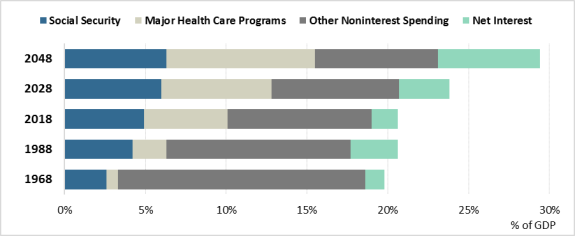 |
|
Source: CBO 2018 Long-Term Budget Outlook. |
The trend in the share of spending going toward Social Security and major health care programs and away from discretionary spending choices seen in Figure 8 is a continuation of the trend seen in Figure 3. In FY1988, 30.6% of federal spending went to Social Security and major health program spending. By FY2018, the share was 49.0% of the federal budget and is estimated to be 52.9% of the federal budget in FY2048. In addition, there is significant growth in the share of federal spending used to pay interest on the debt due to the continuing deficits and growing debt.
Similar to projected federal spending, federal revenue over the next 10 years is projected to grow above its 50-year average of 17.4% of GDP—assuming that the temporary provisions contained in P.L. 115-97 are allowed to expire as scheduled.31 As Figure 9 shows, CBO's projections of total federal revenue are projected to grow by 11.4% as a percentage of GDP in FY2028 and 19.3% in FY2048 compared with FY2018.
|
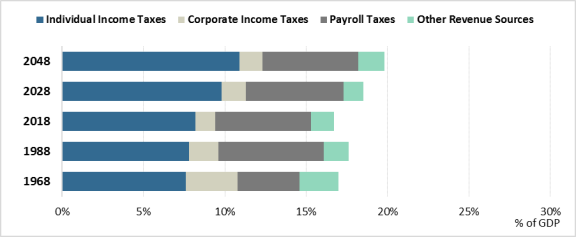 |
|
Source: CBO 2018 Long-Term Budget Outlook. |
The increasing reliance on personal income taxes as a revenue source, seen in Figure 9, is a continuation of the trend seen in Figure 5. In FY1988, 44.3% of federal revenue (8.2% of GDP) came from individual income taxes, and 10.2% of federal revenue (1.2% of GDP) came from corporate income taxes. By FY2018, the shares were 49.4% (9.8% of GDP) and 7.2% (1.5% of GDP) of federal revenue, respectively, and are estimated to be 55.1% (10.9% of GDP) and 7.1% (1.4% of GDP) of federal revenue in FY2048, respectively.
Addressing the Long-Run Deficit
The Timing of Deficit Reductions
The Timing of Deficit Reductions How much should be done to address the budget issues, and how quickly, is a topic of debate. The relative strength of the current U.S. economy makes a case for addressing the deficit in the near term. The faster the debt-to-GDP ratio grows, the more burdensome interest payments become and the more the debt compounds. In 2019, before the pandemic, CBO also projectedCBO also projects that a sustained reduction in the deficit to 1.98% of GDP would be required to stabilize debt at 78% of GDP, the level at that timeGDP, its current level, under the standard baseline, whereas a 3.02.9% cut would be required to bring debt to the average of the past 50 years (4142% of GDP). If the reduction is delayed for 5 years, the required decreases would be 2.32% and 3.65% of GDP; if delayed for 10 years, 2.97% and 4.4% of GDP.35
In its 2020 report, with the debt increasing to 98% as a result of the budgetary effects of the pandemic, and recognition of the issues involved with addressing the debt immediately, CBO projected the deficit must fall by 3.6% of GDP beginning in 2025 to achieve a stabilized debt of 79% by 2050. To achieve 100% (roughly the current level), it would have to fall by 2.9%.36 The 2021 report did not include this type of analysis.
However, addressing the deficit quickly, even in normal times,4.6% of GDP.32
However, addressing the deficit quickly may temporarily dampen economic activity. In addition, if the measures to address the deficit are implemented too quickly, some people may not have sufficient time to plan or adjust to the new set of rules.
The need to not move too slowly or quickly can also affect the optimal approaches to deficit reduction. For example, it is difficult to change current entitlements for the elderly (such as Social Security, Medicare, and part of Medicaid, which funds nursing home care). Many retired individuals have little leeway to adjust to such changes and could be particularly burdened by benefit reductions, which suggests that benefit changes be adopted in the near term but applicable to the future. Changing discretionary spending or increasing taxes can be achieved more quickly, although, as discussed below, the long-run gap between spending and taxes is too large to be addressed with discretionary spending revisions alone.
Deficits Under Alternative Baselines
In addition to its standard budget baseline, CBO also regularly analyzes the budgetary effects of different alternative baselines. One regularly estimated baseline maintains the current policies in place at the time of the estimate—referred to as a current policy baseline. This baseline is presented inIn 2019, CBO did not present details of interest, revenues, and deficits for the alternative scenario, and in 2020 and 2021 it did not present any data for the alternative scenario. These data for the two different baselines in the 2018 report are presented in Table 8 along with the standard—or current law—extended baseline.
35 Congressional Budget Office, The 2019 Long-Term Budget Outlook, June 2019, https://www.cbo.gov/publication/55331.
36 Congressional Budget Office, The 2020 Long-Term Budget Outlook, September 2020, https://www.cbo.gov/publication/56516.
Congressional Research Service
20
Addressing the Long-Run Deficit: A Comparison of Approaches
Table 8. Long-Run Federal Budget Projections Under Extended and Alternative
Extended Baselines, FY2018, FY2028, and FY2038, as a %Percentage of GDP
FY2018
FY2028
FY2038
of GDP
|
FY2018 |
FY2028 |
FY2038 |
|
Extended Baseline | |||
|
Spending other than interest |
19.0 |
20.6 |
22.0 |
|
Interest |
1.5 |
3.0 |
4.2 |
|
Revenues |
16.6 |
18.5 |
19.1 |
|
Debt |
78 |
96 |
118 |
(Current Law)
Spending other than interest
19.0%
20.6%
22.0%
Interest
1.5%
3.0%
4.2%
Revenues
16.6%
18.5%
19.1%
Debt
78%
96%
118%
Alternative Extended Baseline | |||
|
Spending other than interest |
19.0 |
21.1 |
22.7 |
|
Interest |
1.5 |
3.4 |
5.7 |
|
Revenues |
16.6 |
17.4 |
17.9 |
|
Debt |
78 |
105 |
148 |
Source: CBO (Current Policy)
Spending other than interest
19.0%
21.1%
22.7%
Interest
1.5%
3.4%
5.7%
Revenues
16.6%
17.4%
17.9%
Debt
78%
105%
148%
Source: CBO, Long-Term Budget Outlook Under Alternative Scenarios for Fiscal Policy, August 2018.
In 2019, CBO projected the debt as a percentage of GDP at 78% in FY2019, 92% in FY2029, and 144% in FY2049 for the extended baseline and at 105% in FY2029 and 219% in FY2049 under the alternative scenario.37 In 2021, CBO projected debt as a percentage of GDP at 102% in FY2021, 110% in FY2032, 15% in FY2042, and 195% in FY2050 for the extended baseline.38 The increased debt in the 2021 projection reflected in large part the effects of the pandemic and pandemic spending and tax cuts in 2020. The CBO report did not provide projections under the alternative baseline, and the projection did not include the additional $2 trillion of pandemic relief enacted shortly after the report was released. The Committee for a Responsible Federal Government (CRFG), however, prepared its own analysis under the alternative baseline, including the additional pandemic spending, and projected debt to reach 256% in 2051 (compared to 102% in the extended baseline). The CRFG also projected a deficit for 2051 of 17.6% of GDP in the alternative baseline, compared to 13.3% in the extended baseline.39 This difference reflected both increases in spending and decreases in taxes under the alternative baseline. Spending was projected to grow from 21% in FT2019 to 31.8% in FY2051, while taxes grow from 16.3% to 18.5%. Under CRFG’s analysis, spending would grow to 34.8% in FY2051 and taxes to 17.2%. There were no data presented on how much of the additional spending was due to interest and therefore could be traced in part to lower taxes.
These baselines differ in a number of ways. Revenues are lower under the alternative baseline as it assumes an extension of the individual income tax provisions of P.L. 115-97, which are scheduled to expire in 2026 under current law. In addition, noninterest spending is higher under the alternative baseline, which assumes limits on discretionary spending are not to take effect and the base for emergency spending is set at historical levels.
37 Congressional Budget Office, The 2019 Long-Term Budget Outlook, June 25, 2019, https://www.cbo.gov/publication/55331. 38 Congressional Budget Office, The 2021 Long-Term Budget Outlook, March 4, 2021, https://www.cbo.gov/publication/56977. 39 Committee for a Responsible Federal Government, Analysis of CBO’s March 2021 Long-Term Budget Outlook, March 4, 2021, https://www.crfb.org/sites/default/files/media/documents/Analysis%20of%20CBO%27s%20March%202021%20Long-Term%20Budget%20Outlook.pdf. Congressional Research Service 21 link to page 26 Addressing the Long-Run Deficit: A Comparison of Approaches Under the alternative baseline, deficit reduction becomes more difficult because debt and interest payments have grown more quickly.
Deficit Reduction Strategies
The Peter G. Peterson Foundation'’s 2015 Fiscal Summit (Solutions Initiative III) brought together the American Action Forum, the American Enterprise Institute, the Bipartisan Budget Center, the Center for American Progress, and the Economic Policy Institute to develop specific, "scoreable"“scoreable” policy proposals that would place the federal budget on a sustainable long-term path.3340 Each plan provided a roadmap to reduce budget deficits and stabilize the debt, although they differed in the details.
All of the plans aimed at reducing the debt-to-GDP ratio, but they varied in spending, taxes, and the deficit relative to output. For those plans in which measures were reported (for 2040), spending-to-GDP ratios ranged from 17.8% to 24.3%, whereas taxes-to-GDP ratios varied from 21.2% to 23.5%. The resulting fiscal outcomes ranged from a surplus of 4.5% to a deficit of 1.9%.
A debt level can still be sustainable with some continuing deficit. The deficit causes the debt to grow, but as long as it is not large enough to cause debt to grow faster than GDP, the debt-to-GDP ratio will be stable or in decline.34
41
Although summarizing the plans is beyond the scope of this report, Table 9 shows the five plans along with the contemporaneous (2015) CBO baseline projections and the most recent (2018) 2021) CBO baseline projection.
Table 9. Projected Budgetary Effects of Alternative Budget Plans in FY2040
as a Percentage of GDP
Spending 2040 Revenues 2040 Deficit 2040 Debt 2040
CBO Projection 2015
25.3%
19.4%
5.9%
103%
American Action Forum
17.8%
22.3%
-4.5%
15.9%
American Enterprise Institute
22.5%
21.2%
1.3%
62.7%
Bipartisan Policy Center
24.3%
21.3%
3.0%
75.5%
Center for American Progress
22.6%
23.2%
-0.6%
45.8%
Economic Policy Institute
25.4%
23.5%
1.9%
54.2%
CBO Projection 2021
26.9%
17.9%
9.1%
139.9%
SourcesTable 9. Projected Budgetary Effects of Alternative Budget Plans in FY2040 as a % of GDP
|
Spending 2040 |
Revenues 2040 |
Deficit 2040 |
Debt 2040 |
|
|
CBO Projection 2015 |
25.3 |
19.4 |
5.9 |
103 |
|
American Action Forum |
17.8 |
22.3 |
-4.5 |
15.9 |
|
American Enterprise Institute |
22.5 |
21.2 |
1.3 |
62.7 |
|
Bipartisan Policy Center |
24.3 |
21.3 |
3.0 |
75.5 |
|
Center for American Progress |
22.6 |
23.2 |
-0.6 |
45.8 |
|
Economic Policy Institute |
25.4 |
23.5 |
1.9 |
54.2 |
|
CBO Projection 2018 |
26.9 |
19.3 |
7.6 |
124 |
Source: 2015 Fiscal Policy Summit: Opportunity for America, The Solutions Initiative III, May 2015; Peter G. Peterson Foundation; and CBO , Long-Run Budget Projections June 2018, May 2021 and June 2015.
All of the proposed plans would have increased revenue collections relative to both CBO projections and reduced spending relative to the most recent CBO baseline.35
42 However, since the 40 Peter G. Peterson Foundation, 2015 Fiscal Summit: Opportunity for America, The Solutions Initiative III, May 2015, https://www.pgpf.org/sites/default/files/05122015_solutionsinitiative3_fullreport.pdf.
41 Specifically, a deficit that remains at the GDP growth rate times the ratio of debt to GDP would maintain a steady state growth. For example, if the debt is 70% of output and GDP grows at 5%, a deficit of 3.5% (5% times 0.7) will maintain a constant debt-to-GDP ratio. The primary deficit (deficit without interest) will be smaller and could require a surplus, depending on the relationship between the interest rate and the growth rate. The primary sustainable deficit is the ratio of debt to GDP times the growth rate minus the interest rate.
42 All but one proposal would have reduced spending relative to the CBO 2015 estimate.
Congressional Research Service
22
link to page 13 link to page 12 link to page 26 Addressing the Long-Run Deficit: A Comparison of Approaches
outlook for the deficit and debt have increased since 2015, the plans would not reach their projected effects because spending would be increased by additional interest payments on the debt.
Challenges to Reducing Budget Deficits Challenges to Reducing Budget Deficits
Discussions on how to reduce the budget deficit often begin narrowly, then expand to broader proposals. This section examines several of these more narrow beginnings to illustrate the challenges of reducing the deficit sufficiently to address the long-term challenge.
How Much Can Discretionary Spending Cuts Reduce the Budget Deficit?
Discretionary spending, as discussed above, whether for defense or nondefense purposes, does not cause long-run growth in spending and has historically been relatively constant or in decline as a percentage of GDP. Discretionary spending, however, is targeted as a source of budget savings in the proposals and, because it is easier to change in the short run, may be a source of initial savings. Caps on discretionary spending were the main source of projected deficit reduction enacted as part of the Budget Control Act of 2011 (BCA; P.L. 112-25).36
).43
The CBO baseline incorporates the reductions from the BCA through FY2021 and then assumes that discretionary spending will grow at the rate of inflation going forward. As shown in the historical analysis from Table 3 andand Figure 3, defensedefense and nondefense discretionary spending has been higher in the past, and hence cuts would lead to a lower level of government services than has traditionally been the case. (Defense spending, as noted above, also fluctuates depending on international conflicts, although it has increased to respond to perceived threats or other changes such as an all-volunteer force.)
At the same time, proposals presented in the Solutions Initiative III did not spell out the specific cuts proposed, an important issue given the diversity in the types of programs in defense and nondefense discretionary spending. That is, these plans generally directed agencies to cut spending without outlining the specifics. Thus, the plans did not indicate, for example, whether fewer prisons will exist, grants for special-needs children will be reduced, a smaller military was to be maintained, fewer highways will be built or repaired, etc. However, these reductions might have needed to be significant. For example, Solutions Initiative III plans proposed cuts to total discretionary spending that were on average 19% below the CBO baseline.
Nevertheless, it is unlikely that reductions in discretionary spending could close much of the long-run deficit gap. The Solutions Initiative III plans'’ proposed cuts in discretionary spending would have reduced overall discretionary spending by about 1.4 percentage points of GDP on average. Yet, as seen inin Table 9, CBOCBO estimated the gap between spending and taxes by FY2040 to be 5.9% of GDP, and it has subsequently grown to an estimated 7.69.1% of GDP. Thus, closing this gap is likely to require cuts in other spending, including entitlements, increases in tax revenues, or a combination thereof.
CBO's 2018
CBO’s 2020 study on budget options contained some specific options for cuts in discretionary spending, which might suggest the types of cuts that might be considered in these proposals, although most of these were small.37 For example, implementing the 10 largest discretionary options listed in the CBO report would reduce spending by up to $148.1 billion per year, or 0.7% of GDP. Doing so would, however, require reducing defense spending by 10%, eliminating the Section 8 housing voucher and the Head Start programs, and reducing federal highway funding by roughly 25% along with other program reductions. In contrast44 For example, implementing all of the nondefense discretionary options would reduce spending for FY2021-FY2032 by $183 billion, or 0.07% 43 See CRS Report R44874, The Budget Control Act: Frequently Asked Questions, by Grant A. Driessen and Megan S. Lynch; and CRS Report R42506, The Budget Control Act of 2011 as Amended: Budgetary Effects, by Grant A. Driessen and Marc Labonte, for more information on the BCA.
44 CBO, Options for Reducing the Deficit: 2021 to 2030, December 9, 2020, https://www.cbo.gov/publication/56783.
Congressional Research Service
23
link to page 20 link to page 21 Addressing the Long-Run Deficit: A Comparison of Approaches
0.7% of GDP. Doing so would, however, require eliminating Head Start, eliminating Pell grants for low-income students with any family support, eliminating funding for Amtrak and underserviced air transportation, reducing grants for states, and further reducing pay raises for federal employees below private-sector growth. Proposals for specific cuts in defense discretionary spending (including capping pay increases, limiting housing allowance, and reducing or delaying a range of weapons programs) were 0.03% of GDP (although a separate proposal for an across-the-board cut of 10% would reduce spending by around 0.3% of GDP once in place). Even with all of these, the Solutions Initiative III plans would have on average required reductions twicethree times as large.
Are Social Security and Medicare Hospital Insurance Trust Funds to Be Preserved?
Since its inception in the 1930s, Social Security has been financed through a trust fund mechanism in which benefits were financed from payroll tax contributions. Payroll taxes are imposed at a flat rate fixed in statute, with a cap on income covered that is indexed to wages. Because of increasing disparities in income, this ceiling falls lower in the income distribution than it has in the past. Benefits, although they are linked to contributions (e.g., lifetime payroll taxes), are progressive in that the replacement rate for wages falls as wages rise.
Because of the link between wages and benefits, many view Social Security like a pension, with income in retirement earned through contributions. With Social Security, there is a link between contributions and benefits. Because the trust fund does not accumulate retirement contributions in the same way as a pension plan (but rather pays most benefits out of current contributions), the trust fund'’s financing was affected by demographics. Currently, the trust fund is spending more in benefits than it collects in payroll taxes and uses interest earnings to fill the gap.38
45
Benefits, as shown inin Table 6, areare growing faster than payroll taxes. As a result, under current policy, the Social Security (OASI) trust fund has been using its assets and will become insolvent by 2034, at which point it will have income sufficient to pay about three-fourths of benefits.39 46 Moreover, if a position is taken that taxes cannot be increased (as discussed below) or that payroll tax collections are not to be increased, then either the close link between payroll contributions and earnings will have to be abandoned or the burden of restoring solvency will fall on cutting benefits (by roughly 25%).40
47
The plans presented in the Solutions Initiative III provide a range of alternatives. On average, they would have decreased Social Security spending by 3.2%, or 0.2% of GDP. While not quantified in the report, three of the five plans presented would have increased payroll taxes on higher earners.
CBO's 2018
CBO’s 2020 report identifies several options related to Social Security benefits and payroll taxes. The two largest options to reduce Social Security spending—lower initial benefit amounts and grow the benefits more slowly over timeraise the full retirement age to 70—were estimated to reduce Social Security spending by up to an average of 0.207% of GDP per year over the next 10 years.41 The two largest options to increase payroll tax collections—raise payroll tax rates48 Two common options to increase
45 The assets held by the trust fund are effectively borrowed by the rest of the government, but they are included in the intergovernmental debt shown in Figure 6.
46 See CRS Report RL33028, Social Security: The Trust Funds, by Barry F. Huston; and CRS Report RL33514, Social Security: What Would Happen If the Trust Funds Ran Out?, by William R. Morton and Barry F. Huston.
47 CRS Report RL32747, The Economic Implications of the Long-Term Federal Budget Outlook, by Marc Labonte. 48 As these options constrain growth, their effects will grow over time.
Congressional Research Service
24
Addressing the Long-Run Deficit: A Comparison of Approaches
payroll tax collections—raise payroll tax rates by two percentage points and increase the contributions cap—were estimated to raise up to 1.20.7% of GDP per year of payroll tax revenue over the next 10 years.
Another option, to tax earnings above $250,000 under the payroll tax, would increase revenues by 0.4%. Note that without changes to the benefit rules, increased coverage would also increase benefits in the future, partially offsetting the gains. CBO also provides an interactive tool to show the effect of policy options on Social Security.49 This tool includes several options which could be estimated separately or together: reducing benefits for individuals with moderate incomes (except for lower incomes), increasing the retirement age, indexing with a chained-CPI, raising the payroll tax rate, and increasing the earnings coverage. The benefit changes would not stabilize the trust fund for these policy options; however, a combination of benefit changes and increases in the tax rate and coverage could. The Medicare HI trust fund has been affected over time (as has Medicare in general) by demographics and, more importantly, by the growth in health care expenditures per capita due to technical advances and cultural expectations. The plans presented in the Solutions Initiative III provide a varied selection of options—though all advocated for various forms of cost containment.
CBO's 2018
CBO’s 2020 report identifies several options related to Medicare benefits and payroll taxes. The largest option to reduce Medicare spending—by increasing cost sharing and restricting Medigap insurance—was estimated to reduce Medicare spending by up to an average of 0.0503% of GDP per year over the next 10 years. Requiring larger manufacturers’ rebates for drugs would save 0.05% of GDP. The two largest options to raise revenue associated with Medicare—raising payroll tax rates and increasing premiums on Medicare PartParts B and D—were estimated to collectively raise up to 1.00.8% of GDP per year of payroll tax revenue over the next 10 years.
Can Long-Run Budget Issues Be Addressed by Keeping Tax Levels Constant?
One philosophy behind the viewpoint of keeping revenues fixed relative to GDP is that government spending takes away from private choices and creates inefficiency and that taxes impose distortions, inhibiting economic activity. (This viewpoint depends on strong assumptions about benefits generated by federal spending.) By limiting revenues available, the scope of the federal government would be constrained. An argument is also sometimes made that tax increases would inhibit economic activity so much that revenues would decline rather than rise. However, empirical evidence does not generally support this view.42
50
If revenues are limited, significant pressure would be placed on major entitlements. For example, Social Security, health spending, and interest alone are projected to total 19.2% of GDP in FY2040.4351 If revenues are around 19.4% of GDP, 0.2% of GDP is left for everything else. (In the CBO 2018 baseline, this amount was 0.1% of GDP.) The budget situation would be more constrained if current policies scheduled to expire are extended.4452 Defense, nondefense
49 Congressional Budget Office, How Changing Social Security Could Affect Beneficiaries and the System’s Finances, https://www.cbo.gov/publication/54868.
50 CRS Report R43381, Dynamic Scoring for Tax Legislation: A Review of Models, by Jane G. Gravelle, has a general overview of the empirical evidence on labor supply and savings.
51 CBO’s June 2018 report, The 2018 Long-Term Budget Outlook, is available at https://www.cbo.gov/publication/53919.
52 For example, under CBO’s extended alternative fiscal scenario, revenue would be 1.2% of GDP lower and spending 0.7% of GDP higher in 2038. See CBO’s The Long-Term Budget Outlook Under Alternative Scenarios for Fiscal Policy, at https://www.cbo.gov/publication/54325 for additional detail.
Congressional Research Service
25
link to page 26 Addressing the Long-Run Deficit: A Comparison of Approaches
Defense, nondefense discretionary, and other mandatory programs are projected to amount to 6.9% of GDP in FY2040 (7.6% of GDP in the CBO 2018 baseline). Thus, it would appear that major reductions in Social Security and health spending would be required to constrain tax levels at current percentages of GDP.
CBO estimates that to stabilize the Social Security Trust Fund for the next 75 years would require a 30% cut in benefits.53
The Solutions Initiative III proposals all choose to raise additional revenue, which reduces the required cutbacks in Social Security and health spending to address the long-run deficit. As seen inin Table 9, the proposals would have increased taxes as a percentage of output relative to the CBO 2015 baseline to an average of 22.0% of GDP (an increase of 2.3% of GDP relative to the 2015 CBO baseline). This additional revenue allows the Solutions Initiative III proposals to achieve their policy goal with reductions in Social Security and health care spending of 0.9% of GDP.
GDP.
Although the Solutions Initiative III plans and their approaches are illustrative, they are also suggestive of what would likely be necessary to hold the tax revenues fixed and address the long-run deficit: major changes to government programs for health care and other entitlements.
What Would Be Required to Protect Entitlements? A Review of Tax Options
To examine the other side of this coin, consider what would be required to protect entitlements. Protecting entitlements reflects the view that government should maintain its social safety net for lower-income persons and programs for the elderly, including provisions for health care, because they are important components of maintaining a reasonable standard of living.
The Social Security trust funds hold sizable assets, accumulated from prior years of cash surpluses that can be used to support the payment of future benefits. Medicare HI also has accumulated surpluses that will maintain benefits for some years to come. Nevertheless, neither of these plans is sustainable in its current formulation, and the shortfall in revenues relative to payments contributes to the overall deficit.
If maintaining these programs is the policy goal, taxes would need to be increased—as it is unlikely that discretionary spending or other non-entitlement spending alone would fully address the long-run deficit.
Justifications for Maintaining Entitlements
Is there a justification for increasing the size of government to continue the present Social Security and health benefit payments? It is useful to consider separately Social Security, whose issues arise from demographics, and health care, whose issues arise from a combination of demographics and health care costs.
Social Security benefits are expected to rise from the current 4.955.2% of output to 6.292% in FY2035.45 54 The problem with Social Security funding did not arise from the baby boom; it arose from the increase in life span whose pressures on the system were masked for a time by the growth in the labor force (both from the baby boom and the entry of women into the labor force). Unlike health care, Social Security benefits are not expected to grow continuously but to stabilize over time so
53 CBO, CBO’s 2021 Long-Term Projections for Social Security: Additional Information, July 8, 2021, https://www.cbo.gov/publication/57342.
54 CBO, CBO’s 2021 Long-Term Projections for Social Security: Additional Information, July 8, 2021, https://www.cbo.gov/publication/57342.
Congressional Research Service
26
Addressing the Long-Run Deficit: A Comparison of Approaches
that benefits and costs are relatively constant (with benefits around 6.3% and revenues about 4.4% of GDP). Therefore, a range of tax increases, as well as benefit cuts, could bring the program into permanent balance.
Social Security has been justified due to a number of market failures,4655 and given these justifications, a case can be made that solutions that raise taxes are more equitable than those that reduce benefits. A mixed option, which affects both taxes and benefits, would be to increase the retirement age, although such an increase would put pressure on the disability-insurance program because some individuals will find it more difficult to work longer and would disproportionally affect low-income workers.47
56
This assessment considers outcomes in the steady state. There is also the issue of which generation bears the burden during the transition. The more the system relies on tax increases as opposed to benefit cuts in the short and medium term, the more the burden is shifted to younger generations.4857 Similar life-cycle arguments could be applied to any program for the elderly—including Medicare and nursing home costs under Medicaid—to the extent that the program's ’s costs increase because of longevity. These programs are financed by a combination of payroll taxes and general revenues, but most of these taxes would be collected during most individuals' ’ working years.
Cost increases for health care are a different matter, in part because they seem to be growing continuously and in part because they can be viewed in different ways. To the extent that rising costs reflect better medical care that extends and improves the quality of life, spending more money on health care may appropriately reflect preferences of individuals whose higher incomes permit them to spend more of their resources in this area. However, to the extent that rising medical costs reflect serious inefficiencies in the system arising from failure to allocate resources by price and causing patients and their physicians to consume large and inefficient amounts of health care, then increased benefits may not be justified.
Revenue -Raising Options
If benefits are to be largely maintained, and because it is relatively clear that cutting other forms of spending will probably not be adequate, what are the tax options? Basically, these options, some of which are discussed in a number of the budget proposals, are
-
raising income tax rates,
- broadening the income tax base through reductions in tax expenditures,
- increasing other taxes (such as payroll and excise taxes), and
- introducing new taxes (such as a value-added tax or a carbon tax).
55 Market failures include imperfect life annuities that arise from adverse selection for private retirement plans (because those who expect to live a long time and have private information about this likelihood will be more likely to purchase annuities); moral hazard (if the government commits to support low-income individuals, individuals may not save for retirement and rely on poverty programs to support them in old age); and incomplete markets (inability to contract for risk-sharing across generations). In addition, limits on information, uncertainty, and myopia make it difficult for individuals to make optimal choices about saving for retirement on their own.
56 See CRS Report R44846, The Growing Gap in Life Expectancy by Income: Recent Evidence and Implications for the Social Security Retirement Age, by Katelin P. Isaacs and Sharmila Choudhury, for more information.
57 These generational issues are discussed in more detail in CRS Report R44763, Present Trends and the Evolution of Mandatory Spending, by D. Andrew Austin.
Congressional Research Service
27
Addressing the Long-Run Deficit: A Comparison of Approaches
Rates can easily be varied, and several of the proposals included in the CBO Budget Options incorporate rate changes. The barriers for rate increases might be viewed as largely political rather than technical, and top tax rates in the past have been much higher than they are today.49
58
Although tax expenditures have received much attention and eliminating or curtailing them have been included in various budget proposals, policymakers face significant political and technical barriers to implementing changes. Some tax expenditures are technically difficult to eliminate (especially employer fringe benefits), some are valued as part of the social safety net (such as the earned income credit or exclusion of transfers), some are desirable for other reasons, and some are so politically popular (e.g., the home mortgage interest deduction) that eliminating them or scaling them back could be difficult.50
59
For example, considering technical challenges alone, four of the Solutions Initiative III proposals would have eliminated or limited the exclusion of employer health insurance, the largest individual tax expenditure, which accounts for 11.910.1% of the total revenue forgone. If including these expenditures as income, fairly designing an inclusion is very difficult because the value of insurance varies, for example, with the employee'’s age and other characteristics. If not allowed to vary by age, young employees who work for firms with higher average employee ages will be imputed more income than employees working for firms with younger employees. Potentially more serious imputation problems arise with valuing the tax expenditure associated with defined benefit pension plans, which accounts for 7.25.6% of the total. Problems arise with regard to this tax expenditure because of defined benefit pension plans, whose benefits are difficult to allocate because they ultimately depend on future work history with the firm.
At the same time, the Solutions Initiative III proposals also envision eliminating a broad array of tax expenditures. If used to generate additional revenue, reducing tax expenditures could result in significant progress toward reducing the deficit. One study, for example, suggests that a more realistic appraisal of tax expenditure options, taking into account technical barriers, political barriers, and justification for some provisions, would increase income-tax revenues by about 15%.60
15%.51
Two other types of taxes that might be altered are the payroll and excise taxes. For example, some of the Solution Initiative III proposals would have raised or eliminated the cap on earnings for payroll taxes. Other options include raising rates and expanding the base to include fringe benefits, such as pension contributions and health care. (Imputing income, however, as noted above, may be problematic.) A number of options could significantly extend solvency to the
58 In 1986, the individual top tax rate was 50% and the corporate rate was 48% compared with current rates of 37% and 21%, respectively. Rates were even higher prior to that time, with top individual tax rates at 70% and even 90%.
59 For a discussion of these issues, both for individuals and corporations, see Jane G. Gravelle, “Practical Tax Reform for a More Efficient Income Tax,” Virginia Tax Review, vol. 30, no. 2, fall 2010, pp. 389-406.
60 Gravelle, “Practical Tax Reform.” Individual income-tax expenditures included lower dollar caps on mortgage interest deductions; disallowing mortgage interest deductions for vacation homes and home equity loans; ceilings on employer deductions for health insurance and care plans; a percentage of income cap for state and local taxes, along with disallowing personal property and sales taxes; taxing dividends at ordinary rates and taxing capital gains at higher rates; treating carried interest as ordinary income, including capital gains preferences in the alternative minimum tax; disallowing like-kind exchanges; disallowing capital gains treatment for timber, coal, and iron ore; repealing cafeteria plans; designating a percentage of income floor for charitable contributions; reducing deductions for gifts of appreciated property to basis; eliminating the charitable individual retirement account (IRA) rollover; taxing Social Security benefits as pensions; substituting a 25% credit for tax exempt bond exclusion; taxing inside buildup on insurance plans currently; and repealing IRAs for those covered by employer plans. This proposal would liberalize the capital gains exclusion for gain on owner-occupied housing.
Congressional Research Service
28
Addressing the Long-Run Deficit: A Comparison of Approaches
above, may be problematic.) A number of options could significantly extend solvency to the Social Security trust fund.5261 Revenue could also be raised by taxing Social Security benefits in the same way as pensions, and this revenue, although considered as part of tax expenditures, could be designated to finance Social Security benefits. In addition, proposals have included increases in gasoline taxes to provide additional funding for highways53highways62 and increases in alcohol taxes, whose real value has been declining since 1991.54
63
Finally, there are options for additional types of taxes. ThreeTwo new tax sources that have been included in the proposals are value-added taxes and carbon taxes (revenue could also be collected through an auction of carbon rights through a cap-and-trade system). Both value-added taxes and carbon taxes could raise significant amounts of additional revenues—$1.92.8 trillion and $1.1 01 trillion, respectively, over 10 years, according to CBO.55
64 These revenue sources differ in the incentives they create and also in their progressivity. Because income taxes tend to fall more heavily than other taxes on high-income individuals and tax expenditures tend to benefit higher-income individuals, these changes would likely add to the progressivity of the system. Changes in payroll rates would tend to be proportional and affect higher-income individuals less, although raising the wage cap would concentrate the effect on higher-income workers. Flat-rate consumption taxes, including value-added taxes, carbon taxes, and specific excise taxes (such as those on gasoline, alcohol, and sugared beverages) tend to be regressive. A combination of changes could, however, achieve approximately the same distribution as current revenues.
Effects on State and Local Governments
To what extent, if any, the Solutions Initiative III proposals would have reduced transfers to state and local governments was not generally specified. This is because the details of discretionary spending (other than caps and limits) was done at a highly aggregated level. As these were not generally spelled out, some of these reductions could have reduced transfers to state and local governments in areas such as education, transportation, and community development where states directly provide the services. In addition, the state and local governments administer many entitlements, for both health and income security, with federal transfers. Two of the Solutions Initiative III proposals would have reduced federal transfers to the statestates for Medicaid. As noted above, federal transfers to state and local governments are 2.8% of output and constitute 33%about a fifth of the receipts of these governments. State and local governments also benefit from tax expenditures that allow itemized deductions for state and local taxes and exclusions for interest on state and local bonds.5665 Depending on how these governments respond, restrictions that affect state and local transfers could largely shift the burden of spending from federal to subnational governments.
61 CBO, Social Security Policy Options, 2015, December 15, 2015, https://www.cbo.gov/publication/51011. 62 CRS Report RL30304, The Federal Excise Tax on Motor Fuels and the Highway Trust Fund: Current Law and Legislative History, by Sean Lowry.
63 CRS Report R43350, Alcohol Excise Taxes: Current Law and Economic Analysis, by Sean Lowry. 64 CBO, Options for Reducing the Deficit: 2021 to 2030, December 9, 2020, https://www.cbo.gov/publication/56783. 65 The value of these tax expenditures were reduced by P.L. 115-97. See CRS In Focus IF11098, 2019 Tax Filing Season (2018 Tax Year): The State and Local Tax Deduction, by Grant A. Driessen and Joseph S. Hughes; and CRS Report RL30638, Tax-Exempt Bonds: A Description of State and Local Government Debt, by Grant A. Driessen, for further information.
Congressional Research Service
29
Addressing the Long-Run Deficit: A Comparison of Approaches
Author Information
Jane G. Gravelle
Donald J. Marples
Senior Specialist in Economic Policy
Specialist in Public Finance
Disclaimer
This document was prepared by the Congressional Research Service (CRS). CRS serves as nonpartisan shared staff to congressional committees and Members of Congress. It operates solely at the behest of and under the direction of Congress. Information in a CRS Report should not be relied upon for purposes other than public understanding of information that has been provided by CRS to Members of Congress in connection with CRS’s institutional role. CRS Reports, as a work of the United States Government, are not subject to copyright protection in the United States. Any CRS Report may be reproduced and distributed in its entirety without permission from CRS. However, as a CRS Report may include copyrighted images or material from a third party, you may need to obtain the permission of the copyright holder if you wish to copy or otherwise use copyrighted material.
Congressional Research Service
R45717 · VERSION 4 · UPDATED
30 state and local transfers could largely shift the burden of spending from federal to subnational governments.
Author Contact Information
Footnotes
| 1. |
See CRS Report R45202, The Federal Budget: Overview and Issues for FY2019 and Beyond, by Grant A. Driessen, for detailed information on the federal budget. |
| 2. |
Some economists have argued that the growing level of debt will not only interfere with economic growth, but lead to a fiscal crisis where the United States loses access to credit markets. Others have suggested that too much attention is currently placed on the long-run outlook for the debt, particularly given low interest rates, and concerns about the long-run debt have limited worthwhile investments in education, infrastructure, and health and that these low interest rates mean that these fiscal constraints can be ignored. See Jason Furman and Lawrence H. Summers, "Who's Afraid of Budget Deficits?" Foreign Affairs, March/April 2019, at https://www.foreignaffairs.com/articles/2019-01-27/whos-afraid-budget-deficits, for a discussion of these issues. They point out that there is no evidence that the United States will face a fiscal crisis but acknowledge that the debt cannot be allowed to grow forever. They suggest a middle road of ensuring that new spending and tax cuts do not add to the deficit in nonrecession years and that existing public services over time will require more revenues. |
| 3. |
For further discussion of the unsustainability of the federal budget trajectory, see Congressional Budget Office (CBO), The Budget and Economic Outlook: 2018 to 2028, April 2018, https://www.cbo.gov/publication/53651. |
| 4. |
A pure public good is one for which there is no marginal cost to an additional consumer and is non-excludible. The classic example is a lighthouse, but the most important one in terms of federal spending is national defense. Quasi-public goods do not necessarily have these pure characteristics, but they experience large spillover effects. For example, it is possible to charge subscriptions for fire protection, but subscribers benefit from putting out fires in adjacent properties. Allowing a nonsubscriber's property to burn is not only generally viewed as unacceptable (especially if lives are at risk) but also endangers other properties and their inhabitants. |
| 5. |
A market failure is not the lack of a market but the failure of a market to achieve the optimal outcome in which marginal costs equal marginal benefits. Market failures are ubiquitous, and many such failures may be too small or too difficult to correct to justify government intervention. Market failures arise from many sources, including externalities, monopoly power, imperfect information, and incomplete markets (in which contracts cannot be made, such as those between generations). Some kinds of insurance, in particular, tend to suffer from many market failures. A large part of federal government spending relates to insurance against various contingencies, such as spending on Social Security, unemployment, and health. |
| 6. |
See U.S. Census Bureau, 2016 State and Local Government Finances, October 18, 2018, https://www.census.gov/data/datasets/2016/econ/local/public-use-datasets.html. |
| 7. |
Data in this section are from the Bureau of Economic Analysis (BEA), "National Income and Product Accounts," Tables 1.1.5 and 3.3, https://apps.bea.gov/iTable/index_nipa.cfm. Note that some numbers may not add up due to rounding. |
| 8. |
These goods include goods such as national defense, infrastructure provided by the corps of engineers, the federal courts and prisons, the national forestry service and national parks, embassies and consulates in other countries, and similar goods. |
| 9. |
Data from Bureau of Labor Statistics (BLS), Establishment Data, Table B-3, https://www.bls.gov/news.release/empsit.t19.htm. |
| 10. |
See also CRS Report RL34424, The Budget Control Act and Trends in Discretionary Spending, by D. Andrew Austin. |
| 11. |
Calculations are based on CBO, The Budget and Economic Outlook, Fiscal Years 2019 -2029, January 2019, https://www.cbo.gov/system/files/2019-03/54918-Outlook-3.pdf. |
| 12. |
See CRS Report R44641, Trends in Mandatory Spending: In Brief, by D. Andrew Austin; and CRS Report R44763, Present Trends and the Evolution of Mandatory Spending, by D. Andrew Austin. |
| 13. |
See CRS Report R41726, Discretionary Budget Authority by Subfunction: An Overview, by D. Andrew Austin, for additional detail. |
| 14. |
See CRS Report R45145, Overview of the Federal Tax System in 2018, by Molly F. Sherlock and Donald J. Marples, for additional detail on the sources of revenues, their growth over time, and tax structure. |
| 15. |
Other sources include estate and gift taxes, customs duties and fees, and deposits of earnings by the Federal Reserve System. |
| 16. |
Bracket creep refers to the increase in the effective tax rate as nominal income grows because exemptions and rate brackets were not indexed for inflation at that time. There is also some amount of real bracket creep that causes effective tax rates to rise over time as real income grows. |
| 17. |
The Medicare Payment Advisory Commission (MedPAC), REPORT TO THE CONGRESS: Medicare Payment Policy, March 2019, http://medpac.gov/docs/default-source/reports/mar19_medpac_entirereport_sec.pdf?sfvrsn=0. |
| 18. |
GAO, Tax Expenditures Represent a Substantial Federal Commitment and Need to be Reviewed, GAO-05-690, September 2005, http://www.gao.gov/new.items/d05690.pdf. |
| 19. |
Joint Committee on Taxation (JCT), Estimates of Federal Tax Expenditures for Fiscal Years 2007-2011, September 24, 2007, JCS-3-07, https://www.jct.gov/publications.html?func=startdown&id=1198. |
| 20. |
Joint Committee on Taxation (JCT), Estimates of Federal Tax Expenditures for Fiscal Years 2018-2022, October 4, 2018, JCX-81-18, https://www.jct.gov/publications.html?func=startdown&id=5148. Estimates of GDP from CBO, The Budget and Economic Outlook, 2019-2029, January 28, 2019. |
| 21. |
The 12 largest trust funds are Social Security (including Old-Age and Survivors Insurance and Disability Insurance), Medicare (including Supplementary Medical Insurance and Hospital Insurance), Civil Service Retirement and Disability, Military Retirement, Unemployment Insurance, Highway, Federal Employees Health Benefits, Foreign Military Sales, Airport and Airway, and Railroad Retirement. |
| 22. |
Transfers are made to the Social Security and Medicare HI trust funds in the amount of income taxes collected on Social Security benefits. A temporary transfer was also made for the temporary two-percentage-point reduction in the employee share of Social Security taxes for 2011 and 2012. |
| 23. |
See CRS Report RL33028, Social Security: The Trust Funds, by Barry F. Huston; and CRS Report R40425, Medicare Primer, coordinated by Patricia A. Davis, for further details on the history of these programs. |
| 24. |
See CRS Report R41436, Medicare Financing, by Patricia A. Davis; and CRS Report R43122, Medicare Financial Status: In Brief, by Patricia A. Davis. |
| 25. |
See CRS Report RL33028, Social Security: The Trust Funds, by Barry F. Huston, for additional discussion. |
| 26. |
See CRS Report RS20946, Medicare: Insolvency Projections, by Patricia A. Davis; and CRS Report R43122, Medicare Financial Status: In Brief, by Patricia A. Davis, for additional discussion. |
| 27. |
Money can be moved from the general fund to the trust funds, as in the case of income taxes on Social Security benefits, but such actions may weaken the relationship between benefits and payments in the underlying programs. |
| 28. |
The Bureau of the Fiscal Service, Monthly Statement of the Public Debt of the United States, February 28, 2019, https://www.treasurydirect.gov/govt/reports/pd/mspd/2019/opds022019.pdf. |
| 29. |
CRS Report R41811, State and Local Government Series (SLGS) Treasury Debt: A Description, by Grant A. Driessen and Jeffrey M. Stupak. |
| 30. |
The Social Security trustees project that the asset reserves held by the Social Security trust funds will be depleted in 2035. At that point, the program will continue to operate with incoming receipts to the trust funds. Incoming receipts are projected to be sufficient to pay about three-fourths of scheduled benefits through the end of the projection period in 2093. See CRS Report RL33028, Social Security: The Trust Funds, by Barry F. Huston, for further information. |
| 31. |
See CRS Report R45092, The 2017 Tax Revision (P.L. 115-97): Comparison to 2017 Tax Law, coordinated by Molly F. Sherlock and Donald J. Marples, for a detailed look at the provisions in P.L. 115-97, and U.S. Congress, Joint Committee on Taxation, Estimated Budget Effects Of The Conference Agreement For H.R.1, The "Tax Cuts And Jobs Act", committee print, 115th Cong., December 18, 2017, JCX-67-17, for the estimated revenue effects. |
| 32. |
Congressional Budget Office, The 2018 Long-Term Budget Outlook, June 2018, https://www.cbo.gov/system/files?file=2018-06/53919-2018ltbo.pdf. |
| 33. |
Peter G. Peterson Foundation, 2015 Fiscal Summit: Opportunity for America, The Solutions Initiative III, May 2015, https://www.pgpf.org/sites/default/files/05122015_solutionsinitiative3_fullreport.pdf. |
| 34. |
Specifically, a deficit that remains at the GDP growth rate times the ratio of debt to GDP would maintain a steady state growth. For example, if the debt is 70% of output and GDP grows at 5%, a deficit of 3.5% (5% times 0.7) will maintain a constant debt-to-GDP ratio. The primary deficit (deficit without interest) will be smaller and could require a surplus, depending on the relationship between the interest rate and the growth rate. The primary sustainable deficit is the ratio of debt to GDP times the growth rate minus the interest rate. |
| 35. |
All but one proposal would have reduced spending relative to the CBO 2015 estimate. |
| 36. |
See CRS Report R44874, The Budget Control Act: Frequently Asked Questions, by Grant A. Driessen and Megan S. Lynch; and CRS Report R42506, The Budget Control Act of 2011 as Amended: Budgetary Effects, by Grant A. Driessen and Marc Labonte, for more information on the BCA. |
| 37. |
CBO, Options for Reducing the Deficit: 2019 to 2028, December 13, 2018, https://www.cbo.gov/publication/54667. |
| 38. |
|
| 39. |
See CRS Report RL33028, Social Security: The Trust Funds, by Barry F. Huston; and CRS Report RL33514, Social Security: What Would Happen If the Trust Funds Ran Out?, by William R. Morton and Barry F. Huston. |
| 40. |
CRS Report RL32747, The Economic Implications of the Long-Term Federal Budget Outlook, by Marc Labonte. |
| 41. |
As these options constrain growth, their effects will grow over time. |
| 42. |
CRS Report R43381, Dynamic Scoring for Tax Legislation: A Review of Models, by Jane G. Gravelle, has a general overview of the empirical evidence on labor supply and savings. |
| 43. |
CBO's June 2018 report, The 2018 Long-Term Budget Outlook, is available at https://www.cbo.gov/publication/53919. |
| 44. |
For example, under CBO's extended alternative fiscal scenario, revenue would be 1.2% of GDP lower and spending 0.7% of GDP higher in 2038. See CBO's The Long-Term Budget Outlook Under Alternative Scenarios for Fiscal Policy, at https://www.cbo.gov/publication/54325 for additional detail. |
| 45. |
CBO, CBO's 2018 Long-Term Projections for Social Security: Additional Information, September 6, 2018, https://www.cbo.gov/publication/54428. |
| 46. |
Market failures include imperfect life annuities that arise from adverse selection for private retirement plans (because those who expect to live a long time and have private information about this likelihood will be more likely to purchase annuities); moral hazard (if the government commits to support low-income individuals, individuals may not save for retirement and rely on poverty programs to support them in old age); and incomplete markets (inability to contract for risk-sharing across generations). In addition, limits on information, uncertainty, and myopia make it difficult for individuals to make optimal choices about saving for retirement on their own. |
| 47. |
See CRS Report R44846, The Growing Gap in Life Expectancy by Income: Recent Evidence and Implications for the Social Security Retirement Age, by Katelin P. Isaacs and Sharmila Choudhury, for more information. |
| 48. |
These generational issues are discussed in more detail in CRS Report R44763, Present Trends and the Evolution of Mandatory Spending, by D. Andrew Austin. |
| 49. |
In 1986, the individual top tax rate was 50% and the corporate rate was 48% compared with current rates of 37% and 21%, respectively. Rates were even higher prior to that time, with top individual tax rates at 70% and even 90%. |
| 50. |
For a discussion of these issues, both for individuals and corporations, see Jane G. Gravelle, "Practical Tax Reform for a More Efficient Income Tax," Virginia Tax Review, vol. 30, no. 2, fall 2010, pp. 389-406. |
| 51. |
Gravelle, "Practical Tax Reform." Individual income-tax expenditures included lower dollar caps on mortgage interest deductions; disallowing mortgage interest deductions for vacation homes and home equity loans; ceilings on employer deductions for health insurance and care plans; a percentage of income cap for state and local taxes, along with disallowing personal property and sales taxes; taxing dividends at ordinary rates and taxing capital gains at higher rates; treating carried interest as ordinary income, including capital gains preferences in the alternative minimum tax; disallowing like-kind exchanges; disallowing capital gains treatment for timber, coal, and iron ore; repealing cafeteria plans; designating a percentage of income floor for charitable contributions; reducing deductions for gifts of appreciated property to basis; eliminating the charitable individual retirement account (IRA) rollover; taxing Social Security benefits as pensions; substituting a 25% credit for tax exempt bond exclusion; taxing inside buildup on insurance plans currently; and repealing IRAs for those covered by employer plans. This proposal would liberalize the capital gains exclusion for gain on owner-occupied housing. |
| 52. |
CBO, Social Security Policy Options, 2015, December 15, 2015, https://www.cbo.gov/publication/51011. |
| 53. |
CRS Report RL30304, The Federal Excise Tax on Motor Fuels and the Highway Trust Fund: Current Law and Legislative History, by Sean Lowry. |
| 54. |
CRS Report R43350, Alcohol Excise Taxes: Current Law and Economic Analysis, by Sean Lowry. |
| 55. |
CBO, Options for Reducing the Deficit: 2019 to 2028, December 13, 2018, https://www.cbo.gov/publication/54667. |
| 56. |
The value of these tax expenditures were reduced by P.L. 115-97. See CRS In Focus IF11098, 2019 Tax Filing Season (2018 Tax Year): The State and Local Tax Deduction, by Grant A. Driessen and Joseph S. Hughes; and CRS Report RL30638, Tax-Exempt Bonds: A Description of State and Local Government Debt, by Grant A. Driessen, for further information. |