Discretionary Budget Authority by Subfunction: An Overview
Changes from June 7, 2017 to August 25, 2023
This page shows textual changes in the document between the two versions indicated in the dates above. Textual matter removed in the later version is indicated with red strikethrough and textual matter added in the later version is indicated with blue.
Contents
- Introduction
- Overview of Recent Discretionary Spending
- The Budget Control Act of 2011
- Congress Has Modified BCA Caps to Mitigate Fiscal Stringency
- Federal Budget Data and Concepts
- OMB Budget Data
- Negative Budget Authority
- Federal Credit Programs
- Background on Functional Categories
- Historical Spending Trends
- Defense and International Affairs
- Cold War, Peace Dividend, and the Global War on Terror
- Defense Funding Outside of the Department of Defense
- International Affairs
- Domestic Social Programs
- Non-Defense Security and Non-Security Spending Diverge After 9/11
- The Recovery Act
- Education, Training, Employment, and Social Services
- Federal Health Programs
- Income Security
- Social Security
- Veterans' Benefits and Services
- Physical Resources
- Energy
- Natural Resources and Environment
- Commerce and Housing Credit
- Transportation
- Community and Regional Development
- Other Federal Functions
- General Science, Space, and Technology
- Agriculture
- Administration of Justice
- General Government
Figures
- Figure 1. Discretionary Defense and Non-Defense Spending
- Figure 2. National Defense (050) Subfunctions
- Figure 3. International Affairs (150) Subfunctions
- Figure 4. Security and Non-Security Funding Trends
- Figure 5. Education, Training, Employment, and Social Services (500) Subfunctions
- Figure 6. Federal Health Care
- Figure 7. Income Security (600) Subfunctions
- Figure 8. Social Security (650) Subfunction
- Figure 9. Veterans Benefits and Services (700) Subfunctions
- Figure 10. Energy (270) Subfunctions
- Figure 11. Natural Resources and Environment (300) Subfunctions
- Figure 12. Commerce and Housing Credit (370) Subfunctions
- Figure 13. Transportation (400) Subfunctions
- Figure 14. Community and Regional Development (450) Subfunctions
- Figure 15. General Science, Space, and Technology (250) Subfunctions
- Figure 16. Agriculture (350) Subfunctions
- Figure 17. Administration of Justice (750) Subfunctions
- Figure 18. General Government (800) Subfunctions
Summary
Discretionary Budget Authority by
August 25, 2023
Subfunction: An Overview
D. Andrew Austin
This report provides a graphical overview of historical trends in discretionary budget authority
Analyst in Economic Policy
(BA) from FY1977 through FY2016FY2022, preliminary estimates for FY2017FY2023 spending, and the levels
reflecting the President'’s proposals for FY2018FY2024 through FY2022FY2028 using data from the FY2018 FY2024 budget submission released on May 23, 2017in March 2023. This report, by illustrating trends in broad budgetary
categories, provides a starting point for discussions about fiscal priorities. Other CRS products analyze spending trends in specific functional areas. As the 118th Congress considers the FY2024 budget, past spending trends may help frame policy discussions. Other CRS products analyze funding for specific agencies, program areas, or appropriations bills.
Functional categories (e.g., national defense, agriculture, etc.) provide a means to compare federal funding for activities within broad policy areas that often cut across several federal agencies. Subfunction categories provide a finer division of funding levels within narrower policy areas. Budget function categories are used within the budget resolution and for other purposes, such as estimates of tax expenditures. Spending in this report is measured and illustrated in terms of discretionary budget authority as a percentage of gross domestic product (GDP). Measuring spending as a percentage of GDP in effect controls for inflation and population increases. A flat line on such graphs indicates that spending has increased at the same rate as overall economic growth. In some cases, rescissions, offsetting receipts, or budgetary scorekeeping adjustments can result in negative budget authority.
Discretionary spending is provided and controlled through appropriations acts, which provide budget authority to federal agencies to fund many of the activities commonly associated with such federal government functions such as running executive branch agencies, congressional offices and agencies, and international operations of the government. Essentially all spending on federal wages and salaries is discretionary. Administrative costs for entitlement programs such as Social Security are generally funded by discretionary spending, while mandatory spending—not shown in figures presented in this report—generally funds the benefits provided through those programs. For some federal programs, such as surface transportation, the division of funding into discretionary and mandatory categories can be complex.
Spending caps and budget enforcement mechanisms established in the this report’s figures—generally funds the program benefits. The division of funding into discretionary and mandatory categories for surface transportation, however, is complex.
Statutory caps on discretionary spending were originally set in the Budget Enforcement Act of 1990 (BEA; P.L. 101-508), which also limited mandatory spending and revenue reductions. Those caps were extended through the 1990s, but expired shortly after the attacks of September 11, 2001. Both defense and nondefense discretionary spending grew more rapidly in the following decade compared to the 1990s. The Budget Control Act of 2011 (P.L. 112-25; BCA) strongly affected recent budgets. The BCA set discretionary spending caps on defense (budget function 050) and non-defense funding and created a formula to lower those caps to achieve a portion of spending cuts called for in the BCA. Congress modified BCA caps several times, first for FY2013 as part of the fiscal cliff deal at the start of January 2013 (American Taxpayer Relief Act of 2012; P.L. 112-240), then through the Bipartisan Budget Act of 2013 (BBA2013; P.L. 113-67) and the Bipartisan Budget Act of 2015 (P.L. 114-74), thus avoiding decreases in levels of discretionary funding. The Trump Administration has proposed changes in BCA caps to allow higher defense spending and to constrain non-defense spending.
A first continuing resolution (P.L. 114-223) was enacted on September 29, 2016, which provides discretionary funding through December 9, 2016. A second continuing resolution (P.L. 114-254), enacted on December 10, 2016, extended funding through April 28, 2017. A stopgap funding measure (P.L. 115-30) was enacted on April 28, 2017. An omnibus appropriations measure (P.L. 115-31) enacted on May 5, 2017, provided funding for the remainder of FY2017.
As the 115th Congress begins consideration of the FY2018 budget, past spending trends may help frame policy discussions. For example, rapid growth in national defense and other security spending during the past decade, along with the fiscal consequences and responses to the 2007-2009 Great Recession, has played an important role in fiscal discussions. Since FY2010, base defense discretionary spending has essentially been held flat and non-defense discretionary spending has been reduced significantly. The base defense budget excludes war funding (Overseas Contingency Operations/Global War on Terror). While war funding levels are well below those of the last decade, they still represent significant commitments of federal resources.
Introduction
This report presents figures showing trends in discretionary budget authority as a percentage of gross domestic product (GDP) by subfunction within each of 17 budget function categories, using data from President Trump's FY2018Joseph R. Biden’s FY2024 budget submission.11 This report provides a graphical overview of historical trends in discretionary budget authority from FY1977 through FY2016FY2022, estimates for FY2017FY2023 spending, and the levels consistent with the President'’s proposals for FY2024for FY2018 through FY2022.2FY2028.2 Spending in this report is shown as a percentage of GDP to control for the effects of inflation, population growth, and growth in per capita income.33 Past spending trends may prove useful in framing policy discussions as the 115th118th Congress prepares to confront a new set of challenges aswhile it considers a federal budget for FY2018.
Discretionary spending is provided and controlled through appropriations acts. These acts fundFY2024.
Budget Concepts and Discretionary Spending Appropriations acts provide and control discretionary spending,4 which funds many of the activities commonly associated with federal government functions, such as running executive branch agencies, congressional offices and agencies, and international operations of the government.5 Mandatory spending, which is provided by other kinds of acts, supportsgovernment.4 Thus, the figures showing trends in discretionary budget authority (BA) presented below do not reflect the much larger expenditures on various program benefits supported by mandatory spending. For some program areas, such as surface transportationhighway and mass transportation funding, the division of expendituresspending into discretionary and mandatory categories can be complex.
is more complex.
Discretionary spending in this report is measured in terms of BA. Budget authority for an agency has been compared to having funds in a checking account. Funds are availablebudget authority (BA). An agency head with BA can obligate the federal government to make payments, subject to congressional restrictions, for contractors, employees, or grantees to carry out the goals set in legislation. restrictions, and can be used to enter into obligations such as contracts or hiring personnel. Outlays occur when the U.S. Treasury disburses funds to honor those obligations. Thus, outlays follow BA with a lag. ForOutlays for personnel costs, lags are generally short and outlays mostly occur in the same year that BA is provided. Forprovided, but for large and complex projects, outlays may be spread over several years. Nearly all budget authorityBA eventually results in outlays, although some. In some cases, BA expires without being used. For instance, an agency might have difficulty in hiring personnel with the right qualifications or in finding a contractor with appropriate capabilities or a contract might cost less than anticipated. In a few cases, major federal initiatives were later curtailed or cancelled, resulting in the rescission of BA. For instance, most funding for the Carter Administration'’s synthetic fuels program and the Obama Administration'Administration’s plans for high-speed rail did not result in outlays.
1 The President’s FY2024 budget (http://www.whitehouse.gov/omb/budget/) was released on March 9, 2023. Because the final FY2023 appropriations measure was enacted in December 2022, spending levels for that fiscal year reflect those in an earlier continuing resolution.
2 The start of the federal fiscal year was changed from July 1 to October 1 in 1976 to accommodate changes in the congressional budget process. The figures omit data for the transition quarter (July 1 to September 30, 1976).
3 The Bureau of Economic Analysis (BEA) released a major revision to national income accounts in July 2013, which showed somewhat higher levels of national income and thus slightly reduced government spending as a share of GDP. See Stephanie H. McCulla, Alyssa E. Holdren, and Shelly Smith, “Improved Estimates of the National Income and Product Accounts: Results of the 2013 Comprehensive Revision,” Survey of Current Business, September 2013, pp. 14-45, http://bea.gov/scb/pdf/2013/09%20September/0913_comprehensive_nipa_revision.pdf.
4 In some cases, Congress has specified that some funding provided in a nonappropriations act be classified as discretionary. Section 23008 of the CARES Act of 2020 (P.L. 116-136) specified that certain funding in Title B be designated as discretionary, although that measure was an authorizing act.
5 For a broader analysis of discretionary spending, see CRS Report RL34424, The Budget Control Act and Trends in Discretionary Spending, by D. Andrew Austin.
Congressional Research Service
1
Discretionary Budget Authority by Subfunction: An Overview
In some cases, changes in funding levels recorded in historical budget data reflect changes in budgetary concepts or the budgetary treatment of some types of spending. For example, the Federal Credit Reform Act of 1990 (P.L. 101-508) changed the budgetary treatment of federal loan and other credit programs starting in FY1992.
Budget Policy and Discretionary Spending Discussions about the appropriate levels of spending for various policy objectives of the federal government have always played an important role in congressional deliberations over funding measures in the last several years. For example, rapid growth in national defense and other security spending in the past decade has played an important role in fiscal discussions. In particular, concerns about the trajectory of fiscal policymeasures. For example, concerns about the trajectory of fiscal policy after the financial crisis of 2007-2009 led to the reestablishment of enforceable statutory caps on discretionary funding in the 2011 Budget Control Act (P.L. 112-25).
Funding for FY2017 was first provided by a continuing resolution (P.L. 114-223) enacted on September 29, 2016, which provided discretionary funding through December 9, 2016, and included a 0.496% across-the-board reduction relative to the previous fiscal year's levels for most federal programs. A second). More recently, the scale of fiscal responses to the COVID-19 pandemic prompted renewed discussions over federal fiscal policy. Moreover, how the growth of social insurance and health program spending, mostly funded through mandatory spending, has shaped the federal budget and its future fiscal trajectory has also been an issue of concern.
Funding for FY2023 was first provided by a continuing resolution (P.L. 114-254) was enacted on December 10, 2016, that extended funding through April 28, 2017. A one-week stopgap funding measure (P.L. 115-30) was enacted on April 28, 2017. An omnibus appropriations measure (P.L. 115-31) enacted on May 5, 2017, provided funding for the remainder of FY2017.
Overview of Recent Discretionary Spending
Spending caps and associated budget enforcement mechanisms, along with modifications of BCA provisions, framed policy discussions during recent budget cycles. Fiscal policy became a central concern of Congress in the wake of the 2007-2009 Great Recession.P.L. 117-180) that included supplemental appropriations to support Ukraine’s defense against the Russian invasion. After two one-week continuing resolutions (P.L. 117-229 and P.L. 117-264) were enacted in December 2022, a final appropriations measure (P.L. 117-328) for FY2023 was enacted on December 29, 2022. According to Congressional Budget Office (CBO) estimates, the act provided $1,715 billion in discretionary BA.6
The enactment of final FY2023 appropriations at the end of December 2022, rather than before the start of the fiscal year on October 1, 2022, hinders OMB’s ability to estimate current budget year amounts in the Administration’s FY2024 budget submission.7
A 2023 act (Fiscal Responsibility Act; P.L. 118-5) that suspended the federal debt limit also set new statutory caps on discretionary spending for FY2024 and FY2025.
Overview of Recent Discretionary Spending Federal fiscal policy in the past two decades has been shaped by two severe shocks, as noted above and discussed in more detail below.
First, the 2007-2009 financial crisis and the ensuing Great Recession was the most serious economic downturn since the Great Depression of the 1930s.8 Government deficits and debt typically rise after serious financial crises and economic downturns for two main reasons. First, tax revenues typically drop during economic downturns. Second, as recession reduces incomes for many households, spending increases due to the effect of "“automatic stabilizers"”—that is, programs that provide benefits linked to income levels or unemployment. In addition, Congress passed the American Recovery and Reinvestment Act of 2009 (ARRA; P.L. 111-5), which combined a package of increased federal funding on), which
6 CBO, CBO Estimate for Divisions A through N of H.R. 2617 (as modified by S.A. 6552), the Consolidated Appropriations Act, 2023, December 21, 2022, https://www.cbo.gov/publication/58872. For estimates of mandatory (direct) spending, see CBO Estimate for Divisions O Through MM of H.R. 2617, the Consolidated Appropriations Act, 2023, Enacted as P.L. 117-328 on December 29, 2022, January 12, 2023, https://www.cbo.gov/publication/58872.
7 OMB, FY2024 Budget, Analytical Perspectives, ch. 4, Budget Process, p. 44, https://www.whitehouse.gov/wp-content/uploads/2023/03/ap_4_process_fy2024.pdf.
8 National Bureau of Economic Research, Business Cycle Dating Committee, “June 2009 Business Cycle Trough/End of Last Recession,” September 20, 2010, https://www.nber.org/news/business-cycle-dating-committee-announcement-september-20-2010.
Congressional Research Service
2
Discretionary Budget Authority by Subfunction: An Overview
combined a package of increased federal funding for education, energy, and other areas; greater support for state and local governments; and tax reductions.
The Budget Control Act of 2011
The Budget Control Act of 2011 (P.L. 112-25; BCA) was enacted in August 2011 in part due to concerns over rising deficits and debt levels.5 The BCA reinstated
Second, the COVID-19 pandemic, the most serious global health emergency in the past century, had profound effects on economic activity, health systems, and finances of households and governments.9
The direct and indirect effects of the 2007-2009 financial crisis and the COVID-19 pandemic both resulted in large increases in federal deficit spending. While federal deficit spending supports economic activity and household incomes, the sharp increases in federal debt levels raised concerns about the sustainability of public finances.
The Budget Control Act of 2011 Fiscal policy became a central concern of Congress in the wake of the 2007-2009 Great Recession. In early 2011, prompted by those concerns, some in Congress sought to constrain discretionary spending in the final FY2011 appropriations measure.10 In August 2011, negotiations over fiscal policy and the debt limit led to the reimposition of spending caps and associated budget enforcement mechanisms that had lapsed after FY2001 through the enactment of the Budget Control Act of 2011 (BCA; P.L. 112-25).
The BCA set statutory caps on discretionary spending, similar to those that had lapsed in 2002, and set up budget enforcement mechanisms designed to achieve $2.1 trillion in savings over the period FY2012-FY2021. Imposition of an11 An initial set of discretionary caps was estimated to save about $900 billion over 10 years. A bipartisan Joint Select Committee on Deficit Reduction, popularlyoften known as the "“Super Committee,"” was chargedtasked with developing a plan to reduce deficits by $1.2 trillion or more.
When that committee did not report areported no plan by a November 2011 deadline, backup budget enforcement measures were triggered, including a January 2013 sequester (a cancellation of budgetary resources by OMB), and a revised set of discretionary caps on funding for defense (defined as the national defense budget function 050) and non-defensenondefense programs (all other) for FY2013-FY2021.612 Those revised caps were to be lowered in each year by an amount calculated by the Office of Management and Budget (OMB) according to a formula designed to achieve a pro-ratedprorated share of the $1.2 trillion deficit reduction that a Joint Select Committee plan did not achieve. An annual sequester of non-exemptnonexempt mandatory spending accounts also contributes to those savings.
9 The John Hopkins Coronavirus Resource Center (https://coronavirus.jhu.edu/region/united-states), when it stopped updating its data, estimated that 1.1 million people had died from COVID-19 in the United States. The Centers for Disease Control (CDC) estimates that about 675,000 people died from the Spanish flu in 1918-1919. See CDC, “History of 1918 Flu Epidemic,” webpage, March 21, 2018, https://www.cdc.gov/flu/pandemic-resources/1918-commemoration/1918-pandemic-history.htm.
10 See CRS Report R41771, FY2011 Appropriations in Budgetary Context, by D. Andrew Austin and Amy Belasco. 11 For more information on the BCA, see CRS Report R41965, The Budget Control Act of 2011, by Bill Heniff Jr., Elizabeth Rybicki, and Shannon M. Mahan.
12 Section 302 of the BCA set out procedures for lowering those revised caps by adding § 251A to the Balanced Budget and Emergency Deficit Control Act of 1985 (BBEDCA; P.L. 99-177). In FY2013, the lowering of the BCA caps was implemented through sequestration. See CBO, Sequestration Update Report, August 2012, p. 3, available at http://www.cbo.gov/sites/default/files/cbofiles/attachments/08-09-12_SequestrationUpdate.pdf; and OMB, Sequestration Update Report to the President and Congress for Fiscal Year 2013, August 20, 2012, p. 13, available at http://www.whitehouse.gov/sites/default/files/omb/assets/legislative_reports/sequestration/sequestration_update_august2012.pdf.
Congressional Research Service
3
Discretionary Budget Authority by Subfunction: An Overview
The spending trajectory implied by those backup enforcement measures implied discretionary base defense spending would reverthave reverted to a level slightly above its FY2007 level in real dollar terms (i.e., adjusting for inflation but not for growth in population or the economy), while non-defensenondefense discretionary spending would reverthave reverted to a level near its 2003FY2003 level.7 13 Discretionary spending as a share of GDP, ifhad unmodified BCA caps remainremained in place, would declinehave declined to levels well below those seen in recent decades. Congressional Budget Office (CBO) current-lawCBO baseline projections suggestsuggested that discretionary spending would accounthave accounted for 5.3% of GDP in FY2026, two percentage points below its level in FY2007 (7.3%), just before the start of the Great Recession.8
Congress Has14
BCA caps were adjusted to accommodate certain types of spending, such as war spending (designated as “overseas contingency operations”), emergency appropriations, disaster relief, and program integrity initiatives.15 In particular, war-designated funding has been seen as a “relief valve” that has taken budgetary pressure off priority military and international programs.16 Some Members of Congress have argued that war spending cap adjustments weakened fiscal discipline.17
Congress Modified BCA Caps to Mitigate Fiscal Stringency Modified BCA Caps to Mitigate Fiscal Stringency
The stringency of BCA discretionary spending caps and backup enforcement measures prompted Congress and the President to adjust those limits several times to avoid dislocations of federal operations. The Bipartisan Budget Act (BBA; H.J.Res. 59; P.L. 113-67), enacted in December 2013, modified BCA limits for FY2014 and FY2015. The Bipartisan Budget Act of 2015 (BBA2015; P.L. 114-74) raised FY2016 and FY2017 cap levels on both categories by $25 billion and FY2017 cap levels by $15 billion. BCA caps for FY2018 through FY2021, however, have not been changed.9 Absent new legislative modifications, those caps will constrain budgetary decisions for FY2018.
BCA caps are adjusted to accommodate certain types of spending, such as war spending, emergency appropriations, disaster relief, and program integrity initiatives.10 In particular, war-designated funding has been seen as a "relief valve" that has taken budgetary pressure off priority military and international programs.11 Some Members of Congress have argued that war spending cap adjustments have weakened fiscal discipline.12
In its budget submission for FY2017, the Obama Administration had proposed raising BCA caps to allow more spending for non-defense and defense priorities.13 For FY2018, the Trump Administration proposed raising the BCA cap on defense (budget function 050) spending by $54 billion and lowering the BCA cap on non-defense by an equal amount. The Administration also proposed slightly smaller increases in the BCA cap on defense and increasingly large reductions in the non-defense cap for future years.14
18 Some journalists and others have referred to sequestration as a reversion to tighter caps on spending after a lapse of a Bipartisan Budget Act provision allowing higher levels of discretionary spending—something unrelated to the formal definition of sequestration.
The American Taxpayer Relief Act of 2012 (ATRA; P.L. 112-240) delayed the slated FY2013 sequester and reduced its size from $109 billion to $85 billion. ATRA, which also extended certain tax reductions, addressed concerns that the expiration of certain tax cuts and imposition of spending cuts could hinder economic recovery from the Great Recession, avoiding what had been called a “fiscal cliff.”19
13 For details, see CRS congressional distribution memorandum, “The Budget Control Act and Alternate Defense and Nondefense Spending Paths, FY2012-FY2021,” by Amy Belasco and Andrew Austin, November 16, 2012, available to congressional clients upon request. This comparison is made in terms of budget authority. Before passage of ATRA, BCA provisions were slated to bring discretionary base defense spending to its FY2007 level and nondefense spending to near its level in FY2003 or FY2004. Inflation adjustments made using GDP price index.
14 CBO, Budget and Economic Outlook: 2017 to 2027, January 24, 2017, Table 1-1, http://www.cbo.gov/publication/52370. CBO baseline projections assume current laws remain in effect and that discretionary spending levels remain constant in inflation-adjusted terms.
15 For BCA caps to be adjusted, emergency funding and war funding (Overseas Contingency Operations/Global War on Terrorism) must be designated on an account-by-account basis by Congress and the President. Cap adjustments for disaster funding are subject to a limit set at a 10-year average of previous disaster funding. The BCA established separate caps for certain program integrity initiatives.
16 See CRS Report R44519, Overseas Contingency Operations Funding: Background and Status, by Brendan W. McGarry and Emily M. McCabe. Also see Marcus Weisgerber, “‘Magic Money’: DoD’s Overseas Contingency Budget Might Dry Up,” Defense News, June 29, 2014, http://archive.defensenews.com/article/20140629/DEFREG02/306290011/-Magic-Money-DoD-s-Overseas-Contingency-Budget-Might-Dry-Up. Also see archived CRS Report RL33110, The Cost of Iraq, Afghanistan, and Other Global War on Terror Operations Since 9/11, by Amy Belasco.
17 Joe Gould, “Trump Selects OCO-Opponent Mulvaney for OMB,” Defense News, December 19, 2016, http://www.defensenews.com/articles/trump-selects-oco-opponent-mulvaney-for-omb.
18 A CRS congressional distribution memorandum “The Evolution of Budget Control Act of 2011 Caps on Discretionary Spending” is available upon request to congressional clients.
19 ATRA was enacted on January 1, 2013. Budgetary adjustments that affected the FY2013 sequester are described in (continued...)
Congressional Research Service
4
Discretionary Budget Authority by Subfunction: An Overview
The Bipartisan Budget Act of 2013 (BBA 2013; H.J.Res. 59; P.L. 113-67), enacted in December 2013 and popularly known as the Murray-Ryan budget agreement, set a pattern for adjusting BCA caps. The BBA 2013 raised BCA FY2014 limits for defense and nondefense by $22.4 billion each and raised FY2015 limits by $9.3 billion each. The Bipartisan Budget Act of 2015 (BBA 2015; P.L. 114-74) raised the FY2016 cap levels on both categories by $25 billion and the FY2017 cap levels by $15 billion.
The Bipartisan Budget Act of 2018 (BBA 2018; H.R. 1892, P.L. 115-123), enacted February 9, 2018, raised the defense cap by about $80 billion for FY2018 and $85 billion for FY2019 and the nondefense cap by about $63 billion for FY2018 and $67 billion for FY2019.20 BBA 2018 also contained several changes in federal social programs and again suspended the debt limit.21
The Bipartisan Budget Act of 2019 (BBA 2019; H.R. 3877, P.L. 116-37), enacted on August 2, 2019, set discretionary cap levels for FY2020 and FY2021, allowing for higher spending in both the defense and nondefense categories. At the end of FY2021, BCA caps on discretionary spending (BA) expired, although BCA sequestration of nonexempt mandatory spending has been extended.22 Discretionary caps, as noted above, were reinstated for FY2024 and FY2025 by the Fiscal Responsibility Act (P.L. 118-5).
Coronavirus Pandemic and Federal Responses in 2020 and 2021 The COVID-19 pandemic confronted the federal government, like governments around the world, with extraordinary fiscal challenges.23 In part, deficits were pushed upward through “automatic stabilizers,” such as expanded income support payments and diminished tax receipts as household incomes and business profits fell.24 The designation of COVID-19 as a pandemic in mid-March 2020 prompted fiscal policy responses in 2020 and 2021 that increased federal spending and deficits, as percentage of GDP, to levels not seen since World War II.25 Most of the
the CRS congressional distribution memorandum “The Evolution of Budget Control Act of 2011 Caps on Discretionary Spending.”
20 CBO, Bipartisan Budget Act of 2018, February 8, 2018, https://www.cbo.gov/system/files/115th-congress-2017-2018/costestimate/bipartisanbudgetactof2018.pdf.
21 See CRS Report R45126, Bipartisan Budget Act of 2018 (P.L. 115-123): Brief Summary of Division E—The Advancing Chronic Care, Extenders, and Social Services (ACCESS) Act, coordinated by Paulette C. Morgan. Also see CRS Report R45136, Bipartisan Budget Act of 2018 (P.L. 115-123): CHIP, Public Health, Home Visiting, and Medicaid Provisions in Division E, coordinated by Alison Mitchell and Elayne J. Heisler.
22 The sequestration of mandatory spending was extended through the first half of FY2032 for Medicare patient care outlays and through FY2031 for other nonexempt programs. See OMB, FY2024 Budget, Analytical Perspectives, p. 37, https://www.whitehouse.gov/wp-content/uploads/2023/03/ap_4_process_fy2024.pdf.
23 World Health Organization (WHO), “WHO Director-General’s Opening Remarks at the Media Briefing on COVID-19,” March 11, 2020, https://www.who.int/director-general/speeches/detail/who-director-general-s-opening-remarks-at-the-media-briefing-on-covid-19—11-march-2020.
24 CBO, “Automatic Stabilizers in the Federal Budget: 2022 to 2032,” October 2022, https://www.cbo.gov/publication/58593. Estimated effect of automatic stabilizers in FY2020 was 1.6% of GDP.
25 For 2020, see CBO, “The Budgetary Effects of Laws Enacted in Response to the 2020 Coronavirus Pandemic, March and April 2020,” June 2020, https://www.cbo.gov/system/files/2020-06/56403-CBO-covid-legislation.pdf (hereinafter CBO, “The Budgetary Effects of Laws Enacted in Response to the 2020 Coronavirus Pandemic, March and April 2020”). The total estimated effect on federal deficits from those acts (P.L. 116-123, P.L. 116-127, P.L. 116-136, and P.L. 116-139) was $2.4 trillion, or 11.5% of GDP. For 2021, see CBO, “The Budgetary Effects of Major Laws Enacted in Response to the 2020-2021 Coronavirus Pandemic, December 2020 and March 2021,” September 2021, https://www.cbo.gov/system/files/2021-09/57343-Pandemic.pdf (hereinafter CBO, “The Budgetary Effects of Major Laws Enacted in Response to the 2020-2021 Coronavirus Pandemic, December 2020 and March 2021”). The total estimated effect on deficits from those acts (P.L. 116-260, P.L. 117-2) was $2.7 trillion, or 12.2% of GDP.
Congressional Research Service
5
Discretionary Budget Authority by Subfunction: An Overview
federal fiscal response was provided through mandatory spending, and to a lesser extent in revenue reductions.
The CARES Act (P.L. 116-136), enacted in late March 2020, provided an estimated $326 billion in discretionary funding, while providing $988 billion in mandatory spending and $408 billion in revenue reductions. The Paycheck Protection Program and Health Care Enhancement Act (P.L. 116-139) provided an additional $162 billion in discretionary funding as well as $321 billion in mandatory spending.26
The final appropriations package for FY2021, enacted in late December 2020, included an estimated $185 billion in discretionary spending, $677 billion in mandatory spending, and $5 billion in revenue decreases. The American Rescue Plan Act (P.L. 117-2) provided $1,803 billion in mandatory funding and $53 billion in revenue reductions, but no discretionary funding.27
Caps on Discretionary Spending Reinstated for FY2024 and FY2025 In June 2023, the Fiscal Responsibility Act (FRA; P.L. 118-5) suspended the federal debt limit and reestablished statutory caps on discretionary spending for FY2024 and FY2025. Separate caps apply to the defense and nondefense categories.
Federal Budget Data and Concepts Federal Budget Data and Concepts
Figures in this report are based on the Office of Management and Budget (OMB) Public Budget Database accompanying the FY2018FY2024 budget release.1528 Table 5.1 in the Historical Tables volume of the FY2018FY2024 budget reports budget authority by function and subfunction, but does not provide a breakdown bybreak down spending into discretionary and mandatory subcomponents.16
29 OMB Budget Data
OMB'’s public budget data generally do not reflect budgetary categories used in the congressional budget process such as emergency-designated funding, the appropriations subcommittee responsible for an account, or distinctions between war and base funding. OMB maintains more detailed budget data for its internal work.
OMB is the official source for historical budget data. CBO estimates, however, are generally more relevant for congressional budget enforcement. Budget data in OMB documents may differ from other budget data for various reasons, although differences in historical data are typically small. For example, appropriations budget documents often reflect scorekeeping adjustments. Budget data issued at a later date may include revisions. In some cases, detailed appropriations data may differ from OMB data, which sometimes do not reflect certain relatively small zero-balance transfers among funds. Differences may also reflect technical differences or different interpretations of federal budget concepts.
Negative Budget Authority
26 CBO, “The Budgetary Effects of Laws Enacted in Response to the 2020 Coronavirus Pandemic, March and April 2020.” 27 CBO, “The Budgetary Effects of Major Laws Enacted in Response to the 2020-2021 Coronavirus Pandemic, December 2020 and March 2021.” 28 Data in the OMB Public Budget Database (https://www.whitehouse.gov/omb/budget/supplemental-materials/) reconcile to information presented in the Historical Tables (https://www.whitehouse.gov/omb/budget/historical-tables/) of the FY2024 budget. For a further description and important caveats, see the Public Budget Database User Guide, https://www.whitehouse.gov/wp-content/uploads/2023/03/db_guide_fy2024.pdf.
29 OMB, Historical Tables, Table 5.1, https://www.whitehouse.gov/wp-content/uploads/2023/03/hist05z1_fy2024.xlsx.
Congressional Research Service
6
link to page 27 Discretionary Budget Authority by Subfunction: An Overview
Negative Budget Authority Within the federal budget concepts, certain inflows, such as offsetting receipts, offsetting collections, some user fees, and "profits"“profits” from federal loan programs, are treated as negative budget authority.17
30
Provisions in appropriations acts that affect mandatory spending programs, known as CHIMPs (changes in mandatory programs) can be counted as negative discretionary spending according to federal budgetary scorekeeping guidelines. For example, a sharp downward spike in proposed spending for subfunction 754 (criminal justice assistance), shown in Figure 17, reflects a CHIMP affecting the Crime Victims Fund. That CHIMP, however, has had little effect on programmatic spending levels. Similarly, a CHIMP affecting the State Children's CHIMP affecting the State Children’s Health Insurance Program (CHIP) explains a dip in subfunction 551 (health care services) shown in Figure 6.
in Figure 9 for FY2024.31
Scorekeeping adjustments, such as CHIMPs, lead to differences between actual discretionary budget authority totals and limits set by budget enforcement mechanisms, such as §302 allocations or BCA discretionary caps.1832 Scored totals of budget authority—that is, totals that include scorekeeping adjustments and which are used to check conformity to BCA spending limits and other budget enforcement measures—typically diverge from totals that do not include those adjustments.
Federal Credit Programs
Disbursements for federal loan and loan guarantee programs do not appear directly in federal spending data. The federal government has used a form of accrual accounting for loan and loan guarantee programs since passage of the Federal Credit Reform Act (FCRA; Title V of the Omnibus Budget Reconciliation Act of 1990; P.L. 101-508) as well as for certain federal retirement programs.1933 OMB calculates net subsidy rates according to FCRA rules for loan and loan guarantee programs. The net subsidy cost is then reflected in federal spending data. In general, FCRA adjustments affect mandatory spending more than discretionary spending because the largest sources of federal credit are mandatory programs.20
34 Comparisons of estimates of federal credit program costs before and after FY1991 should be treated with caution because FCRA changed the budgetary treatment of federal credit programs. For instance, the budgetary costs of loan guarantee programs before FCRA rules came into effect were typically understated because they required no upfront federal disbursements, unlike loan programs. Conversely, the budgetary costs of federal loan programs, which required upfront federal disbursements, did not reflect future repayments. FCRA changes in budgetary treatment of credit programs made loan and loan guarantee programs more comparable. Loan or loan guarantee program cost estimates calculated before FCRA implementation are unlikely to be comparable to estimates calculated afterward.
30 See OMB, FY2024 Budget, Analytic Perspectives, ch. 18, “Offsetting Collections and Offsetting Receipts,” https://www.whitehouse.gov/wp-content/uploads/2023/03/ap_18_offsetting_fy2024.pdf.
31 OMB, FY2024 Budget, Budget Appendix, CHIP program and financing table, p. 441. 32 Section 302 of the 1974 Congressional Budget Act (P.L. 93-344, as amended) defines spending limits for appropriations subcommittees consistent with levels recommended in a budget resolution. See CRS Report R47388, Enforceable Spending Allocations in the Congressional Budget Process: 302(a)s and 302(b)s, by Drew C. Aherne. More precisely, BCA caps were adjusted upward to reflect those spending categories.
33 See CRS Report RL30346, Federal Credit Reform: Implementation of the Changed Budgetary Treatment of Direct Loans and Loan Guarantees, by James M. Bickley, available to congressional clients upon request.
34 See OMB, FY2024 Budget, Analytic Perspectives, ch. 7, “Credit and Insurance,” https://www.whitehouse.gov/wp-content/uploads/2023/03/ap_7_credit_fy2024.pdf.
Congressional Research Service
7
link to page 13 link to page 14 link to page 14 Discretionary Budget Authority by Subfunction: An Overview
FCRA calculations sometimes yield negative net subsidy levels, implying that the federal government appears to make a profit on those loans.2135 FCRA subsidy calculations, however, omit risk adjustments.2236 The true economic cost of federal credit guarantees can be substantially underestimated when risk adjustments are omitted.23
37 Background on Functional Categories
Functional categories provide a means to compare federal funding for activities within broad policy areas that often cut across several federal agencies.2438 Various federal agencies may have closely related or overlapping responsibilities and many agencies have responsibilities in diverse policy areas. Budget data divided along functional categories therefore provide a useful view of federal activities supporting specific national purposes. Superfunction categories, which provide a higher higher-level division of federal activities, are
- National Defense,
- Human Resources,
- Physical Resources, and
- Other Functions.
• National Defense, • Human Resources, • Physical Resources, and • Other Functions.
Figure 1 shows trends in discretionary funding for those superfunctions since FY1977. Budget function categories, grouped by superfunctions, are shown inin Table 1. Net Interest, Allowances, and Undistributed Offsetting Receipts could also be considered as separate categories. Superfunction categories for National Defense, Net Interest, Allowances, and Undistributed Offsetting Receipts coincide with function categories. Trends in net interest are excluded, as federal interest expenditures have been automatically appropriated since 1847.
Allowances, which contain items reflecting technical budget adjustments, and undistributed offsetting receipts are also excluded. Allowances in FY2018 include adjustments to BCA caps, and reflect proposals for spectrum relocation, disability insurance reform, a reduction in improper payments, infrastructure incentives, and war funding (Overseas Contingency Operations/OCO; Global War on Terror/GWOT) for years after FY2018.25
for FY2024 include pandemic fraud prevention and enforcement, allowances for discretionary programs (nondefense), and proposals for spectrum relocation. In this report, the International Affairs function, which OMB includes in the Other Functions superfunction, is listed after National Defense because similar influences can affect both.
Subfunction categories provide a finer division of funding levels within narrower policy areas.26 39 Budget functions do notgenerally play ano role in budget enforcement, although budget legislation mandates that budget resolutions list preferred spending levels by budget function, thus highlighting broad fiscal priorities.27
Historical Spending Trends
Federal spending trends in functional areas are affected by changing assessments of national priorities, evolving international challenges, and economic conditions, as well as changing social characteristics and demographics of the U.S. population. Some of the trends and events that have had dramatic effects on federal spending are outlined below. Other CRS products provide background on more specific policy areas. The discussion of budgetary trends is broken up into three broad categories: defense and international affairs, domestic social programs, and other federal programs.
Spending in the following figures, as noted above, is shown as a percentage of GDP, which controls for the effects of inflation, population growth, and real income growth. A flat line on such graphs indicates that spending in that category is increasing at the same rate as overall economic growth.
|
Superfunction |
Code |
Function / Subfunction |
|
National Defense |
||
|
50 |
National defense |
|
|
51 |
Dept. of Defense-Military |
|
|
53 |
Atomic energy defense activities |
|
|
54 |
Defense-related activities |
|
|
International Affairs |
150 |
International affairs |
|
151 |
Intl. dev. and humanitarian assistance |
|
|
152 |
Intl. security assistance |
|
|
153 |
Conduct of foreign affairs |
|
|
154 |
Foreign information & exchange activities |
|
|
155 |
Intl. financial programs |
|
|
Human Resources |
||
|
500 |
Education, training, employment, and social services |
|
|
501 |
Elementary, secondary, and vocational education |
|
|
502 |
Higher education |
|
|
503 |
Research and general education aids |
|
|
504 |
Training and employment |
|
|
505 |
Other labor services |
|
|
506 |
Social services |
|
|
550 |
Health |
|
|
551 |
Health care services |
|
|
552 |
Health research and training |
|
|
554 |
Consumer and occupational health and safety |
|
|
570 |
Medicare |
|
|
571 |
Medicare |
|
|
600 |
Income security |
|
|
601 |
Gen. retirement & disability insurance (exc. Soc. Sec.) |
|
|
602 |
Federal employee retirement and disability |
|
|
603 |
Unemployment compensation |
|
|
604 |
Housing assistance |
|
|
605 |
Food and nutrition assistance |
|
|
609 |
Other income security |
|
|
650 |
Social security |
|
|
651 |
Social security |
|
|
700 |
Veterans benefits and services |
|
|
701 |
Income security for veterans |
|
|
702 |
Veterans education, training, & rehabilitation |
|
|
703 |
Hospital and medical care for veterans |
|
|
704 |
Veterans housing |
|
|
705 |
Other veterans benefits and services |
|
|
Physical Resources |
||
|
270 |
Energy |
|
|
271 |
Energy supply |
|
|
272 |
Energy conservation |
|
|
274 |
Emergency energy preparedness |
|
|
276 |
Energy information, policy, and regulation |
|
|
300 |
Natural resources and environment |
|
|
301 |
Water resources |
|
|
302 |
Conservation and land management |
|
|
303 |
Recreational resources |
|
|
304 |
Pollution control and abatement |
|
|
306 |
Other natural resources |
|
|
370 |
Commerce and housing credit |
|
|
371 |
Mortgage credit |
|
|
372 |
Postal service |
|
|
373 |
Deposit insurance |
|
|
376 |
Other advancement of commerce |
|
|
400 |
Transportation |
|
|
401 |
Ground transportation |
|
|
402 |
Air transportation |
|
|
403 |
Water transportation |
|
|
407 |
Other transportation |
|
|
450 |
Community and regional development |
|
|
451 |
Community development |
|
|
452 |
Area and regional development |
|
|
453 |
Disaster relief and insurance |
|
|
Other Functions |
||
|
250 |
General science, space, and technology |
|
|
251 |
General science and basic research |
|
|
252 |
Space flight, research & supporting activities |
|
|
350 |
Agriculture |
|
|
351 |
Farm income stabilization |
|
|
352 |
Agricultural research and services |
|
|
750 |
Administration of justice |
|
|
751 |
Federal law enforcement activities |
|
|
752 |
Federal litigative and judicial activities |
|
|
753 |
Federal correctional activities |
|
|
754 |
Criminal justice assistance |
|
|
800 |
General government |
|
|
801 |
Legislative functions |
|
|
802 |
Executive direction and mgmt. |
|
|
803 |
Central fiscal operations |
|
|
804 |
General property and records mgmt. |
|
|
805 |
Central personnel mgmt. |
|
|
806 |
General purpose fiscal assistance |
|
|
808 |
Other general government |
|
|
809 |
Deductions for offsetting receipts |
|
|
Net Interest |
||
|
900 |
Net interest |
|
|
901 |
Interest on Treasury debt securities (gross) |
|
|
902 |
Interest received by on-budget trust funds |
|
|
903 |
Interest received by off-budget trust funds |
|
|
908 |
Other interest |
|
|
909 |
Other Investment and income |
|
|
Allowances |
||
|
920 |
Allowances |
|
|
922 |
| |
|
923 |
Infrastructure Initiative |
|
|
924 |
Adjustment for BCA Cap on Non-Security Spending |
|
|
925 |
Additional FY2017 Request |
|
|
926 |
Spectrum Relocation |
|
|
927 |
Disability Insurance Reforms |
|
|
928 |
Reductions in Improper Payments Government-wide |
|
|
929 |
Plug for Outyear War Costs |
|
|
Undistributed Offsetting Receipts |
||
|
950 |
Undistributed offsetting receipts |
|
|
951 |
Employer share, employee retirement (on-budget) |
|
|
952 |
Employer share, employee retirement (off-budget) |
|
|
953 |
Rents & royalties on the Outer Continental Shelf |
|
|
954 |
Sale of major assets |
|
|
959 |
Other undistributed offsetting receipts |
Source: CRS, based on OMB data.
Notes: Allowances subfunctions can change from one year to the next.
a.
Backup budget enforcement measures established by the BCA came into force after the Joint Select Committee on Deficit Reduction did not report a plan in November 2011.
35 For example, some Federal Housing Administration mortgage programs and some federal student loan programs have been estimated in some years to yield negative net subsidies.
36 While the FCRA calculations include estimates of default costs, they do not discount more volatile income flows, as a private firm would. See CRS Report R44193, Federal Credit Programs: Comparing Fair Value and the Federal Credit Reform Act (FCRA), by Raj Gnanarajah.
37 U.S. Congressional Budget Office, Estimating the Value of Subsidies for Federal Loans and Loan Guarantees, August 2004, available at http://cbo.gov/doc.cfm?index=5751.
38 See CRS Report 98-280, Functional Categories of the Federal Budget, by Bill Heniff Jr. 39 Table 1 largely follows the ordering of functions in the OMB Historical Tables volume. See OMB, FY2024 Budget, Historical Tables, Table 3.1, https://www.whitehouse.gov/wp-content/uploads/2023/03/hist03z1_fy2024.xlsx. The ordering of some items was changed to organize the discussion in a thematically consistent manner. As noted in the text, the international affairs function was grouped with the national defense function, as those categories are affected by common influences.
Congressional Research Service
8
Discretionary Budget Authority by Subfunction: An Overview
highlighting broad fiscal priorities.40 Caps on discretionary spending set by BCA and FRA, as noted above, do define the “revised security category” as “discretionary appropriations in budget function 050.”41
Figure 1. Discretionary Funding by Budget Superfunction, FY1977-FY2028
Source: CRS, based on OMB data from the FY2024 budget submission. Notes: FY2023 levels are estimated. FY2024-FY2028 levels reflect Administration proposals and projections. See OMB budget documents for further caveats.
40 2 U.S.C. 632(a)(4). 41 2 U.S.C. 900(c)(4)(D).
Congressional Research Service
9
Discretionary Budget Authority by Subfunction: An Overview
Table 1. Budget Function Categories by Superfunction
Superfunction
Code
Function / Subfunction
National Defense
50
National defense
51
Dept. of Defense-Military
53
Atomic Energy Defense Activities
54
Defense-Related Activities
International Affairs
150
International affairs
151
Intl. Dev. and Humanitarian Assistance
152
Intl. Security Assistance
153
Conduct of Foreign Affairs
154
Foreign Information & Exchange Activities
155
International Financial Programs
Human Resources
500
Education, training, employment, and social services
501
Elementary, Secondary, and Vocational Education
502
Higher Education
503
Research and General Education Aids
504
Training and Employment
505
Other Labor Services
506
Social services
550
Health
551
Health Care Services
552
Health Research and Training
554
Consumer and Occupational Health and Safety
570
Medicare
571
Medicare
600
Income security
601
Gen. retirement & disability insurance (exc. Soc. Sec.)
602
Federal employee retirement and disability
603
Unemployment compensation
604
Housing assistance
605
Food and nutrition assistance
609
Other income security
650
Social security
651
Social security
700
Veterans benefits and services
701
Income security for veterans
702
Veterans education, training, & rehabilitation
703
Hospital and medical care for veterans
704
Veterans housing
705
Other veterans benefits and services
Physical Resources
270
Energy
271
Energy supply
272
Energy conservation
274
Emergency energy preparedness
276
Energy information, policy, and regulation
Congressional Research Service
10
Discretionary Budget Authority by Subfunction: An Overview
Superfunction
Code
Function / Subfunction
300
Natural resources and environment
301
Water resources
302
Conservation and land management
303
Recreational resources
304
Pol ution control and abatement
306
Other natural resources
370
Commerce and housing credit
371
Mortgage credit
372
Postal service
373
Deposit insurance
376
Other advancement of commerce
400
Transportation
401
Ground transportation
402
Air transportation
403
Water transportation
407
Other transportation
450
Community and regional development
451
Community development
452
Area and regional development
453
Disaster relief and insurance
Other Functions
250
General science, space, and technology
251
General science and basic research
252
Space flight, research & supporting activities
350
Agriculture
351
Farm income stabilization
352
Agricultural research and services
750
Administration of justice
751
Federal law enforcement activities
752
Federal litigative and judicial activities
753
Federal correctional activities
754
Criminal justice assistance
800
General government
801
Legislative functions
802
Executive direction and mgmt.
803
Central fiscal operations
804
General property and records mgmt.
805
Central personnel mgmt.
806
General purpose fiscal assistance
808
Other general government
809
Deductions for offsetting receipts
Net Interest
900
Net interest
901
Interest on Treasury debt securities (gross)
902
Interest received by on-budget trust funds
903
Interest received by off-budget trust funds
908
Other interest
Congressional Research Service
11
link to page 17 link to page 18 Discretionary Budget Authority by Subfunction: An Overview
Superfunction
Code
Function / Subfunction
909
Other Investment and income
Allowances
920
Allowances
922
Reductions for Joint Committee Enforcement (Nondefense)
923
Pandemic Fraud Prevention and Enforcement
924
Allowance for Discretionary Programs (Nondefense)
926
Spectrum Relocation
Undistributed Offsetting
Receipts
950
Undistributed offsetting receipts
951
Employer share, employee retirement (on-budget)
952
Employer share, employee retirement (off-budget)
953
Rents & royalties on the Outer Continental Shelf
954
Sale of major assets
959
Other undistributed offsetting receipts
Source: CRS, based on OMB data (OMB, FY2024 Budget, Analytical Perspectives, Table 24-1, https://www.whitehouse.gov/wp-content/uploads/2023/03/24-1_fy2024.xlsx). Notes: Allowances subfunctions can change from one year to the next.
Historical Spending Trends Federal spending trends in functional areas are affected by changing assessments of national priorities, evolving international challenges, and economic conditions, as well as changing social characteristics and demographics of the U.S. population. Some of the trends and events that have had dramatic effects on federal spending are outlined below. Other CRS products provide background on more specific policy areas. The discussion of budgetary trends is broken up into three broad categories: defense and international affairs, domestic social programs, and other federal programs.
Spending in the following figures, as noted above, is shown as a percentage of GDP, which controls for the effects of inflation, population growth, and real income growth. A flat line on such graphs indicates that spending in that category is increasing at the same rate as overall economic growth.
Defense and International Affairs Defense and International Affairs
The National Defense (050) and International Affairs (150) budget functions have been the categories most affected by larger changes in the geopolitical role of the United States.
Cold War, Peace Dividend, and the Global War on Terror
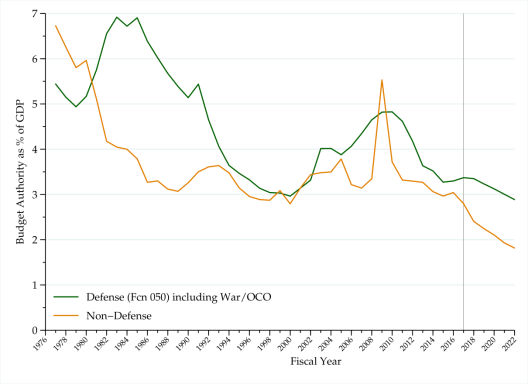
The allocation of discretionary spending between defense and non-defensenondefense programs is one reflection of changing federal priorities over timetime. Figure 1 2 shows defense and non-defense nondefense discretionary funding as a percentage of GDP. Figure 3 shows defense spending by major title, including Military Personnel (Mil Pers), Procurement, Operations and Maintenance (O&M), and Research, Development, Test, and Evaluation (RTD&E).42
42 Defense appropriations acts typically also contain titles for Revolving and Management Funds, Other DOD (continued...)
Congressional Research Service
12
Discretionary Budget Authority by Subfunction: An Overview
Figure 2.
discussed elsewhere.
Relations between the United States and its allies on one hand, and the Union of Soviet Socialist Republics (USSR) and its allies on the other were the dominant security concern in the half century following the Second World War. In the early 1970s, U.S. involvement in the Vietnam War wound down, while the United States and the USSR moved toward detente, permitting a thaw in Cold War relations between the two superpowers and a reduction in defense spending relative to the size of the economy.28
Following intervention by the USSR in Afghanistan in 1979, military spending increased sharply.29 Defense spending continued to increase until 1986, as concern shifted to domestic priorities and the desire to reduce large budget deficits. The 43
Programs, and Related Agencies. Military Construction/Veterans Administration appropriations acts typically contain titles for Military Construction and Family Housing.
43 For a history of deficit finance and American wars, see Robert D. Hormats, The Price of Liberty, (New York: Times Books, 2007); or Steven A. Bank, Kirk J. Stark, and Joseph J. Thorndike, War and Taxes, (Washington, D. C.: Urban Institute, 2008). Also see Rosella Cappella Zielinski, How States Pay for Wars (New York: Cornell University Press, 2016); and Sarah Kreps, Taxing Wars: The American Way of War Finance and the Decline of Democracy (Oxford, 2018).
Congressional Research Service
13
Discretionary Budget Authority by Subfunction: An Overview
Figure 3. Defense Discretionary BA by Major Title, FY1977-FY2028
Source: CRS, based on OMB data from the FY2024 budget submission. Notes: The four titles with the highest funding levels are shown.
In 1979, during the Jimmy Carter Administration, military spending increased sharply following intervention by the USSR in Afghanistan and the Iranian hostage crisis.44 The Ronald W. Reagan Administration increased defense spending further, with procurement costs rising more sharply than other categories.45
Defense spending continued to increase until 1986, as concern shifted to domestic priorities, the desire to reduce large budget deficits, and concerns about inflated procurement costs.46 The collapse in 1989 of most of the Warsaw Pact governments in Central and Eastern Europe and the 1990-1991 disintegration of the Soviet Union was followed by a reduction in federal defense spending, allowing a "“peace dividend"” that relaxed fiscal pressures.30
47 O&M costs, however, fell
44 For one view of budgetary politics in the early 1980s, see David Stockman, The Triumph of Politics (New York: Harper & Row, 1986). Also see James M. Poterba, David Stockman, and Charles Schultze, “Budget Policy,” in American Economic Policy in the 1980s, NBER, pp. 235-292.
45 Stockman (1986), pp. 105-109. 46 Airon A. Mothershed, “The $435 Hammer and $600 Toilet Seat Scandals: Does Media Coverage of Procurement Scandals Lead to Procurement Reform?” Public Contract Law Journal, vol. 41, no. 4 (2012), pp. 855-880, http://www.jstor.org/stable/41635361.
47 The Warsaw Treaty Organization established in 1955, included Albania, Bulgaria, Czechoslovakia, the German Democratic Republic, Hungary, Poland, Romania, and the Soviet Union.
Congressional Research Service
14
link to page 18 Discretionary Budget Authority by Subfunction: An Overview
more slowly after the mid-1980s than other costs (as seen in Figure 3) and rose more quickly after 2000.
The attacks of September 11, 2001, were followed by sharp increases in homeland security spending. Defense spending also increased significantly with the start of the Afghanistan war in October 2001 and the Iraq war in March 2003.31 U.S. combat troops were withdrawn from Iraq in December 2011, and President Obama had announced48 Rising levels of violence and instability in Iraq in 2006 led President George W. Bush to send an additional “surge” of troops.49 In 2008, the U.S. and Afghan governments negotiated a Status of Forces Agreement (SOFA) that set a December 2011 deadline for the withdrawal of most U.S. combat troops.50 A smaller number of U.S. troops returned in 2014 to combat the Islamic State of Iraq and Syria (ISIS).51
President Barack H. Obama announced that additional troops would be sent to Afghanistan to prevent a collapse of its government. In 2013 and 2014, President Obama stated that most U.S. troops would be withdrawn from Afghanistan by the end of 2014.3252 In November 2014, however, President Obama announced an extension of operations in Afghanistan.33 The Obama Administration also noted challenges posed by Russia, which annexed the Crimean peninsula and sponsored military operations in eastern Ukraine; by the so-called Islamic State (IS; also known as ISIL, ISIS, or Da'esh); and by cyberattacks—hostile incursions of computer networks.34
President Trump, in his FY2018 budget submission, called for a $54 billion increase in defense programs to be offset by reductions in non-defense discretionary spending.
53 In February 2020, the Trump Administration signed an agreement with the Taliban that set a May 2021 deadline for the withdrawal of U.S. military forces.54 The collapse of Afghan forces in August 2021 forced the withdrawal of remaining U.S. personnel.55
The invasion of Ukraine’s Crimean peninsula and eastern portions of Ukraine in March 2014 marked a turning point in U.S.-Russian relations, although those events had no material effect on defense spending.56 The full-scale Russian invasion of Ukraine in February 2022, however, prompted a more robust response. As of July 2023, the United States had provided $43 billion in security aid since the 2022 Russian invasion began.57
48 See archived CRS Report RL33110, The Cost of Iraq, Afghanistan, and Other Global War on Terror Operations Since 9/11, by Amy Belasco, available to congressional clients upon request. The Afghan and Iraq wars, along with other related activities, were often called the Global War on Terror (GWOT) and later Overseas Contingency Operations (OCO). The OCO category was created in 1997 to fund activities in Kosovo and Southwest Asia. See DOD Comptroller, “Overseas Contingency Operations Transfer Fund,” in the FY2000 DOD Budget Justification, https://comptroller.defense.gov/Portals/45/Documents/defbudget/fy2000/budget_justification/pdfs/01_Operation_and_Maintenance/fy00pb_ocotf.pdf. Also see CRS In Focus IF10143, Foreign Affairs Overseas Contingency Operations (OCO) Funding: Background and Current Status, by Emily M. McCabe.
49 White House, “President’s Address to the Nation,” January 10, 2007, https://georgewbush-whitehouse.archives.gov/news/releases/2007/01/20070110-7.html. Also see Timothy A. Sayle et al., The Last Card: Inside George W. Bush’s Decision to Surge in Iraq, (Ithaca, NY: Cornell Univ. Press, 2019), https://www.jstor.org/stable/10.7591/j.ctvfc522t.
50 See archived CRS Report R40011, U.S.-Iraq Withdrawal/Status of Forces Agreement: Issues for Congressional Oversight, by R. Chuck Mason.
51 Stacie L. Pettyjohn, “Can Iraq Evict U.S. Forces?” January 6, 2020, https://www.rand.org/blog/2020/01/can-iraq-evict-us-forces.html.
52 See CRS Report RL30588, Afghanistan: Post-Taliban Governance, Security, and U.S. Policy, by Kenneth Katzman. Also see Kevin Marsh, “Obama’s Surge: A Bureaucratic Politics Analysis of the Decision to Order a Troop Surge in the Afghanistan War,” Foreign Policy Analysis, vol. 10, no. 3 (July 2014), pp. 265-288.
53 Mark Mazzetti and Eric Schmitt, “In a Shift, Obama Extends U.S. Role in Afghan Combat,” New York Times, November 21, 2014.
54 U.S. Department of State, After Action Review on Afghanistan: January 2020-August 2021, June 30, 2023, p. 11, https://www.state.gov/wp-content/uploads/2023/06/State-AAR-AFG.pdf.
55 Ibid., p. 85. 56 Katya Gorchinskaya, “A Brief History of Corruption in Ukraine: the Yanukovych Era,” Eurasianet, June 3, 2020, https://eurasianet.org/a-brief-history-of-corruption-in-ukraine-the-yanukovych-era. Also see Serhiy Kudelia, “The House that Yanukovych Built: the Maidan and Beyond,” Journal of Democracy, vol. 25 (2014). 57 U.S. DOD, “Fact Sheet on U.S. Security Assistance to Ukraine,” July 18, 2023, https://media.defense.gov/2023/Jul/19/2003263170/-1/-1/1/UKRAINE-FACT-SHEET.PDF. Also see CRS In Focus IF12040, U.S. Security Assistance to Ukraine, by Christina L. Arabia, Andrew S. Bowen, and Cory Welt.
Congressional Research Service
15
link to page 20
Discretionary Budget Authority by Subfunction: An Overview
Potential security and diplomatic challenges posed by the Peoples’ Republic of China (PRC) have emerged as a leading strategic concern.58 Other strategic priorities include broader challenges such as climate change and terrorism, as well as shaping international rules that address potential policy disputes over trade and technology.59
Defense Funding Outside of the Department of Defense
Figure 4 Defense Funding Outside of the Department of Defense
Figure 2 shows subfunctions within the National Defense (050) budget function. The Department of Defense (DOD)-Military (051) subfunction accounts for over 95% of that funding. Almost all of the Atomic Energy Defense Activitiesof the atomic energy defense activities (053) subfunction supports operations within the U.S. Department of Energy (DOE). About two-thirds of that funding supports the National Nuclear Security Administration (NNSA) and the remainder funds environmental clean-up of weapons production and research sites, along with other related activities. Much smaller amounts support the Defense Nuclear Facilities Safety Board and site remediation activities of the U.S. Army Corps of Engineers.
The defense-related activities (54) subfunction comprises a variety of activities outside of DOD. In recent years, funding for counterterrorism activities within the Federal Bureau of Investigation (FBI) has accounted for almost two-thirds of all funding within this subfunction and about half of the FBI's total discretionary funding.
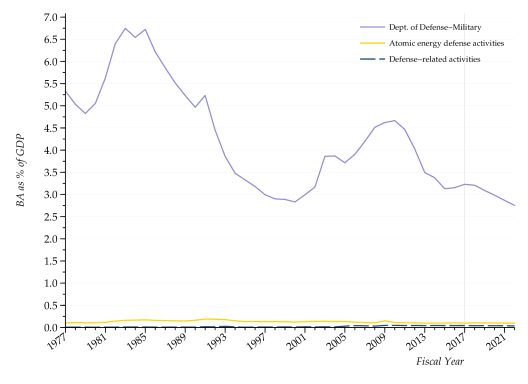
The Defense-Related Activities (54) subfunction comprises a variety of activities outside of DOD. In recent years, funding for counterterrorism activities within the Federal Bureau of Investigation (FBI) has accounted for almost two-thirds of all funding within this subfunction and about half of the FBI’s total discretionary funding.
International Affairs
Figure 5 International Affairs
Figure 3 shows levels of budget authority allocated to international affairs (budget function 150) as a share of GDP. Spending for activities within the international affairs budget function has fluctuated in response to changes in U.S. foreign relations and federal priorities. International security assistancepolicy and national security and economic priorities.
Figure 5. International Affairs (150) Subfunctions
Discretionary budget authority as a percentage of GDP, FY1977-FY2028
Source: CRS, based on OMB data from FY2024 budget submission. Notes: FY2023 levels are estimated. FY2024-FY2028 levels reflect Administration proposals and projections. See OMB budget documents for further caveats.
International Security Assistance rose sharply in the late 1970s and early 1980s, in large part due to foreign military financing support provided to Israel and Egypt following the 1979 Camp
Congressional Research Service
17
link to page 23 Discretionary Budget Authority by Subfunction: An Overview
David Accords.60David Accords.35 The Economic Support Fund (ESF), which provides financial support to promote political and socioeconomic stability within a range of countries of strategic importance to the United States, also grew rapidly in the same time period.3661 Funding for security assistance fell after the collapse of the Warsaw Pact governments in 1989 and the dissolution of the Soviet Union in 1991.
The level of funding for International Development and Humanitarian AssistanceUnion in 1991.
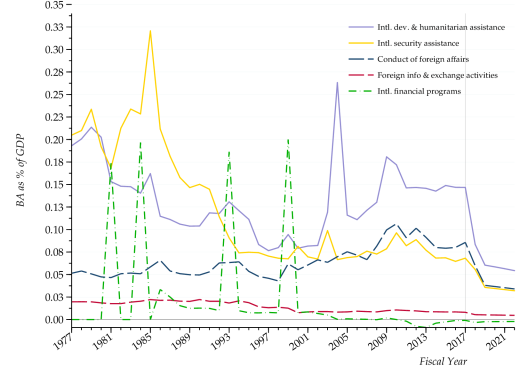
The level of funding for international development and humanitarian assistance fell from about 0.2% of GDP in the late 1970s to less than 0.1% of GDP in the 1990s. The George W. Bush Administration increased funding for international development and humanitarian assistance in International Development and Humanitarian Assistance in the early 2000s through initiatives such as the President'’s Emergency Plan for AIDS Relief (PEPFAR), which has supported programs to stem the spread of AIDS and HIV in sub-Saharan Africa and southSouth Asia, and creation of the Millennium Challenge Corporation (MCC), which sought to use financial incentives to spur economic development and reform.37 While funding for the MCC was curtailed during the Barack seeks to spur economic growth in relatively well-governed developing countries.62 During the Obama Administration, funding for international development and humanitarian assistance International Development and Humanitarian Assistance hovered around 0.15% of GDP, about midway between levels seen in the 1970s and in the 1990s. More recently, largely as a result of U.S. responses to the COVID-19 pandemic starting in 2020 and Russia’s renewed invasion of Ukraine in 2022, International Development and Humanitarian Assistance has risen. In 2022, International Development and Humanitarian Assistance as a share of GDP peaked at more than 0.18%, a level last seen around 2009.
Costs of conducting foreign affairs, relative to GDP, rose during the first decade of the wars in Afghanistan and Iraq, but largely declined between FY2012 and FY2019. Following the declaration of the COVID-19 pandemic in 2020, the U.S. withdrawal from Afghanistan in 2021, and Russia’s renewed invasion of Ukraine in 2022, Function 150 relative to GDP has increased. hovered around 0.15% of GDP, about midway between levels seen in the 1970s and in the 1990s.
Fluctuations in the level of funding for international financial programs have been dominated by occasional quota payments by the United States in the International Monetary Fund (IMF).38 The U.S. government receives special drawing rights (SDRs), which contribute to the capital base of the IMF, in exchange for those quota payments. The budgetary treatment of IMF quota payments has not been consistent. Since 2009, the budgetary costs of IMF quota payments have been calculated by an evaluation of the risks that non-payment of loans made by the IMF could reduce the value of U.S. investments in the IMF.39 Thus, the spikes in funding for international financial programs seen in Figure 3 reflect changes in budgetary concepts rather than changes in policy or funding levels.
Costs of conducting foreign affairs, relative to GDP, rose during the first decade of the wars in Afghanistan and Iraq, but have been declining since FY2012. Heightened concerns over security of diplomatic facilities and personnel have also contributed to Heightened concerns over security of diplomatic facilities and personnel have also contributed to overall higher funding levels since 2001.
Domestic Social Programs
This section discusses budgetary trends among domestic social programs. In the past two decades, federal responses to the attacks of September 11, 2001, the 2007-2009 financial crisis and ensuingand the Great Recession, and the COVID-19 pandemic have had the most prominent effects of spending trends for most categories of federal domestic spending.
Non-Defense Security and Non-Securityspending. Figure 6 shows discretionary funding trends for budget functions within the Human Resources superfunction.
60 U.S. General Accounting Office (now Government Accountability Office; GAO), Military Sales to Israel and Egypt: DOD Needs Stronger Controls Over U.S.-Financed Procurements, GAO/NSIAD-93-184, July 1993, http://www.gao.gov/assets/160/153579.pdf.
61 For more on U.S. foreign assistance history and trends, see CRS Report R40213, Foreign Assistance: An Introduction to U.S. Programs and Policy, by Emily M. McCabe and Nick M. Brown.
62 See CRS Report RL32427, Millennium Challenge Corporation: Overview and Issues, by Nick M. Brown.
Congressional Research Service
18
link to page 24
Discretionary Budget Authority by Subfunction: An Overview
Figure 6. Discretionary Funding for Human Resources Functions
Discretionary budget authority as a percentage of GDP, FY1977-FY2028
Source: CRS, based on OMB data from FY2024 budget submission. Notes: FY2023 levels are estimated. FY2024-FY2028 levels reflect Administration proposals and projections. See OMB budget documents for further caveats.
Nondefense Security and Nonsecurity Spending Diverge After 9/11
Spending Diverge After 9/11
Domestic spending (i.e., non-defensenondefense spending excluding international affairs) increased after the attacks of September 11, 2001, after having fallen for much of the 1990s. Most of that increase in domestic spending occurred in areas related to non-defensenondefense security spending, as the federal government overhauled airport security procedures, and then established the Department of Homeland Security. Since 2001, several definitions of "“security spending"” have been used, most recently in the 2011 Budget Control Act (BCA).4063 Figure 4 7 shows funding trends divided by BCA security and non-security categories.
nonsecurity categories.
63 The Obama Administration defined security spending in its FY2012 budget as funding for Department of Defense-Military (subfunction 051); the Department of Energy’s National Nuclear Security Administration; International Affairs (function 150, which includes State Department and related agencies); the Department of Homeland Security; and the Department of Veterans Affairs. The BCA defined security similarly, except that it included all military activities within the Department of Defense excluding war funding (i.e., defined by department rather than by subfunction), and also included the Intelligence Community Management Account.
Congressional Research Service
19
Discretionary Budget Authority by Subfunction: An Overview
Figure 7. Security and Nonsecurity Funding Trends
Budget Authority as a Percentage of GDP, FY1977-FY2028
Source: CRS, based on OMB data from FY2024 budget submission. Notes: BCA security and nonsecurity categories used. Nondefense security is BCA security spending apart from National Defense budget function 050. FY2023 levels are estimated. FY2024-FY2028 levels reflect Administration proposals and projections. See OMB budget documents for further caveats.
The Recovery Act
The Recovery Act
After the financial crisis of 2007-2008 plunged the United States into the deepest economic recession in decades, Congress passed the American Recovery and Reinvestment Act of 2009 ((P.L. 111-5; ARRA), often known as the Recovery Act. ARRA includes support for state and local governments, as well as tax cuts and rebates among other provisions.4164 According to initial CBO estimates, ARRA provisions were expected to total $787.2 billion in increased spending and reduced taxes over the FY2009-FY2019 period or just over 5% of GDP in 2008, while a more recent CBO estimate put the total at $814 billion.4265 The effects of Recovery Act spending can be seen in most of the figures shown below.
64 For more information on the provisions of ARRA, see CRS Report R40537, American Recovery and Reinvestment Act of 2009 (P.L. 111-5): Summary and Legislative History, by Clinton T. Brass et al.
65 For initial estimates, see U.S. Congressional Budget Office, Cost Estimate For the Conference Agreement For H.R. 1, February 13, 2009, available at http://cbo.gov/ftpdocs/99xx/doc9989/hr1conference.pdf. For a later assessment, see CBO, Budget and Economic Outlook: An Update, August 2010, Box 1-2, available at http://www.cbo.gov/ftpdocs/117xx/doc11705/08-18-Update.pdf.
Congressional Research Service
20
link to page 25 link to page 25
Discretionary Budget Authority by Subfunction: An Overview
Since 2010, however, total nondefenseseen in most of the figures shown below.
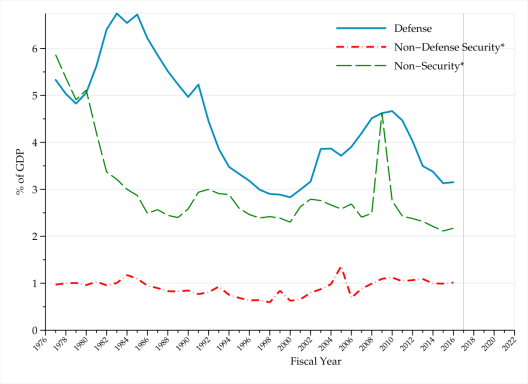
Since 2010, however, total non-defense discretionary spending has declined in real (i.e., inflation-adjusted) terms.43 Non-defense66 Nondefense discretionary spending as a share of the economy been has declining more rapidly. Although economic growth has been relatively sluggish, most components of federal spending have grown even more slowly. Funding trends for most budget categories since FY2010 have been less volatile than in past decades.
Education, Training, Employment, and Social Services
Figure 5 8 shows spending trends for subfunctions within the Education, Training, Employment, and Social Services budget function.
Federal training and employment programs designed to address unemployment following the first oil shock of 1973, such as the Comprehensive Employment and Training Act (CETA, Federal support for employment and training programs generally declined as a share of GDP between 1977 and 2023, the period depicted in Figure 8.
Figure 8. Education, Training, Employment, and Social Services (500) Subfunctions
Discretionary budget authority as a percentage of GDP, FY1977-FY2028
Source: CRS, based on OMB data from the FY2024 budget submission. Notes: FY2023 levels are estimated. FY2024-FY2028 levels reflect Administration proposals and projections. See OMB budget documents for further caveats.
The initial higher levels of funding largely reflect public service employment efforts under the Comprehensive Employment and Training Act (CETA; P.L. 93-203), accounted for the largest share of spending within that budget function. The successor program, the), which addressed high levels of unemployment following the first oil shock of 1973. The Job Training Partnership Act of 1982 (JTPA; (P.L. 97-300), was ), enacted during the 1981-1982 recession, replaced CETA. After 1984, discretionary
66 See OMB, The Budget for FY2024, Historical Tables, Table 8.2, https://www.whitehouse.gov/wp-content/uploads/2023/03/hist08z2_fy2024.xlsx.
Congressional Research Service
21
link to page 27 link to page 32 Discretionary Budget Authority by Subfunction: An Overview
funding has declined as a share of GDP. Under subsequent workforce development statutes, the Workforce Investment Act of 1998 (P.L. 105-220) and the Workforce Innovation and Opportunity Act of 2014 (P.L. 113-128), training and employment funding as a share of GDP continued to decline.67
enacted during the 1981-1982 recession. Later jobs and training programs, such as the Workforce Investment Act of 1998 (WIA; P.L. 105-220), operated on lower funding levels.
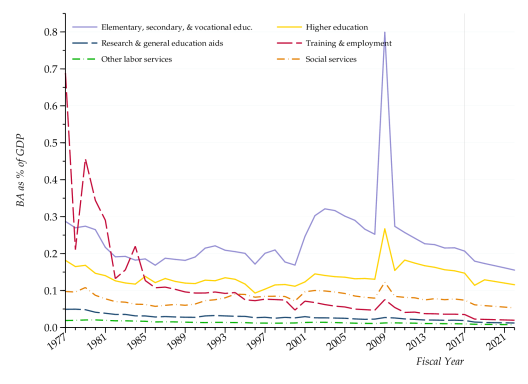
Federal support for elementary and secondary education increased sharply following the reauthorization of the Elementary and Secondary Education Act (ESSAESEA) by the No Child Left Behind Act of 2001 (NCLB; P.L. 107-110). Funding for most subfunctions within the budget functionfunction, including elementary, secondary, and higher education, rose sharply with enactment of ARRA and other legislative responses to the Great Recession of 2007-2009. Since 2010, however, funding levels—measured as a percentage of GDP—have tapered off.
Funding levels for education as measured as a percentage of GDP tapered off until 2020 with the enactment of discretionary funding for federal education programs in response to the COVID-19 pandemic through the Coronavirus Aid, Relief, and Economic Security Act (CARES Act; P.L. 116-136). The majority of CARES Act education-focused funds were provided through the Education Stabilization Fund (ESF). Additional discretionary funding was provided for the ESF and ESF programs in response to the COVID-19 pandemic through the Coronavirus Response and Relief Supplemental Appropriations Act, 2021 (CRRSAA; Division M of the Consolidated Appropriations Act, 2021 [P.L. 116-260]). Finally, the largest tranches of pandemic-related funding for ESF programs were provided through mandatory funding included in the American Rescue Plan Act of 2021 (ARPA; P.L. 117-2).68 Since 2021, discretionary funding levels for elementary and secondary education—measured as a percentage of GDP—have attenuated.
Federal Health Programs
Federal Health Programs
Costs of federal health programs continue to play a central role in budgetary discussions. Total federal costs of the largest federal health care programs such as Medicare and Medicaid, however, are nearly all supported by mandatory spending and are thus not discussed here. Administrative costs for those programs, which account for a small portion of those costs, are generally funded by discretionary spending. Many other federal health programs, such as federal support for health research, public health programs, and veterans'’ health care, are mostly funded through discretionary spendingspending. Figure 6 9 shows trends in discretionary funding within the Health (550) and Medicare (570) budget functions since FY1977. Several discretionary health subfunctions saw substantial increases during the COVID-19 pandemic.
The trajectory of funding for the hospital and medical care for veterans subfunction, which falls under another budget function and is also shown in Figure 12, is included for the sake of comparison. Veterans’ health care spending as a percentage of GDP has increased since 2009 due to community care, mental health, and suicide prevention reforms that have increased overall spending. The veterans’ health care budget subfunction also saw one-time increases during the COVID-19 pandemic in 2020 and 2021.69
67 See CRS Report R44252, The Workforce Innovation and Opportunity Act and the One-Stop Delivery System for historical background.
68 Approximately one-quarter of the discretionary and mandatory funds provided for the ESF and ESF programs was dedicated to higher education; OMB attributed all of such funds to the elementary and secondary education subfunction. For more information about discretionary and mandatory funding provided to support elementary, secondary, and higher education during the COVID-19 pandemic, see CRS Report R47027, Education Stabilization Fund Programs Funded by the CARES Act, CRRSAA, and ARPA: Background and Analysis.
69 See CRS Report R45390, VA Maintaining Internal Systems and Strengthening Integrated Outside Networks Act of 2018 (VA MISSION Act; P.L.115-182); CRS Report R46848, Commander John Scott Hannon Veterans Mental Health Care Improvement Act of 2019 (P.L. 116-171) and Veterans COMPACT Act of 2020 (P.L. 116-214); CRS Report (continued...)
Congressional Research Service
22
Discretionary Budget Authority by Subfunction: An Overview
Figure 9. Federal Health Programs
Discretionary budget authority as a percentage of GDP, FY1977-FY2028
Source: CRS, based on OMB data from the FY2024 budget submission. Notes: FY2023 levels are estimated. FY2024-FY2028 levels reflect Administration proposals and projections.
and Medicare (570) budget functions since FY1977.
Discretionary budget authority as a percentage of GDP, FY1977-FY2022 |
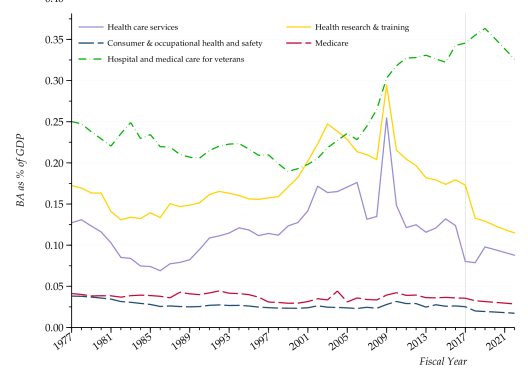 |
|
Source: CRS, based on OMB data from the FY2018 budget submission. Notes: FY2017 levels are estimated. FY2018-FY2022 levels reflect Administration proposals and projections. |
The trajectory of funding for the hospital and medical care for veterans subfunction, which falls under another budget function and is also shown in Figure 9, is included for the sake of comparison. While discretionary funding for federal health programs has decreased as a share of GDP since FY2009, funding for veterans' health care has continued to increase in recent years.
Discretionary funding within the health care services (551) subfunction supports activities and programs administered by the Centers for Disease Control and Prevention (CDC), the Health Resources and Services Administration, the Substance Abuse and Mental Health Services Administration (SAMSA), and the Indian Health Service (IHS), among other health-related agencies. From the mid-1980s through FY2001, funding within the health care services subfunction doubled. Since then, funding trends have been more volatile. The spike in funding for the health care services subfunction in FY2009, evident in Figure 6, reflects funding for responses to an anticipated influenza pandemic,44 as well as funding in ARRA for health information technology investments and bioterrorism countermeasures. The downward spike in FY2017 and FY2018 reflects a CHIMP (Change in Mandatory Spending Program) affecting the State Children's Health Insurance Program (CHIP).45
This budget subfunction has seen spikes during public health emergencies and from other one-time funding.70 The large spike during 2020-2021 reflected the substantial and unprecedented spending for the health response to the COVID-19 pandemic.71
R46340, Federal Response to COVID-19: Department of Veterans Affairs; CRS Report R46459, Department of Veterans Affairs FY2021 Appropriations; and CRS Report R46964, Department of Veterans Affairs FY2022 Appropriations.
70 The 2009 spike was linked to spending in response to the 2009 H1N1 influenza pandemic (P.L. 111-32) as well as one-time health investments in the American Recovery and Reinvestment Act of 2009 (P.L. 110-5).
71 See CRS Report R46711, U.S. Public Health Service: COVID-19 Supplemental Appropriations in the 116th Congress
Congressional Research Service
23
link to page 29 Discretionary Budget Authority by Subfunction: An Overview
The National Institutes of Health (NIH) accounts for most of the health research and training (552) subfunction. Discretionary funding within the health research and training subfunction has consistentlyusually exceeded discretionary funding for the health care services subfunction, except during the COVID-19 pandemic. After funding in the health research and training subfunction failed to keep up with the rate of GDP growth in the late 1970s and early 1980s, funding grew steadily as a percentage of GDP for the next 20 years. In the late 1990s, policymakers decided to double the NIH budget within a five-year period, from FY1999 to FY2003.46 After FY2003, 72 From FY2003 to FY2016, however, funding as a percentage of GDP has generally fallenfell, with the exception of increased funding provided through ARRA in FY2009.47
73 From FY2016 to FY2023, NIH has seen relatively modest funding increases each year with a spike during the COVID-19 pandemic.74 Discretionary funding for Medicare (subfunction 571), which, as noted above, mostly funds administrative costs, and the consumer and occupational health and safety (554) subfunction, which includes U.S. Food and Drug Administration (FDA) spending, has been relatively stable over time. Each has remained at about 0.03% to 0.04% of GDP over the period.
Total FDA spending increased over the period covered, but budget authority provided through the annual appropriations from the Treasury general fund has been offset by user fees collected by the agency.75
Income Security
Income Security
The bulk of federal funding for income security programs is provided through mandatory spending. In general, discretionary spending—outside of housing assistance—funds administrative costs of those programs. Housing assistance programs, unlike most other income security programs, are largely supported by discretionary fundingfunding. Figure 7 10 shows trends in the Income Security (600) budget function.
The largest changes within the Income Security budget function reflect shifts in the structure and funding levels for programs within the housing assistance (604) subfunction in the 1970s and early 1980s.4876 Federal support for affordable housing shifted from supporting up-front long-term funding for construction of publicly subsidized units toward annual funding for rent subsidies for low-income households to use in existing housing and block grants to local governments over the time period in question.4977 Since the late 1970s, the share of fundingBA for housing assistance has fluctuated, driven by the creation of new programs and activities, as well as rescissions of recaptured unobligated balances. Housing assistance'’s share of GDP, however, has remained at less than a quarter of what it was at its peak. Legislative responses to the Great Recession of 2007-2009 led to increased funding for various housing programs in FY2009. Discretionary funding for tenant rental and homeless assistance increased modestly in FY2020.
Discretionary funding for other income security subfunctions has generally remained below 0.1% of GDP until FY2020. Responses to the COVID-19 pandemic increased funding for some programs,
72 See CRS Report R43341, National Institutes of Health (NIH) Funding: FY1996-FY2024. 73 P.L. 110-5. 74 See CRS Report R43341, National Institutes of Health (NIH) Funding: FY1996-FY2024. 75 See CRS Report R44576, The Food and Drug Administration (FDA) Budget: Fact Sheet. 76 See The Reagan Record, eds., John L. Palmer and Isabel V. Sawhill, (Washington, D.C.: Urban Institute, 1984), Appendix C, pp. 372-373.
77 Katherine M. O'Regan and John M. Quigley, “Federal Policy and the Rise of Nonprofit Housing Providers,” Journal of Housing Research, vol. 11, no. 2 (2000), pp. 301-302. Also see Charles L. Edson, “Affordable Housing—An Intimate History,” Journal of Affordable Housing and Community Development, vol. 20, no. 2 (winter 2011), pp. 193-213.
Congressional Research Service
24
link to page 30
Discretionary Budget Authority by Subfunction: An Overview
such as for the Child Care and Development Block Grant, although increases in mandatory spending were larger.78
Figure 10GDP throughout the period.
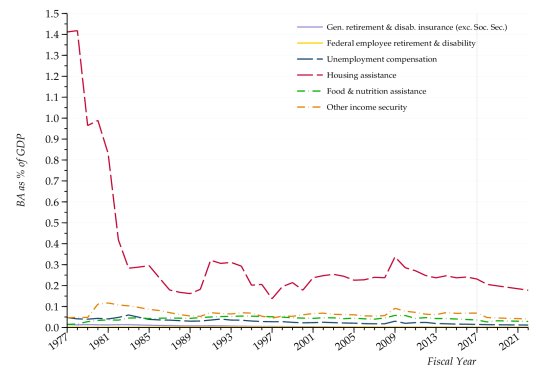
Social Security
Discretionary funding for Social Security, depicted inin Figure 8,11, supports program administration. Social Security benefits are generally funded by mandatory spending. Program administration costs supported by discretionary funding are a small fraction of mandatory benefit amounts. Those costs, which increased in nominal dollar terms in most years, grew more slowly than the rate of economic growth. Over time, the composition of those costs evolved. In the 1970s, costs of administrating Old-Age and Survivors Insurance (OASI) benefits were nearly three times as large as those for Disability Insurance (DI) benefits. Since FY2012, costs of administering DI benefits, however, have exceeded costs of administering OASI benefits.
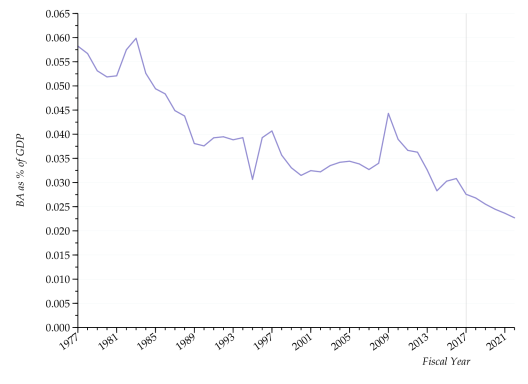
Veterans'’ Benefits and Services
The Department of Veterans Affairs (VA) provides a range of benefits and services to veterans who meet certain eligibility criteria.79 These benefits and services include, among other things, hospital and medical care; disability compensation and pensions; education; veteran readiness and employment (VR&E); assistance to homeless veterans; home loan guarantees; administration of life insurance, as well as traumatic injury protection insurance for servicemembers; and death benefits that cover burial expenses.80
79 For details on basic criteria, including the statutory definition of “veteran,” see CRS Report R47299, U.S. Department of Veterans Affairs: Who Is a Veteran?
80 For more information on health care programs, see CRS Report R42747, Health Care for Veterans: Answers to Frequently Asked Questions. For more information on disability benefit programs, see CRS Report R44837, Benefits for Service-Disabled Veterans; and CRS Report R47163, Department of Veterans Affairs: Claims Process and Compensation and Pension Exams by Contracted Physicians. For information on pension programs, see CRS Report R46511, Veterans Benefits Administration (VBA): Pension Programs. For a discussion of education benefits, see CRS Report R42785, Veterans’ Educational Assistance Programs and Benefits: A Primer. For details on VA’s vocational rehabilitation and employment, see CRS Report RL34627, Veterans’ Benefits: The Veteran Readiness and Employment Program. For detailed information on homeless veterans programs, see CRS Report RL34024, Veterans and Homelessness. For more information on burial benefits, see CRS Report R41386, Veterans’ Benefits: Burial Benefits and National Cemeteries.
Congressional Research Service
26
link to page 32 Discretionary Budget Authority by Subfunction: An Overview
Health care provided through VA’s Veterans Health Administration (VHA) accounts for a majority (about 90%) Benefits and Services
Health care provided through the Veterans Health Administration (VHA) within the Department of Veterans Affairs (VA) accounts for the bulk of discretionary funding within the Veterans'’ Benefits and Services (700) budget function.81 For instance, in FY2023 VA’s total discretionary funding was $134.72 billion, and VHA accounted for $119.66 billion.82function. Departmental administration, information technology, and smaller discretionary benefit programs account for the remainder.5083 Veterans'’ income security programs, such as disability compensation, pensions, and readjustment benefits (such as education), are generally supported by mandatory spending. Essentially all discretionary spending within the veterans'veterans’ benefits and services subfunction supports operations within the VA. Figure 9 general operating expenses for administering disability compensation and readjustment benefits and services. Figure 12 shows trends in discretionary funding for the veterans'’ benefits and services budget function since FY1977.
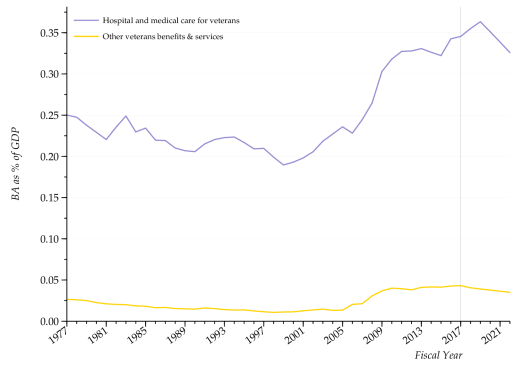
The Hospital and Medical Care for Veterans (703) subfunction accounts for the bulk of funding with the veterans' benefits and services budget function. Since 2001, veterans' health care costs have been one of the fastest growing components of discretionary spending. The Veterans' Health Care Eligibility Reform Act of 1996 (P.L. 104-262) required the establishment of a national enrollment system to manage the delivery of inpatient and outpatient medical care. In FY1999, the VHA began enrolling veterans and classifying them into priority groups. Prior to the VHA enrollment system's setup, provision of care to veterans was based on available resources.51 By FY2000, just over 4.9 million eligible veterans—19% of all veterans—were enrolled in the VHA. By FY2016 that number increased by an estimated 90% to 9.4 million enrollees.52 During the same period, the total number of veterans decreased by 14%.53 Those trends reflect enrollment in newer veterans from wars and occupations in Afghanistan (Operation Enduring Freedom/OEF) and Iraq (Operation Iraqi Freedom/OIF and Operation New Dawn/OED), growth in female veterans, and economic conditions, among other factors. The number of veterans receiving VA health care services, according to VA projections, will level off over the next 10 years.54
Second, the demand and reliance on VA care affects health care spending. VA estimates that of the enrolled veterans in the VA health care system, on average about 38% rely on the VA for their health care needs.89 Nevertheless, a higher percentage of veterans enrolled in the VA health care system have multiple chronic conditions when compared to the nonveteran population. For example, veterans generally experience arthritis earlier when compared to nonveterans; veterans have higher rates of cancer than nonveterans after age 50; and veterans deployed to a theater of conflict and those living in a rural county have slightly increased incidence of chronic diseases.90 These higher morbidity rates increase VA’s health care spending.91
89 “Reliance is defined as the portion of enrollees’ total health care needs expected from the VA health care system, including both VA direct care and community care paid by VA, versus other health care options. For example, if an enrollee received 10 office visits in a year, 4 from VA and 6 through Medicare, that enrollee would be considered 40% (= 4 / 10) reliant on VA for office visits.” Department of Veterans Affairs, FY2023 Congressional Submission, Medical Programs and Information Technology Programs, vol. 2 of 4, March 2022, p. VHA-440.
90 Department of Veterans Affairs, Veterans Health Administration, VISION PLAN, Updated Response to 38 U.S.C. 7330C(b): Strategy Regarding the Department of Veterans Affairs High-Quality Integrated Health Care System, December 2020, p. 48.
91 Department of Veterans Affairs, FY2023 Congressional Submission, Medical Programs and Information Technology Programs, vol. 2 of 4, March 2022, p. 420.
Congressional Research Service
28
link to page 34 Discretionary Budget Authority by Subfunction: An Overview
Third, since 2009 the Congress has expanded programs for community care,92 mental health and suicide prevention, and services for women veterans at VA, with the passage of several major pieces of legislation. These include, among others, the John S. McCain III, Daniel K. Akaka, and Samuel R. Johnson VA Maintaining Internal Systems and Strengthening Integrated Outside Networks Act of 2018 or the “VA MISSION Act of 2018” (P.L. 115-182); the Johnny Isakson and David P. Roe, M.D. Veterans Health Care and Benefits Improvement Act of 2020 (P.L. 116-315); the Commander John Scott Hannon Veterans Mental Health Care Improvement Act of 2019 (P.L. 116-171); and the Veterans Comprehensive Prevention, Access to Care, and Treatment Act of 2020 or the “Veterans COMPACT Act of 2020” (P.L. 116-214). Finally, the veterans’ health care budget subfunction also saw one-time funding increases during the COVID-19 pandemic in 2020 and 2021.93
Funding within the Other Veterans Benefits and Services (705) subfunction, which has accounted for roughly one-tenth of funding within the Veterans'’ Benefits and Services budget function, has doubled since FY2005 as a percentage of GDP.
Physical Resources
Energy
The Physical Resources superfunction includes the budget subfunctions Energy, Natural Resources and Environment, Commerce and Housing Credit, Transportation, and Community and Regional Development. Figure 13 shows discretionary funding for each of those budget functions as a percentage of GDP.
Energy
Most funding within the Energy budget function supports operations of the Department of Energy (DOE). The remainder supports rural electrification programs within the U.S. Department of Agriculture, tax credits administered by the U.S. Treasury, certain activities of the Nuclear Regulatory Commission, the Tennessee Valley Authority, and a few other agencies. About half of DOE'DOE’s budget funds nuclear weapons programs or efforts to clean up sites used by those programs, which fall within the atomic energy defense activities (053) subfunction.
Atomic Energy Defense Activities (053) subfunction.
92 Department of Veterans Affairs, FY2023 Congressional Submission, Medical Programs and Information Technology Programs, vol. 2 of 4, March 2022, p. VHA-29. Also see, Congressional Budget Office, The Veterans Community Care Program: Background and Early Effects, October 21, 2021.
93 See CRS Report R45390, VA Maintaining Internal Systems and Strengthening Integrated Outside Networks Act of 2018 (VA MISSION Act; P.L.115-182); CRS Report R46848, Commander John Scott Hannon Veterans Mental Health Care Improvement Act of 2019 (P.L. 116-171) and Veterans COMPACT Act of 2020 (P.L. 116-214); CRS Report R46340, Federal Response to COVID-19: Department of Veterans Affairs; CRS Report R46459, Department of Veterans Affairs FY2021 Appropriations; and CRS Report R46964, Department of Veterans Affairs FY2022 Appropriations.
Congressional Research Service
29
link to page 35
Discretionary Budget Authority by Subfunction: An Overview
Figure 13. Discretionary Funding for Physical Resources
Discretionary budget authority as a percentage of GDP, FY1977-FY2028
Source: CRS, based on OMB data from FY2024 budget submission. Notes: FY2023 levels are estimated. FY2024-FY2028 levels reflect Administration proposals and projections. See OMB budget documents for further caveats.
The largest spike in funding within the energy supply (271) subfunction visible in Figure 10 14 reflects responses to the second oil shock of 1978-1979. Following a revolution in 1978, Iran cut its oil exports, which caused widespread disruptions through world energy markets in 1979.5594 In June 1980, President Jimmy Carter signed the Energy Security Act (P.L. 96-294), which established various renewable energy initiatives and provided $88 billion for synthetic fuels production.5695 The Synthetic Fuels Corporation, which the act had created, was abolished in 1985 after struggling to develop viable projects.57
96
A smaller downtick in the emergency energy preparedness (274) subfunction in FY1980 also reflects world oil supply disruptions that followed the Iranian revolution. The United States, in consultation with G7 partner countries, agreed to suspend oil purchases for the Strategic
94 Daniel Yergin, The Prize: The Epic Quest for Oil, Money and Power, (New York: Free Press, 1991), ch. 33. 95 Jimmy Carter, “Energy Security Act Remarks on Signing S. 952 Into Law,” June 30, 1980; http://www.presidency.ucsb.edu/ws/?pid=44684.
96 Robert D. Hershey Jr., “Synfuels Corp. is Running on Empty,” New York Times, August 25, 1985. The Synthetic Fuels Corporation was disestablished by P.L. 99-190 and P.L. 99-272.
Congressional Research Service
30
link to page 35
Discretionary Budget Authority by Subfunction: An Overview
Petroleum Reserve in early 1979.97Petroleum Reserve in early 1979.58 In June 1980, the Energy Security Act mandated resumed oil reserve purchases, although $2 billion was rescinded from the Strategic Petroleum Reserve the following month, which is reflected in the negative value for FY1980.5998 Congress required additional oil reserve purchases in December 1980.60
99
Figure 14. Energy (270) Subfunctions
Discretionary budget authority as a percentage of GDP, FY1977-FY2028
Source: CRS, based on OMB data from FY2024 budget submission. Notes: FY2023 levels are estimated. FY2024-FY2028 levels reflect Administration proposals and projections. See OMB budget documents for further caveats.
The smaller spike visible in Figure 10 14 resulted from funding in ARRAprovided by ARRA in 2009, which provided $90 billion in funding or tax credits for clean energy projects, not all of which was were within the energy budget function. DOE received about $35 billion in funding, with most of the remainder supporting energy-related tax credits as well as mass transportation and high-speed rail initiatives.100 The bump in discretionary budget authority beginning in FY2022 is a result of
97 U.S. Congress, Senate Committee on Energy and Natural Resources, Subcommittee on Energy Resources and Materials Production, Strategic Petroleum Reserve, 96th Cong., 1st sess., December 13, 1979, S.Hrg. 96-91 (Washington: GPO, 1980). G7 members are the United States, the United Kingdom, France, the Federal Republic of Germany, Italy, Japan, Canada, and the European Union.
98 Supplemental Appropriations and Rescission Act, 1980 (P.L. 96-304). 99 P.L. 96-514. 100 Center for Climate and Energy Solutions, “U.S. Department of Energy’s Recovery Act Investments,” issue brief, January 5, 2013, http://www.c2es.org/docUploads/arra-brief-feb-2013.pdf. See Transportation section below.
Congressional Research Service
31
link to page 37 link to page 37 Discretionary Budget Authority by Subfunction: An Overview
funding provided by the Infrastructure Investment and Jobs Act (IIJA, P.L. 117-58), which appropriated more than $62.2 billion over five years (FY2022-FY2026) to DOE.
initiatives.61
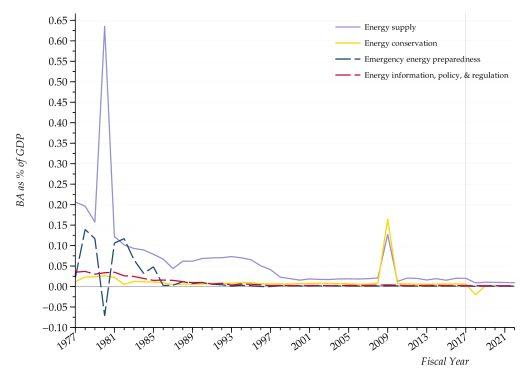
Natural Resources and Environment
Natural Resources and Environment
Funding within the Natural Resources and Environment budget function supports activities of a wide range of federal agencies. Much of the discretionary funding for the U.S. Department of the Interior (DOI) and all of the discretionary funding for the U.S. Environmental Protection Agency (EPA) falls within this function, as does most of the funding for the Forest ServiceU.S. Forest Service and certain conservation programs of agencies within the U.S. Department of Agriculture (USDA). Funding within this budget function also supports operations of the U.S. Department of Commerce's ’s National Oceanic and Atmospheric Administration (NOAA), water projects of the U.S. Army's Corps of Engineers (USACE), and the U.S. Coast Guard'’s pollution control activities related to spills of oil and hazardous substances in the coastal zone, among other agencies and activities.
The Natural Resources and Environment function has five subfunctions: water resources (301), conservation and land management (302), recreational resources (303), pollution control and abatement (304), and other natural resources (306).101 As a percentage of GDP, more variation in discretionary budget authority was exhibited throughout the period in three subfunctions—water resources, conservation and land management, and pollution control and abatement—than in the other two subfunctions.
The water resources subfunction (301) principally represents water infrastructure (e.g., multipurpose dams, navigation locks, levees) built and sometimes owned and operated by the federal government. Discretionary budget authority for water resources projects has, by and large, declined as a percentage of GDP since the late-1970s, as Figure 15 indicates, due to a number of reasons. For instance, the Water Resources Development Act of 1986 (WRDA; P.L. 99-662) changed cost shares for USACE projects that reduced the federal share of project costs. Also, a number of Administrations reduced emphasis on construction of large, multipurpose federal water resource infrastructure, including by the Bureau of Reclamation, in general.102 In certain years since FY2005, funding for the water resources subfunction increased as a percentage of GDP. The peaks shown in Figure 15 generally reflect enactment of supplemental appropriations for natural disaster response (e.g., hurricanes and subsequent construction of flood risk reduction projects), economic stimulus, and infrastructure development.103
Discretionary budget authority for the conservation and land management subfunction (302) encompasses various agencies and programs. It includes funding for certain U.S. Department of Agriculture agencies and certain DOI agencies, among other entities.104 Discretionary budget
101 There is no subfunction 305. 102 For more information on these policy decisions and implications regarding two primary water resources agencies, see CRS Report R45185, Army Corps of Engineers: Water Resource Authorization and Project Delivery Processes, by Nicole T. Carter and Anna E. Normand, and CRS Report R46303, Bureau of Reclamation: History, Authorities, and Issues for Congress, by Charles V. Stern and Anna E. Normand.
103 For example, see Figure 1 in CRS In Focus IF11945, U.S. Army Corps of Engineers: Supplemental Appropriations, by Anna E. Normand and Nicole T. Carter, and Table 2 in CRS Report R47440, Water Resource Issues in the 118th Congress, by Anna E. Normand et al.
104 Agriculture agencies include the U.S. Forest Service (including for wildland fire management) and conservation programs of the Farm Service Agency and Natural Resources Conservation Service. DOI agencies include certain accounts and activities of the Bureau of Indian Affairs; Bureau of Land Management; Bureau of Ocean Energy Management; Bureau of Safety and Environmental Enforcement; Office of Surface Mining Reclamation and Enforcement; U.S. Fish and Wildlife Service; and U.S. Department of the Interior, Departmental Offices and Department-Wide programs (e.g., wildland fire management), among others.
Congressional Research Service
32
link to page 37
Discretionary Budget Authority by Subfunction: An Overview
authority for this subfunction fluctuated over the period examined. It declined overall from the late 1970s to about half that level in FY2021. The peak in FY2022, as a percentage of GDP, can be attributed in large part to emergency supplemental funding in the Infrastructure Investment and Jobs Act (P.L. 117-58, IIJA) for various activities within the subfunction. They included abandoned mine land and water reclamation projects; orphaned well site plugging, remediation, and restoration activities; federal land and resource management; ecosystem restoration; and wildland fire management.
Figure 15. Natural Resources and Environment (300) Subfunctions
Discretionary budget authority as a percentage of GDP, FY1977-FY2028
Source: CRS, based on OMB data from FY2024 budget submission. Notes: FY2023 levels are estimated. FY2024-FY2028 levels reflect Administration proposals and projections. See OMB budget documents for further caveats.
The recreational resources subfunction (303) includes the National Park Service (NPS) as well as various smaller entities. From the late 1970s to the early 1980s, discretionary budget authority for recreational resources (303) declined as a percentage of GDP. This was partly due to a reduction in funding from the Land and Water Conservation Fund for the NPS. Portions of this fund are provided to the NPS for land acquisition and grants to states for outdoor recreation. Thereafter, recreational resources continued to decline, but at a more modest rate than previously.
The pollution control and abatement subfunction (304) includes a wide range of environmental protection activities of EPA and other federal agencies under authority of statutes such as the Clean Air Act, Clean Water Act, Safe Drinking Water Act, and Comprehensive Environmental Response, Compensation, and Liability Act (Superfund). The peak in Figure 15, in the 1970s,
Congressional Research Service
33
link to page 37 link to page 39 Discretionary Budget Authority by Subfunction: An Overview
reflects federal support for construction of local wastewater treatment plants and other water quality initiatives, which fall within subfunction 304.105 Figure 15 illustrates that discretionary budget authority for subfunction 304 as a percentage of GDP gradually decreased over time until FY2022. The subsequent increase from FY2022 through FY2026 primarily reflects supplemental appropriations to EPA for water infrastructure financial assistance programs in IIJA.106 Federal aid for local water infrastructure projects, especially EPA assistance, has evolved over time from a program that provided grants directly to local governments for wastewater treatment plant construction to the primary programs for clean water and drinking water infrastructure projects. Under these programs, the federal government provides grants to states to capitalize state loan programs. More recently, Congress has amended these loan programs to increase the amount of principal forgiveness, grants, or other types of additional subsidization that states can provide to communities. Further, EPA has the authority to provide direct loans or grants to support such infrastructure.107
The Other Natural Resources (306) subfunction includes the U.S. Geological Survey; activities of NOAA; and certain DOI Departmental Offices and Department-wide programs, among others. Discretionary budget authority for this subfunction had a relatively modest decline, as a percentage of GDP, throughout the period examined.
spills of oil and hazardous substances in the coastal zone.
The largest spike visible in Figure 11 reflects an increase in the 1970s in federal support for construction of local wastewater treatment plants and other water quality initiatives, which fall within the pollution control and abatement (304) subfunction.62 That funding was reduced in the early 1980s due to budgetary pressures and because policymakers judged that the aim of modernizing municipal wastewater treatment facilities had largely been met.
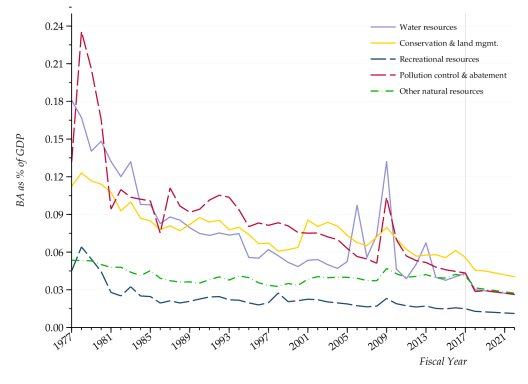
Federal aid for local water infrastructure projects, especially EPA assistance, has evolved over time from programs that provided grants directly to local governments to programs under which the federal government provides grants to states to capitalize state loan programs. Congress established a similar loan program for drinking water infrastructure projects in 1996 (P.L. 93-523).63 In addition to federal funding for these water infrastructure programs, subfunction 304 also includes a wide range of environmental protection activities of EPA and other federal agencies under authority of statutes such as the Clean Air Act, Clean Water Act, and the Comprehensive Environmental Response, Compensation, and Liability Act (CERCLA, or Superfund).
The water resources subfunction (301) principally represents water infrastructure (e.g., dams, locks, levees) built, owned, and operated by the federal government. Discretionary funding for water resources projects has, by and large, declined as a percentage of GDP since the mid-1970s, as Figure 11 indicates. That decline has been attributed to a number of reasons. Presidents Carter and Reagan both targeted perceived excesses in federal spending on water resources projects during their terms in office and were reluctant to agree to new project authorizations and spending without corresponding alterations to federal cost-sharing policies.64 The Water Resources Development Act of 1986 (WRDA; P.L. 99-662) made changes requiring greater contributions from local governments that benefit from federal water infrastructure.65 Those changes included reductions in the federal share of project costs, and combined with the aforementioned reduced emphasis on new water resources infrastructure in general, led to a decrease in water resources spending. Overall spending on these projects has also declined as agency focus has shifted away from construction of new projects. In 1987, the Bureau of Reclamation, which built large federal dams and water projects throughout the West during the 20th century, acknowledged a shift in its focus from development and construction of water projects to management of water resources.66
Forest Service funding, including costs of responding to forest fires, along with funding for the DOI Bureau of Land Management, are the largest items within the conservation and land management (302) budget subfunction.
In FY2009, ARRA supported large supplemental increases in funding for multiple federal agencies, including EPA and the Army Corps of Engineers, for water projects within the pollution control and abatement subfunction. ARRA also supported Forest Service capital improvements, along with smaller increases in many other programs.67
Commerce and Housing Credit
Commerce and Housing Credit
The commerce and housing credit budget function supports a variety of programs within the U.S. Department of Commerce and the Department of Housing (HUD), along with several other federal agencies. The 2007-2009 financial crisis and subsequent Great Recession led to changes in federal housing finance policies.108
The interrelation between discretionary and mandatory funding for many programs within that budget function is complex. In part, that complexity stems from how federal credit rules operate. Many of the programs in this budget function federal agencies. Many of these programs provide credit for housing, business loans, and other purposes, and their costs are therefore calculated using methods prescribed by the Federal Credit Reform Act (FCRA; described above). Changes in estimates of the subsidy costs of those loans are sensitive to anticipated economic conditions, which can cause large fluctuations in budgetary costs, even if current cash flows are more stable.
When the present value of fees or other receipts collected through a program exceeds disbursements and default costs, estimated using FCRA methods, a negative credit subsidy results which appears as negative BA. For example, the large negative amounts shown in Figure 12 16 for
105 See CRS Report 96-647, Water Infrastructure Financing: History of EPA Appropriations, by Jonathan L. Ramseur and Mary Tiemann.
106 For more information about drinking water and wastewater infrastructure funding, CRS Report R46892, Infrastructure Investment and Jobs Act (IIJA): Drinking Water and Wastewater Infrastructure, by Elena H. Humphreys and Jonathan L. Ramseur.
107 For more information, see CRS Report R46471, Federally Supported Projects and Programs for Wastewater, Drinking Water, and Water Supply Infrastructure, coordinated by Jonathan L. Ramseur.
108 Many federal agencies took steps to mitigate the effects of the financial crisis in 2007 and 2008. Congress also passed measures that significantly reshaped federal housing finance policies. For instance, the Housing and Economic Recovery Act of 2008 (P.L. 110-289), among other provisions, set up authorities that were used to put the government-sponsored enterprises (GSEs) Fannie Mae and Freddie Mac, which guarantee a major share of U.S. housing mortgages, into conservatorships when both faced insolvency in September 2008. See Financial Crisis Inquiry Commission, Final Report, February 25, 2011, https://www.govinfo.gov/app/details/GPO-FCIC. For a description of how the Federal Housing Administration reacted to the financial crisis, see HUD, Office of Policy Development and Research, “The Federal Housing Administration: Bringing the Housing Finance System Out of a Chaotic Situation,” Evidence Matters, summer/fall 2020, https://www.huduser.gov/portal/periodicals/em/SummerFall20/highlight2.html.
Congressional Research Service
34
Discretionary Budget Authority by Subfunction: An Overview
for the mortgage credit (371) subfunction in recent yearsfollowing the 2007-2009 Great Recession largely reflect negative credit subsidy estimates for the single-family mortgage insurance program within the Federal Housing Administration (FHA).68 and, to a lesser extent, Ginnie Mae (Government National Mortgage Association).109 Expected negative credit subsidies for FHA-insured mortgages increased in the years after the housing market turmoil of the late 2000s as a result of several factors, including better credit quality of FHA-insured mortgages, increases in the fees that FHA charges to borrowers, and higher FHA loan volumes
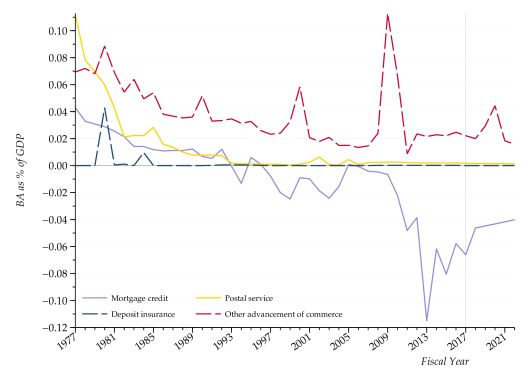
The other advancements of commerce (376) subfunction includes a diverse range of activities within the Department of Commerce, the Small Business Administration (SBA), many
109 See CRS Report R42875, FHA Single-Family Mortgage Insurance: Financial Status of the Mutual Mortgage Insurance Fund (MMI Fund), by Katie Jones. Also see Chad Chirico and Susanne Mehlman, “How FHA’s Mutual Mortgage Insurance Fund Accounts for the Cost of Mortgage Guarantees,” CBO Blog, October 22, 2013; https://www.cbo.gov/publication/44634. The largest discretionary account in the Mortgage Credit subfunction is the FHA-Mutual Mortgage Insurance Capital Reserve. That account recorded $214 million in negative BA in FY2007, which expanded to $17.4 billion in negative BA in FY2013. In later years, magnitudes have been smaller, although they have fluctuated widely.
Congressional Research Service
35
link to page 39 link to page 39 link to page 41 link to page 41 link to page 41 Discretionary Budget Authority by Subfunction: An Overview
within the Department of Commerce, the Small Business Administration (SBA), many independent federal regulatory bodies, and other entities. Funding for the decennial census falls within this subfunction and is reflected in peaks at 10-year intervals visible inin Figure 12.
16.
The Infrastructure Investment and Jobs Act (P.L. 117-58), enacted in November 2021, provided $65 billion in funding programs to expand access to broadband internet connections administered by the National Telecommunications and Information Administration and the Federal Communications Commission.110
The U.S. Postal Service (USPS; postal service subfunction 376) operates under a mandate to cover its costs with its own revenues, and thus runs without an operating subsidy from the federal government.69111 Congress does appropriate funds to offset postal revenues that were foregone by charging concessionary rates for certain postal services, although as can be seen inin Figure 1216, that funding has decreased over time.70
Transportation
112
Transportation
Funding within the transportation budget function primarily supports activities of the U.S. Department of Transportation (DOT), including grants and other forms of financial support provided to state and local governments. That funding also supports some operations of the U.S. Coast Guard, which was transferred from DOT to the U.S. Department of Homeland Security in 2003, as well as various boards and commissions involved in transportation issues. Figure 13 17 shows funding trends within the transportation budget function.
shows funding trends within the transportation budget function.
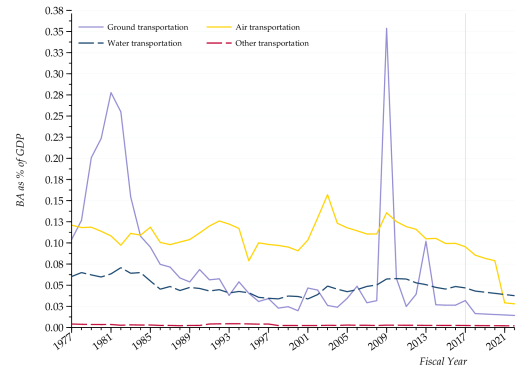
Some ground transportation programs have had a special budgetary status since 1988, in which BA is treated as mandatory but outlays are classified as discretionary.71113 This status enables some transportation funding to sidestepavoid budgetary restraints that affect most other federal funding. Moreover, that dual designation of surface transportation funding complicates analysis of trends in federal spending to support various forms of transittransportation. Thus, trends in funding for ground transportation shown inin Figure 13 17 exclude the vast majority of federal highway and mass transit (also known as public transportation) funding supported by the Highway Trust Fund, which is classified as mandatory, rather than discretionary, BA. Moreover, those amounts do not reflect expenditures of state and local governments, which are typically required to match federal funds at some level. Discretionary funding for ground transportation also does not reflect transfers from the U.S. Treasury'’s general fund to the Highway Trust Fund.
114
The ground transportation (401) subfunction includes federal support for mass transit and Amtrak, as well as funding for operations of DOT bureaus such as the Federal Railroad Administration and the Federal Highway Administration, as well as various transportation-related safety or regulatory bodies. The peak in discretionary funding for ground transportation during the late 1970s and early 1980s evident inin Figure 13 17 reflects, in large measure, grants to local
110 National Telecommunications and Information Administration, “NTIA’s Role in Implementing the Broadband Provisions of the 2021 Infrastructure Investment and Jobs Act,” https://broadbandusa.ntia.doc.gov/news/latest-news/ntias-role-implementing-broadband-provisions-2021-infrastructure-investment-and. See also CRS Report R47506, The Persistent Digital Divide: Selected Broadband Deployment Issues and Policy Considerations, by Colby Leigh Rachfal.
111 See CRS Report R44603, Reforming the U.S. Postal Service: Background and Issues for Congress, coordinated by Michelle D. Christensen.
112 See CRS Report RS21025, The Postal Revenue Forgone Appropriation: Overview and Current Issues, by Kevin R. Kosar.
113 CBO, The Highway Trust Fund and the Treatment of Surface Transportation Programs in the Federal Budget, June 2014; https://www.cbo.gov/sites/default/files/113th-congress-2013-2014/reports/45416-TransportationScoring.pdf.
114 See CRS Report R47573, Funding and Financing Highways and Public Transportation Under the Infrastructure Investment and Jobs Act (IIJA), by Robert S. Kirk and William J. Mallett.
Congressional Research Service
36
link to page 41
Discretionary Budget Authority by Subfunction: An Overview
reflects, in large measure, grants to local governments to expand, modernize, or operate mass transit systems.72115 Through the 1980s, however, that support was reduced. A second peak reflects increased funding for road and other infrastructure projects in ARRA.
Figure 17. Transportation (400) Subfunctions
Discretionary budget authority as a percentage of GDP, FY1977-FY2028
Source: CRS, based on OMB data from FY2024 budget submission. Notes: FY2023 levels are estimated. FY2024-FY2028 levels reflect Administration proposals and projections. See OMB budget documents for further caveats.
Funding within the air transportation (402) subfunction has varied less. Increased funding for airport security after the attacks of September 11, 2001, is visible in Figure 1317. The Transportation Security Administration (TSA) was created within DOT in November 2001, but was transferred to the U.S. Department of Homeland Security (DHS) in March 2003.
Funding within the water transportation (403) subfunction, again measured as a percentage of GDP, has been even more stable.
Community and Regional Development
The Community and Regional Development budget function (450) includes funding for various federal programs that support state and local government development initiatives in urban and
115 CBO, Public Works Infrastructure: Policy Considerations for the 1980s, April 1983, ch. 3, https://www.cbo.gov/sites/default/files/98th-congress-1983-1984/reports/doc20-entire.pdf. Also see DOT, Urban Mass Transit Administration, FY1980 Summary of UMTA’S Transit Assistance Program, 1981, https://ia802709.us.archive.org/13/items/fy1980yearendsum00offi_0/fy1980yearendsum00offi_0.pdf.
Congressional Research Service
37
link to page 42
Discretionary Budget Authority by Subfunction: An Overview
rural areas, as well as funding to support responses to natural and other disastersdisasters. Figure 14 18 shows funding trends within that budget function.
The largest item within the Community Development (451) subfunction is the U.S. Department of Housing and Urban Development'’s (HUD'’s) Community Development Fund, which provides resources for the Community Development Block Grant (CDBG) program.73116 That subfunction also includes programs administered by the U.S. Department of Agriculture (USDA), the U.S. Department of the Treasury, and other federal agencies. Federal community development funding fell from almost 0.2% of GDP in the late 1970s to about half that level in the 1990s.
Figure 18. Community and Regional Development (450) Subfunctions
Discretionary budget authority as a percentage of GDP, FY1977-FY2028
Source: CRS, based on OMB data from FY2024 budget submission. Notes: FY2023 levels are estimated. FY2024-FY2028 levels reflect Administration proposals and projections. See OMB budget documents for further caveats.
Funding since FY2000 has fluctuated significantly, reflecting congressional responses to natural and other disaster-related events, and economic recessions.74
117 Community Development Block Grant Disaster Recovery Funding (CDBG-DR), a part of the Community Development Fund, has
116 See CRS Report R46733, Community Development Block Grants: Funding and Allocation Processes, by Joseph V. Jaroscak. Also see Seth R. Marcus, “Community Development Block Grants,” in Goldfield, David R. (ed.), Encyclopedia of American Urban History, (Thousand Oaks, CA: Sage, 2006).
117 See CRS Report R46475, The Community Development Block Grant’s Disaster Recovery (CDBG-DR) Component: Background and Issues, by Joseph V. Jaroscak. For data on CDBG funding from FY2000-FY2014, see CRS Report R43394, Community Development Block Grants: Recent Funding History, by Eugene Boyd.
Congressional Research Service
38
link to page 44 Discretionary Budget Authority by Subfunction: An Overview
supported long-term recovery efforts and met needs not addressed by other federal programs. Congress has often provided CDBG-DR funding through supplemental emergency appropriations following disasters.
The Area and Regional Development (452) subfunction includes a wide range of programs, from operations of the Department of Interior'’s Bureau of Indian Affairs (BIA) and Bureau of Indian Education (BIE), to assorted USDA rural development initiatives, as well as Department of Commerce'Commerce’s Economic Development Administration (EDA) programs and federally chartered regional development commissions, such as the Appalachian Regional Commission, the Delta Regional Authority, the Denali Commission, and the Northern Border Regional Commission. An anti-recession measure—the Public Works Employment Act (P.L. 95-28)—increased funding for FY1977 and FY1978 with the aim of supporting local public works-focused job creation efforts.
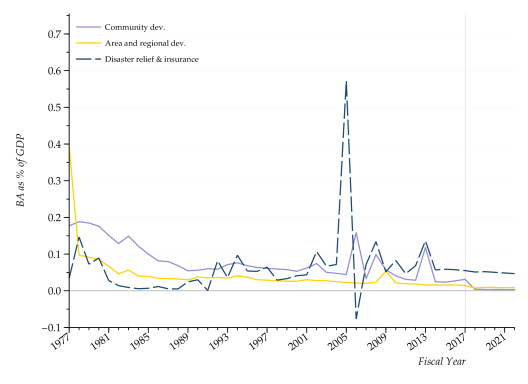
The disaster relief and insurance (453) subfunction mainly funds the Federal Emergency Management Agency, which has been part of the Department of Homeland Security (DHS) since 2003. That subfunction also includes other programs within USDA, SBA, and HUD. Funding for the disaster relief and insurance subfunction has been volatile in large part because it is driven by responses to natural and manmade disasters that by definition are difficult to anticipate. The largest spike in funding reflects responses to Hurricanes Katrina, Rita, and Wilma, which hit the Gulf Coast in 2005. A smaller spike atin FY2013 reflects funding for responses to Hurricane Sandy, which hit the Atlantic Coast.
Other Federal Functions
General Science, Space, and Technology
Funding within the General Science, Space, and Technology budget function (250)—shown in Figure 15— A larger spike for FY2018 reflects responses, especially through the Disaster Relief Fund,118 to two hurricanes that hit Puerto Rico and the U.S. Virgin Islands in September 2017, as well as other hurricanes and floods that hit the eastern and Gulf Coast states.119 The spike at FY2020 mostly reflects funding for the Disaster Relief Fund to support programs responding to the COVID-19 pandemic.120
Other Federal Functions The Other Federal Functions category includes the General Science, Space, and Technology; Agriculture; Administration of Justice; and General Government budget functions. Figure 19 shows discretionary funding trends for those functions.
118 See CRS Report R45484, The Disaster Relief Fund: Overview and Issues, by William L. Painter. 119 See CRS Report R46609, The Status of Puerto Rico’s Recovery and Ongoing Challenges Following Hurricanes Irma and María: FEMA, SBA, and HUD Assistance, coordinated by Elizabeth M. Webster.
120 See CRS Report R47048, FEMA’s Role in the COVID-19 Federal Pandemic Response, coordinated by Erica A. Lee.
Congressional Research Service
39
link to page 45 link to page 45 link to page 45
Discretionary Budget Authority by Subfunction: An Overview
Figure 19. Discretionary Funding for Other Government Functions
Discretionary budget authority as a percentage of GDP, FY1977-FY2028
Source: CRS, based on OMB data from FY2024 budget submission. Notes: FY2023 levels are estimated. FY2024-FY2028 levels reflect Administration proposals and projections. See OMB budget documents for further caveats.
General Science, Space, and Technology
Funding within the General Science, Space, and Technology budget function (250)—shown in Figure 20—has been dominated for most of the past half century by spending to support operations of the National Aeronautics and Space Administration (NASA), which falls within the space flight, research and supporting activities subfunction (252). In some years during the mid-1960s, as the Apollo program was moving toward its aim of manned lunar exploration, NASA accounted for over 4% of total federal spending—well beyond the scale used inin Figure 15.75 20.121 After the Apollo program ended in the early 1970s, NASA funding levels in inflation-adjusted terms and as a percentage of GDP declined in the face of budgetary pressures. The narrow spike visible inpeak visible in Figure 15 20 reflects funding for a replacement space shuttle after the January 1986 Challenger disaster. From FY1993 to FY2016, BA for NASA fell from about 0.2% of GDP to about 0.1% of GDP, as funding did not keep pace with inflation and economic growth.
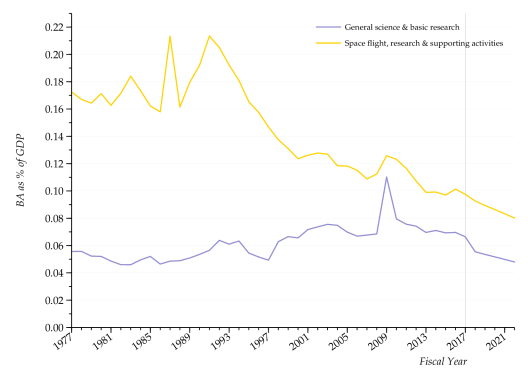
Funding for the general science and basic research
Funding for the General Science and Basic Research subfunction (251) mostly supports the National Science Foundation (NSF) and the basic research activities of the Office of Science within the Department of Energy (DOE). As a proportion of GDP, it rose, albeit unsteadily, from the mid-1980s to the late 2000s. In 2006, the George W. Bush Administration'’s American Competitiveness Initiative, established by and subsequently authorized by Congress in the America COMPETES Act (P.L. 110-69) and America COMPETES Reauthorization Act of 2010 ((P.L. 111-358), set out a goal to double funding for NSF and the DOE Office of Science. That goal has not been achieved, especially when expressed as a share of GDP. In FY2009, ARRA provided a temporary boost in funding for general science and basic research.
Agriculture
Agriculture
The Agriculture budget function (350) includes the Agricultural Research and Services (352) subfunction and the Farm Income Stabilization (351) subfunction. Nearly all funding within that budget function supports operations of the U.S. Department of Agriculture (USDA). Some of the largest USDA programs, however, such as the Supplemental Nutrition Assistant Program (SNAP) and some child nutrition programs, are classified within the Income Support budget function. Most Forest Service and USDA conservation activities fall under the Natural Resources and
Congressional Research Service
41
link to page 46 link to page 46
Discretionary Budget Authority by Subfunction: An Overview
Environment budget function, and provision of foreign food aid falls under the International Affairs budget functionfunction. Figure 16 21 shows trends within the Agriculture budget function.
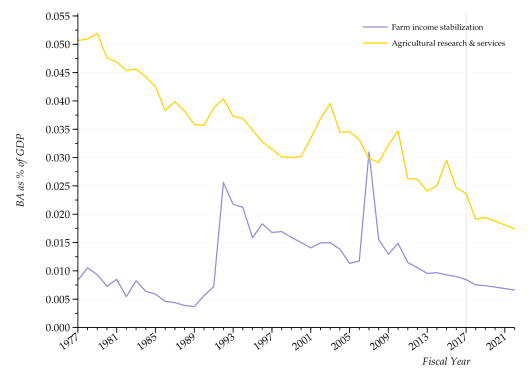
The largest components of discretionary funding within the Agricultural Research and Services subfunction support activities of the Agricultural Research Service and the National Institute of Food and Agriculture. Funding for the Animal and Plant Health Inspection Service (APHIS) quadrupled between FY1999 and FY2003. APHIS also received extra funds to respond to bird flu threats in FY2015, which are reflected in a spike visible in Figure 16.76small peak visible in Figure 21.122 Overall, funding for Agricultural Research and Services as a percentage of GDP has declined from about 0.05% in the late 1970s to about half that level in FY2016.
the mid-2010s. The two larger peaks for FY2020 and FY2022 reflect funding to support agricultural producers affected by the COVID-19 pandemic provided in the CARES Act (P.L. 116-136; Division B, Title I), the American Rescue Plan Act of 2021 (P.L. 117-2; Title I), and other legislation.123
122 See CRS Report R44114, Update on the Highly-Pathogenic Avian Influenza Outbreak of 2014-2015, by Joel L. Greene.
123 See CRS In Focus IF11764, U.S. Agricultural Aid in Response to COVID-19, by Randy Schnepf and Stephanie Rosch.
Congressional Research Service
42
link to page 47
Discretionary Budget Authority by Subfunction: An Overview
The sharp funding increase within the Farm Income Stabilization subfunction for FY1992 reflects implementation of the Federal Credit Reform Act of 1990 (FCRA; P.L. 101-508), which changed the budgetary treatment of federal loan and loan guarantee programs.77124 The spikepeak in FY2008 reflects ad hoc disaster assistance. Many farm income stabilization programs are mostly funded via mandatory spending, although administrative costs are generally covered by discretionary spending.
discretionary spending generally covers administrative costs. Administration of Justice
The Administration of Justice (750) budget function includes most federal judicial, law enforcement, and correctional activities. Figure 17 22 shows funding trends within that budget function.
Figure 22function.
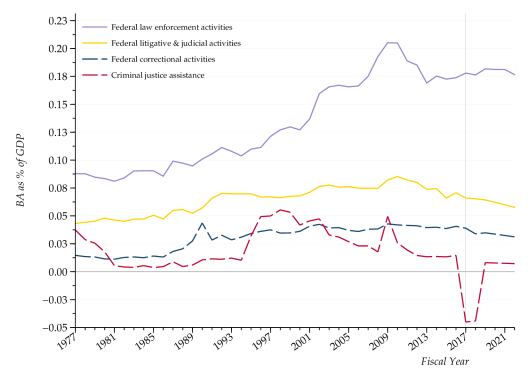
The Federal Law Enforcement Activities (751) subfunction includes operations of the Department of Homeland Security (DHS), such as the U.S. Customs and Border Protection (CBP), the U.S. Immigration and Customs Enforcement (ICE), and the U.S. Secret Service, as well as operations of the U.S. Department of Justice (DOJ), including the Federal Bureau of Investigation (FBI), the
124 See CRS Report R44193, Federal Credit Programs: Comparing Fair Value and the Federal Credit Reform Act (FCRA), by Raj Gnanarajah.
Congressional Research Service
43
link to page 47 link to page 47 Discretionary Budget Authority by Subfunction: An Overview
Drug Enforcement Administration (DEA), the Bureau of Alcohol, Tobacco, Firearms, and Explosives (ATF), and the U.S. Marshals (USMS). Counterterrorism activities, which account for roughly half of the FBI'’s funding, are classified under the Defense-Related Activities (054) subfunction.
Funding within the Federal Law Enforcement subfunction, measured as a percentage of GDP, more than doubled in the period FY1980 to FY2010. Funding increases for CBP and ICE account for much of that increase. In FY1977, CBP and ICE accounted for just over a third (35%) of all funding within the federal law enforcement activities subfunction, while in FY2016 they accounted for over half (54%). Since FY2010, however, funding as a percentage of GDP has fallen to a level slightly above what it was in the mid-2000s. During that time period, funding for CBP and ICE rose by 10% in nominal terms, while funding for the rest of the subfunction was essentially flat.
The Federal Litigative and Judicial Activities subfunction (752) includes operations of the judicial branch and trial-related activities such as pre-trial detention by U.S. Marshals and publicly funded legal defense services. The subfunction also covers operations of offices of U.S. Attorneys and legal activities of DOJ, as well as boards and commissions that address legal matters. Funding for this subfunction, measured as a percentage of GDP, has trended slightly upward until FY2010 and slightly downward since then.
The Federal Correctional Activities subfunction (753) includes the DOJ Federal Prison System. The small increase visible inin Figure 17 22 reflects a one-time increase of about $1 billion for prison buildings and facilities in FY1990.
The Criminal Justice Assistance subfunction (754) includes DOJ programs that assist state and local governments combat crime, violence against women, and drug trafficking; and that strengthen local juvenile justice and other local initiatives. The increase in funding visible in Figure 17 22 in FY1994 reflects enactment of the Violent Crime Control and Law Enforcement Act of 1994 (P.L. 103-322), by which Congress and President Bill Clinton aimed to fund the hiring of an additional 100,000 local police officers via the community-oriented policing (COPS) program.78125 After decreases in funding for COPS during the mid-2000s, additional funds were provided as part of the ARRA stimulus. Since then, the level of funding, measured as a percentage of GDP, has decreased.
The downward spike in proposed spending for FY2017 and FY2018 reflects CHIMPs (
In some years, restrictions on the Crime Victims Fund (CVF) were used to offset other discretionary spending according to budgetary scoring rules governing changes in mandatory program spending (CHIMPS). Those restrictions did not reduce the flow of federal support for state grants, because CVF balances were well above usual grant funding levels.
According to budget estimates from OMB, however, DOJ will not be able to sustain FY2023 levels of funding for programs funded by the Crime Victims Fund (CVF) in FY2024.126 For several years, the annual carryover balance of the CVF has declined, and according to OMB, the projected start-of-year balance for the CVF is -$1.9 billion.127 Presumably, OMB is estimating the negative start-of-year balance for the CVF based on an assumption that Congress will seek to sustain the FY2023 level of spending for CVF-funded programs ($1.9 billion), and OMB estimates the CVF will be short $1.9 billion.
125 See CRS Report RL33308, Community Oriented Policing Services (COPS): In Brief, by Nathan James. 126 For more information on the Crime Victims Fund, see CRS Report R42672, The Crime Victims Fund: Federal Support for Victims of Crime.
127 Office of Management and Budget, Appendix: Budget of the U.S. Government, Fiscal Year 2024, p. 733.
Congressional Research Service
44
link to page 49
Discretionary Budget Authority by Subfunction: An Overview
General Government
program spending) affecting the Crime Victims Fund, which according to budgetary scoring rules can be used to offset discretionary spending, and does not represent a diminution of federal support for state grants.
General Government
The General Government (800) budget function includes costs of operating the legislative and executive branches, as well as administering federal personnel policy, managing federal records and property, and providing fiscal support to state and local governmentsgovernments. Figure 18 23 shows trends in funding by subfunction within that budget function.
The Legislative Functions (801) subfunction includes activities of Congress and congressional agencies, such as the Government Accountability Office (GAO), the Congressional Budget Office (CBO), and the Congressional Research Service (CRS). The subfunction also includes the Capitol Police and the Architect of the Capitol, along with various congressional commissions and boards. From FY1977 to FY2000, funding for the legislative functions subfunction, measured as a percentage of GDP, trended slightly downward. Since then, funding for that subfunction has ranged from 0.03% to 0.04% of GDP.
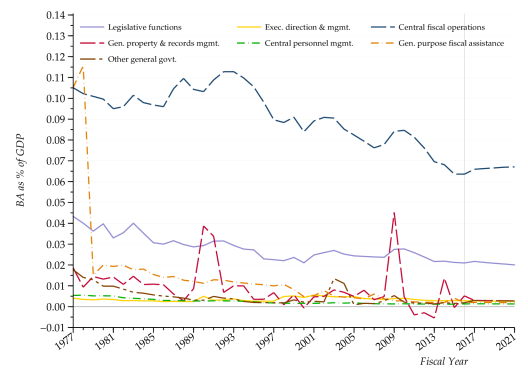
The Executive Direction and Management (802) subfunction includes activities of the White House, the Executive Office of the President, agencies closely connected to the President such as the Office of Management and Budget (OMB), the U.S. Trade Representative, and certain drug control activities. Various boards, commissions, councils, and offices associated with the Congressional Research Service 45 link to page 49 link to page 49 Discretionary Budget Authority by Subfunction: An Overview presidency are also included. Over the FY1977-FY2017 period, funding within that subfunction has not exceeded 0.01% of GDP.
The Central Fiscal Operations (803) subfunction includes operations of the Internal Revenue Service (IRS) as well as fiscal and currency operations of the U.S. Treasury. In FY2017Since FY1990, the IRS accounted for aboutat least 90% of the funding within that subfunction. Thus, to large extent, the decline in funding for the subfunction, measured as a percentage of GDP, reflects trends in funding for the IRS.
, which has resulted in reductions in staffing and enforcement activities.128 P.L. 117-169, commonly referred to as the Inflation Reduction Act, provided $79 billion in mandatory funding to support activities similar to those previously funding via discretionary funds.129 The Fiscal Responsibility Act (FRA; P.L. 118-5) rescinded some of those funds.130
The General Property and Records Management (804) subfunction includes operations of the General Services Administration (GSA) and the National Archives and Records Administration (NARA). Fluctuations in funding within this subfunction in large part reflect costs of GSA's ’s Federal Buildings Fund.79131 That fund operates somewhat as a revolving fund that receives rent payments from federal agencies. Proceeds, through appropriations law, are used to lease properties or to acquire and maintain federally owned properties, although it has received supplemental appropriations to fund buildings in some years. In other years, rental revenues exceeded building expenses, resulting in negative budget authority.
The Central Personnel Management (805) subfunction includes operations of the Office of Personnel Management (OPM) as well as several offices concerned with federal workforce issues such as the Merit Systems Protection Board, the Office of Special Counsel, and the Office of Government Ethics. Funding for this subfunction was about 0.05% of GDP in the late 1970s, and that percentage has declined since then.
The General Purpose Fiscal Assistance (806) subfunction covers various forms of assistance to state and local government. The high levels of funding visible inin Figure 18 23 in the 1970s reflect credit support offered to New York City.80132 The bulk of that support was through a facility for short-term loans that were to be paid back at the end of each city fiscal year.133 The subfunction also includes federal support for the District of Columbia.81134 Since the early 1980s, when this subfunction funding accounted for about 0.2% of GDP, funding according to that measure has declined.
The Other General Government (808) subfunction includes a broad array of miscellaneous federal activities. The uptick visible inin Figure 18 23 in the mid-2000s reflects federal support for electoral reform.
128 CBO, Trends in the Internal Revenue Service’s Funding and Enforcement, July 2020, https://www.cbo.gov/publication/56467.
129 See CRS In Focus IF12394, The Internal Revenue Service’s Strategic Operating Plan to Spend $79 Billion in Inflation Reduction Act Funding, by Brendan McDermott and Gary Guenther.
130 See CRS Insight IN12172, Changes to IRS Funding in the Debt Limit Deal, by Brendan McDermott. 131 See GAO, Federal Buildings Fund: Improved Transparency and Long-term Plan Needed to Clarify Capital Funding Priorities, GAO-12-646, July 2012, http://www.gao.gov/assets/600/592377.pdf.
132 See archived CRS Report 95-328E, Financial Control Boards for Cities in Distress, by Nona Notto and Lillian Rymarowicz, which is available to congressional clients upon request.
133 CBO, Overview of the 1977 Budget, February 4, 1976, p. 94, https://www.cbo.gov/sites/default/files/94th-congress-1975-1976/workingpaper/76doc549_0.pdf.
134 See CRS Report R44099, District of Columbia: Issues in the 114th Congress, coordinated by Eugene Boyd.
Congressional Research Service
46
Discretionary Budget Authority by Subfunction: An Overview
Appendix. Descriptions of Budget Functions BUDGET FUNCTION 050: NATIONAL DEFENSE
The National Security function includes funds to develop, maintain, and equip the military forces of the United States. Historically, about 95% of these funds go to Department of Defense military activities, with remaining funding dedicated to atomic energy defense activities within the Department of Energy and other defense-related activities.
BUDGET FUNCTION 150: INTERNATIONAL AFFAIRS
The International Affairs function contains spending on international humanitarian, development, and security assistance; the conduct of foreign affairs; foreign information and exchange activities; and international financial programs. The funding supports operations at major agencies including the Departments of State, Treasury, and Agriculture; the U.S. Agency for International Development (USAID); and the Millennium Challenge Corporation.
BUDGET FUNCTION 250: SCIENCE AND TECHNOLOGY
The Science and Technology function includes the National Science Foundation, programs other than aviation programs at the National Aeronautics and Space Administration (NASA), and general science programs at the Department of Energy.
BUDGET FUNCTION 270: ENERGY
The Energy function concerns the production, development, and use of energy for the country. This function contains civilian energy programs at agencies including the Departments of Energy and Agriculture, the Tennessee Valley Authority, the Federal Energy Regulatory Commission, and the Nuclear Regulatory Commission.
BUDGET FUNCTION 300: NATURAL RESOURCES AND ENVIRONMENT
The Natural Resources and Environment function focuses on the management, development, and maintenance of the nation’s natural heritage. This function includes conservation of land and water resources; development of water power and transportation infrastructure; and agencies and resources associated with the management and regulation of pollution, public and recreational lands, and natural resources.
BUDGET FUNCTION 350: AGRICULTURE
The Agriculture function includes the Department of Agriculture and the Farm Credit Administration, and only deals with programs concerned with agricultural production.
BUDGET FUNCTION 370: COMMERCE AND HOUSING CREDIT
The Commerce and Housing Credit function includes the regulation and promotion of commerce and certain housing policies and agencies. Agencies concerned with the economy as a whole fall under this function. In addition, general-purpose subsidies and credit subsidies are recorded here.
BUDGET FUNCTION 400: TRANSPORTATION
The Transportation function focuses on aid and regulation for ground transportation, including roads and highways, railroads, and urban mass transit; air transportation, including aeronautical research conducted by NASA; and maritime commerce. The major agencies included in this function are the Department of Transportation, including the Federal Aviation Administration, the Federal Highway Administration, the Federal Transit Administration, and the Maritime Administration; the Department of Homeland Security, including the Transportation Security
Congressional Research Service
47
Discretionary Budget Authority by Subfunction: An Overview
Administration, the United States Coast Guard, and the Federal Air Marshal Service; and the National Railroad Passenger Corporation.
BUDGET FUNCTION 450: COMMUNITY AND REGIONAL DEVELOPMENT
The Community and Regional Development function includes federal programs to improve community economic conditions, promote rural development, and assist in federal preparations for, and responses to, disasters. This function provides appropriated funding for the Community Development Block Grant program, Department of Agriculture rural development programs, the Bureau of Indian Affairs, the Federal Emergency Management Agency, and other disaster mitigation and community development-related programs. It also provides mandatory funding for the federal flood insurance program.
BUDGET FUNCTION 500: EDUCATION, TRAINING, EMPLOYMENT, AND SOCIAL SERVICES The Education, Training, Employment, and Social Services function includes funding for the Department of Education, some social services programs within thereform.
Author Contact Information
Acknowledgments
Comments and conversations with many CRS colleagues were invaluable. The author wishes to thank David Bearden, [author name scrubbed], David Bradley, [author name scrubbed], Susan Epstein, [author name scrubbed], [author name scrubbed], Bruce Lindsay, [author name scrubbed], Dan Morgan, Will Morton, [author name scrubbed], Will Painter, [author name scrubbed], Randy Peterman, Steve Redhead, Lisa Sacco, Rebecca Skinner, Charlie Stern, and Meghan Stuessy.
Footnotes
| 1. |
|
| 2. |
The start of the federal fiscal year was changed from July 1 to October 1 in 1976 to accommodate changes in the congressional budget process. The figures omit data for the transition quarter (July 1 to September 30, 1976). |
| 3. |
The Bureau of Economic Analysis (BEA) released a major revision to national income accounts in July 2013, which showed somewhat higher levels of national income and thus slightly reduced government spending as a share of GDP. See Stephanie H. McCulla, Alyssa E. Holdren, and Shelly Smith, "Improved Estimates of the National Income and Product Accounts: Results of the 2013 Comprehensive Revision," Survey of Current Business, September 2013, pp. 14-45, available at http://bea.gov/scb/pdf/2013/09%20September/0913_comprehensive_nipa_revision.pdf. |
| 4. |
For a broader analysis of discretionary spending, see CRS Report RL34424, The Budget Control Act and Trends in Discretionary Spending, by [author name scrubbed]. |
| 5. |
CRS Report R41965, The Budget Control Act of 2011, by [author name scrubbed], [author name scrubbed], and [author name scrubbed]. |
| 6. |
The procedure for lowering those revised caps is in section 251A(7) of the BCA. In FY2013, that decrease was implemented through sequestration. See CBO, Sequestration Update Report, August 2012, p. 3, available at http://www.cbo.gov/sites/default/files/cbofiles/attachments/08-09-12_SequestrationUpdate.pdf; and OMB, Sequestration Update Report to the President and Congress for Fiscal Year 2013, August 20, 2012, p. 13, available at http://www.whitehouse.gov/sites/default/files/omb/assets/legislative_reports/sequestration/sequestration_update_august2012.pdf. |
| 7. |
For details, see CRS congressional distribution memorandum, "The Budget Control Act and Alternate Defense and Non-Defense Spending Paths, FY2012-FY2021," by [author name scrubbed] and [author name scrubbed], November 16, 2012, available from the authors. This comparison is made in terms of budget authority. Before passage of ATRA, BCA provisions were slated to bring discretionary base defense spending to its FY2007 level and non-defense spending to near its level in FY2003 or FY2004. Inflation adjustments made using GDP price index. |
| 8. |
CBO, Budget and Economic Outlook: 2017 to 2027, January 24, 2017, Table 1-1, http://www.cbo.gov/publication/52370. |
| 9. |
Some have described the unmodified BCA caps as a "return to sequestration." For example, see Amaani Lyle, "Greenert Explains Value of Presence, Danger of Cuts," DoD News, January 28, 2015, http://www.defense.gov/news/newsarticle.aspx?id=128065. Sequestration, strictly speaking, refers to the reduction or cancellation of budgetary resources, usually applied across the board to non-exempt accounts. While non-exempt mandatory accounts are to be sequestered in each year until FY2025, no across-the-board cuts to discretionary spending are required so long as funding remains within BCA caps. |
| 10. |
For BCA caps to be adjusted, emergency funding and war funding (Overseas Contingency Operations/Global War on Terrorism) must be designated on an account-by-account basis by Congress and the President. Cap adjustments for disaster funding are subject to a limit set at a 10-year average of previous disaster funding. The BCA established separate caps for certain program integrity initiatives. |
| 11. |
See CRS Report R44519, Overseas Contingency Operations Funding: Background and Status, coordinated by [author name scrubbed] and [author name scrubbed]. Also see Marcus Weisgerber, "'Magic Money': DoD's Overseas Contingency Budget Might Dry Up," Defense News, June 29, 2014, http://archive.defensenews.com/article/20140629/DEFREG02/306290011/-Magic-Money-DoD-s-Overseas-Contingency-Budget-Might-Dry-Up. Also see CRS Report RL33110, The Cost of Iraq, Afghanistan, and Other Global War on Terror Operations Since 9/11, by [author name scrubbed]. |
| 12. |
Joe Gould, "Trump Selects OCO-Opponent Mulvaney for OMB," Defense News, December 19, 2016, http://www.defensenews.com/articles/trump-selects-oco-opponent-mulvaney-for-omb. |
| 13. |
OMB, FY2017 Budget of the U.S. Government, Analytical Perspectives, p. 97. |
| 14. |
OMB, FY2018 Budget of the U.S. Government: A New Foundation for American Greatness, Table S-7. |
| 15. |
Data in the OMB Public Budget Database reconcile to information presented in the Historical Tables volume of the FY2018 budget. The Public Budget Database itself is available here: http://www.whitehouse.gov/omb/budget/Supplemental. For a further description and important caveats, see the Public Budget Database User Guide, available at https://www.whitehouse.gov/sites/whitehouse.gov/files/omb/budget/fy2018/db_guide.pdf. |
| 16. |
Table 5.1 of the OMB Historical Tables is available at https://www.whitehouse.gov/sites/whitehouse.gov/files/omb/budget/fy2018/hist05z1.xls. |
| 17. |
See OMB, FY2018 Budget, Analytic Perspectives, ch. 12, "Offsetting Collections and Offsetting Receipts." |
| 18. |
More precisely, BCA caps are adjusted upward to reflect those spending categories. |
| 19. |
See CRS Report RL30346, Federal Credit Reform: Implementation of the Changed Budgetary Treatment of Direct Loans and Loan Guarantees, by [author name scrubbed], available upon request. |
| 20. |
See OMB, FY2018 Budget, Analytic Perspectives, ch.19, "Credit and Insurance." |
| 21. |
For example, some Federal Housing Administration mortgage programs and some federal student loan programs have been estimated to yield negative net subsidies. |
| 22. |
While the FCRA calculations include estimates of default costs, they do not discount more volatile income flows, as a private firm would. |
| 23. |
U.S. Congressional Budget Office, Estimating the Value of Subsidies for Federal Loans and Loan Guarantees, August 2004, available at http://cbo.gov/doc.cfm?index=5751. |
| 24. |
See CRS Report 98-280, Functional Categories of the Federal Budget, by [author name scrubbed] |
| 25. |
The allowance for future disaster costs is not included in calculations underlying graphs in order to conform to published data aggregates. Allowances that reflect enforcement of BCA discretionary spending limits are not included, as they are not disaggregated by function. Placeholder amounts are sometimes called "plug" numbers. |
| 26. |
|
| 27. |
2 U.S.C. 632(a)(4). |
| 28. |
For a history of deficit finance and American wars, see Robert D. Hormats, The Price of Liberty, (New York: Times Books, 2007); or Steven A. Bank, Kirk J. Stark, and Joseph J. Thorndike, War and Taxes, (Washington, D. C.: Urban Institute, 2008). |
| 29. |
For one view of budgetary politics in the early 1980s, see David Stockman, The Triumph of Politics, (New York: Harper & Row, 1986). |
| 30. |
The Warsaw Treaty Organization established in 1955, included Albania, Bulgaria, Czechoslovakia, the German Democratic Republic, Hungary, Poland, Romania, and the Soviet Union. |
| 31. |
CRS Report RL33110, The Cost of Iraq, Afghanistan, and Other Global War on Terror Operations Since 9/11, by [author name scrubbed]. The Afghan and Iraq wars, along with other related activities, are often called the Global War on Terror (GWOT). |
| 32. |
See CRS Report RL30588, Afghanistan: Post-Taliban Governance, Security, and U.S. Policy, by [author name scrubbed]. |
| 33. |
Mark Mazzetti and Eric Schmitt, "In a Shift, Obama Extends U.S. Role in Afghan Combat," New York Times, November 21, 2014. |
| 34. |
OMB, The Budget for FY2017, p. 4 and pp. 71-80. |
| 35. |
U.S. General Accounting Office (now Government Accountability Office; GAO), Military Sales to Israel and Egypt: DOD Needs Stronger Controls Over U.S.-Financed Procurements, GAO/NSIAD-93-184, July 1993; http://www.gao.gov/assets/160/153579.pdf. |
| 36. |
For a breakdown of international assistance spending, see Max Bearak and Lazaro Gamio, "Everything You Wanted to Know About the U.S. Foreign Assistance Budget: From Building Wells to Building Armies," Washington Post, October 18, 2016; https://www.washingtonpost.com/graphics/world/which-countries-get-the-most-foreign-aid/. |
| 37. |
CRS Report RL32427, Millennium Challenge Corporation, by [author name scrubbed]. |
| 38. |
See CRS In Focus IF10134, IMF Quota and Governance Reforms, by [author name scrubbed] and [author name scrubbed]. |
| 39. |
CBO, The Budgetary Effects of the United States' Participation in the International Monetary Fund, June 2016; https://www.cbo.gov/sites/default/files/114th-congress-2015-2016/reports/51663-IMF.pdf. |
| 40. |
|
| 41. |
For more information on the provisions of ARRA, see CRS Report R40537, American Recovery and Reinvestment Act of 2009 (P.L. 111-5): Summary and Legislative History, by [author name scrubbed] et al. |
| 42. |
For initial estimates, see U.S. Congressional Budget Office, Cost Estimate For the Conference Agreement For H.R. 1, February 13, 2009, available at http://cbo.gov/ftpdocs/99xx/doc9989/hr1conference.pdf. For a later assessment, see CBO, Budget and Economic Outlook: An Update, August 2010, Box 1-2, available at http://www.cbo.gov/ftpdocs/117xx/doc11705/08-18-Update.pdf. |
| 43. |
See OMB, The Budget for FY2018, Historical Tables, Table 8.2. |
| 44. |
Title VIII of the Supplemental Appropriations Act, 2009 (P.L. 111-32). |
| 45. |
A reduction in funding for a mandatory spending program, according to budget scorekeeping rules, can generate an offset to discretionary spending. |
| 46. |
|
| 47. |
For information on NIH ARRA-funded health projects, see U.S. Department of Health and Human Services, National Institutes of Health, NIH Grants Funded by the American Recovery and Reinvestment Act of 2009, March 20, 2013; https://report.nih.gov/recovery/ARRAFunding.aspx. |
| 48. |
See The Reagan Record, eds., John L. Palmer and Isabel V. Sawhill, (Washington, D.C.: Urban Institute, 1984), Appendix C, pp. 372-373. |
| 49. |
Katherine M. O'Regan and John M. Quigley, "Federal Policy and the Rise of Nonprofit Housing Providers," Journal of Housing Research, vol. 11, no. 2, 2000, pp. 301-302. Also see Charles L. Edson, "Affordable Housing—An Intimate History," Journal of Affordable Housing and Community Development, vol. 20, no. 2, winter 2011, pp. 193-213. |
| 50. |
David I. Auerbach, William B. Weeks, and Ian Brantley, "Health Care Spending and Efficiency in the U.S. Department of Veterans Affairs," RAND Corporation Research Report RR-285-MTF, 2013; http://www.rand.org/content/dam/rand/pubs/research_reports/RR200/RR285/RAND_RR285.pdf. |
| 51. |
CRS Report R42747, Health Care for Veterans: Answers to Frequently Asked Questions, by [author name scrubbed]. |
| 52. |
See CRS Report R44301, Veterans' Medical Care: FY2016 Appropriations, by [author name scrubbed]. Numbers for VA-Enrolled Veterans and patients using VA health care during the year were obtained from VA or VA budget submissions to Congress for FY2002-FY2016. The number for each fiscal year is taken from the budget submission two years later (e.g., the FY2000 number is from the FY2002 budget submission). |
| 53. |
Ibid., Table 1. |
| 54. |
Department of Veterans Affairs, FY2017 Budget Submission, Medical Programs and Information Technology Programs, vol. II, February 2016, p. VHA-180. For a chronology of wars involving the United States, see CRS Report RS21405, U.S. Periods of War and Dates of Recent Conflicts, by [author name scrubbed]. |
| 55. |
Daniel Yergin, The Prize: The Epic Quest for Oil, Money and Power, (New York: Free Press, 1991), ch. 33. |
| 56. |
Jimmy Carter, "Energy Security Act Remarks on Signing S. 952 Into Law," June 30, 1980; http://www.presidency.ucsb.edu/ws/?pid=44684. |
| 57. |
Robert D. Hershey Jr., "Synfuels Corp. is Running on Empty," New York Times, August 25, 1985. The Synthetic Fuels Corporation was disestablished by P.L. 99-190 and P.L. 99-272. |
| 58. |
U.S. Congress, Senate Committee on Energy and Natural Resources, Subcommittee on Energy Resources and Materials Production, Strategic Petroleum Reserve, 96th Cong., 1st sess., December 13, 1979, S. Hrg. 96-91 (Washington: GPO, 1980). G7 members are the United States, the United Kingdom, France, the Federal Republic of Germany, Italy, Japan, Canada, and the European Union. |
| 59. |
Supplemental Appropriations and Rescission Act, 1980 (P.L. 96-304). |
| 60. | |
| 61. |
Center for Climate and Energy Solutions, "U.S. Department of Energy's Recovery Act Investments," issue brief, January 5, 2013; http://www.c2es.org/docUploads/arra-brief-feb-2013.pdf. See Transportation section below. |
| 62. |
CRS Report 96-647, Water Infrastructure Financing: History of EPA Appropriations, by [author name scrubbed]. |
| 63. |
For more information, see, Federally Supported Water Supply and Wastewater Treatment Programs, coordinated by [author name scrubbed]. |
| 64. |
Daniel McCool, Command of the Waters: Iron Triangles, Federal Water Development, and Indian Water, (Berkeley: University of California Press, 1987), pp. 196-204. Also see President Jimmy Carter, "Water Resource Projects—Statement Announcing Administration Decisions," April 18, 1977; http://www.presidency.ucsb.edu/ws/?pid=7364; as well as Paul R. Portnoy, "Natural Resources and the Environment," in The Reagan Record, eds., John L. Palmer and Isabel V. Sawhill, (Washington, D.C.: Urban Institute, 1984), pp. 160-161. |
| 65. |
See CRS Report R43910, Water Resource Issues in the 114th Congress, by [author name scrubbed] et al.. |
| 66. |
United States Department of the Interior, Bureau of Reclamation, Assessment '87: A New Direction for the Bureau of Reclamation, 1987. Also see Richard W. Wahl, "New Roles for the Bureau of Reclamation," Natural Resources Law Center, University of Colorado School of Law occasional paper, 1989; http://scholar.law.colorado.edu/cgi/viewcontent.cgi?article=1109&context=books_reports_studies; as well as Andrew H. Gahan and William D. Rowley, The Bureau of Reclamation: From Developing to Managing Water, 1945-2000, vol. 2, (U.S. Department of the Interior, Bureau of Reclamation: Denver, 2012), pp. 862-866. |
| 67. |
See CRS Report R40216, Water Infrastructure Funding in the American Recovery and Reinvestment Act of 2009, by [author name scrubbed], [author name scrubbed], and [author name scrubbed]. |
| 68. |
See CRS Report R42875, FHA Single-Family Mortgage Insurance: Financial Status of the Mutual Mortgage Insurance Fund (MMI Fund), by [author name scrubbed]. Also see Chad Chirico and Susanne Mehlman, "How FHA's Mutual Mortgage Insurance Fund Accounts for the Cost of Mortgage Guarantees," CBO Blog, October 22, 2013; https://www.cbo.gov/publication/44634. |
| 69. |
See CRS Report R44603, Reforming the U.S. Postal Service: Background and Issues for Congress, coordinated by [author name scrubbed]. |
| 70. |
CRS Report RS21025, The Postal Revenue Forgone Appropriation: Overview and Current Issues, by [author name scrubbed]. |
| 71. |
CBO, The Highway Trust Fund and the Treatment of Surface Transportation Programs in the Federal Budget, June 2014; https://www.cbo.gov/sites/default/files/113th-congress-2013-2014/reports/45416-TransportationScoring.pdf. |
| 72. |
CBO, Public Works Infrastructure: Policy Considerations for the 1980s, April 1983, ch. 3; https://www.cbo.gov/sites/default/files/98th-congress-1983-1984/reports/doc20-entire.pdf. Also see DOT, Urban Mass Transit Administration, FY1980 Summary of UMTA'S Transit Assistance Program, 1981; https://ia802709.us.archive.org/13/items/fy1980yearendsum00offi_0/fy1980yearendsum00offi_0.pdf. |
| 73. |
See CRS Report R43520, Community Development Block Grants and Related Programs: A Primer, by [author name scrubbed]. Also see Seth R. Marcus, "Community Development Block Grants," in Goldfield, David R. (ed.), Encyclopedia of American Urban History, (Thousand Oaks, CA: Sage, 2006). |
| 74. |
See CRS Report R43394, Community Development Block Grants: Recent Funding History, by [author name scrubbed]. |
| 75. |
See OMB, FY2018 Budget, Historical Tables, Table 4.2. NASA spending accounted for 4.3% of federal outlays in FY1965 and 4.4% in FY1966. See also CBO, Reinventing NASA, March 1994; https://www.cbo.gov/sites/default/files/cbofiles/ftpdocs/48xx/doc4893/doc20.pdf. |
| 76. |
See CRS Report R44114, Update on the Highly-Pathogenic Avian Influenza Outbreak of 2014-2015, by [author name scrubbed]. |
| 77. |
See CRS Report R44193, Federal Credit Programs: Comparing Fair Value and the Federal Credit Reform Act (FCRA), by [author name scrubbed]. |
| 78. |
CRS Report RL33308, Community Oriented Policing Services (COPS): In Brief, by [author name scrubbed]. |
| 79. |
See GAO, Federal Buildings Fund: Improved Transparency and Long-term Plan Needed to Clarify Capital Funding Priorities, GAO-12-646, July 2012; http://www.gao.gov/assets/600/592377.pdf. |
| 80. |
See archived CRS Report 95-328E, Financial Control Boards for Cities in Distress, by Nona Notto and Lillian Rymarowicz, which is available upon request. |
| 81. |
See CRS Report R44099, District of Columbia: Issues in the 114th Congress, coordinated by [author name scrubbed]. |