Department of Defense Contractor and Troop Levels in Afghanistan and Iraq: 2007-2020
Changes from April 28, 2017 to May 10, 2019
This page shows textual changes in the document between the two versions indicated in the dates above. Textual matter removed in the later version is indicated with red strikethrough and textual matter added in the later version is indicated with blue.
Department of Defense Contractor and Troop Levels in Iraq and Afghanistan: 2007-2017
Afghanistan and Iraq: 2007-2018
Contents
- Introduction
- The Role of Contractors in Military Operations
- Tracking Contractors During Contingency Operations
- Force Management Levels for Deployed U.S. Armed Forces
andDOD Usage of Contractors During Ongoing Military Operations
- Private Security Contractors in
Iraq and AfghanistanAfghanistan and Iraq
- U.S. Armed Forces and Contractor Personnel in Afghanistan
, FY2007-FY2017 - U.S. Armed Forces and Contractor Personnel in Iraq
, FY2007-FY2017
Figures
Tables
- Table 1. U.S. Armed Forces and Contractor Personnel in Afghanistan
- Table 2. U.S. Armed Forces and Private Security Contractor Personnel in Afghanistan
- Table 3. U.S. Armed Forces and Contractor Personnel in Iraq
- Table 4. U.S. Armed Forces and Private Security Contractors in Iraq
- Table 5. DOD Contract Obligations in Iraq and Afghanistan Theaters of Operation
Summary
Throughout its history, the Department of Defense (DOD) has relied on contractors to support a wide range of military operations. Operations over the last thirty years have highlighted the critical role that contractors play in supporting U.S. troops—both in terms of the number of contractors and the type of work being performed. During recent U.S. military operations in Iraq and Afghanistan, contractors often accounted for 50% or more of the total DOD presence in-country.
For the fourth quarter of fiscal year (FY) 2018, U.S. Central Command (CENTCOM) reported 49,451 contractor personnel working for DOD within its area of responsibility, which included 28,189 individuals located in Afghanistan, Iraq, and Syria. From FY2009 to FY2018, obligations for all DOD-funded contracts performed within the Iraq and Afghanistan areas of operation totaled approximately $208 billion in FY2019 dollars.
In late 2017, the DOD stopped reporting the number of U.S. military personnel deployed in support of operations in Afghanistan, Iraq, and Syria as part of its quarterly manpower reports and in other official releases. These data remain withheld.
Introduction
This report provides background information for Congress on the levels of Department of Defense (DOD) troopmilitary servicemembers and contractor personnel deployed in support of prior and ongoing military operations in Iraq and Afghanistan. For more information on DOD's use of contractor personnel to support military operations, see, see CRS In Focus IF10600, Defense Primer: Department of Defense Contractors, by Heidi M. Peters and Moshe Schwartz and CRS Report R43074, Department of Defense's Use of Contractors to Support Military Operations: Background, Analysis, and Issues for Congress, by Moshe Schwartz.
The Role of Contractors in Military Operations
Throughout its history, DOD has relied on contractors to support a wide range of military operations. Operations over the past 30 years have highlighted the critical role that contractors play in supporting U.S. troops—military servicemembers, both in terms of the number of contractors and the type of work being performed. During recent U.S. military operations in Iraq and Afghanistan, contractors frequently averaged 50% or more of the total DOD presence in-country.
|
Within the defense policy community, the term contractor is commonly used in two different contexts. The word can describe the private companies with which DOD contracts to obtain goods and services. It can also describe individuals hired by DOD – usually through private companies, which are also considered contractors in the previous context – to perform specific tasks. The term contractor does not refer to military servicemembers, civilian DOD career employees, or civilian political appointees. |
Tracking Contractors During Contingency Operations
Since 2008, U.S. Central Command (CENTCOM) has published quarterly contractor census reports, which that provide aggregated data— – including elements such as mission category and nationality— – on contractors employed through DOD-funded contracts who are physically located within the CENTCOM area of responsibility.
Analysts and observers have previously raised questions about the reliability of the data gathered by DOD regarding the number of contractors it employs in theater in support of military operations.32 DOD officials, however, have stated that since 2009, the DOD has implemented a variety of mechanisms to improve the reliability of contractor data it gathers, including modifications to information technology systems, such as data collection systems like the joint Synchronized Predeployment and Operational Tracker (SPOT) database; updates and changes to related departmental policies; and changes in "leadership emphasis" within DOD and the combatant commands.4
For the fourth quarter of Fiscal Year (FY) 20162018, CENTCOM reported 42,59249,451 contractor personnel working for DOD within its area of responsibility, which included 28,189 individuals located in Afghanistan and Iraq.
From FY2007 to FY2016, Iraq, and Syria (see Figure 1 and Figure 2).
From FY2009 to FY2018, obligations for all DOD-funded contracts performed within the Iraq and Afghanistan areas of operation totaled approximately $249208 billion in FY2017FY2019 dollars.5
Force Management Levels for Deployed U.S. Armed Forces and DOD Usage of Contractors
Force management levels, sometimes also described as troop caps, troop ceilings, or force manning levels, have historically been used by the United States to establish bounds on the number of military personnel that may be deployed in a country or region.
The executive and legislative branches of the U.S. government have historically used force management levels to guide the execution of certain overseas U.S. military operations, as well as the associated presence of DOD personnel. During the 1980s, for example, Congress used provisions within annual appropriations legislation to establish force management levels limiting the number of active duty U.S. military personnel stationed ashore in Europe.65 The Obama Administration used force management levels to manage theits drawdown of the U.S. military presence in Afghanistan, and to manage the U.S. military presence in Iraq and Syria under Operation Inherent Resolve.76 The Trump Administration has reportedly delegated the authority to establish force management levels for Afghanistan, Iraq,Iraq and Syria to the Secretary of Defense.8
In August 2017, the DOD announced that it was revising its force management level accounting and reporting practices for Afghanistan to also include U.S. Armed Forces personnel in-country for short-duration missions, personnel in a temporary duty status, personnel assigned to combat support agencies, and forces assigned to the material recovery element and the Resolute Support sustainment brigade in reported totals.8 In late 2017, the Defense Department stopped reporting the number of U.S. military personnel deployed in support of operations in Afghanistan, Iraq, and Syria as part of its quarterly manpower reports and in other official releases. These data remain withheld, leading to criticism from some observers and Members of Congress.9 The House-passed version of the FY2018 National Defense Authorization Act (NDAA, H.R. 2810) contained a provision (Section 923) that would have expressed the sense of Congress that the DOD should discourage the practice of substituting contractor personnel for available members of the Armed Forces when a unit deploys overseas. This section also would have required the Secretary of Defense to provide a related briefing to the congressional defense committees. A similar provision was not included in the Senate amendment to H.R. 2810. While the House receded in conference, the conferees directed the Secretary of Defense to provide a briefing detailing steps taken by DOD to revise deployment guidelines to ensure readiness, unit cohesion, and maintenance were prioritized, as well as the Secretary of Defense's plan to establish a policy to avoid the practice of directly substituting contractor personnel for U.S. military personnel when practicable in the future.Some observers and experts, however, have argued that such external "resource limits" have increased DOD's recent 7
910 In February 2017, U.S. Army General John Nicholson, then Commander of the NATO Resolute Support Mission and United States Forces–Afghanistan, testified before the Senate Armed Services Committee that DOD has had to "substitute contractors for soldiers in order to meet the force manning levels" in Afghanistan.1011 While the drawdown of U.S. forces has contributed to a demonstrable increase in the ratio of contractors to uniformed service membersservicemembers in Afghanistan between 2012 and 2017, it is difficult to assess if thisthe increased ratio supportssupported General Nicholson's assertion. Moreover, concern about DOD's use of contractors in contingency operations predates the Obama Administration's use
11
Private Security Contractors in Iraq and Afghanistan
Afghanistan and Iraq
In Iraq and Afghanistan, armed and unarmed private security contractors have been employed to provide services such as protecting fixed locations; guarding traveling convoys; providing security escorts; and training police and military personnel. The number of private security contractor employees working for DOD in Iraq and Afghanistan has fluctuated significantly over time, and is dependent on a variety of factors, including current force management levels in-country and U.S. operational needs.
The presence of private security contractors peaked in Afghanistan in 2012 at more than 28,000 individuals and in Iraq in 2009 at more than 15,000 individuals. For the fourth quarter of FY2018For the fourth quarter of FY2016, DOD reported 3,0534,172 private security contractors in Afghanistan, with 8132,397 categorized as armed private security contractors (see Table 2). DOD reported 239418 security contractor personnel in Iraq and Syria during the same period, none of whom were identified as armed private security contractors. Private security contractors peaked in Afghanistan in 2012 at more than 28,000 and in Iraq in 2009 at more than 15,000 (see Table 4).
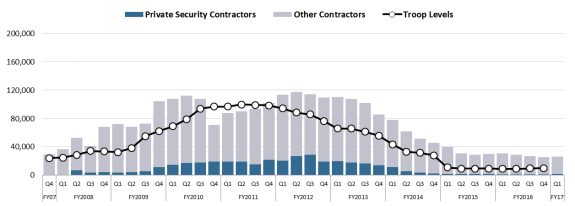
U.S. Armed Forces and Contractor Personnel in Afghanistan, FY2007-FY2017
As of the fourth quarter of FY2016, 25,197FY2018, 25,239 DOD contractor personnel were located in Afghanistan, compared to 9,800 U.S. troops, with contract personnel representing approximately 72% of the total DOD manpower in-country.12 (see Table 1).13 Approximately 3644% of DOD's 25,197 reported individual contractors were U.S. citizens (10,989), approximately 2342% were third-country nationals (10,628), and roughly 4114% were local/host-country nationals.
nationals (3,622). Of the 25,197239 DOD contractor personnel, about 39% were armed private security contractors.
As of May 2019, observers and analysts estimated the number of U.S. Armed Forces personnel in Afghanistan to be between 14,000 and 15,000.14 Reports in early 2019 indicate the Trump Administration may be contemplating withdrawing some portion of in-country U.S. forces (a subject of ongoing U.S.-Taliban negotiations). U.S. officials have stated that no final policy decision has been made.15
|
U.S. Armed Forces |
Total Contractors |
U.S. Nationals Contractors |
Foreign and Host Country National Contractors |
|
|
Q4 FY2007 |
24,056 |
29,473 |
3,387 |
26,086 |
|
Q1 FY2008 |
24,780 |
36,520 |
5,153 |
31,367 |
|
Q2 FY2008 |
28,650 |
52,336 |
4,220 |
48,116 |
|
Q3 FY2008 |
33,902 |
41,232 |
4,724 |
36,508 |
|
Q4 FY2008 |
33,450 |
68,252 |
5,405 |
62,847 |
|
Q1 FY2009 |
32,500 |
71,755 |
5,960 |
65,795 |
|
Q2 FY2009 |
38,350 |
68,197 |
9,378 |
58,819 |
|
Q3 FY2009 |
55,100 |
73,968 |
10,036 |
62,932 |
|
Q4 FY2009 |
62,300 |
104,101 |
9,322 |
94,779 |
|
Q1 FY2010 |
69,000 |
107,292 |
10,016 |
97,276 |
|
Q2 FY2010 |
79,100 |
112,092 |
16,081 |
96,011 |
|
Q3 FY2010 |
93,800 |
107,479 |
19,103 |
88,376 |
|
Q4 FY2010 |
96,600 |
70,599 |
20,874 |
49,725 |
|
Q1 FY2011 |
96,900 |
87,483 |
19,381 |
68,102 |
|
Q2 FY2011 |
99,800 |
90,339 |
20,413 |
69,926 |
|
Q3 FY2011 |
98,900 |
93,118 |
23,294 |
69,824 |
|
Q4 FY2011 |
98,200 |
101,789 |
23,190 |
78,599 |
|
Q1 FY2012 |
94,100 |
113,491 |
25,287 |
88,204 |
|
Q2 FY2012 |
88,200 |
117,227 |
34,765 |
82,462 |
|
Q3 FY2012 |
85,600 |
113,736 |
30,568 |
83,168 |
|
Q4 FY2012 |
76,500 |
109,564 |
31,814 |
77,750 |
|
Q1 FY2013 |
65,800 |
110,404 |
33,444 |
76,960 |
|
Q2 FY2013 |
65,700 |
107,796 |
33,107 |
74,689 |
|
Q3 FY2013 |
61,300 |
101,855 |
32,442 |
69,413 |
|
Q4 FY2013 |
55,800 |
85,528 |
27,188 |
58,340 |
|
Q1 FY2014 |
43,300 |
78,136, |
23,763 |
54,373 |
|
Q2 FY2014 |
33,200 |
61,452 |
20,865 |
40,587 |
|
Q3 FY2014 |
31,400 |
51,489 |
17,404 |
34,085 |
|
Q4 FY2014 |
27,800 |
45,349 |
17,477 |
27,872 |
|
Q1 FY2015 |
10,600 |
39,609 |
14,222 |
25,387 |
|
Q2 FY2015 |
9,100 |
30,820 |
12,033 |
18,787 |
|
Q3 FY2015 |
9,060 |
28,931 |
10,019 |
18,912 |
|
Q4 FY2015 |
9,100 |
30,211 |
10,347 |
19,864 |
|
Q1 FY2016 |
8,930 |
30,455 |
10,151 |
20,304 |
|
Q2 FY2016 |
8,730 |
28,626 |
9,640 |
18,986 |
|
Q3 FY2016 |
9,365 |
26,435 |
8,837 |
17,598 |
|
Q4 FY2016 |
9,800 |
25,197 |
9,142 |
16,055 |
|
Q1 FY2017 |
Not Yet Available |
26,022 |
9,474 |
16,548 |
Q2 FY2017 8,400 24,900 9,522 15,378 Q3 FY2017 8,300 23,525 9,436 14,089 Q4 FY2017 23,659 9,418 14,241 Q1 FY2018 Not Available 26,043 10,189 15,854 Q2 FY2018 Not Available 26,647 10,891 15,756 Q3 FY2018 Not Available 26,922 10,128 16,794 Q4 FY2018 Not Available 25,239 10,989 14,250Sources: Contractor levels drawn from U.S. Central Command (CENTCOM) Quarterly Contractor Census Reports; troop levels
11,100a
Sources: Contractor levels drawn from CENTCOM Quarterly Contractor Census Reports; U.S. Armed Forces levels through Q4 FY2017 drawn from "Boots on the Ground" monthly reports to Congress.
Note: DOD did not begin releasing data on contractors in CENTCOM until Q4 FY2007. U.S. Armed Forces personnel figureslevels include all active and reserve component personnel.
a. In August 2017, DOD revised its force management level accounting and reporting practices for Afghanistan to include U.S. Armed Forces personnel in-country for short-duration missions, personnel in a temporary duty status, personnel assigned to combat support agencies, and forces assigned to the material recovery element and the Resolute Support sustainment brigade in reported totals. See U.S. Department of Defense, Press Operations, "Department of Defense Afghanistan Force Management Level Accounting and Reporting Practices Briefing by Pentagon Chief Spokesperson White and Joint Staff Director Lieutenant General McKenzie in the Pentagon Briefing Room," transcript, August 30, 2017. include all active and reserve component personnel.
Table 2. U.S. Armed Forces and Private Security Contractor Personnel in Afghanistan
(Q2 FY2008-Q1 FY2017Q4 FY2018)
|
U.S. Armed Forces |
Total Private Security Contractorsa |
U.S. National Private Security Contractors |
Foreign and Host Country National Private Security Contractors |
|
|
Q2 FY2008 |
28,650 |
6,982 |
167 |
6,815 |
|
Q3 FY2008 |
33,902 |
3,537 |
5 |
3,532 |
|
Q4 FY2008 |
33,450 |
3,847 |
9 |
3,838 |
|
Q1 FY2009 |
32,500 |
3,689 |
15 |
3,674 |
|
Q2 FY2009 |
38,350 |
4,373 |
17 |
4,356 |
|
Q3 FY2009 |
55,100 |
5,198 |
19 |
5,179 |
|
Q4 FY2009 |
62,300 |
11,423 |
76 |
11,347 |
|
Q1 FY2010 |
69,000 |
14,439 |
114 |
14,325 |
|
Q2 FY2010 |
79,100 |
16,733 |
140 |
16,593 |
|
Q3 FY2010 |
93,800 |
17,932 |
152 |
17,780 |
|
Q4 FY2010 |
96,600 |
18,869 |
197 |
18,672 |
|
Q1 FY2011 |
96,900 |
18,919 |
250 |
18,669 |
|
Q2 FY2011 |
99,800 |
18,971 |
250 |
18,721 |
|
Q3 FY2011 |
98,900 |
15,305 |
693 |
14,612 |
|
Q4 FY2011 |
98,200 |
21,544 |
603 |
20,941 |
|
Q1 FY2012 |
94,100 |
20,375 |
570 |
19,805 |
|
Q2 FY2012 |
88,200 |
26,612 |
519 |
26,093 |
|
Q3 FY2012 |
85,600 |
28,686 |
480 |
28,206 |
|
Q4 FY2012 |
76,500 |
18,914 |
2,014 |
16,850 |
|
Q1 FY2013 |
65,800 |
19,414 |
2,094 |
17,320 |
|
Q2 FY2013 |
65,700 |
17,993 |
1,378 |
16,615 |
|
Q3 FY2013 |
61,300 |
16,218 |
873 |
15,345 |
|
Q4 FY2013 |
55,800 |
14,056 |
844 |
13,212 |
|
Q1 FY2014 |
43,300 |
11,332 |
1,007 |
10,325 |
|
Q2 FY2014 |
33,200 |
5,591 |
641 |
4,950 |
|
Q3 FY2014 |
31,400 |
3,177 |
424 |
2,753 |
|
Q4 FY2014 |
27,800 |
2,472 |
252 |
2,220 |
|
Q1 FY2015 |
10,600 |
1,511 |
317 |
1,194 |
|
Q2 FY2015 |
9,100 |
1,525 |
398 |
1,127 |
|
Q3 FY2015 |
9,060 |
1,779 |
421 |
1,358 |
|
Q4 FY2015 |
9,100 |
1,655 |
312 |
1,343 |
|
Q1 FY2016 |
8,930 |
1,083 |
176 |
907 |
|
Q2 FY2016 |
8,730 |
872 |
125 |
747 |
|
Q3 FY2016 |
9,365 |
1,022 |
174 |
848 |
|
Q4 FY2016 |
9,800 |
813 |
145 |
668 |
|
Q1 FY2017 |
Not Yet Available |
1,722 |
473 |
1,249 |
1,722 473 1,249 Q2 FY2017 8,400 1,816 436 1,380 Q3 FY2017 8,300 1,695 449 1,246 Q4 FY2017 11,100 1,829 493 1,336 Q1 FY2018 Not Available 1,867 426 1,441 Q2 FY2018 Not Available 1,932 416 1,516 Q3 FY2018 Not Available 2,002 746 1,256 Q4 FY2018 Not Available 2,397 364 2,033Sources: Contractor levels drawn from CENTCOM Quarterly Contractor Census Reports; force levels9,200
Sources: Contractor levels drawn from CENTCOM Quarterly Contractor Census Reports; U.S. Armed Forces levels through Q4 FY2017 drawn from "Boots on the Ground" monthly reports to Congress.
Notes: DOD did not begin releasing data on private security contractor personnel levels within Afghanistan until Q2 FY2008. U.S. Armed Forces personnel figureslevels include all active and reserve component personnel.
a. Includes most subcontractors and service contractors, armed and unarmed, hired by prime contractors under DOD contracts.
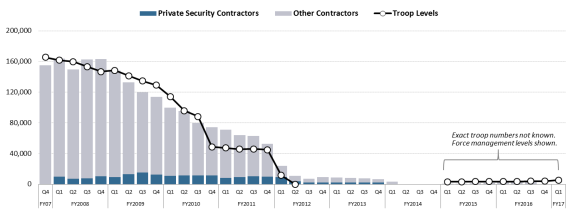
U.S. Armed Forces and Contractor Personnel in Iraq, FY2007-FY2017
DOD ceased publicly reporting numbers of DOD contractor personnel working in Iraq in December 2013, following the conclusion of the U.S. combat mission in Iraq (Operation Iraqi Freedom and Operation New Dawn), and the subsequent drawdown of DOD contractor personnel levels in Iraq. In late 2014, in response in part to developing operations in the region, DOD reinitiated reporting broad estimates of DOD contractor personnel deployed in Iraq in support of Operation Inherent Resolve (OIR). As the number of DOD contractor personnel in Iraq increased over the first six months of 2015, DOD resumed reporting exact numbers and primary mission categories of OIR contractor personnel in June 2015.
In the second quarter of FY2018, DOD began reporting a combined total of contractor personnel physically located in Iraq and Syria.As of the fourth quarter of FY2016FY2018, there were 2,992 DOD contractor personnel in Iraq, compared to a force management level authorizing the presence of up to 4,087 U.S. troops in Iraq, primarily deployed as part of a U.S.-led coalition advise-and-assist mission in support of the Government of Iraq.13 Contract personnel would thus represent approximately 42% of the total estimated DOD personnel presence in-country. Approximately 61% of DOD's 2,992 reported individual contractors were U.S. citizens, approximately 25% were third-country nationals; and roughly 14% were local/host-country nationals.
In December 2017, DOD indicated the number of U.S. Armed Forces personnel in Iraq was roughly 5,200, and indicated the number of U.S. Armed Forces personnel in Syria was approximately 2,000.17 In December 2018, President Donald J. Trump announced that U.S. forces had defeated the Islamic State and would leave Syria; however, in February 2019, the White House indicated that several hundred U.S. troops would remain in Syria.18
|
Figure 2. U.S. Armed Forces and Contractor Personnel in Iraq (Q4 F72007-Q1 FY2014; Q1 FY2015- |
 |
|
Source: Notes: DOD did not begin releasing data on DOD-funded private security contractor personnel |
Table 3. U.S. Armed Forces and Contractor Personnel in Iraq
(Q4 F72007-Q1 FY2014; Q1 FY2015- U.S. Armed Forces Total Contractors U.S. National Contractors Foreign and Host Country National Contractors Q4 FY2007 165,607 154,825 26,869 127,956 Q1 FY2008 161,783 163,591 31,325 132,266 Q2 FY2008 159,700 149,378 29,351 120,027 Q3 FY2008 153,300 162,428 29,611 132,817 Q4 FY2008 146,900 163,446 28,045 135,401 Q1 FY2009 148,500 148,050 39,262 108,788 Q2 FY2009 141,300 132,610 36,061 96,549 Q3 FY2009 134,500 119,706 31,541 88,165 Q4 FY2009 129,200 113,731 29,944 83,787 Q1 FY2010 114,300 100,035 27,843 72,192 Q2 FY2010 95,900 95,461 24,719 70,742 Q3 FY2010 88,320 79,621 22,761 56,860 Q4 FY2010 48,410 74,106 20,981 53,125 Q1 FY2011 47,305 71,142 19,943 51,199 Q2 FY2011 45,660 64,253 18,393 45,860 Q3 FY2011 46,010 62,689 18,900 43,789 Q4 FY2011 44,755 52,637 16,054 36,583 Q1 FY2012 11,445 11,237 12,649 Q2 FY2012 — 3,260 7,707 Q3 FY2012 — 2,493 4,843 Q4 FY2012 — 2,314 6,686 Q1 FY2013 — 2,356 6,093 Q2 FY2013 — 2,125 5,780 Q3 FY2013 — 1,898 5,837 Q4 FY2013 — 1,626 4,998 Q1 FY2014 — 820 2,414Q1 FY2017Q4 FY2018)
23,886a
10,967a
7,336a
9,000a
8,449a
7,905a
7,735a
6,624a
3,234a
)
|
U.S. Armed Forces |
Total Contractors |
U.S. National Contractors |
Foreign and Host Country National Contractors |
|||||||||||||||||||||||||||||||||||||
|
Q4 FY2007 |
|
|
|
| ||||||||||||||||||||||||||||||||||||
|
Q1 FY2008 |
|
|
|
| ||||||||||||||||||||||||||||||||||||
|
Q2 FY2008 |
|
|
|
| ||||||||||||||||||||||||||||||||||||
|
Q3 FY2008 |
|
|
|
| ||||||||||||||||||||||||||||||||||||
|
Q4 FY2008 |
|
|
|
| ||||||||||||||||||||||||||||||||||||
|
Q1 FY2009 |
|
|
|
| ||||||||||||||||||||||||||||||||||||
|
Q2 FY2009 |
|
|
|
| ||||||||||||||||||||||||||||||||||||
|
Q3 FY2009 |
|
|
|
| ||||||||||||||||||||||||||||||||||||
|
Q4 FY2009 |
|
|
|
| ||||||||||||||||||||||||||||||||||||
|
Q1 FY2010 |
|
|
|
| ||||||||||||||||||||||||||||||||||||
|
Q2 FY2010 |
|
|
|
| ||||||||||||||||||||||||||||||||||||
|
Q3 FY2010 |
|
|
|
| ||||||||||||||||||||||||||||||||||||
|
Q4 FY2010 |
|
|
|
| ||||||||||||||||||||||||||||||||||||
|
Q1 FY2011 |
|
|
|
| ||||||||||||||||||||||||||||||||||||
|
Q2 FY2011 |
|
|
|
| ||||||||||||||||||||||||||||||||||||
|
Q3 FY2011 |
|
|
|
| ||||||||||||||||||||||||||||||||||||
|
Q4 FY2011 |
|
|
|
| ||||||||||||||||||||||||||||||||||||
|
Q1 FY2012 |
|
|
|
| ||||||||||||||||||||||||||||||||||||
|
Q2 FY2012 |
— |
|
|
| ||||||||||||||||||||||||||||||||||||
|
Q3 FY2012 |
— |
|
|
| ||||||||||||||||||||||||||||||||||||
|
Q4 FY2012 |
— |
|
|
| ||||||||||||||||||||||||||||||||||||
|
Q1 FY2013 |
— |
|
|
| ||||||||||||||||||||||||||||||||||||
|
Q2 FY2013 |
— |
|
|
| ||||||||||||||||||||||||||||||||||||
|
Q3 FY2013 |
— |
|
|
| ||||||||||||||||||||||||||||||||||||
|
Q4 FY2013 |
— |
|
|
| ||||||||||||||||||||||||||||||||||||
|
Q1 FY2014 |
— |
|
|
|
||||||||||||||||||||||||||||||||||||
|
No Data on Contractors Released by CENTCOM from Q2 FY2014-Q4 FY2014 |
||||||||||||||||||||||||||||||||||||||||
|
Q1 FY2015 |
Up to 3,100b |
250 (est.) |
No Data Available |
No Data Available |
||||||||||||||||||||||||||||||||||||
|
Q2 FY2015 |
Up to 3,100b |
600 (est.) |
No Data Available |
No Data Available |
||||||||||||||||||||||||||||||||||||
|
Q3 FY2015 |
Up to 3,550c |
1,349 |
1,140 |
209 |
||||||||||||||||||||||||||||||||||||
|
Q4 FY2015 |
Up to 3,550c |
1,403 |
1,098 |
305 |
||||||||||||||||||||||||||||||||||||
|
Q1 FY2016 |
Up to 3,550d |
2,028 |
1,392 |
636 |
||||||||||||||||||||||||||||||||||||
|
Q2 FY2016 |
Up to 3,550d |
2,619 |
1,564 |
1,055 |
||||||||||||||||||||||||||||||||||||
|
Q3 FY2016 |
Up to 4,087e |
2,485 |
1,605 |
880 |
||||||||||||||||||||||||||||||||||||
|
Q4 FY2016 |
Up to 4,087e |
2,992 |
1,823 |
1,169 |
||||||||||||||||||||||||||||||||||||
|
Q1 FY2017 |
Up to 5,262f |
3,592 |
2,035 |
1,557
|
Up to 5,262f
Q2 FY2017
|
3,795
|
2,149
|
1,206
|
Up to 5,262g
Q3 FY2017
|
4,485
|
2,424
|
2,061
|
Up to 5,262g
Q4 FY2017
|
4,609
|
2,644
|
1,965
|
Not Availableh
Q1 FY2018
|
4,927
|
2,767
|
2,160
|
Contractor Personnel in Iraq and Syria
|
Q2 FY2018
|
Not Available
|
5,508
|
2,869
|
2,639
|
Q3 FY2018
|
Not Available
|
5,323
|
2,651
|
2,672
|
Q4 FY2018
|
Not Available
|
6,318
|
3,086
|
3,232 | ||||
Sources: Force levels from Q4 FY2007-Q1FY2012Q1 FY2012 are drawn from the DOD's "Boots on the Ground" monthly reports to Congress. U.S. Armed Forces personnel figures for Q4 FY2007-Q1FY2012, and include all active and reserve component personnel. Force levels for Q1FY2015-Q1FY2017Q1 FY2015-Q4 FY2017 are drawn from the White House's semiannual "War Powers Resolution Report" to Congress. All listed contractor levels are drawn from CENTCOM Quarterly Contractor Census Reports.
Notes: DOD did not begin releasing data on contractors in CENTCOM until the second half of 2007, and initially ceased reporting data on DOD contractor personnel in Iraq in December 2013.
Following the conclusion of the U.S. combat mission in Iraq, the "Boots on the Ground" monthly reports ceased providing separate force levels for Iraq. However, a residual U.S. force remained in county to provide embassy security and security cooperation assistance. Beginning in June 2014, in support of U.S. military operations against the Islamic State (also known as ISIS/ISIL), additional U.S. military personnel were deployed to Iraq through OIR to advise and train Iraqi forces, serve as observers, and secure U.S. personnel and facilities.
For further discussion of the U.S. and its coalition partners' efforts to combat the Islamic State, see CRS Report R43612, The Islamic State and U.S. Policy, by Christopher M. Blanchard and Carla E. Humud.
In Q1FY2015In Q1 FY2015, CENTCOM resumed releasing data on DOD contractor personnel in Iraq—as. As the "Boots on the Ground" reports do not currently provide OIR force levels, CRS is using the Force Management Levelsused the force management levels for Iraq reported biannually by the White House between December 2014 and June 2017, beginning with the December 2014 "Six Month Consolidated War Powers Resolution Report" and ending with the June 2017 "Supplemental Consolidated War Powers Resolution Report," to provide an indication of the current number of U.S. forces estimated to be in Iraqnumber of U.S. forces estimated to be in Iraq during that period. As of December 2017, the "Supplemental Consolidated War Powers Resolution Report" no longer provides current force management levels for Iraq or Syria.
As of Q2 FY2018, CENTCOM reported a combined total of contractor personnel physically located in Iraq and Syria.
a. CENTCOM reported that DOD contractors in Iraq from Q1FY2012 through Q1FY2014 were supporting both U.S. Mission Iraq and the Office of Security Cooperation -Iraq.
b. Force Management Level for Iraq, as reported by Thethe White House, Office of the Press Secretary, "Letter from the President—Six Month Consolidated War Powers Resolution Report," December 11, 2014, at https://www.obamawhitehouse.archives.gov/the-press-office/2014/12/11/letter-president-six-month-consolidated-war-powers-resolution-report.
c. Force Management Level for Iraq, as reported by Thethe White House, Office of the Press Secretary, "Letter from the President—Six Month Consolidated War Powers Resolution Report," June 11, 2015, at https://www.obamawhitehouse.archives.gov/the-press-office/2015/06/11/letter-president-six-month-consolidated-war-powers-resolution-report.
d. Force Management Level for Iraq, as reported by Thethe White House, Office of the Press Secretary, "Letter from the President—War Powers Resolution," December 11, 2015, at https://www.obamawhitehouse.archives.gov/the-press-office/2015/12/11/letter-president-war-powers-resolution.
e. Force Management Level for Iraq, as reported by Thethe White House, Office of the Press Secretary, "Letter from the President—War Powers Resolution," June 13, 2016, at https://www.obamawhitehouse.archives.gov/the-press-office/2016/06/13/letter-president-war-powers-resolution.
f. Force Management Level for Iraq, as reported by Thethe White House, Office of the Press Secretary, "Letter from the President—Supplemental 6-month War Powers Letter," December 5, 2016, at https://obamawhitehouse.archives.gov/the-press-office/2016/12/05/letter-president-supplemental-6-month-war-powers-letter.
|
U.S. Armed Forces |
Total Private Security Contractorsa |
U.S. National Private Security Contractors |
Foreign and Host Country National Private Security Contractors |
|
|
Q1 FY2008 |
161,783 |
9,952 |
830 |
9,122 |
|
Q2 FY2008 |
159,700 |
7,259 |
515 |
6,744 |
|
Q3 FY2008 |
153,300 |
7,704 |
1,540 |
6,164 |
|
Q4 FY2008 |
146,900 |
10,446 |
886b |
9,560 |
|
Q1 FY2009 |
148,500 |
9,218 |
727b |
8,436 |
|
Q2 FY2009 |
141,300 |
12,942 |
681 |
12,261 |
|
Q3 FY2009 |
134,500 |
15,279 |
802 |
14,477 |
|
Q4 FY2009 |
129,200 |
12,684 |
670 |
12,014 |
|
Q1 FY2010 |
114,300 |
11,095 |
776 |
10,319 |
|
Q2 FY2010 |
95,900 |
11,610 |
1,081 |
10,529 |
|
Q3 FY2010 |
88,320 |
11,413 |
1,030 |
10,383 |
|
Q4 FY2010 |
48,410 |
11,628 |
1,017 |
10,611 |
|
Q1 FY2011 |
47,305 |
8,327 |
791 |
7,536 |
|
Q2 FY2011 |
45,660 |
9,207 |
917 |
8,290 |
|
Q3 FY2011 |
46,010 |
10,414 |
935 |
9,479 |
|
Q4 FY2011 |
44,755 |
9,554 |
844 |
8,710 |
|
Q1 FY2012 |
11,445 |
8,995 |
751 |
8,244 |
|
Q2 FY2012 |
— |
3,577 |
288 |
3,289 |
|
Q3 FY2012 |
— |
2,407 |
116 |
2,291 |
|
Q4 FY2012 |
— |
2,116 |
102 |
2,014 |
|
Q1 FY2013 |
— |
2,281 |
235 |
2,046 |
|
Q2 FY2013 |
— |
2,359 |
259 |
2,100 |
|
Q3 FY2013 |
— |
2,148 |
217 |
1,931 |
|
Q4 FY2013 |
— |
2,409 |
147 |
2,262 |
Sources: ForceContractor levels drawn from CENTCOM Quarterly Contractor Census Reports; U.S. Armed Forces levels from Q1 FY2008-Q1FY2012 areQ1 FY2012 drawn from the DOD's "Boots on the Ground" monthly reports to Congress. Contractor levels are drawn from CENTCOM Quarterly Contractor Census Reports.
Notes: DOD did not begin releasing data on DOD-funded private security contractor personnel levels in CENTCOM until Q1FY2008Q1 FY2008, and ceased reporting data on DOD-funded private security contractor personnel in Iraq in Q4 FY2013. As of Q1 FY2017Q4 FY2018, CENTCOM has not resumed reporting data on DOD-funded private security personnel in Iraq. See Table 3 for further discussion of recent U.S. troopArmed Forces and contractor levels in Iraq.
a. CENTCOM reported that DOD contractors in Iraq from December 2011 through December 2013 were supporting both U.S. Mission Iraq and the Office of Security Cooperation Iraq.
b. CENTCOM Quarterly Census Reports from Q4 FY2008 and Q1FY2009Q1 FY2009 also included NATO coalition personnel in the reported totals of U.S. private security contractor personnel.
Table 5. DOD Contract Obligations in Iraq and Afghanistan Theaters of Operation
(FY2007-FY2016FY2009-FY2018; in millions of FY2017FY2019 dollars)
Country |
FY2007 |
FY2008 |
FY2009 |
FY2010 |
FY2011 |
FY2012 |
FY2013 |
FY2014 |
FY2015 |
FY2016 |
Total |
|
|
Iraq Theater |
Iraq |
14,685.56 |
17,987.49 |
10,580.81 |
7,878.74 |
5,222.69 |
617.71 |
537.31 |
77.62 |
249.39 |
684.88 |
58,763.86 |
|
Bahrain |
588.93 |
1,333.27 |
2,190.98 |
609.37 |
526.26 |
338.40 |
883.97 |
212.81 |
551.41 |
680.63 |
8,459.93 |
|
|
Kuwait |
4,983.13 |
4,934.01 |
5,821.30 |
5,050.40 |
$3,254 |
2,612.30 |
3,139.88 |
$1,879 |
$2,146 |
1,779.60 |
38,044.20 |
|
|
Qatar |
323.46 |
469.24 |
886.45 |
351.45 |
840.67 |
870.86 |
432.20 |
175.28 |
324.56 |
241.64 |
$5,888 |
|
|
Saudi Arabia |
210.60 |
375.76 |
989.33 |
806.44 |
309.49 |
570.03 |
964.00 |
$1,072 |
2,093.57 |
1,018.00 |
$10,221 |
|
|
Turkey |
375.90 |
193.21 |
311.79 |
143.24 |
185.94 |
286.34 |
191.65 |
184.99 |
203.56 |
242.26 |
$2,205 |
|
|
UAE |
261.33 |
1,326.57 |
305.78 |
2,662.15 |
1,060.54 |
$1,820 |
2,281.36 |
$1,500 |
$1,361 |
$1,408 |
$15,508 |
|
|
Oman |
94.29 |
107.54 |
85.31 |
125.88 |
142.16 |
214.68 |
228.80 |
106.60 |
124.73 |
123.02 |
$1,272 |
|
|
Jordan |
83.85 |
92.30 |
14.81 |
13.77 |
40.01 |
54.17 |
177.08 |
168.23 |
203.89 |
186.71 |
$1,238 |
|
|
Total, Iraq Theater |
$21,933 |
26,819.41 |
21,186.57 |
17,641.43 |
12,311.23 |
7,032.23 |
8,836.25 |
5,732.41 |
6,842.88 |
6,379.14 |
141,248.13 |
|
|
Afghanistan Theater |
Afghanistan |
3,800.69 |
6,893.02 |
8,200.70 |
13,079.75 |
18,149.95 |
19,426.34 |
15,003.74 |
6,176.46 |
$3,212 |
1,999.80 |
99,178.23 |
|
Kazakhstan |
6.06 |
30.07 |
48.07 |
66.29 |
75.27 |
78.52 |
93.56 |
57.51 |
67.42 |
34.80 |
622.88 |
|
|
Kyrgyzstan |
426.99 |
20.29 |
374.47 |
134.14 |
906.81 |
1,988.82 |
2,022.96 |
684.07 |
- |
-6.64 |
$6,315 |
|
|
Pakistan |
74.48 |
234.86 |
253.93 |
179.50 |
65.08 |
17.30 |
-3.65 |
23.91 |
74.88 |
35.08 |
1,027.95 |
|
|
Tajikistan |
0.00 |
0.01 |
1.09 |
3.80 |
3.55 |
8.87 |
9.25 |
7.49 |
6.99 |
0.02 |
47.84 |
|
|
Turkmenistan |
0.45 |
19.30 |
9.24 |
24.21 |
10.45 |
4.44 |
13.97 |
1.48 |
0.15 |
-0.02 |
83.82 |
|
|
Uzbekistan |
13.94 |
16.06 |
9.90 |
22.73 |
16.44 |
23.82 |
19.09 |
22.16 |
32.22 |
10.87 |
218.45 |
|
|
Total, Afghanistan Theater |
4,322.61 |
7,213.62 |
8,897.40 |
13,510.41 |
19,227.54 |
21,548.12 |
17,158.92 |
6,973.07 |
$3,314 |
2,073.91 |
107,620.34 |
|
|
Total, Iraq and Afghanistan Theaters |
25,929.66 |
34,033.03 |
30,083.97 |
31,151.85 |
31,538.77 |
28,580.35 |
25,995.16 |
12,705.47 |
$10,353 |
8,453.05 |
248,868.47 |
|
SourcesSources: Federal Procurement Data System (FPDS), as of February 10, 2017 for FY2007-FY2016January 9, 2018 for FY2009-FY2018 data; CRS adjustments for inflation using deflators for converting into FY2017FY2019 dollars derived from Office of the Under Secretary of Defense (Comptroller), Department of Defense, National Defense Budget Estimates for FY2017FY 2019, "Department of Defense Deflators–TOA By Category 'Total Non-Pay,'" Table 5-5, p. 58-59, March 2016pp. 60-61, April 2018.
Author Contact InformationNoteNotes: Numbers may not add due to rounding. FPDS tracks the net amount of funds obligated or deobligated (i.e., a downward adjustment of reported contract obligations) by a contract transaction. If the net amount of a transaction is a deobligation, the transaction will be represented as a negative amount in FPDS.
: Numbers may not add due to rounding.
Author Contact Information
Footnotes
| 1. |
See 32 C.F.R. 158.3, "Definitions | |||||||
| 2. |
|
|||||||
|
See, for example, U.S. Government Accountability Office, Iraq and Afghanistan: DOD, State and USAID Face Continued Challenges in Tracking Contracts, Assistance Instruments, and Associated Personnel, GAO-11-1, October 1, 2010. For further discussions of efforts to improve DOD contractor management and oversight, see CRS Report R40764, Department of Defense Contractors in Afghanistan and Iraq: Background and Analysis, by Moshe Schwartz and Joyprada Swain. |
||||||||
|
Email correspondence with DOD official, received by CRS on September 7, 2016. |
||||||||
|
| ||||||||
| 6. |
|
|||||||
|
Established force management levels may be adjusted in response to operational needs or changing circumstances within a country or region, such as the Obama Administration's decision in July 2016 to maintain approximately 8,400 troops in Afghanistan through January 2017. See White House Office of the Press Secretary, "Statement by the President on Afghanistan," July 6, 2016, available at https://obamawhitehouse.archives.gov/the-press-office/2016/07/06/statement-president-afghanistan. |
||||||||
|
See |
||||||||
| 9. | See U.S. Department of Defense, Press Operations, "Department of Defense Afghanistan Force Management Level Accounting and Reporting Practices Briefing by Pentagon Chief Spokesperson White and Joint Staff Director Lieutenant General McKenzie in the Pentagon Briefing Room," transcript, August 30, 2017. CRS October 26, 2018 correspondence with DOD officials; David Welna, "Pentagon Questioned over Blackout on War Zone Troop Numbers," NPR, July 3, 2018; and Tara Copp, "Pentagon strips Iraq, Afghanistan, Syria troop numbers from web," Military Times, April 9, 2018. |
|||||||
|
U.S. Congress, Senate Committee on Armed Services, Situation in Afghanistan, 115th Cong., 1st sess., February 9, 2017. This concern was also echoed in a hearing before the House Armed Services Committee's Subcommittee on Oversight and Investigations in December 2016, and in a hearing before the House Armed Services Committee's Subcommittee on Readiness on March 8, 2017. |
||||||||
|
Commission on Wartime Contracting in Iraq and Afghanistan, "Transforming Wartime Contracting: Controlling Costs, Reducing Risks," final report of the Commission to Congress, August 2011, pp. 18-21. Available at https://cybercemetery.unt.edu/archive/cwc/20110929213922/http://www.wartimecontracting.gov/docs/CWC_FinalReport-highres.pdf. |
||||||||
|
See Department of Defense, Contractor Support of U.S. Operations in the USCENTCOM Area of Responsibility | ||||||||
| 14.
|
|
See for example Thomas Gibbons-Neff and Mujib Mashal, "U.S. to Withdraw about 7,000 Troops from Afghanistan, Officials Say," The New York Times, December 20, 2018; Gordon Lubold and Jessica Donati, "Trump Orders Big Troop Reduction in Afghanistan," The Wall Street Journal, December 20, 2018; and Dan Lamothe and Josh Dawsey, "New Plans for Afghanistan Would Have Trump Withdrawing Fewer Troops," The Washington Post, January 8, 2019. 15.
|
|
For further discussion of U.S. operations in Afghanistan under Operation Freedom's Sentinel (OFS), which includes the NATO-led Resolute Support mission, see CRS Report R45122, Afghanistan: Background and U.S. Policy In Brief, by Clayton Thomas. |
See Department of Defense, Contractor Support of U.S. Operations in the USCENTCOM Area of Responsibility Jim Garamone, "Pentagon Announces Troop Levels in Iraq, Syria," Defense Media Activity, December 6, 2017. DOD has not released updated troop levels for Iraq or Syria; observers and analysts have typically referenced the December 2017 figures in subsequent discussions of U.S. Armed Forces levels in Iraq and Syria—see for example Tamer El-Ghobashy, "Trump's Decision on Syria is Worrying Allies in Iraq and Emboldening Opponents," The Washington Post, December 20, 2018 and Dion Nissenbaum, Nancy A. Youssef, and Vivian Salama, "In Shift, Trump Orders U.S. Troops Out of Syria," The Wall Street Journal, December 19, 2018. For further discussion of the U.S. and its coalition partners' efforts to combat the Islamic State in Iraq and Syria under OIR, see CRS Report R43612, The Islamic State and U.S. Policy, by Christopher M. Blanchard and Carla E. Humud. |