Senate Staff Levels, 1977-2022
Changes from September 13, 2016 to October 19, 2020
This page shows textual changes in the document between the two versions indicated in the dates above. Textual matter removed in the later version is indicated with red strikethrough and textual matter added in the later version is indicated with blue.
Contents
- Senate Staffing
- Senate Staff Data Collection
- Senate Staff Data
- Staff in Senators' Offices
- Committees
- Leadership Offices
- Officers and Officials
- Discussion
- Data Tables
Figures
Tables
- Table 1. Senate Staff Levels by Category, 1977-2016
- Table 2. Staff Working in Senators' Offices, 1977-2016
- Table 3. Senate Committee Staff by Committee, 2007-2016
- Table 4. Senate Committee Staff by Committee, 1997-2006
- Table 5. Senate Committee Staff by Committee, 1987-1996
- Table 6. Senate Committee Staff by Committee, 1977-1986
- Table 7. Staff of Active Joint Committees Listed in the Senate Directories, 1977-2016
Summary
Senate Staff Levels in Member, Committee,
October 19, 2020
Leadership, and Other Offices, 1977-2020
R. Eric Petersen
The manner in which staff are deployed within an organization may reflect the missions
Specialist in American
and priorities of that organization. This report provides staffing levels in Senators' ’
National Government
Senate committee, leadership, and other offices since 1977. From 1977 to 1986, Senate
staff, excluding state-based staff, increased from 3,397 to 4,180, or 23.05%. From 1987 to 2020to 2016, all Senate staff grew from 4,916 to 5,749723, or 16.9442%. The changes in both time
periods were characterized in part by increases in the number of staff working in chamber leadership offices, and, prior to 2016except for apparent declines in 2016-2018, increases in the staffing of chamber officers and officials. Additionally, staff working for MembersSenators have shifted from committees to the personal offices of Members. Since 2010, however, staff working for the Senate has decreased 6.79%personal offices. Some of these changes may be indicative of the growth of the Senate as an institution, or the value the chamber places on its various activities.
This report is one of several CRS products focusing on congressional staff. Others includecan be accessed through CRS Report RL34545R44688, Congressional Staff: CRS Products on Size, Pay, Job Tenure, and Duties, by R. Eric Petersen and Sarah J. Eckman.
Congressional Research Service
link to page 4 link to page 4 link to page 6 link to page 7 link to page 7 link to page 7 link to page 7 link to page 8 link to page 8 link to page 9 link to page 6 link to page 9 link to page 10 link to page 11 link to page 12 link to page 13 link to page 14 link to page 15 link to page 16 link to page 16 Senate Staff Levels in Member, Committee, Leadership, and Other Offices, 1977-2020
Contents
Senate Staffing................................................................................................................................. 1
Senate Staff Data Collection ..................................................................................................... 1 Senate Staff Data ....................................................................................................................... 3
Staff in Senators’ Offices .................................................................................................... 4 Committees ......................................................................................................................... 4 Leadership Offices .............................................................................................................. 4 Officers and Officials .......................................................................................................... 4 Presiding Officers ............................................................................................................... 5
Discussion ....................................................................................................................................... 5 Data Tables ...................................................................................................................................... 6
Figures Figure 1. Senate Staff Levels by Category, 1977-2020 ................................................................... 3
Tables Table 1. Senate Staff Levels by Category, 1977-2020 ..................................................................... 6 Table 2. Staff Working in Senators’ Offices, 1977-2020 ................................................................. 7 Table 3. Senate Committee Staff by Committee, 2017-2020 .......................................................... 8 Table 4. Senate Committee Staff by Committee, 2007-2016 .......................................................... 9 Table 5. Senate Committee Staff by Committee, 1997-2006 ........................................................ 10 Table 6. Senate Committee Staff by Committee, 1987-1996 ......................................................... 11 Table 7. Senate Committee Staff by Committee, 1977-1986 ........................................................ 12 Table 8. Staff of Active Joint Committees Listed in the Senate Directories, 1977-2020 .............. 13
Contacts Author Information ........................................................................................................................ 13
Congressional Research Service
link to page 6 link to page 9 link to page 9 Senate Staff Levels in Member, Committee, Leadership, and Other Offices, 1977-2020
, Congressional Staff: Duties and Functions of Selected Positions, by R. Eric Petersen; CRS Report R43947, House of Representatives Staff Levels in Member, Committee, Leadership, and Other Offices, 1977-2016, by R. Eric Petersen and Amber Hope Wilhelm; CRS Report R44324, Staff Pay Levels for Selected Positions in Senators' Offices, FY2001-FY2015, coordinated by R. Eric Petersen; CRS Report R44323, Staff Pay Levels for Selected Positions in House Member Offices, 2001-2015, coordinated by R. Eric Petersen; CRS Report R44322, Staff Pay Levels for Selected Positions in House Committees, 2001-2015, coordinated by R. Eric Petersen; and CRS Report R44325, Staff Pay Levels for Selected Positions in Senate Committees, FY2001-FY2015, coordinated by R. Eric Petersen.
The manner in which staff are deployed within an organization may reflect the missions and priorities of that organization.
T In Congress, employing authorities hire staff to carry out duties in Member-office,
committee, leadership, and other settings. The extent to which staff in those settings change may lend insight into the Senate'’s work over time. Some of the insights that might be taken from staff levels include
- an understanding of the division of congressional work between Senators working individually through their personal offices, or collectively, through committee activities;
- the relationship between committee leaders and chamber leaders, which could have implications for the development and consideration of legislation, the use of congressional oversight, or deployment of staff; and
- the extent to which specialized chamber administrative operations have grown over time.
This report provides staffing levels in Senators',1’,1 committee, leadership, and other offices since 1977. No Senate publication appears to officially and authoritatively track the actual number of staff working in the chambers by office or entity. Data presented here are based on staff listed by chamber entity (offices of Senators, committees, leaders, officers, officials, and other entities) in Senate telephone directoriesdirectories. Figure 1 displays overall staffing levels in the Senate.
Table 1 in the "“Data Tables" ” section below provides data for all staff listed in chamber directories in the Senate through 2016.2020.2 Joint committee staff data from the Senate for panels that met in the 114th116th Congress (2015-20162019-2020) are provided in Table 7.
8. Senate Staffing
Senate Staff Data Collection
This report provides data Data compiled for this report are based on a count of staff listed in the Senate telephone directories published since 1977.23 Like most sources of data, telephone directory listings have potential benefits and potential drawbacks. Telephone directories were chosen for a number of reasons, including the following:
-
telephone directories published by the Senate are an official source of
information about the institution that are widely available;
-
presumably, the number of directory listings closely approximates the number of
staff working for the Senate;
3 - 4
1 Throughout this report, the terms Member office, personal office, and Senator’s office refer to the office held by a Senator as a consequence of election or appointment to the Senate. They do not refer to the number of facilities in which that work is carried out. Discussions of how many staff are based in Washington, DC, and state facilities distinguish only between locations in Washington, DC, or in the state. It does not provide an office-by-office accounting of staff working in multiple state facilities.
2 The Senate did not publish a directory in 2019. 3 Senate directories listed some Washington, DC-based staff assigned to specific entities (e.g., Member, committee, and other offices) in 1958. The Senate did not publish a directory in 2019. The House first published a directory with detailed staff listings by entity in 1977.
4 The actual moment is the deadline that was set for the final collection of listings prior to publication. The exact date
Congressional Research Service
1
Senate Staff Levels in Member, Committee, Leadership, and Other Offices, 1977-2020
while arguably not their intended purpose, the directories provide a consistent
while arguably not their intended purpose, the directories provide a consistentbreakdown of Senate staff by internal organization at a particular moment in time; and -
the directories afford the opportunity to compare staff levels at similar moments
across a period of decades.
4
5 At the same time, however, data presented below should be interpreted with care for a number of reasons, including the following:
-
There is no way to determine whether all staff working for the Senate are listed in
the chambers
'’ telephone directories.5If some staff are not listed, relying on telephone directories is likely to lead to an undercount of staff. In particular, staff Staff working in Senators'’ state offices were not listed until 1987. This likely led to an undercount of staff, and makes comparisons pre-1987 and post-1987 difficult.- It is not possible to determine if staff who are listed were actually employed by the Senate at the time the directories were published. If the directories list individuals who are no longer employed by the Senate, then relying on them is likely to lead to an overcount of staff.
-
The extent to which the
criterioncriteria for inclusion in the directories for the Senate has changed over time cannot be fully determined. Some editions of the directory do not always list staff in various entities the same way.66 This may raise questions regarding the reliability of telephone directory data as a means for identifying congressional staff levels within the Senate over time. -
Some Senate staff may have more than one telephone number, or be listed in the
directory under more than one entity.
77 As a consequence, they might be counted more than once. This could lead to a more accurate count of staff in specific entities within the Senate, but multiple listings may also lead to an overcount of staff working in the chamber. -
Chamber directories may reflect different organizational arrangements over time
for some entities. This could lead to counting staff doing similar work in both years in different categories,
or in different offices.
Senate Staff Data
It appears that the Senate telephone directories started listing Senate staff working in Senators' state offices in 1987. Given the lack of consistent staff data from Senators' or in different offices.
for each year is not known, but the publication date for Senate directories was generally in the spring of each year.
5 Other congressional documents list staff by organizational unit, most notably the quarterly Statement of Disbursements issued by the House, and the semiannual Report of the Secretary of the Senate, issued by the Senate. At the same time, because they capture all paid staff activity for a three-month (House Statements) or six-month (Senate Reports) period, those documents do not provide as clear a picture of staffing at one point in time as the telephone directories.
6 In some instances, a listing for a Senate entity would not list staff. In other instances, there were significant changes in the number of staff from year-to-year. Finally, some editions of the directory would list the same staff under different directory headings. It could not be determined whether these differences were a consequence of changing organizational practices, or differences in the manner in which staff were included in the directory.
7 For example, some congressional staff may work on a part-time basis for more than one Member, or for a Member and a committee. In limited instances (some commissions and joint committees), it is possible that some staff are listed in both House and Senate directories.
Congressional Research Service
2
link to page 6 link to page 9 link to page 9
Senate Staff Levels in Member, Committee, Leadership, and Other Offices, 1977-2020
Senate Staff Data It appears that the Senate telephone directories started listing Senate staff working in Senators’ state offices in 1987. Given the lack of consistent staff data from Senators’ offices prior to 1987, comparisons between data from those offices from 1977-1986 and 1987-20162020, as well as any analysis of total staffing levels in the Senate before 1987, would be incomplete. Staff levels from committees, leadership, and officers and officials, however, can be evaluated across the entire 1977-20162020 time period. Additionally, analysisAnalysis of total staffing levels, as well as staff distribution, since 1987 is discussed below.
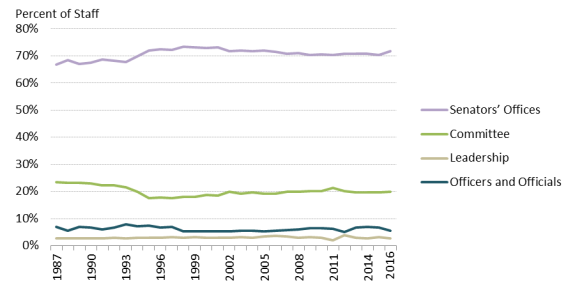
In the Senate, the number of staff has grown steadily, from 4,916 in 1987 to 5,749 in 2016723 in 2020, or 16.4216.94%. Each year since 1987, the number of Senate staff has grown by an average of 29 individuals,8 or 0.5825 individuals,8 or 0.53%. From 1977 to 1986, excluding congressional staff from state offices, the number of staff in the Senate has growngrew steadily from 3,397 in 1977 to 4,180 in 1986, or 23.05%. Figure 1 displays staff levels in six categories (Senators' DC offices, Senators' state offices, total staff in Senators' offices, committees, leadership, and officers and officials) since 1977. Figure 2 provides the distributions among categories of offices from 1987 to 2016.
’ staff, including Washington, DC- and state-based staff, committees, leadership, and officers and officials) since 1977.
Table 1 in the "“Data Tables" ” section, below, provides detailed staff levels in those categories.
Figure 1. Senate Staff Levels by Category, 1977- |
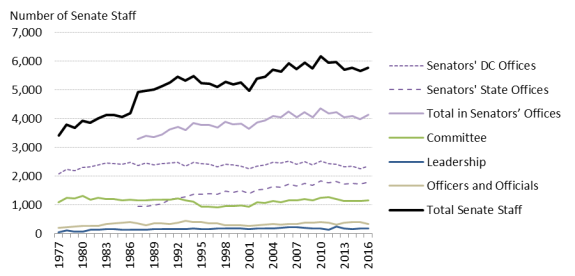 |
2020 Source: Senate telephone directories, CRS calculations. Notes: All categories are based on a |
Staff in Senators' Offices
Staff in Senators' Data exclude Senate staff working for the President of the Senate and the President Pro Tempore. The Senate did not publish a directory in 2019.
8 Rounded to reflect a whole number.
Congressional Research Service
3
link to page 10 link to page 9 link to page 9 link to page 11 link to page 12 link to page 13 link to page 14 link to page 15 link to page 9 Senate Staff Levels in Member, Committee, Leadership, and Other Offices, 1977-2020
Staff in Senators’ Offices
Staff in Senators’ offices grew from 2,068 in 1977 to 2,474 in 1986, or 19.63%. Due to the addition of staff data in Senators' state offices, ’ state offices to the telephone directories beginning in 1987, comparisons of total staff before 1986 to after are not possible. But, but staff in Senators'’ Washington, DC, offices continued to grow. In 20162020, there were 2,342402 staff in Senators'’ DC offices, an increase of 13.2516.15% from the 1977 level, 2,068. Staff in Senators'’ offices, including state-based staff, have grown from 3,286 in 1987 to 4,120 in 2016, or 25.38094 in 2020, or 24.59%. Senators'’ office staffs have grown as a proportion of overall Senate staff over time. In 1987, Member-office staff comprised 66.84% of Senate staff. The average proportion between 1987 and 2020 is 70.73%.
Senate staff. The proportion grew to 67.51% in 1990, and 72.96% in 2000, before dropping slightly to 71.66% in 2016.
Most of the growth in Senators'’ staffs since 1987 appears to have been among state-based staff, which nearly doubled in size from 935 in 1987 to 1,778 in 2016692 in 2020. More staff work in Washington, DC, offices than in state offices, but the percentage of Senators'’ staff based in states has grown steadily since 1987, while the number of staff in Senators'’ Washington, DC, offices has remained relatively flat. In 2016, 56.842020, 58.67% of staff listed in the Senate telephone directory as working in Senators'Senators’ offices did so in Washington, DC, down from a high of 72.18% in 1988. Table 2 in the "“Data Tables" ” section below provides the number of staff working in Senators'’ offices in Washington, DC, and state offices.
Committees
Committees
Senate committee staff levels have shown the smallest change among Senate staff categories, increasing from 1,084 in 1977 to 1,153 in 2016, or 6.37099 in 2020, or 1.38%. Change among Senate committee staff may be characterized in threefive stages: an increase during 1977-1980 (20.57%); a period of decline in 1980-1999 (-27.93%); and a period of growth from 1999 to 2016 (22.40%).
Between 1987 and 20162011 (33.97%); a decline in 2011-2013 (-11.57%); followed by flat growth 2014-2020 (-0.03%).
Between 1987 and 2020, committee staff comprised a decreasing proportion of Senate staff, falling from a peak of 23.39% of Senate staff in 1987 to a low of 17.49% of staff in 1995. The proportion of Senate committee staff grew to 20.06% in 201619.20% in 2020, still below its 1987 peak.
In the "“Data Tables" ” section below, threefive tables provide staff levels in various Senate committees. Table 3 Data for 2017-2020 are available in Table 3; Table 4 provides data for 2007-2016; data for 1997-2006 are available inin Table 4,5; Table 5 6 provides data for 1987-1996,; and data for 1977-1986 are inin Table 6.7. Totals for each year, which include Senate joint committee staff found in Table 78, are provided inin Table 1.
Leadership Offices
The number of staff in Senate leadership offices grew from 44 in 1977 to 160 in 2016143 in 2020. The majority of the growth in leadership staff occurred between 1977 and 1981, from 44 to 119, or 170.45%. The number of leadership staff peaked in 2012 at 234. As a proportion of Senate staff, leadership employees were 2.69% in 1987 and 2.7850% in 2020.
% in 2016.
Officers and Officials
Staff working in the offices of Senate officers and officials has grown 57.21increased 89.56% since 1977. Staff levels have grown from 201 in 1977 to 316 in 2016381 in 2020, but were characterized by sharp decreases in 1988, from 1998-2001, in 2012, and in 2016.
2016. Increases were observed in 2013, 2018, and 2020.
Congressional Research Service
4
Senate Staff Levels in Member, Committee, Leadership, and Other Offices, 1977-2020
Despite the growth, Senate officers and officials'’ staff decreased as a proportion of Senate staff, falling from 7.08% in 1987 to a low of 5.21% in 2012. In 20162020, the proportion of officers and officials'officials’ staff was 6.66%.
Presiding Officers
The smallest category of staff includes those working in the Senate for the President of the Senate and the President Pro Tempore. Staff in those offices ranged from a high of 14 in 1981 to a low of three in 2013 and 2014. The average number of staff in the Senate offices of presiding officers between 1977 and 2020 is nine.
Discussion staff was 5.50%.
|
 |
|
Source: Senate telephone directories, CRS calculations. Notes: All categories are based on a full count of directory listings. |
Discussion
Since 1987, the number of staff working for the Senate has grown. There have been increases in the number of staff working in Senate leadership offices, and larger increases in the staffing of officers and officials through 2015, though 2016 saw a dip in those numbers. Staff working for Senators have shifted from committee settings to leadership settings or the personal offices. Some of these changes may be indicative of the growth of the Senate as an institution, or the value the chamber places on its various activities.
One example that may be an indication of institutional development arguably is found in the growth of the number of staff working in leadership and officers and officials'’ offices. A potential explanation for these changes may be found in what some might characterize as an ongoing professionalization and institutionalization of congressional management and administration. Some note that as organizations such as governing institutions develop, they identify needs for expertise and develop specialized practices and processes.99 In Congress, some of those areas of specialization arguably include supporting the legislative process through the drafting of measures, oversight and support of floor activities, and the management of legislation in a bicameral, partisan environment. Another potential explanation related to a more institutionalized, professionalized Congress could be the demands for professional management and support. This could arise as a result of congressional use of communications technologies, and the deployment of systematic, professionalized human resources processes, business operations, and financial management. Consequently, increased specialized support of congressional legislative and administrative activities may explain increases among staff working for chamber leaders, and officers and officials.
In another example, the distribution of staff working directly for Senators has shifted from committee settings to personal office settings. Staff in Member offices has grown while staff in Senate committees has decreased, both in real numbers and in percentage of total staff. This may represent a shift from collective congressional activities typically carried out in committees (including legislative, oversight, and investigative work) to individualized activities typically carried out in Senators'’ personal offices (including direct representational activities, constituent service and education, and political activity).10
9 See, for example, Nelson W. Polsby, “The Institutionalization of the U.S. House of Representatives,” The American Political Science Review, vol. 62, no. 1 (March 1968), pp. 144-168.
10 See Robert H. Salisbury and Kenneth A. Shepsle, “U.S. Congressman as Enterprise,” Legislative Studies Quarterly, vol. 6, no. 4 (November 1981), pp. 559-576; CRS Report RL33686, Roles and Duties of a Member of Congress: Brief Overview, by R. Eric Petersen; CRS Report RL34035, Grants Work in a Congressional Office, by Maria Kreiser; CRS Report RL33209, Casework in a Congressional Office: Background, Rules, Laws, and Resources, by R. Eric Petersen and Sarah J. Eckman; and CRS Report RL33213, Congressional Nominations to U.S. Service Academies: An Overview and Resources for Outreach and Management, by R. Eric Petersen and Sarah J. Eckman.
Congressional Research Service
5
Data Tables
Table 1. Senate Staff Levels by Category, 1977-2020
Year
1977
1978
1979
1980
1981
1982
1983
1984
1985
1986
1987
Senators’ Offices
2,068
2,215
2,173
2,296
2,308
2,385
2,454
2,430
2,409
2,474
3,286
Committee
1,084
1,244
1,209
1,307
1,161
1,228
1,200
1,191
1,137
1,177
1,150
Leadership
44
103
55
49
119
132
136
138
121
131
132
Officers and Officials
201
213
230
261
253
264
327
354
376
398
348
Totals
3,397
3,775
3,667
3,913
3,841
4,009
4,117
4,113
4,043
4,180
4,916
Year
1988
1989
1990
1991
1992
1993
1994
1995
1996
1997
1998
Senators’ Offices
3,393
3,354
3,445
3,612
3,707
3,593
3,826
3,771
3,773
3,678
3,876
Committee
1,147
1,167
1,174
1,176
1,216
1,141
1094
915
929
899
955
Leadership
133
138
144
146
156
147
163
157
156
166
162
Officers and Officials
276
350
340
321
362
425
393
388
353
353
280
Totals
4,949
5,009
5,103
5,255
5,441
5,306
5,476
5,231
5,211
5,096
5,273
Year
1999
2000
2001
2002
2003
2004
2005
2006
2007
2008
2009
Senators’ Offices
3,801
3,823
3,639
3,855
3,915
4,091
4,047
4,232
4,044
4,221
4,029
Committee
942
979
915
1,071
1,047
1,126
1,078
1,146
1,147
1,182
1,153
Leadership
166
159
154
166
176
167
193
220
204
182
175
Officers and Officials
282
279
260
282
309
315
297
325
326
361
372
Totals
5,191
5,240
4,968
5,374
5,447
5,699
5,615
5,923
5721
5946
5732
Year
2010
2011
2012
2013
2014
2015
2016
2017
2018
2019
2020
Senators’ Offices
4,346
4,180
4,219
4,037
4,071
3,965
4,120
4,035
4,112
–
4,094
Committee
1,246
1,262
1,200
1,116
1,131
1,114
1,153
1,110
1,137
–
1,099
Leadership
180
126
234
164
158
177
160
173
172
–
143
Officers and Officials
396
372
311
379
398
381
316
315
357
–
381
Totals
6168
5,940
5,964
5,696
5,758
5,637
5,749
5,633
5,778
–
5,717
service and education, and political activity).10
Data Tables
|
Year |
1977 |
1978 |
1979 |
1980 |
1981 |
1982 |
1983 |
1984 |
1985 |
1986 |
|
Senators' Offices |
2,068 |
2,215 |
2,173 |
2,296 |
2,308 |
2,385 |
2,454 |
2,430 |
2,409 |
2,474 |
|
Committee |
1,084 |
1,244 |
1,209 |
1,307 |
1,161 |
1,228 |
1,200 |
1,191 |
1,137 |
1,177 |
|
Leadership |
44 |
103 |
55 |
49 |
119 |
132 |
136 |
138 |
121 |
131 |
|
Officers and Officials |
201 |
213 |
230 |
261 |
253 |
264 |
327 |
354 |
376 |
398 |
|
Totals |
3,397 |
3,775 |
3,667 |
3,913 |
3,841 |
4,009 |
4,117 |
4,113 |
4,043 |
4,180 |
|
Year |
1987 |
1988 |
1989 |
1990 |
1991 |
1992 |
1993 |
1994 |
1995 |
1996 |
|
Senators' Offices |
3,286 |
3,393 |
3,354 |
3,445 |
3,612 |
3,707 |
3,593 |
3,826 |
3,771 |
3,773 |
|
Committee |
1,150 |
1,147 |
1,167 |
1,174 |
1,176 |
1,216 |
1,141 |
1094 |
915 |
929 |
|
Leadership |
132 |
133 |
138 |
144 |
146 |
156 |
147 |
163 |
157 |
156 |
|
Officers and Officials |
348 |
276 |
350 |
340 |
321 |
362 |
425 |
393 |
388 |
353 |
|
Totals |
4,916 |
4,949 |
5,009 |
5,103 |
5,255 |
5,441 |
5,306 |
5,476 |
5,231 |
5,211 |
|
Year |
1997 |
1998 |
1999 |
2000 |
2001 |
2002 |
2003 |
2004 |
2005 |
2006 |
|
Senators' Offices |
3,678 |
3,876 |
3,801 |
3,823 |
3,639 |
3,855 |
3,915 |
4,091 |
4,047 |
4,232 |
|
Committee |
899 |
955 |
942 |
979 |
915 |
1,071 |
1,047 |
1,126 |
1,078 |
1,146 |
|
Leadership |
166 |
162 |
166 |
159 |
154 |
166 |
176 |
167 |
193 |
220 |
|
Officers and Officials |
353 |
280 |
282 |
279 |
260 |
282 |
309 |
315 |
297 |
325 |
|
Totals |
5,096 |
5,273 |
5,191 |
5,240 |
4,968 |
5,374 |
5,447 |
5,699 |
5,615 |
5,923 |
|
Year |
2007 |
2008 |
2009 |
2010 |
2011 |
2012 |
2013 |
2014 |
2015 |
2016 |
|
Senators' Offices |
4,044 |
4,221 |
4,029 |
4,346 |
4,180 |
4,219 |
4,037 |
4,071 |
3,965 |
4,120 |
|
Committee |
1,147 |
1,182 |
1,153 |
1,246 |
1,262 |
1,200 |
1,116 |
1,131 |
1,114 |
1,153 |
|
Leadership |
204 |
182 |
175 |
180 |
126 |
234 |
164 |
158 |
177 |
160 |
|
Officers and Officials |
326 |
361 |
372 |
396 |
372 |
311 |
379 |
398 |
381 |
316 |
|
Totals |
5721 |
5946 |
5732 |
6168 |
5,940 |
5,964 |
5,696 |
5,758 |
5.637 |
5,749 |
Source: Senate telephone directories, CRS calculations.
Source: Senate telephone directories, CRS calculations. Notes: All categories are based on a full ful count of directory listings. Senate telephone directories published in 1981, 1996, 2009, and 2013 provided listings for 99 Senators' officesSenators’ offices. Data exclude Senate staff working for the President of the Senate and the President Pro Tempore. The average number of Senate in those offices
between 1977 and 2020 is nine. The Senate did not publish a directory in 2019. Before 1987, the Senate directories did not list congressional staff in Senators'’ state offices. Therefore, the staffing levels for "Senators' Offices",“Senators’ Offices,” as well as the "Totals"“Totals” from 1977 to 1986, do not reflect the same data as the years 1987 to 2016.
2020.
CRS-6
Senate Staff Levels in Member, Committee, Leadership, and Other Offices, 1977-2020
Table 2. Staff Working in Senators'’ Offices, 1977-2020
Year
DC Staff
State Staff
All Member Staff
DC %
State %
1977
2,068
1978
2,215
1979
2,173
1980
2,296
1981
2,308
1982
2,385
1983
2,454
1984
2,430
1985
2,409
1986
2,474
1987
2,351
935
3,286
71.55%
28.45%
1988
2,449
944
3,393
72.18%
27.82%
1989
2,381
973
3,354
70.99%
29.01%
1990
2,430
1,015
3,445
70.54%
29.46%
1991
2,439
1,173
3,612
67.52%
32.48%
1992
2,473
1,234
3,707
66.71%
33.29%
1993
2,332
1,261
3,593
64.90%
35.10%
1994
2,474
1,352
3,826
64.66%
35.34%
1995
2,422
1,349
3,771
64.23%
35.77%
1996
2,397
1,376
3,773
63.53%
36.47%
1997
2,318
1,360
3,678
63.02%
36.98%
1998
2,407
1,469
3,876
62.10%
37.90%
1999
2,375
1,426
3,801
62.48%
37.52%
2000
2,329
1,494
3,823
60.92%
39.08%
2001
2,258
1,381
3,639
62.05%
37.95%
2002
2,334
1,521
3,855
60.54%
39.46%
2003
2,378
1,537
3,915
60.74%
39.26%
2004
2,474
1,617
4,091
60.47%
39.53%
2005
2,436
1,611
4,047
60.19%
39.81%
2006
2,521
1,711
4,232
59.57%
40.43%
2007
2,394
1,650
4,044
59.20%
40.80%
2008
2,496
1,725
4,221
59.13%
40.87%
2009
2,370
1,659
4,029
58.82%
41.18%
2010
2,513
1,833
4,346
57.82%
42.18%
2011
2,417
1,763
4,180
57.82%
42.18%
2012
2,409
1,810
4,219
57.10%
42.90%
2013
2,321
1,716
4,037
57.49%
42.51%
2014
2,340
1,731
4,071
57.48%
42.52%
2015
2,257
1,708
3,965
56.92%
43.08%
2016
2,342
1,778
4,120
56.84%
43.16%
2017
2,347
1,688
4,035
58.17%
41.83%
2018
2,395
1,717
4,112
58.24%
41.76%
2019
–
–
–
–
–
2020
2,402
1,692
4,094
58.67%
41.33%
Offices, 1977-2016
|
Year |
|
|
|
DC % |
State % |
|
1977 |
2,068 |
||||
|
1978 |
2,215 |
||||
|
1979 |
2,173 |
||||
|
1980 |
2,296 |
||||
|
1981 |
2,308 |
||||
|
1982 |
2,385 |
||||
|
1983 |
2,454 |
||||
|
1984 |
2,430 |
||||
|
1985 |
2,409 |
||||
|
1986 |
2,474 |
||||
|
1987 |
2,351 |
935 |
3,286 |
71.55% |
28.45% |
|
1988 |
2,449 |
944 |
3,393 |
72.18% |
27.82% |
|
1989 |
2,381 |
973 |
3,354 |
70.99% |
29.01% |
|
1990 |
2,430 |
1,015 |
3,445 |
70.54% |
29.46% |
|
1991 |
2,439 |
1,173 |
3,612 |
67.52% |
32.48% |
|
1992 |
2,473 |
1,234 |
3,707 |
66.71% |
33.29% |
|
1993 |
2,332 |
1,261 |
3,593 |
64.90% |
35.10% |
|
1994 |
2,474 |
1,352 |
3,826 |
64.66% |
35.34% |
|
1995 |
2,422 |
1,349 |
3,771 |
64.23% |
35.77% |
|
1996 |
2,397 |
1,376 |
3,773 |
63.53% |
36.47% |
|
1997 |
2,318 |
1,360 |
3,678 |
63.02% |
36.98% |
|
1998 |
2,407 |
1,469 |
3,876 |
62.10% |
37.90% |
|
1999 |
2,375 |
1,426 |
3,801 |
62.48% |
37.52% |
|
2000 |
2,329 |
1,494 |
3,823 |
60.92% |
39.08% |
|
2001 |
2,258 |
1,381 |
3,639 |
62.05% |
37.95% |
|
2002 |
2,334 |
1,521 |
3,855 |
60.54% |
39.46% |
|
2003 |
2,378 |
1,537 |
3,915 |
60.74% |
39.26% |
|
2004 |
2,474 |
1,617 |
4,091 |
60.47% |
39.53% |
|
2005 |
2,436 |
1,611 |
4,047 |
60.19% |
39.81% |
|
2006 |
2,521 |
1,711 |
4,232 |
59.57% |
40.43% |
|
2007 |
2,394 |
1,650 |
4,044 |
59.20% |
40.80% |
|
2008 |
2,496 |
1,725 |
4,221 |
59.13% |
40.87% |
|
2009 |
2,370 |
1,659 |
4,029 |
58.82% |
41.18% |
|
2010 |
2,513 |
1,833 |
4,346 |
57.82% |
42.18% |
|
2011 |
2,417 |
1,763 |
4,180 |
57.82% |
42.18% |
|
2012 |
2,409 |
1,810 |
4,219 |
57.10% |
42.90% |
|
2013 |
2,321 |
1,716 |
4,037 |
57.49% |
42.51% |
|
2014 |
2,340 |
1,731 |
4,071 |
57.48% |
42.52% |
|
2015 |
2,257 |
1,708 |
3,965 |
56.92% |
43.08% |
|
2016 |
2,342 |
1,778 |
4,120 |
56.84% |
43.16% |
Source: Senate telephone directories, CRS calculations.
Source: Senate telephone directories, CRS calculations. Notes: The Senate telephone directory did not provide listings for state-based staff prior to 1987. Senate telephone directories published in 1981, 1996, 2009, and 2013 provided listings for 99 Senators'’ offices. The Senate did not publish a directory in 2019.
Congressional Research Service
7
Senate Staff Levels in Member, Committee, Leadership, and Other Offices, 1977-2020
Table 3. Senate Committee Staff by Committee, 2017-2020
Committee
2017
2018
2019
2020
Agriculture, Nutrition, and Forestry
33
38
-
37
Appropriations
127
125
-
129
Armed Services
49
47
-
52
Banking, Housing, and Urban Affairs
44
42
-
39
Budget
38
41
-
30
Commerce, Science, and Transportation
47
44
-
73
Energy and Natural Resources
47
41
-
43
Environment and Public Works
42
44
-
46
Finance
75
77
-
73
Foreign Relations
53
56
-
60
Health, Education, Labor, and Pensions
80
87
-
83
Homeland Security and Governmental Affairs
100
101
-
95
Judiciary
113
118
-
110
Rules and Administration
15
17
-
23
Small Business and Entrepreneurship
19
17
-
18
Veterans Affairs
21
22
-
26
Select Ethics
11
15
-
15
Indian Affairs
19
21
-
18
Select Intelligence
39
37
-
36
Select Aging
19
22
-
20
Source: Senate telephone directories. Notes: Committees are listed by names used in the 116th Congress, or most recent year in which the committee existed. The Senate did not publish a directory in 2019. “-”indicates that no staff were listed for that year. In some instances this was because the committee did not exist. In other instances, a directory listing for a panel was identified, but did not list any staff.
Congressional Research Service
8
Senate Staff Levels in Member, Committee, Leadership, and Other Offices, 1977-2020
Table 4. Senate Committee Staff by Committee, 2007-2016
Committee
2007
2008
2009
2010
2011
2012
2013
2014
2015
2016
Agriculture, Nutrition,
30
35
32
43
37
39
33
30
34
33
and Forestry
Appropriations
124
121
116
114
119
113
115
125
127
133
Armed Services
51
53
49
50
49
51
45
48
50
49
Banking, Housing, and
41
46
48
60
51
51
47
54
40
44
Urban Affairs
Budget
50
49
45
54
54
50
62
59
47
39
Commerce, Science, and
69
69
69
65
69
71
62
62
74
71
Transportation
Energy and Natural
42
44
47
52
54
51
54
47
43
50
Resources
Environment and Public
41
40
45
44
45
41
43
39
42
37
Works
Finance
82
83
84
84
87
74
80
78
80
77
Foreign Relations
52
46
47
66
63
62
50
51
55
48
Health, Education, Labor,
77
90
89
91
85
83
77
77
89
93
and Pensions
Homeland Security and
89
100
112
127
123
123
93
122
85
104
Governmental Affairs
Judiciary
143
121
106
120
168
125
108
109
112
121
Rules and Administration
22
22
20
23
23
21
21
21
19
18
Small Business and
25
32
31
29
29
29
26
18
16
25
Entrepreneurship
Veterans Affairs
24
25
26
27
22
21
22
20
18
20
Select Ethics
11
11
15
15
14
12
13
14
18
14
Indian Affairs
16
20
20
21
17
24
14
17
21
21
Select Intelligence
37
43
39
42
45
45
43
38
41
40
Select Aging
23
23
13
20
16
15
16
23
19
22
offices.
|
Committee |
2007 |
2008 |
2009 |
2010 |
2011 |
2012 |
2013 |
2014 |
2015 |
2016 |
|
Agriculture, Nutrition, and Forestry |
30 |
35 |
32 |
43 |
37 |
39 |
33 |
30 |
34 |
33 |
|
Appropriations |
124 |
121 |
116 |
114 |
119 |
113 |
115 |
125 |
127 |
133 |
|
Armed Services |
51 |
53 |
49 |
50 |
49 |
51 |
45 |
48 |
50 |
49 |
|
Banking, Housing, and Urban Affairs |
41 |
46 |
48 |
60 |
51 |
51 |
47 |
54 |
40 |
44 |
|
Budget |
50 |
49 |
45 |
54 |
54 |
50 |
62 |
59 |
47 |
39 |
|
Commerce, Science, and Transportation |
69 |
69 |
69 |
65 |
69 |
71 |
62 |
62 |
74 |
71 |
|
Energy and Natural Resources |
42 |
44 |
47 |
52 |
54 |
51 |
54 |
47 |
43 |
50 |
|
Environment and Public Works |
41 |
40 |
45 |
44 |
45 |
41 |
43 |
39 |
42 |
37 |
|
Finance |
82 |
83 |
84 |
84 |
87 |
74 |
80 |
78 |
80 |
77 |
|
Foreign Relations |
52 |
46 |
47 |
66 |
63 |
62 |
50 |
51 |
55 |
48 |
|
Health, Education, Labor, and Pensions |
77 |
90 |
89 |
91 |
85 |
83 |
77 |
77 |
89 |
93 |
|
Homeland Security and Governmental Affairs |
89 |
100 |
112 |
127 |
123 |
123 |
93 |
122 |
85 |
104 |
|
Judiciary |
143 |
121 |
106 |
120 |
168 |
125 |
108 |
109 |
112 |
121 |
|
Rules and Administration |
22 |
22 |
20 |
23 |
23 |
21 |
21 |
21 |
19 |
18 |
|
Small Business and Entrepreneurship |
25 |
32 |
31 |
29 |
29 |
29 |
26 |
18 |
16 |
25 |
|
Veterans Affairs |
24 |
25 |
26 |
27 |
22 |
21 |
22 |
20 |
18 |
20 |
|
Select Ethics |
11 |
11 |
15 |
15 |
14 |
12 |
13 |
14 |
18 |
14 |
|
Indian Affairs |
16 |
20 |
20 |
21 |
17 |
24 |
14 |
17 |
21 |
21 |
|
Select Intelligence |
37 |
43 |
39 |
42 |
45 |
45 |
43 |
38 |
41 |
40 |
|
Select Aging |
23 |
23 |
13 |
20 |
16 |
15 |
16 |
23 |
19 |
22 |
Source: Senate telephone directories.
Source: Senate telephone directories. Notes: Committees are listed by names used in the 114th116th Congress, or most recent year in which the committee existed.
Congressional Research Service
9
Senate Staff Levels in Member, Committee, Leadership, and Other Offices, 1977-2020
Table 5committee existed. "-"indicates that no staff were listed for that year. In some instances this was because the committee did not exist. In other instances, a directory listing for a panel was identified, but did not list any staff.
|
Committee |
1997 |
1998 |
1999 |
2000 |
2001 |
2002 |
2003 |
2004 |
2005 |
2006 |
|
Agriculture, Nutrition, and Forestry |
26 |
27 |
23 |
27 |
22 |
32 |
27 |
33 |
22 |
29 |
|
Appropriations |
63 |
61 |
87 |
89 |
102 |
90 |
101 |
118 |
120 |
118 |
|
Armed Services |
45 |
45 |
43 |
47 |
44 |
51 |
47 |
48 |
46 |
48 |
|
Banking, Housing, and Urban Affairs |
41 |
41 |
44 |
42 |
38 |
60 |
41 |
46 |
47 |
46 |
|
Budget |
44 |
45 |
44 |
48 |
46 |
52 |
50 |
49 |
47 |
49 |
|
Commerce, Science, and Transportation |
54 |
58 |
51 |
56 |
48 |
59 |
72 |
69 |
64 |
68 |
|
Energy and Natural Resources |
40 |
38 |
37 |
40 |
38 |
43 |
42 |
42 |
46 |
43 |
|
Environment and Public Works |
34 |
36 |
36 |
43 |
33 |
49 |
53 |
56 |
51 |
50 |
|
Finance |
45 |
52 |
52 |
46 |
52 |
56 |
60 |
62 |
53 |
63 |
|
Foreign Relations |
48 |
51 |
49 |
54 |
55 |
54 |
49 |
56 |
57 |
53 |
|
Health, Education, Labor, and Pensions |
76 |
85 |
98 |
86 |
76 |
72 |
74 |
90 |
95 |
92 |
|
Homeland Security and Governmental Affairs |
78 |
76 |
65 |
85 |
74 |
92 |
82 |
86 |
71 |
109 |
|
Judiciary |
85 |
93 |
84 |
98 |
82 |
112 |
115 |
129 |
127 |
137 |
|
Rules and Administration |
21 |
19 |
15 |
16 |
16 |
18 |
16 |
16 |
19 |
18 |
|
Small Business and Entrepreneurship |
19 |
17 |
18 |
20 |
22 |
29 |
21 |
22 |
24 |
28 |
|
Veterans Affairs |
21 |
38 |
19 |
16 |
18 |
19 |
20 |
17 |
22 |
23 |
|
Select Ethics |
8 |
11 |
10 |
11 |
11 |
11 |
9 |
9 |
10 |
10 |
|
Indian Affairs |
18 |
15 |
16 |
20 |
18 |
21 |
19 |
18 |
16 |
11 |
|
Select Intelligence |
27 |
34 |
33 |
29 |
31 |
32 |
30 |
34 |
28 |
42 |
|
Select Aging |
18 |
20 |
18 |
17 |
10 |
25 |
20 |
19 |
12 |
15 |
|
Select Year 2000 Technology Problem |
- |
- |
15 |
- |
- |
- |
- |
- |
- |
- |
. Senate Committee Staff by Committee, 1997-2006
Committee
1997
1998
1999
2000
2001
2002
2003
2004
2005
2006
Agriculture, Nutrition, and
26
27
23
27
22
32
27
33
22
29
Forestry
Appropriations
63
61
87
89
102
90
101
118
120
118
Armed Services
45
45
43
47
44
51
47
48
46
48
Banking, Housing, and Urban
41
41
44
42
38
60
41
46
47
46
Affairs
Budget
44
45
44
48
46
52
50
49
47
49
Commerce, Science, and
54
58
51
56
48
59
72
69
64
68
Transportation
Energy and Natural
40
38
37
40
38
43
42
42
46
43
Resources
Environment and Public
34
36
36
43
33
49
53
56
51
50
Works
Finance
45
52
52
46
52
56
60
62
53
63
Foreign Relations
48
51
49
54
55
54
49
56
57
53
Health, Education, Labor,
76
85
98
86
76
72
74
90
95
92
and Pensions
Homeland Security and
78
76
65
85
74
92
82
86
71
109
Governmental Affairs
Judiciary
85
93
84
98
82
112
115
129
127
137
Rules and Administration
21
19
15
16
16
18
16
16
19
18
Small Business and
19
17
18
20
22
29
21
22
24
28
Entrepreneurship
Veterans Affairs
21
38
19
16
18
19
20
17
22
23
Select Ethics
8
11
10
11
11
11
9
9
10
10
Indian Affairs
18
15
16
20
18
21
19
18
16
11
Select Intelligence
27
34
33
29
31
32
30
34
28
42
Select Aging
18
20
18
17
10
25
20
19
12
15
Select Year 2000 Technology
-
-
15
-
-
-
-
-
-
-
Problem
Source: Senate telephone directories. Source: Senate telephone directories.
Notes: Committees are listed by names used in the 114th116th Congress, or most recent year in which the committee existed. "-"“-”indicates that no staff were listed for that year. In some instances this was because the committee did not exist. In other instances, a directory listing for a panel was identified, but did not list any staff.
Table 5
Congressional Research Service
10
Senate Staff Levels in Member, Committee, Leadership, and Other Offices, 1977-2020
Table 6. Senate Committee Staff by Committee, 1987-1996
Committee
1987
1988
1989
1990
1991
1992
1993
1994
1995
1996
Agriculture, Nutrition, and
30
35
38
45
40
36
36
35
31
31
Forestry
Appropriations
78
78
84
80
79
81
78
72
71
61
Armed Services
46
49
49
49
50
48
47
49
43
43
Banking, Housing, and
34
31
44
49
50
51
49
48
40
42
Urban Affairs
Budget
61
61
54
58
58
55
56
52
46
39
Commerce, Science, and
76
75
72
70
70
72
73
67
59
61
Transportation
Energy and Natural
44
46
48
50
50
51
49
48
42
44
Resources
Environment and Public
46
47
48
50
47
47
37
39
37
37
Works
Finance
54
54
54
54
58
57
49
49
47
53
Foreign Relations
54
57
57
51
69
67
66
58
47
51
Health, Education, Labor,
95
107
104
102
106
102
93
108
81
79
and Pensions
Homeland Security and
88
92
97
92
93
96
96
86
61
63
Governmental Affairs
Judiciary
101
100
98
111
105
119
106
106
86
93
Rules and Administration
29
27
27
28
27
28
27
25
18
18
Small Business and
22
20
21
22
21
21
19
22
19
20
Entrepreneurship
Veterans Affairs
25
26
25
26
24
26
21
21
18
17
Select Ethics
9
7
9
11
11
10
11
12
11
9
Indian Affairs
23
41
26
23
22
28
20
20
14
16
Select Intelligence
38
40
41
40
40
41
32
36
24
30
Select Aging
24
26
30
32
33
32
26
23
16
20
Select POW/MIA Affairs
-
-
-
-
-
15
-
-
-
-
Select Impeachment Trials
-
-
2
-
-
-
-
-
-
-
Select Investigations
-
-
20
-
-
-
-
-
-
-
Select Iran-Contra
53
-
-
-
-
-
-
-
-
-
. Senate Committee Staff by Committee, 1987-1996
|
Committee |
1987 |
1988 |
1989 |
1990 |
1991 |
1992 |
1993 |
1994 |
1995 |
1996 |
|
Agriculture, Nutrition, and Forestry |
30 |
35 |
38 |
45 |
40 |
36 |
36 |
35 |
31 |
31 |
|
Appropriations |
78 |
78 |
84 |
80 |
79 |
81 |
78 |
72 |
71 |
61 |
|
Armed Services |
46 |
49 |
49 |
49 |
50 |
48 |
47 |
49 |
43 |
43 |
|
Banking, Housing, and Urban Affairs |
34 |
31 |
44 |
49 |
50 |
51 |
49 |
48 |
40 |
42 |
|
Budget |
61 |
61 |
54 |
58 |
58 |
55 |
56 |
52 |
46 |
39 |
|
Commerce, Science, and Transportation |
76 |
75 |
72 |
70 |
70 |
72 |
73 |
67 |
59 |
61 |
|
Energy and Natural Resources |
44 |
46 |
48 |
50 |
50 |
51 |
49 |
48 |
42 |
44 |
|
Environment and Public Works |
46 |
47 |
48 |
50 |
47 |
47 |
37 |
39 |
37 |
37 |
|
Finance |
54 |
54 |
54 |
54 |
58 |
57 |
49 |
49 |
47 |
53 |
|
Foreign Relations |
54 |
57 |
57 |
51 |
69 |
67 |
66 |
58 |
47 |
51 |
|
Health, Education, Labor, and Pensions |
95 |
107 |
104 |
102 |
106 |
102 |
93 |
108 |
81 |
79 |
|
Homeland Security and Governmental Affairs |
88 |
92 |
97 |
92 |
93 |
96 |
96 |
86 |
61 |
63 |
|
Judiciary |
101 |
100 |
98 |
111 |
105 |
119 |
106 |
106 |
86 |
93 |
|
Rules and Administration |
29 |
27 |
27 |
28 |
27 |
28 |
27 |
25 |
18 |
18 |
|
Small Business and Entrepreneurship |
22 |
20 |
21 |
22 |
21 |
21 |
19 |
22 |
19 |
20 |
|
Veterans Affairs |
25 |
26 |
25 |
26 |
24 |
26 |
21 |
21 |
18 |
17 |
|
Select Ethics |
9 |
7 |
9 |
11 |
11 |
10 |
11 |
12 |
11 |
9 |
|
Indian Affairs |
23 |
41 |
26 |
23 |
22 |
28 |
20 |
20 |
14 |
16 |
|
Select Intelligence |
38 |
40 |
41 |
40 |
40 |
41 |
32 |
36 |
24 |
30 |
|
Select Aging |
24 |
26 |
30 |
32 |
33 |
32 |
26 |
23 |
16 |
20 |
|
Select POW/MIA Affairs |
- |
- |
- |
- |
- |
15 |
- |
- |
- |
- |
|
Select Impeachment Trials |
- |
- |
2 |
- |
- |
- |
- |
- |
- |
- |
|
Select Investigations |
- |
- |
20 |
- |
- |
- |
- |
- |
- |
- |
|
Select Iran-Contra |
53 |
- |
- |
- |
- |
- |
- |
- |
- |
- |
Source: Senate telephone directories.
Source: Senate telephone directories. Notes: Committees are listed by names used in the 114th116th Congress, or most recent year in which the committee existed. "-"“-”indicates that no staff were listed for that year. In some instances this was because the committee did not exist. In other instances, a directory listing for a panel was identified, but did not list any staff.
Table 6
Congressional Research Service
11
Senate Staff Levels in Member, Committee, Leadership, and Other Offices, 1977-2020
Table 7. Senate Committee Staff by Committee, 1977-1986
Committee
1977
1978
1979
1980
1981
1982
1983
1984
1985
1986
Agriculture, Nutrition, and
28
37
30
35
33
34
35
32
33
32
Forestry
Appropriations
69
67
74
89
63
76
81
81
80
82
Armed Services
28
29
27
27
36
34
37
39
42
42
Banking, Housing, and Urban
39
49
43
46
38
39
33
29
29
31
Affairs
Budget
47
79
67
77
63
70
73
74
68
63
Commerce, Science, and
89
91
83
92
77
88
78
78
80
78
Transportation
Energy and Natural Resources
40
51
52
55
49
52
49
51
48
48
Environment and Public
30
33
38
38
52
51
54
51
49
50
Works
Finance
28
34
36
40
45
50
45
53
54
55
Foreign Relations
63
57
55
68
62
62
61
62
60
61
Health, Education, Labor, and
93
122
118
121
118
123
123
112
101
105
Pensions
Homeland Security
108
153
140
156
113
121
120
117
94
99
Governmental Affairs
Judiciary
119
144
139
153
120
135
116
119
121
126
Rules and Administration
27
30
30
31
30
32
29
28
29
28
Small Business and
22
21
23
23
22
23
24
21
22
21
Entrepreneurship
Veterans Affairs
18
19
20
23
20
22
22
20
21
25
Select Ethics
2
9
15
12
17
13
12
10
8
8
Indian Affairs
0
25
26
15
13
14
19
20
19
23
Select Intelligence
40
46
43
46
41
41
41
36
32
47
Select Aging
19
19
19
21
28
28
25
34
25
27
Select Nutrition and Human
14
-
-
-
-
-
-
-
-
-
Needs
Select Senate Committee
5
-
-
-
-
-
-
-
-
-
Systems
Select Transition Staff for
13
-
-
-
-
-
-
-
-
-
Former Postal Workers
. Senate Committee Staff by Committee, 1977-1986
|
Committee |
1977 |
1978 |
1979 |
1980 |
1981 |
1982 |
1983 |
1984 |
1985 |
1986 |
|
Agriculture, Nutrition, and Forestry |
28 |
37 |
30 |
35 |
33 |
34 |
35 |
32 |
33 |
32 |
|
Appropriations |
69 |
67 |
74 |
89 |
63 |
76 |
81 |
81 |
80 |
82 |
|
Armed Services |
28 |
29 |
27 |
27 |
36 |
34 |
37 |
39 |
42 |
42 |
|
Banking, Housing, and Urban Affairs |
39 |
49 |
43 |
46 |
38 |
39 |
33 |
29 |
29 |
31 |
|
Budget |
47 |
79 |
67 |
77 |
63 |
70 |
73 |
74 |
68 |
63 |
|
Commerce, Science, and Transportation |
89 |
91 |
83 |
92 |
77 |
88 |
78 |
78 |
80 |
78 |
|
Energy and Natural Resources |
40 |
51 |
52 |
55 |
49 |
52 |
49 |
51 |
48 |
48 |
|
Environment and Public Works |
30 |
33 |
38 |
38 |
52 |
51 |
54 |
51 |
49 |
50 |
|
Finance |
28 |
34 |
36 |
40 |
45 |
50 |
45 |
53 |
54 |
55 |
|
Foreign Relations |
63 |
57 |
55 |
68 |
62 |
62 |
61 |
62 |
60 |
61 |
|
Health, Education, Labor, and Pensions |
93 |
122 |
118 |
121 |
118 |
123 |
123 |
112 |
101 |
105 |
|
Homeland Security Governmental Affairs |
108 |
153 |
140 |
156 |
113 |
121 |
120 |
117 |
94 |
99 |
|
Judiciary |
119 |
144 |
139 |
153 |
120 |
135 |
116 |
119 |
121 |
126 |
|
Rules and Administration |
27 |
30 |
30 |
31 |
30 |
32 |
29 |
28 |
29 |
28 |
|
Small Business and Entrepreneurship |
22 |
21 |
23 |
23 |
22 |
23 |
24 |
21 |
22 |
21 |
|
Veterans Affairs |
18 |
19 |
20 |
23 |
20 |
22 |
22 |
20 |
21 |
25 |
|
Select Ethics |
2 |
9 |
15 |
12 |
17 |
13 |
12 |
10 |
8 |
8 |
|
Indian Affairs |
0 |
25 |
26 |
15 |
13 |
14 |
19 |
20 |
19 |
23 |
|
Select Intelligence |
40 |
46 |
43 |
46 |
41 |
41 |
41 |
36 |
32 |
47 |
|
Select Aging |
19 |
19 |
19 |
21 |
28 |
28 |
25 |
34 |
25 |
27 |
|
Select Nutrition and Human Needs |
14 |
- |
- |
- |
- |
- |
- |
- |
- |
- |
|
Select Senate Committee Systems |
5 |
- |
- |
- |
- |
- |
- |
- |
- |
- |
|
Select Transition Staff for Former Postal Workers |
13 |
- |
- |
- |
- |
- |
- |
- |
- |
- |
Source: Senate telephone directories.
Source: Senate telephone directories. Notes: Committees are listed by names used in the 114th116th Congress, or most recent year in which the committee existed. "-"“-”indicates that no staff were listed for that year. In some instances this was because the committee did not exist. In other instances, a directory listing for a panel was identified, but did not list any staff.
Table 7
Congressional Research Service
12
Senate Staff Levels in Member, Committee, Leadership, and Other Offices, 1977-2020
Table 8. Staff of Active Joint Committees Listed in the Senate Directories, 1977-2020
Joint Committee 1977 1978 1979 1980 1981 1982 1983 1984 1985 1986 1987
Economic
46
51
53
58
46
43
44
44
40
39
35
Library
-
-
2
2
2
2
3
3
3
3
2
Printing
15
15
16
16
15
16
16
17
17
16
17
Taxation
-
63
60
63
58
59
60
60
62
68
66
Joint Committee 1988 1989 1990 1991 1992 1993 1994 1995 1996 1997 1998
Economic
45
44
43
41
44
45
29
35
32
23
25
Library
2
2
2
2
2
2
2
2
1
-
-
Printing
17
14
16
14
14
17
16
7
8
9
8
Taxation
64
59
70
66
73
73
71
60
61
56
60
Joint Committee 1999 2000 2001 2002 2003 2004 2005 2006 2007 2008 2009
Economic
23
31
21
34
35
36
31
31
35
35
34
Library
-
-
-
-
2
2
2
2
4
4
-
Printing
-
-
1
2
2
4
4
4
4
4
-
Taxation
62
58
57
58
60
65
64
57
55
66
66
Joint Committee 2010 2011 2012 2013 2014 2015 2016 2017 2018 2019 2020 Economic
34
29
37
30
17
21
31
35
35
-
28
Library
-
-
-
-
-
-
-
-
-
-
-
Printing
-
-
-
-
-
-
-
-
-
-
-
Taxation
65
63
62
62
62
63
63
62
61
-
54
. Staff of Active Joint Committees Listed in the Senate Directories, 1977-2016
|
Joint Committee |
1977 |
1978 |
1979 |
1980 |
1981 |
1982 |
1983 |
1984 |
1985 |
1986 |
|
Economic |
46 |
51 |
53 |
58 |
46 |
43 |
44 |
44 |
40 |
39 |
|
Library of Congress |
- |
- |
2 |
2 |
2 |
2 |
3 |
3 |
3 |
3 |
|
Printing |
15 |
15 |
16 |
16 |
15 |
16 |
16 |
17 |
17 |
16 |
|
Taxation |
- |
63 |
60 |
63 |
58 |
59 |
60 |
60 |
62 |
68 |
|
Joint Committee |
1987 |
1988 |
1989 |
1990 |
1991 |
1992 |
1993 |
1994 |
1995 |
1996 |
|
Economic |
35 |
45 |
44 |
43 |
41 |
44 |
45 |
29 |
35 |
32 |
|
Library of Congress |
2 |
2 |
2 |
2 |
2 |
2 |
2 |
2 |
2 |
1 |
|
Printing |
17 |
17 |
14 |
16 |
14 |
14 |
17 |
16 |
7 |
8 |
|
Taxation |
66 |
64 |
59 |
70 |
66 |
73 |
73 |
71 |
60 |
61 |
|
Joint Committee |
1997 |
1998 |
1999 |
2000 |
2001 |
2002 |
2003 |
2004 |
2005 |
2006 |
|
Economic |
23 |
25 |
23 |
31 |
21 |
34 |
35 |
36 |
31 |
31 |
|
Library of Congress |
- |
- |
- |
- |
- |
- |
2 |
2 |
2 |
2 |
|
Printing |
9 |
8 |
- |
- |
1 |
2 |
2 |
4 |
4 |
4 |
|
Taxation |
56 |
60 |
62 |
58 |
57 |
58 |
60 |
65 |
64 |
57 |
|
Joint Committee |
2007 |
2008 |
2009 |
2010 |
2011 |
2012 |
2013 |
2014 |
2015 |
2016 |
|
Economic |
35 |
35 |
34 |
34 |
29 |
37 |
30 |
17 |
21 |
31 |
|
Library of Congress |
4 |
4 |
- |
- |
- |
- |
- |
- |
- |
- |
|
Printing |
4 |
4 |
- |
- |
- |
- |
- |
- |
- |
- |
|
Taxation |
55 |
66 |
66 |
65 |
63 |
62 |
62 |
62 |
63 |
63 |
Source: Senate telephone directories.
Source: Senate telephone directories. Notes: Individual staff members for the joint committees may appear in both the House and the Senate directories, as they are considered neither solely House nor solely Senate staff. TheyIn this table, staff are included where they appear in the Senate directory. Excludes staff listed at various times since 1977 for the Joint committees on Inaugural Ceremonies, Atomic Energy, Defense Production, Internal Revenue Service, and Organization of Congress. Staff data for those panels are available to congressional clients from the authorsauthor upon request. "-"“-”indicates that no staff were listed in the relevant chamber for that year. The Senate did not publish a directory in 2019. In some instances, a directory listing for a panel was identified, but did not list any staff.
Author Contact Information
Acknowledgments
Lara Chausow, former Research Assistant, was a coauthor of this report and collected some of the data provided.
Footnotes
| 1. |
Throughout this report, the terms "Member office," "personal office," and "Senator's office" refer to the office held by a Senator as a consequence of election or appointment to the Senate. They do not refer to the number of facilities in which that work is carried out. Discussions of how many staff are based in Washington, DC, and state facilities distinguish only between locations in Washington, DC, or in the state. It does not provide an office-by-office accounting of staff working in multiple state facilities. |
| 2. |
Senate directories listed some Washington, DC-based staff assigned to specific entities (e.g., Member, committee, and other offices) in 1958. The House first published a directory with detailed staff listings by entity in 1977. |
| 3. |
The actual moment is the deadline that was set for the final collection of listings prior to publication. The exact date for each year is not known, but publication dates for the House and Senate directories were generally in the spring of each year. |
| 4. |
Other congressional documents list staff by organizational unit, most notably the quarterly Statement of Disbursements issued by the House, and the semiannual Report of the Secretary of the Senate, issued by the Senate. At the same time, because they capture all paid staff activity for a three-month (House Statements) or six-month (Senate Reports) period, those documents do not provide as clear a picture of staffing at one point in time as the telephone directories. |
| 5. |
In the Senate telephone directories, for example, state-based staff in Senators' offices were not listed until 1987. This omission is likely to lead to an undercount of Senate staff prior to 1987. |
| 6. |
In some instances, a listing for a Senate entity would not list staff. In other instances, there were significant changes in the number of staff from year-to-year, and it could not be determined whether that was a consequence of changing organizational practices, or differences in the manner in which staff were included in the directory. |
| 7. |
For example, some congressional staff may work on a part-time basis for more than one Member, or for a Member and a committee. In limited instances (some commissions and joint committees), it is possible that some staff are listed in both House and Senate directories. |
| 8. |
Rounded to reflect a whole number. |
| 9. |
See, for example, Nelson W. Polsby, "The Institutionalization of the U.S. House of Representatives," The American Political Science Review, vol. 62, no. 1 (March 1968), pp. 144-168. |
| 10. |
See CRS Report RL33686, Roles and Duties of a Member of Congress: Brief Overview, by R. Eric Petersen; CRS Report RL34035, Grants Work in a Congressional Office, by Julie Jennings and Maria A. Kreiser and CRS Report RL33209, Casework in a Congressional Office: Background, Rules, Laws, and Resources, by R. Eric Petersen. |