Department of Transportation (DOT) Appropriations: FY2019
The Trump Administration proposed a $76.2 billion budget for the Department of Transportation (DOT) for FY2019: $16 billion in discretionary funding and $60 billion in mandatory funding. That is approximately $11 billion less than was provided for FY2018. The budget request reflected the Administration’s call for significant cuts in funding for transit and rail programs.
The DOT appropriations bill funds federal programs covering aviation, highways and highway safety, public transit, intercity rail, maritime safety, pipelines, and related activities. Federal highway, transit, and rail programs were reauthorized in fall 2015, and their future funding authorizations were somewhat increased. There is general agreement that more funding is needed for transportation infrastructure, but Congress has not been able to agree on a source that could provide the additional funding. The federal excise tax on motor fuel, which is the primary funding source for federal highway and transit programs, has not been increased in over 20 years, and does not raise enough revenue to support even the current level of spending. To address this shortfall, Congress periodically transfers money from the general fund to the Highway Trust Fund to provide sufficient funding for the programs.
The annual appropriations for DOT are combined with those for the Department of Housing and Urban Development (HUD) in the Transportation, Housing and Urban Development, and Related Agencies (THUD) appropriations bill. The House Appropriations Committee reported H.R. 3353, the THUD FY2019 appropriations bill, in which Division A provides FY2019 appropriations for DOT. The committee recommended $87.8 billion in new budget authority for DOT, approximately 1.8% ($1.6 billion) more than the comparable figure in FY2018.
The Senate passed H.R. 6147, a bill containing appropriations for several federal agencies; Division D is an FY2019 THUD appropriations bill, in which Division A is DOT appropriations. The Senate bill would provide $86.6 billion in new budget authority, less than 1% ($427 million) more than the comparable FY2018 amount.
Notable differences between the House-reported and Senate-passed bills include funding for the federal-aid highway program (the House committee bill would provide $900 million more than the Senate) and for intercity passenger rail (the House committee would provide $950 million for grants, including $150 million for the maglev program, compared to the Senate’s $565 million, with no funding for maglev).
With inflation forecast at 2.0% for FY2019, the House committee bill would result in roughly level inflation-adjusted funding for DOT compared to FY2018, while the Senate bill would likely result in a slight decrease in inflation-adjusted funding.
Department of Transportation (DOT) Appropriations: FY2019
Jump to Main Text of Report
Contents
- Introduction
- Understanding the DOT Appropriations Act
- Reauthorization of Air Transportation Programs
- DOT Funding Trend
- DOT FY2019 Appropriations
- Selected Issues
- Highway Trust Fund Solvency
- National Infrastructure Investment (BUILD/TIGER Grants)
- Essential Air Service
- Positive Train Control
- Amtrak and Intercity Passenger Rail Development
- Federal Transit Administration Capital Investment Grants
- The Hudson Tunnels and Amtrak's Gateway Program
- Grant to the Washington Metropolitan Area Transit Authority
Tables
- Table 1. DOT Budget Authority Types, FY2017-FY2018
- Table 2. DOT Budget Authority Sources, FY2017-FY2018
- Table 3. DOT Grant Accounts and Amounts, FY2018-FY2019
- Table 4. Department of Transportation FY2018-FY2019 Detailed Budget Table
- Table 5. Recent TIGER/BUILD Grant Appropriations
- Table 6. Essential Air Service Funding, FY2018-FY2019
- Table 7. Essential Air Service Program: Number of Communities and Annual Appropriations, FY2009-FY2018
- Table 8. Federal Intercity Passenger Rail Grant Program Funding, FY2018-FY2019
- Table 9. FTA Capital Investment Grants Funding by Component
Summary
The Trump Administration proposed a $76.2 billion budget for the Department of Transportation (DOT) for FY2019: $16 billion in discretionary funding and $60 billion in mandatory funding. That is approximately $11 billion less than was provided for FY2018. The budget request reflected the Administration's call for significant cuts in funding for transit and rail programs.
The DOT appropriations bill funds federal programs covering aviation, highways and highway safety, public transit, intercity rail, maritime safety, pipelines, and related activities. Federal highway, transit, and rail programs were reauthorized in fall 2015, and their future funding authorizations were somewhat increased. There is general agreement that more funding is needed for transportation infrastructure, but Congress has not been able to agree on a source that could provide the additional funding. The federal excise tax on motor fuel, which is the primary funding source for federal highway and transit programs, has not been increased in over 20 years, and does not raise enough revenue to support even the current level of spending. To address this shortfall, Congress periodically transfers money from the general fund to the Highway Trust Fund to provide sufficient funding for the programs.
The annual appropriations for DOT are combined with those for the Department of Housing and Urban Development (HUD) in the Transportation, Housing and Urban Development, and Related Agencies (THUD) appropriations bill. The House Appropriations Committee reported H.R. 3353, the THUD FY2019 appropriations bill, in which Division A provides FY2019 appropriations for DOT. The committee recommended $87.8 billion in new budget authority for DOT, approximately 1.8% ($1.6 billion) more than the comparable figure in FY2018.
The Senate passed H.R. 6147, a bill containing appropriations for several federal agencies; Division D is an FY2019 THUD appropriations bill, in which Division A is DOT appropriations. The Senate bill would provide $86.6 billion in new budget authority, less than 1% ($427 million) more than the comparable FY2018 amount.
Notable differences between the House-reported and Senate-passed bills include funding for the federal-aid highway program (the House committee bill would provide $900 million more than the Senate) and for intercity passenger rail (the House committee would provide $950 million for grants, including $150 million for the maglev program, compared to the Senate's $565 million, with no funding for maglev).
With inflation forecast at 2.0% for FY2019, the House committee bill would result in roughly level inflation-adjusted funding for DOT compared to FY2018, while the Senate bill would likely result in a slight decrease in inflation-adjusted funding.
Introduction
The Trump Administration requested $76.2 billion1 for the Department of Transportation (DOT) for FY2019, 8.6% ($10 billion) less than DOT received in FY2018. The Administration proposed significant cuts in funding for competitive grant programs, zeroing out the BUILD (formerly TIGER) grant program and railroad discretionary grant programs, cutting the Essential Air Service (EAS) program significantly, and reducing funding for public transportation capital grants and Amtrak by half or more.
On May 23, 2018, the House Committee on Appropriations reported H.R. 6072, the FY2019 Transportation, Housing and Urban Development, and Related Agencies (THUD) appropriations bill. The committee recommended $87.8 billion for DOT, a 1.8% ($1.6 billion) increase over the comparable FY2018 amount and 15% ($11.6 billion) above the Administration request.
On August 1, 2018, the Senate passed H.R. 6147; Division D of that bill is the FY2019 THUD appropriations bill.2 It would provide a total of $86.6 billion in new budget authority for DOT for FY2019, less than 1% ($427 million) above the comparable FY2018 amount and 14% ($10.4 billion) above the Administration request.
With inflation forecast at 2.0% for FY2019,3 the House committee bill would result in roughly level inflation-adjusted funding for DOT compared to FY2018, while the Senate bill would likely result in a slight reduction in inflation-adjusted funding for DOT compared to its FY2018 level.
Understanding the DOT Appropriations Act
DOT's funding arrangements are unusual compared to those of most other federal agencies, in that most of its funding is mandatory budget authority coming from trust funds, and most of its expenditures take the form of grants to states and local government authorities.
For most federal agencies most, if not all, of their annual funding is discretionary funding. But roughly two-thirds to three-fourths of DOT's funding is mandatory budget authority derived from trust funds. Around one-third to one-fourth of DOT's budget authority is discretionary authority.4 Table 1 shows the breakdown between the discretionary and mandatory funding in DOT's budgets in recent years.
|
Budget Authority (BA) |
FY2017 |
FY2018 |
|||||
|
Amount |
Percent of Total |
Amount |
Percent of Total |
||||
|
DOT discretionary BA |
$19.3 |
25% |
|
|
|||
|
DOT mandatory BA |
57.7 |
75% |
|
|
|||
|
DOT total budgetary resources |
$77.1 |
100% |
|
|
|||
Source: Prepared by CRS based on figures in the Comparative Statement of Budget Authority in H.Rept. 115-237.
Note: Budget authority figures in this table do not include rescissions.
Two large trust funds, the Highway Trust Fund and the Airport and Airway Trust Fund, have typically provided around 90% of DOT's annual funding in recent years (92% in FY2017). That proportion changed significantly in FY2018 as a result of a large increase in the discretionary funding portion of DOT's appropriation (see Table 2). The scale of the funding coming from these trust funds is not entirely obvious in DOT budget tables, because most of the funding from the Airport and Airway Trust Fund is categorized as discretionary budget authority and so is combined with the discretionary budget authority provided from the general fund.
|
Source |
FY2017 |
FY2018 |
||||||||
|
Amount |
% of Total DOT Budget Authority |
Amount |
% of Total DOT Budget Authority |
|||||||
|
Airport and Airway Trust Fund |
|
|
|
|
||||||
|
Highway Trust Fund (including mass transit account) |
|
|
|
|
||||||
|
Subtotal, budget authority derived from trust funds |
|
|
|
|
||||||
|
Other |
|
|
|
|
||||||
|
Total new budget authority |
|
|
|
|
||||||
Source: Calculated by CRS using information from Title I of Division K of P.L. 115-31, the Consolidated Appropriations Act, 2017, and Title I of Division L of P.L. 115-141.
Notes: "Other" is the amount of new budget authority for DOT drawn from the General Fund of the Treasury and offsetting receipts rather than from transportation trust funds. The figure is smaller than the bill's discretionary funding level because most of the funding appropriated from the Airport and Airway Trust Fund is categorized as discretionary budget authority. Numbers may not add due to rounding.
Approximately 80% of DOT's funding is distributed to states, local authorities, and Amtrak in the form of grants (see Table 3). Of DOT's largest subagencies, only the Federal Aviation Administration, which is responsible for the operation of the air traffic control system and employs roughly 83% of DOT's 56,252 employees, many as air traffic controllers, has a budget whose primary expenditure is not grants.
|
Account |
FY2018 |
FY2019 |
||
|
House-Reported |
Senate-Passed |
Enacted |
||
|
Office of the Secretary: National Infrastructure Improvement (TIGER) |
$1,500 |
$750 |
$1,000 |
|
|
Federal Aviation Administration: Grants-in-Aid to Airports |
3,350 |
3,350 |
3,350 |
|
|
Federal Highway Administration: Federal-aid Highway Program |
47,055 |
49,762 |
48,858 |
|
|
Federal Motor Carrier Safety Administration: Motor Carrier Safety Grants |
562 |
382 |
382 |
|
|
National Highway Traffic Safety Administration: Highway Traffic Safety Grants |
598 |
610 |
610 |
|
|
Federal Railroad Administration: Grants to Amtrak & Other Rail Grants |
2,805 |
2,892 |
2,507 |
|
|
Federal Transit Administration: Formula Grants |
9,733 |
9,939 |
9,939 |
|
|
Federal Transit Administration: Capital Investment Grants (New Starts & Small Starts) & Transit Infrastructure Grants |
3,479 |
3,414 |
3,353 |
|
|
Federal Transit Administration: WMATA Capital & Preventive Maintenance Grants |
150 |
150 |
150 |
|
|
Maritime Administration: Assistance to Small Shipyards |
20 |
30 |
20 |
|
|
Pipeline and Hazardous Materials Safety Administration: Emergency Preparedness Grants |
28 |
28 |
28 |
|
|
Total Grant Accounts |
69,279 |
71,307 |
70,197 |
|
|
Total DOT Funding |
$86,185 |
$87,758 |
$86,612 |
|
Source: Accounts and amounts taken from the Comparative Statements of Budget Authority in H.Rept. 115-750 and S.Rept. 115-268.
Note: Amounts shown in this table represent totals for grant-making accounts, except that where administrative expenses were broken out in the source table (e.g., Federal Highway Administration), they have been subtracted from the account total.
Reauthorization of Air Transportation Programs
Since most DOT funding comes from trust funds whose revenues typically come from taxes, the periodic reauthorizations of the taxes supporting these trust funds, and the apportionment of the budget authority from those trust funds to DOT programs, are a significant aspect of DOT funding. The highway, transit, and rail programs are currently authorized through FY2020, but the authorization for the federal aviation programs is scheduled to expire on September 30, 2018. Reauthorization of this program may affect both its structure and funding level.5
DOT Funding Trend
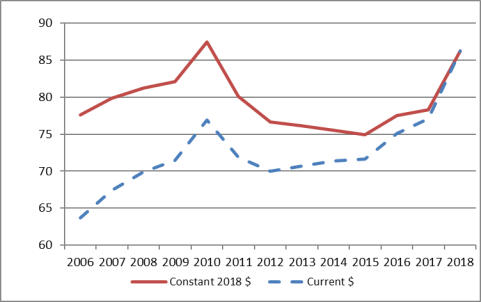
In current-year (nominal) dollars, DOT's nonemergency annual funding has risen from a recent low of $70 billion in FY2012 to $86 billion in FY2018. However, adjusting for inflation tells a different story. DOT's inflation-adjusted funding peaked in FY2010 at $87.5 billion (in constant 2018 dollars) and declined from that point until FY2015, then began rising again in FY2016 (see Figure 1). DOT's real funding, adjusted for inflation, was roughly the same in FY2016 and FY2017 as in FY2006; from FY2012-FY2017, DOT's inflation-adjusted funding was lower than during the FY2007-FY2011 period.
|
Figure 1. DOT Funding Trend (FY2006-FY2018) (in billions of dollars) |
 |
|
Source: Calculated by CRS based on figures in annual House Appropriations THUD committee reports. Current dollars are converted to constant dollars using the GDP (Chained) Price Index column in Table 10.1 (Gross Domestic Product and Deflators Used in the Historical Tables: 1940-2023) from the FY2019 Budget Request: Historical Tables (https://www.whitehouse.gov/omb/historical-tables/). Notes: Funding as shown in this chart equals discretionary appropriations plus limitations on obligations. It does not include emergency appropriations (e.g., to repair storm damage) or rescissions of budget authority, rescissions of contract authority, or offsetting collections (which reduce the amount of discretionary budget authority shown as going to DOT without actually reducing the amount of funding available to DOT). |
DOT FY2019 Appropriations
Table 4 presents a selected account-by-account summary of FY2019 appropriations for DOT, compared to FY2018.
Table 4. Department of Transportation FY2018-FY2019 Detailed Budget Table
(in millions of current dollars)
|
Department of Transportation |
FY2018 Enacted |
FY2019 Request |
FY2019 House-Reported |
FY2019 Senate-Passed |
FY2019 Enacted |
|||||
|
Office of the Secretary (OST) |
|
|
|
|
|
|||||
|
Payments to air carriers (Essential Air Service)a |
|
|
|
|
|
|||||
|
National infrastructure investment (BUILD/TIGER) |
|
|
|
|
|
|||||
|
Total, OST |
|
|
|
|
|
|||||
|
Federal Aviation Administration (FAA) |
|
|
|
|
|
|||||
|
Operations |
|
|
|
|
|
|||||
|
Facilities & equipment |
|
|
|
|
|
|||||
|
Research, engineering, & development |
|
|
|
|
|
|||||
|
Grants-in-aid for airports (Airport Improvement Program) (limitation on obligations) |
|
|
|
|
|
|||||
|
Airport Discretionary Grants |
|
|
|
|
|
|||||
|
Total, FAA |
|
|
|
|
|
|||||
|
Federal Highway Administration (FHWA) |
|
|
|
|
|
|||||
|
Federal-Aid Highways: limitation on obligations + exempt contract authority) |
|
|
|
|
|
|||||
|
Federal-Aid Highways: discretionary funding |
|
|
|
|
|
|||||
|
Rescission of budget authority |
|
|
|
|
|
|||||
|
Total, FHWA |
|
|
|
|
|
|||||
|
Federal Motor Carrier Safety Administration (FMCSA) |
|
|
|
|
|
|||||
|
Motor carrier safety operations and programs |
|
|
|
|
|
|||||
|
Motor carrier safety grants to states |
|
|
|
|
|
|||||
|
Total, FMCSA |
|
|
|
|
|
|||||
|
National Highway Traffic Safety Administration (NHTSA) |
|
|
|
|
|
|||||
|
Operations and research |
|
|
|
|
|
|||||
|
Highway traffic safety grants to states (limitation on obligations) |
|
|
|
|
|
|||||
|
Impaired driving/Highway-rail grade crossing safety |
|
|
|
|
|
|||||
|
Total, NHTSA |
|
|
|
|
|
|||||
|
Federal Railroad Administration (FRA) |
|
|
|
|
|
|||||
|
Safety and operations |
|
|
|
|
|
|||||
|
Research and development |
|
|
|
|
|
|||||
|
Railroad Rehabilitation and Improvement Financing Program subsidy |
|
|
|
|
|
|||||
|
Amtrak |
|
|
|
|
|
|||||
|
Northeast Corridor grants |
|
|
|
|
|
|||||
|
National Network |
|
|
|
|
|
|||||
|
Subtotal Amtrak grants |
|
|
|
|
|
|||||
|
Consolidated rail infrastructure and safety improvements |
|
|
|
|
|
|||||
|
Federal-state partnership for State of Good Repair |
|
|
|
|
|
|||||
|
Restoration and enhancement grants |
|
|
|
|
|
|||||
|
Magnetic Levitation Program |
|
|
|
|
|
|||||
|
Transportation Technology Center |
|
|
|
|
|
|||||
|
Rescission |
|
|
|
|
|
|||||
|
Total, FRA |
|
|
|
|
|
|||||
|
|
||||||||||
|
Administrative Expenses |
|
|
|
|
|
|||||
|
Formula grants (M) |
|
|
|
|
|
|||||
|
Technical assistance and training |
|
|
|
|
|
|||||
|
Capital Investment Grants (New Starts) |
|
|
|
|
|
|||||
|
Transit Infrastructure Grants |
|
|
|
|
|
|||||
|
Washington Metropolitan Area Transit Authority |
|
|
|
|
|
|||||
|
Rescission |
|
|
|
|
|
|||||
|
Total, FTA |
|
|
|
|
|
|||||
|
Maritime Administration (MARAD) |
|
|
|
|
|
|||||
|
Maritime Security Program |
|
|
|
|
|
|||||
|
Operations and training |
|
|
|
|
|
|||||
|
State Maritime Academy Operations |
|
|
|
|
|
|||||
|
Assistance to small shipyards |
|
|
|
|
|
|||||
|
Ship disposal |
|
|
|
|
|
|||||
|
Maritime Guaranteed Loan Program |
|
|
|
|
|
|||||
|
Total, MARAD |
|
|
|
|
|
|||||
|
|
||||||||||
|
Subtotal |
|
|
|
|
|
|||||
|
Offsetting user fees |
|
|
|
|
|
|||||
|
Emergency preparedness grants (M) |
|
|
|
|
|
|||||
|
Total, PHMSA |
|
|
|
|
|
|||||
|
Office of Inspector General |
|
|
|
|
|
|||||
|
Saint Lawrence Seaway Development Corporation |
|
|
|
|
|
|||||
|
|
||||||||||
|
Appropriation (discretionary funding) |
|
|
|
|
|
|||||
|
Limitations on obligations (M) |
|
|
|
|
|
|||||
|
Subtotal—new funding |
|
|
|
|
|
|||||
|
Rescissions of discretionary funding |
|
|
|
|
|
|||||
|
Rescissions of contract authority |
|
|
|
|
|
|||||
|
Net new discretionary funding |
|
|
|
|
|
|||||
|
Net new budget authority |
|
|
|
|
|
|||||
Sources: Table prepared by CRS based on information in H.Rept. 115-237, S.Rept. 115-138, and the text and explanatory statement for Division L of P.L. 115-141.
Notes: "M" stands for mandatory budget authority. Line items may not add up to the subtotals due to omission of some accounts. Subtotals and totals may differ from those in the source documents due to treatment of rescissions, offsetting collections, and other adjustments. The figures in this table reflect new budget authority made available for the fiscal year. For budgetary calculation purposes, the source documents may subtract rescissions of prior-year funding or contract authority, or offsetting collections, in calculating subtotals and totals.
a. The Essential Air Service program receives an additional amount in mandatory budget authority; see discussion below.
Selected Issues
Highway Trust Fund Solvency
Virtually all federal highway funding and most federal transit funding come from the Highway Trust Fund, the revenues of which come largely from the federal motor fuels excise tax ("gas tax"). For many years, annual expenditures from the fund have exceeded revenues; for example, for FY2018, revenues and interest are projected to be approximately $41 billion, while authorized outlays are projected to be approximately $54 billion, and this shortfall is expected to continue.6 Congress transferred about $143 billion, mostly from the general fund of the Treasury, to the Highway Trust Fund during the period FY2008-FY2016 to keep the trust fund solvent.7
One reason for the shortfall in the fund is that the federal gas tax has not been raised since 1993. The tax is a fixed amount assessed per gallon of fuel sold, not a percentage of the cost of the fuel sold: whether a gallon of gas costs $1 or $4, the highway trust fund receives 18.3 cents for each gallon of gasoline and 24.3 cents for each gallon of diesel. Meanwhile, the value of the gas tax has been diminished by inflation (which has reduced the purchasing power of the revenue raised by the tax) and increasing automobile fuel efficiency (which reduces growth in gasoline sales as vehicles are able to travel farther on a gallon of fuel). The Congressional Budget Office (CBO) has forecast that gasoline consumption will be relatively flat through 2024, as continued increases in the fuel efficiency of the U.S. passenger fleet are projected to offset increases in the number of miles driven. Consequently, CBO expects Highway Trust Fund revenues of $39 billion to $41 billion annually from FY2018 to FY2027, well short of the annual level of projected expenditures from the fund.8
National Infrastructure Investment (BUILD/TIGER Grants)
Congress provided $1.5 billion for national infrastructure investment grants, also called BUILD (Better Utilizing Investments to Leverage Development) Transportation grants, for FY2018. (This program was previously known as the TIGER grant program.) The House Committee on Appropriations recommended $750 million, while the Senate-passed bill would provide $1 billion. In its committee report accompanying the bill, the Senate Committee on Appropriations noted that last year it had expressly forbidden DOT to use the federal share requested for a project as a criterion in selecting which projects would receive grants (i.e., giving preference to projects that requested a lower federal share), but that DOT had nevertheless said it would use an applicant's willingness to create new sources of nonfederal revenue for transportation projects as a selection criterion. The committee report prohibits DOT from using this criterion, and directs it to use the selection criteria listed in the FY2016 grant process.
The TIGER grant program originated in the American Recovery and Reinvestment Act (P.L. 111-5), where it was called "national infrastructure investment." It is a discretionary grant program intended to address two criticisms of the current structure of federal transportation funding:
- that virtually all of the funding is distributed to state and local governments, which select projects based on their individual priorities, making it difficult to fund projects that have national or regional impacts but whose costs fall largely on one or two states; and
- that most federal transportation funding is divided according to mode of transportation, making it difficult for projects in different modes to compete for funds on the basis of comparative benefit.
Perhaps the best illustration of these challenges is Amtrak's Gateway Program, a set of projects concentrated in a short stretch of its Northeast Corridor rail line around the New York/New Jersey border. The biggest single component of the project is the replacement of a deteriorating tunnel under the Hudson River through which hundreds of Amtrak and New Jersey Transit trains pass each day. While this project would benefit Amtrak passengers (and arguably users of other modes) from Washington, DC, to Boston, MA, the burden of paying for the $13 billion-plus project falls on New York and New Jersey. For more information on the Gateway Program, see "The Hudson Tunnels and Amtrak's Gateway Program," below.
The BUILD program provides grants to projects of national, regional, or metropolitan-area significance in various modes on a competitive basis, with recipients selected by DOT.9
Although the program is, by description, intended to fund projects of national, regional, and metropolitan-area significance, in practice its funding has gone more toward projects of regional and metropolitan-area significance. In large part this is a function of congressional intent, as Congress has directed that the funds be distributed equitably across geographic areas, between rural and urban areas, and among transportation modes, and has set relatively low minimum grant thresholds ($5 million for urban projects, $1 million for rural projects).
Congress has continued to support the BUILD/TIGER program through annual DOT appropriations.10 It is heavily oversubscribed, typically receiving applications totaling many times the amount of funding available for that year.
In the past some critics have argued that TIGER grants went disproportionately to urban areas. For several years Congress directed that at least 20% of TIGER funding should go to projects in rural areas, which was roughly equivalent to the portion of the U.S. population living in rural areas.11 In FY2018 Congress increased the portion of funding that should go to projects in rural areas to 30%. The House Appropriations Committee report on the FY2019 appropriations bill specifies that 33% of the recommended funding should go to projects in rural areas (and directs that bridge projects in rural areas be prioritized); the Senate-passed bill repeats the 30% rural portion from FY2018. The House report also directs that another 33% of the recommended funding should go to projects in and around major seaports, with the remaining 33% for projects in urban areas over 200,000 in population.
As Table 5 illustrates, the BUILD/TIGER grant appropriation process has followed two patterns in recent years. First, the Obama Administration would request as much as or more than Congress had previously provided, the House would propose a large cut, the Senate would propose an amount similar to the previously enacted appropriation, and Congress would agree on a final enacted amount similar to the previously enacted amount. In FY2018 the Trump Administration requested no funding, but Congress funded the program. This pattern appears to be playing out again in the FY2019 appropriations bills.
|
Budget Request |
House |
Senate |
Enacted |
|||||
|
FY2015 |
|
|
|
|
||||
|
FY2016 |
|
|
|
|
||||
|
FY2017 |
|
|
|
|
||||
|
FY2018 |
|
|
|
|
||||
|
FY2019 |
|
|
|
|
Source: Committee reports accompanying Departments of Transportation, Housing and Urban Development, and Related Agencies appropriations acts, various years.
Note: Enacted figures do not reflect subsequent reductions due to sequester reductions or rescissions.
Essential Air Service12
The Essential Air Service (EAS) program is funded through a combination of mandatory and discretionary budget authority. In addition to the annual discretionary appropriation, there is a mandatory annual authorization, estimated at $140 million for FY2019,13 financed by overflight fees collected from commercial airlines by FAA. These overflight fees apply to international flights that fly through U.S. airspace, but do not land in or take off from the United States. The fees are to be reasonably related to the costs of providing air traffic services to such flights.
As Table 6 shows, the Trump Administration requested $93 million in discretionary funding for the EAS program in FY2019, $62 million less than the program received in FY2018. The House committee bill recommended a $175 million discretionary appropriation, $20 million more than the FY2018 level. The Senate-passed bill likewise recommends a $175 million discretionary appropriation. Combined with the estimated mandatory funding of $140 million ($9.5 million more than the FY2018 amount), $175 million in discretionary funding would result in a 10% ($29.5 million) increase over the FY2018 total funding level of $285.8 million.
|
FY2018 Enacted |
FY2019 Request |
FY2019 House-Reported |
FY2019 Senate-passed |
FY2019 Enacted |
||||||
|
Appropriation |
|
|
|
|
|
|||||
|
Mandatory supplement |
|
|
|
|
|
|||||
|
Total |
|
|
|
|
|
Source: H.Rept. 115-750 and S.Rept. 115-268.
Note: In addition to this discretionary funding, the EAS program also receives an amount of mandatory funding each year.
The EAS program seeks to preserve commercial air service to small communities by subsidizing service that would otherwise be unprofitable. The cost of the program in real terms has doubled since FY2008, in part because route reductions by airlines resulted in new communities being added to the program (see Table 7). Congress made changes to the program in 2012, including allowing no new entrants,14 capping the per-passenger subsidy for a community at $1,000, limiting communities that are less than 210 miles from a hub airport to a maximum average subsidy per passenger of $200, and allowing smaller planes to be used for communities with few daily passengers.15
Table 7. Essential Air Service Program: Number of Communities and Annual Appropriations, FY2009-FY2018
|
2009 |
2010 |
2011 |
2012 |
2013 |
2014 |
2015 |
2016 |
2017 |
2018 |
|||||||||||
|
# of EAS communities |
|
|
|
|
|
|
|
|
|
|
||||||||||
|
Budget (in millions of current $) |
|
|
|
|
|
|
|
|
|
|
||||||||||
|
Budget (in millions of constant 2017 $) |
|
|
|
|
|
|
|
|
|
|
Source: Prepared by CRS based on information from Office of the Secretary, U.S. Department of Transportation, FY2015 Budget Estimate, p. EAS/PAC-2; FY2014: H.Rept. 113-464, p. 12; FY2015: H.Rept. 114-129; FY2016: S.Rept. 114-243; number of EAS communities in 2017 and 2018 is approximate, from U.S. Department of Transportation, Essential Air Service, https://www.transportation.gov/policy/aviation-policy/small-community-rural-air-service/essential-air-service.
Notes: Budget figures deflated using the "Total Non-Defense Outlays" column from Table 10.1—Gross Domestic Product and Deflators Used in the Historical Tables 1940-2022, from the Budget of the United States 2018, Historical Tables. NA = not available.
Supporters of the EAS program contend that preserving airline service to small communities was a commitment Congress made when it deregulated airline service in 1978, anticipating that airlines would reduce or eliminate service to many communities that were too small to make such service economically viable. Supporters also contend that subsidizing air service to smaller communities promotes economic development in rural areas. Critics of the program note that the subsidy cost per passenger is relatively high,16 that many of the airports in the program have very few passengers,17 and that some of the airports receiving EAS subsidies are little more than an hour's drive from major airports.
Positive Train Control
In 2008 Congress directed railroads to install positive train control (PTC) on certain segments of the national rail network by the end of 2015.18 PTC is a communications and signaling system that is capable of preventing incidents caused by train operator or dispatcher error.19 Freight railroads have reportedly spent billions of dollars thus far to meet this requirement, but most of the track required to have PTC installed was not in compliance at the end of 2015; in October 2015 Congress extended the deadline to the end of 2018—with an option for individual railroads to extend to 2020 with Federal Railroad Administration (FRA) approval.20
In recent years Congress has provided some funding to help railroads with the expenses of installing PTC: $50 million in FY2016, $199 million in FY2017 (for commuter railroads), and at least $250 million in FY2018. The Trump Administration's FY2019 budget request did not include any funding for the cost of PTC implementation. The House-reported bill specified that $150 million (of the Consolidated Rail Infrastructure and Safety Improvement grant program funding) was for PTC projects; the Senate-passed bill does not set aside an amount for PTC projects, but the committee report directs DOT to prioritize PTC projects in making grants from the Consolidated Rail Infrastructure and Safety Improvements grant program.
Amtrak and Intercity Passenger Rail Development
The Passenger Rail Reform and Investment Act of 2015 (Title XI of P.L. 114-94) reauthorized Amtrak while changing the structure of its federal grants: instead of getting separate grants for operating and capital expenses, it now receives separate grants for the Northeast Corridor and the rest of its national network. This act also authorized three new programs to make grants to states, public agencies, and rail carriers for intercity passenger rail development:
- Consolidated Rail Infrastructure and Safety Improvement Grants
- Federal-State Partnership for State of Good Repair Grants
- Restoration and Enhancement Grants
The Administration's FY2019 budget requested a total of $738 million for intercity passenger rail funding, all of it for grants to Amtrak; no funding was requested for the three grant programs.
The House Appropriations Committee recommended $1.9 billion for Amtrak, a total of $800 million for two of the new grant programs, plus another $150 million for the Magnetic Levitation Technology Deployment Program, which has received no funding in over a decade. It specified that $150 million of the funding for the Consolidated Rail Infrastructure and Safety Improvement program was for PTC implementation projects.
The Senate bill would provide $1.9 billion for Amtrak and a total of $565 million for the three new grant programs (see Table 8), and directed FRA to accelerate the pace of grant-making and to prioritize PTC projects in its grant-making.
Table 8. Federal Intercity Passenger Rail Grant Program Funding, FY2018-FY2019
(in millions of dollars)
|
Program |
FY2018 Enacted |
FY2019 Authorized Level |
FY2019 Administration Request |
FY2019 Amtrak Independent Budget Request |
FY2019 House-Reported |
FY2019 Senate |
FY2019 Enacted |
||||||
|
Amtrak: Northeast Corridor Grants |
|
|
|
|
|
|
|||||||
|
Amtrak: National Network Grants |
|
|
|
|
|
|
|||||||
|
Subtotal, Amtrak |
|
|
|
|
|
|
|||||||
|
Consolidated Rail Infrastructure and Safety Improvement |
|
|
|
|
|
|
|||||||
|
Federal-State Partnership for State of Good Repair Grants |
|
|
|
|
|
|
|||||||
|
Restoration and Enhancement Grants |
|
|
|
|
|
|
|||||||
|
Magnetic Levitation Program |
|
|
|
|
|
|
|||||||
|
Total Intercity Passenger Rail Grant Funding |
|
|
|
|
|
|
Source: Authorized level: Title XI of P.L. 114-94; Amtrak independent request: https://www.amtrak.com/content/dam/projects/dotcom/english/public/documents/corporate/reports/Amtrak-General-Legislative-Annual-Report-FY2019-Grant-Request.pdf; appropriations: H.Rept. 115-750 and S.Rept. 115-268.
Notes: Amtrak submits a budget request directly to Congress each year, separate from DOT's request for Amtrak funding. NA ("not applicable"): these accounts are not included in Amtrak's independent budget request.
Congress has historically provided little or no funding for intercity passenger rail development other than annual grants to Amtrak. That changed briefly in FY2009 and FY2010, when Congress appropriated a total of $10.5 billion for DOT's high-speed and intercity passenger rail grant program. From FY2011 to FY2016, Congress returned to providing no funding for intercity passenger rail development (save for PTC implementation); at the beginning of that period, in FY2011, it also rescinded $400 million that had been appropriated in FY2010 for that purpose but not yet obligated. In FY2017 Congress provided $98 million for three new intercity passenger rail grant programs, rising to $863 million in FY2018.
Federal Transit Administration Capital Investment Grants
The majority of the Federal Transit Administration's (FTA's) roughly $13 billion in funding is funneled to state and local transit agencies through several programs that distribute the funding by formula. Of the few transit grant programs that are discretionary (i.e., awarding funding to applicants selectively, usually on a competitive basis), the largest is the Capital Investment Grants program (CIG), which is often referred to as the New Starts program, as that is the largest and best known of its component grant programs. It funds new fixed-guideway transit lines21 and extensions to existing lines. The program has three components: New Starts grants are for capital projects with total costs over $300 million that are seeking more than $100 million in federal funding; Small Starts grants are for capital projects with total costs under $300 million that are seeking less than $100 million in federal funding; and Core Capacity grants are for projects that will increase the capacity of existing systems that are already at full capacity, or will be in five years, by at least 10%. There is also an Expedited Project Delivery Pilot, intended to provide funding for eight projects that are eligible for any of the three programs, seek no more than a 25% federal share, and are supported, in part, by a public-private partnership.
Grant funds for large projects are typically disbursed over a period of years. Much of the funding for this program each year is committed to projects with multiyear grant agreements signed in previous years that are now under construction.
For FY2019 the Trump Administration requested $1.0 billion for Capital Investment Grants, $1.6 billion less than the $2.645 billion provided in FY2018. The Administration repeated its intention, announced in its FY2018 request, not to approve any new project, but to provide funding only to projects that have existing full funding grant agreements (FFGAs).22
The House Committee on Appropriations recommended $2.614 billion, slightly ($31 million) less than the FY2018 amount. The Senate-passed bill would provide $2.553 billion.
Congress has expressed concern regarding the Administration's stance toward the CIG program. On the one hand, the Administration has championed infrastructure investment and easing of regulatory obstacles to speed project development, and has acknowledged the demand for transit projects. On the other hand, the Administration has broken with previous federal policy and taken the position that state and local governments should be responsible for funding transit projects, without any contribution from the federal government. Following this stance, it has not requested funding for any new transit projects in either its FY2018 or FY2019 DOT budget requests.
Congress has not supported the Administration's policy proposal to end federal assistance for new transit projects. Congress provided more than twice as much funding as FTA requested for the CIG program in FY2018, and directed the agency to carry out the CIG program as described in statute. Similarly, both the House-reported bill and the Senate-passed bill for FY2019 would provide more than twice the amount requested by FTA for the CIG program, and the committee reports for these bills direct FTA to continue to advance eligible projects through the program. The Senate Appropriations Committee report also notes that the Government Accountability Office (GAO) found that FTA has failed to comply with congressional directives regarding improvements to the CIG program, and that FTA told GAO that it had no plans to comply with the statutory mandates because the Administration is not requesting funding for any new projects.23
The Senate Appropriations Committee report also expressed concern about FTA creating unnecessary delays for projects in the project development pipeline. Transportation for America, a transportation advocacy group, asserts that, contrary to the Administration's stated goal of reducing delays to transportation project development, FTA is deliberately delaying the project development process for transit projects. It asserts that, of $2.3 billion that Congress provided for new transit projects under the CIG program in the FY2017 and FY2018 DOT appropriations acts, FTA has issued only $533 million in grants, and that FTA is drawing out the review process for projects that have applied for funding.24 One alleged result is that project sponsors are facing increased costs due to this lengthened process; in some cases, bids received for construction have expired before FTA completed its review of agencies' applications, forcing the agencies to rebid the projects. FTA denies that it is delaying the project review process.
|
Component |
FY2018 Enacted |
FY2019 Request |
FY2019 House-Reported |
FY2019 Senate |
FY2019 Enacted |
|||||
|
New Starts |
|
|
|
|
|
|||||
|
With signed FFGA |
|
|
|
|
|
|||||
|
Anticipated to sign FFGA during the fiscal year |
|
|
|
|
|
|||||
|
Small Starts |
|
|
|
|
|
|||||
|
Core Capacity |
|
|
|
|
|
|||||
|
With signed FFGA |
|
|
|
|
|
|||||
|
Anticipated to sign FFGA during the fiscal year |
|
|
|
|
|
|||||
|
Expedited Project Delivery Pilot |
|
|
|
|
|
|||||
|
Joint Public Transportation and Intercity Rail Projects |
|
|
|
|
|
|||||
|
Total |
|
|
|
|
|
|||||
|
Total Appropriation |
|
|
|
|
|
Source: Division L, Title I of P.L. 115-141; Federal Transit Administration, FY2019 Budget Estimate, p. CIG - 6; H.Rept. 115-750 and S.Rept. 115-268.
Notes: FFGA=Full Funding Grant Agreement. Typically, the total funding allocated to the component grant programs is slightly less than the total appropriation to allow for oversight costs (typically 1% of the total program appropriation, though that may include unused funds from previous years).
a. The total exceeds the appropriation requested as the Administration anticipated receiving $46 million in recoveries from prior year funding. FTA, FY2019 Budget Estimate, p. CIG – 4.
A New Starts grant, by statute, can be up to 80% of the net capital project cost. Since FY2002, DOT appropriations acts have included a provision directing FTA not to sign any FFGAs for New Starts projects that would provide a federal share of more than 60%; in the FY2018 DOT appropriations act the limit was lowered to 51%. The House-reported FY2019 bill includes a provision prohibiting New Starts grant agreements with a federal share greater than 50%. The Senate-passed bill does not have such a provision.
Critics of lowering the federal share provided for New Starts projects note that the federal share for highway projects is typically 80%, and in some cases is higher. They contend that the higher federal share makes highway projects relatively more attractive than public transportation projects for communities considering how to address transportation problems. Advocates of this provision note that the demand for New Starts funding greatly exceeds the amount available, so requiring a higher local match allows FTA to support more projects with the available funding. They also assert that requiring a higher local match likely encourages communities to estimate the costs and benefits of proposed transit projects more carefully, reducing the risk of subsequent cost overruns and of project ridership falling short of expectations.
The Hudson Tunnels and Amtrak's Gateway Program
Among the challenges to funding transportation infrastructure is that most federal transportation funding is distributed by mode, and most of the funding is distributed to states by formula. There are grant programs reserved for highways, for public transportation, for rail, and for airport development, but sponsors of projects involving multiple modes may have difficulty amassing significant amounts of federal funding. And while Congress provides some $55 billion annually for surface transportation programs, the vast majority of that funding is automatically divided among the states, making it difficult for a state to accumulate the funding needed for a major project in addition to meeting its other needs. One project that is highlighting this situation is Amtrak's Gateway Program, and specifically the Hudson Tunnel replacement project.
Amtrak's Gateway Program is a set of projects intended to increase capacity and reliability of rail service between northern New Jersey and Manhattan, the most heavily used section of intercity and commuter rail track in the nation. The program would replace bridges, expand track capacity from two to four parallel tracks, and, most critically, add a new rail tunnel under the Hudson River. The existing tunnel, the only link connecting the Northeast Corridor from New Jersey to New York, is over a century old, was flooded with seawater during Hurricane Sandy in 2012, and is deteriorating. The estimated cost of the Gateway Program is at least $24 billion, and likely will increase as project planning advances;25 the estimated cost of just the new Hudson River Tunnel is $11.1 billion.26
Since the new tunnel would carry both intercity and commuter rail traffic, it is eligible for DOT funding from both the intercity rail program and the public transportation Capital Investment Grants program. But other than the annual grants to keep Amtrak going, relatively little funding has been available in recent years for intercity rail projects: the largest rail grant program in FY2017 was funded at $68 million, which was increased to $593 million in FY2018 (but $285 million was reserved for projects for which the Hudson Tunnel project would not qualify). The Capital Investment Grants program has significantly more funding to award—$2.6 billion in FY2018—but competition for that funding is intense, and the largest grant awarded to a single project in the past 10 years was $2.6 billion.27
In 2016, under the previous Administration, media reports indicated an agreement had been reached between DOT, Amtrak, and the States of New Jersey and New York to share the costs of building the new Hudson Tunnel, with one-third to be covered each by DOT/Amtrak, New Jersey/New Jersey Transit, and New York State. The Trump Administration has indicated that it does not feel bound by the previous agreement. In any case, it would be up to Congress to provide the money.
Neither the House nor Senate Appropriations Committees mentioned the Gateway Program or Hudson Tunnel project in their FY2019 THUD committee reports. But both committees recommended significant funding for rail and transit grant programs that Gateway projects could be eligible for, as well as recommending $240 million more for Amtrak's Northeast Corridor account than Amtrak requested for FY2019.
Grant to the Washington Metropolitan Area Transit Authority
The Passenger Rail Investment and Improvement Act of 2008 authorized $1.5 billion over 10 years in grants to the Washington Metropolitan Area Transit Authority (WMATA) for preventive maintenance and capital grants, to be matched by funding from the District of Columbia and the States of Maryland and Virginia. This money is in addition to around $310 million WMATA receives under FTA formula programs.28 The Senate Appropriation Committee's report accompanying its FY2018 DOT appropriations bill noted that the FY2018 grant was the final installment of the $1.5 billion funding commitment Congress made in 2008, but that WMATA's budget assumed that the annual funding would continue to be provided.
The Administration requested $120 million for this grant to WMATA for FY2019; the House Appropriations Committee recommended $150 million, and the Senate-passed bill would provide $150 million. The Senate Appropriation Committee's FY2019 committee report direct WMATA, the local jurisdictions, and FTA to continue working with the authorizing committees on extending the authorization for this grant. Both the House and Senate Appropriation Committee reports direct WMATA to continue working to implement the congressional directive that wireless service be provided throughout the rail system.
WMATA is dealing with a backlog of maintenance needs due to inadequate maintenance investment over many years, and it has experienced several fatal incidents, most recently in January 2015. A number of other incidents have raised questions about the safety culture of the agency. An investigation that found numerous instances of mismanagement of federal funding led FTA to restrict WMATA's use of federal funds. An FTA audit of WMATA's safety practices in 2015 produced many recommendations for change, and in October 2015 FTA assumed oversight of WMATA's safety compliance practices from the Tri-State Oversight Committee, the agency created by the governments of the District of Columbia, Maryland, and Virginia to oversee WMATA safety performance. FTA continues to exercise safety oversight of WMATA, conducting inspections, leading accident investigations, and directing that federal funds received by WMATA are used to improve safety. In February 2017, FTA notified leaders of the three jurisdictions that it would withhold 5% of their FY2017 transit Urbanized Area formula funds until they meet the requirements to create a new State Safety Oversight Program to replace the Tri-State Oversight Committee.29 The jurisdictions passed legislation establishing a new safety oversight agency (the Metrorail Safety Commission) soon after, but the agency must be in operation before FTA will release the funding.30 On September 6, 2018, FTA outlined the steps the new Metrorail Safety Commission must take in order to complete the transition of oversight responsibility from FTA to the Commission.31 The National Transportation Safety Board has recommended that oversight of WMATA's rail operations be assigned to FRA, which has a long history of safety enforcement, rather than FTA, which is primarily a grant management agency. However, Congress would have to act to give FRA authority to oversee WMATA, while FTA already has such authority.
Author Contact Information
Footnotes
| 1. |
This number, calculated from H.Rept. 115-750, may differ slightly from the figure in DOT budget documents because of variations in the treatment of offsetting collections, mandatory funding, rescissions, and other budgetary considerations. |
| 2. |
The House-passed version of H.R. 6147 does not include a division D with the THUD appropriations act; that was added to the bill in the Senate. |
| 3. |
Congressional Budget Office, 10-Year Economic Projections, August 2018 Baseline Forecast—Fiscal Year: GDP Price Index, https://www.cbo.gov/system/files?file=2018-08/51137-2018-08-potentialgdp.xlsx. |
| 4. |
DOT receives a form of mandatory budget authority known as "contract authority," the level of which is set in authorization acts and the funding for which is drawn from trust funds; contract authority spending is controlled in appropriations acts by "limitations on obligation." Discretionary budget authority is provided in appropriations acts and is typically drawn from the General Fund of the Treasury. For more details, see CRS Report R43420, Surface Transportation Program Reauthorization Issues for Congress, by [author name scrubbed] et al. |
| 5. |
For more information, see CRS Report R45207, Federal Aviation Administration (FAA) Reauthorization Issues and Debate in the 115th Congress, by [author name scrubbed] and [author name scrubbed]. |
| 6. |
Congressional Budget Office, "Projections of Highway Trust Fund Accounts—CBO's April 2018 Baseline," https://www.cbo.gov/system/files?file=2018-06/51300-2018-04-highwaytrustfund.pdf. |
| 7. |
Congressional Budget Office, "Approaches to Make Highway Spending More Productive," February 2016, p. 1, https://www.cbo.gov/sites/default/files/114th-congress-2015-2016/reports/50150-Federal_Highway_Spending-OneCol.pdf. |
| 8. |
Congressional Budget Office, "Projections of Highway Trust Fund Accounts—CBO's April 2018 Baseline," https://www.cbo.gov/system/files?file=2018-06/51300-2018-04-highwaytrustfund.pdf. |
| 9. |
For more information, see DOT's TIGER website: http://www.transportation.gov/tiger. |
| 10. |
Congress refers to the program as "National Infrastructure Investment" in appropriations acts. |
| 11. |
U.S. Census Bureau, Frequently Asked Questions: "What percentage of the U.S. population is urban or rural?," https://ask.census.gov/faq.php?id=5000&faqId=5971. |
| 12. |
For more information about EAS, see CRS Report R44176, Essential Air Service (EAS), by [author name scrubbed]. |
| 13. |
The amount made available to the EAS program from the fees may exceed $100 million, if the fees provide sufficient revenue. |
| 14. |
This limitation does not apply to Alaska or Hawaii. Approximately 60 (34%) of the EAS communities are in Alaska; two are in Hawaii. |
| 15. |
The program had previously required airlines to use 15-passenger aircraft at a minimum. |
| 16. |
To remain eligible for the program, a community's subsidy per passenger must not exceed $1,000. The per-passenger subsidy in FY2016 varied among communities, from $9 to $778. Information on EAS communities' subsidy per passenger is in Appendix A of CRS Report R44176, Essential Air Service (EAS), by [author name scrubbed]. |
| 17. |
In 2012 27 EAS communities averaged fewer than 10 passengers per day. In 2012 Congress disqualified airports averaging fewer than 10 passengers per day unless the airports are more than 175 miles from the nearest hub airport: P.L. 112-95, Title IV, Subtitle B. One community lost service due to this requirement, while several communities have failed to reach the threshold but have been granted waivers. See CRS Report R44176, Essential Air Service (EAS), by [author name scrubbed]. |
| 18. | |
| 19. |
See CRS Report R42637, Positive Train Control (PTC): Overview and Policy Issues, by [author name scrubbed]. |
| 20. |
Positive Train Control Enforcement and Implementation Act of 2015, §1302 of P.L. 114-73. |
| 21. |
Fixed-guideway refers to systems in which the vehicle travels on a fixed course (e.g., subways, light rail, and bus-rapid transit systems with dedicated lanes). |
| 22. |
U.S. Department of Transportation, Federal Transit Administration FY2019 Budget Estimate, p. CIG – 4, https://www.transportation.gov/sites/dot.gov/files/docs/mission/budget/304516/fta-fy-2019-final-cjs-508-compliant.pdf. |
| 23. |
S.Rept. 115-268, p. 74. |
| 24. |
Transportation for America, "Stuck in the Station," http://t4america.org/TransitFundingDelays/. |
| 25. |
The $24 billion estimate, announced in 2016, included an estimate of $7.7 billion for the new Hudson Tunnel and repair of the existing tunnel; the June 2017 estimate for the new tunnel and repair of the old tunnel is $13 billion, which could increase the overall program cost to $29 billion. Emma G. Fitzsimmons, "Amtrak Says New York Region's Rail Projects Could Cost Up to $23.9 Billion," New York Times, January 20, 2016. |
| 26. |
The rehabilitation of the existing tunnel is estimated to cost another $1.8 billion, for a total project cost of $13 billion; costs estimates are in midpoint year-of-construction dollars. Federal Railroad Administration and New Jersey Transit, Hudson Tunnel Project Draft Environmental Impact Statement and Draft Section 4(f) Evaluation, June 2017, http://hudsontunnelproject.com/deis.html. |
| 27. |
For the Long Island Rail Road's East Side Access project. New Jersey Transit's Access to the Region's Core Project, which would have included new tunnels under the Hudson River, was recommended for a $3.0 billion grant, but the project was subsequently canceled by New Jersey. |
| 28. |
Federal Transit Administration, FY2019 Budget Estimate, p. FTA – 2, https://www.transportation.gov/sites/dot.gov/files/docs/mission/budget/304516/fta-fy-2019-final-cjs-508-compliant.pdf. |
| 29. | |
| 30. |
Faiz Siddiqui, "Regional Leaders Aim to Launch Metro Safety Commission by End of Year," Washington Post, July 23, 2017, https://www.washingtonpost.com/local/trafficandcommuting/regional-leaders-target-end-of-year-to-launch-metro-safety-commission/2017/07/23/6aa6aabe-6d75-11e7-b9e2-2056e768a7e5_story.html?utm_term=.ac21d1796992. |
| 31. |
Federal Transit Administration, "FTA Outlines Process to Transfer Safety Oversight of WMATA Metrorail from Federal Authority to the Metrorail Safety Commission," September 6, 2018, https://www.transit.dot.gov/about/news/fta-outlines-process-transfer-safety-oversight-wmata-metrorail-federal-authority. |