Statistics on Livestock Grazing on Federal Lands: FY2002 to FY2016
Livestock grazing on federal lands primarily occurs on lands of the Bureau of Land Management (BLM, in the Department of the Interior) and the Forest Service (FS, in the Department of Agriculture). Both agencies manage lands under sustained-yield and multiple-use principles, with livestock grazing among generally authorized uses. Congress continues to be interested in the extent to which BLM and FS lands are protected and used for a variety of activities, including livestock grazing. This report provides data on the extent of livestock grazing in recent years to assist with congressional deliberations on uses of federal lands generally and decisionmaking on the availability of lands for livestock grazing in particular.
This report generally provides data for 15 years, from FY2002 to FY2016, for four categories of livestock data. The four categories of data are similar but not identical between the agencies. The categories roughly correspond with the number of livestock operators, the number of grazing permits and leases held by these operators, how much grazing could have been authorized for use, and how much grazing was actually used.
Both agencies saw increases over the period in the amount of grazing used, based on the time livestock spent on the range. This time is measured in animal unit months (AUMs) for BLM and head months (HD-MOs) for FS. The increase in the amount of grazing was higher for BLM (5.2%) than for FS (1.1%).
For the other three categories of data, livestock grazing on BLM land was the same or somewhat less in FY2016 than in FY2002. FS saw relatively larger declines than BLM for these other three categories of livestock grazing. With regard to livestock operators, BLM started and ended the FY2002-FY2016 period with nearly the same number, with some fluctuation in between, whereas the number of FS livestock permittees decreased steadily from FY2006 to FY2016 and ended the period down 12.4%. Regarding the number of BLM permits and leases, there was a relatively small overall decline of 1.7% from FY2002 to FY2016. By contrast, the number of FS active permits decreased steadily from FY2006 to FY2016 and by a larger amount—12.5% overall. As for the amount of grazing that could have been used, BLM’s AUMs declined by 2.6% between FY2002 and FY2016, whereas FS’s HD-MOs declined by 18.4% over the same period.
The size of the change in livestock grazing on BLM and FS lands depends on the length of the period examined and the particular years of analysis. For instance, although AUMs used on BLM lands increased by 5.2% over the last 15 years, since 1954 there has been a 52.2% reduction in the number of AUMs—from 18.2 million to about 8.7 million.
Changes in grazing on BLM and FS lands nationally reflect a variety of different conditions on rangelands in diverse locations. The national changes can be attributed to various factors, including amendments to agency land use plans, resource protection needs and the long-term health of rangelands, the effect of weather (e.g., rain/drought) and fire on forage, voluntary nonuse by permit holders for a variety of reasons, and development on nearby private lands. The relative extent to which any one of these factors contributed to any national, regional, or local changes in grazing on federal lands is beyond the scope of this report.
Statistics on Livestock Grazing on Federal Lands: FY2002 to FY2016
Jump to Main Text of Report
Contents
- Introduction
- Data Information and Caveats
- BLM Livestock Grazing Data
- FS Livestock Grazing Data
- Discussion
Figures
- Figure 1. Livestock Operators and Grazing Permits/Leases on BLM Land, Change from FY2002 to FY2016
- Figure 2. AUMs in Force and Authorized on BLM Land, Change from FY2002 to FY2016
- Figure 3. Livestock Permittees and Active Permits on FS Land, Change from FY2006 to FY2016
- Figure 4. HD-MOs Under Permit and Authorized on FS Land, Change from FY2002 to FY2016
Summary
Livestock grazing on federal lands primarily occurs on lands of the Bureau of Land Management (BLM, in the Department of the Interior) and the Forest Service (FS, in the Department of Agriculture). Both agencies manage lands under sustained-yield and multiple-use principles, with livestock grazing among generally authorized uses. Congress continues to be interested in the extent to which BLM and FS lands are protected and used for a variety of activities, including livestock grazing. This report provides data on the extent of livestock grazing in recent years to assist with congressional deliberations on uses of federal lands generally and decisionmaking on the availability of lands for livestock grazing in particular.
This report generally provides data for 15 years, from FY2002 to FY2016, for four categories of livestock data. The four categories of data are similar but not identical between the agencies. The categories roughly correspond with the number of livestock operators, the number of grazing permits and leases held by these operators, how much grazing could have been authorized for use, and how much grazing was actually used.
Both agencies saw increases over the period in the amount of grazing used, based on the time livestock spent on the range. This time is measured in animal unit months (AUMs) for BLM and head months (HD-MOs) for FS. The increase in the amount of grazing was higher for BLM (5.2%) than for FS (1.1%).
For the other three categories of data, livestock grazing on BLM land was the same or somewhat less in FY2016 than in FY2002. FS saw relatively larger declines than BLM for these other three categories of livestock grazing. With regard to livestock operators, BLM started and ended the FY2002-FY2016 period with nearly the same number, with some fluctuation in between, whereas the number of FS livestock permittees decreased steadily from FY2006 to FY2016 and ended the period down 12.4%. Regarding the number of BLM permits and leases, there was a relatively small overall decline of 1.7% from FY2002 to FY2016. By contrast, the number of FS active permits decreased steadily from FY2006 to FY2016 and by a larger amount—12.5% overall. As for the amount of grazing that could have been used, BLM's AUMs declined by 2.6% between FY2002 and FY2016, whereas FS's HD-MOs declined by 18.4% over the same period.
The size of the change in livestock grazing on BLM and FS lands depends on the length of the period examined and the particular years of analysis. For instance, although AUMs used on BLM lands increased by 5.2% over the last 15 years, since 1954 there has been a 52.2% reduction in the number of AUMs—from 18.2 million to about 8.7 million.
Changes in grazing on BLM and FS lands nationally reflect a variety of different conditions on rangelands in diverse locations. The national changes can be attributed to various factors, including amendments to agency land use plans, resource protection needs and the long-term health of rangelands, the effect of weather (e.g., rain/drought) and fire on forage, voluntary nonuse by permit holders for a variety of reasons, and development on nearby private lands. The relative extent to which any one of these factors contributed to any national, regional, or local changes in grazing on federal lands is beyond the scope of this report.
Introduction
Livestock grazing on federal lands primarily occurs on public lands managed by the Bureau of Land Management (BLM, in the Department of the Interior) and on National Forest System lands managed by the Forest Service (FS, in the Department of Agriculture). Both agencies operate under statutory principles of multiple use and sustained yield,1 with livestock grazing among generally authorized uses. Both agencies also charge fees for grazing on agency lands under a fee formula established in the Public Rangelands Improvement Act of 1978 and continued administratively.2 However, the agencies administer livestock grazing on their lands through somewhat different processes.3 The other two major federal land management agencies, the National Park Service and the Fish and Wildlife Service, have limited authorities allowing livestock grazing on their lands. Accordingly, this report provides information for BLM and FS only.
The extent to which BLM and FS lands are protected and available for various land uses and activities is of perennial interest to Congress. Current congressional issues related to livestock grazing pertain to the fee level, terms and conditions of permits, and amount of grazing authorized, among other topics. This report provides data on the extent of livestock grazing in recent years to assist with congressional deliberations on uses of federal lands generally and availability of lands for livestock grazing in particular. It identifies factors that may have contributed to changes in the amount of livestock grazing over the past 15 years. However, it does not discuss the relative likelihood of any one of these factors to affect grazing trends at national, regional, or local levels.
Data Information and Caveats
This report generally provides data on livestock grazing for BLM and FS from FY2002 to FY2016. It reflects four livestock data categories that can indicate the amount of grazing on federal land. However, for two of the four categories, data for FS are provided only for FY2006-FY2016 because the accuracy of available data for FY2002-FY2005 for those two categories could not be confirmed.4 The four categories roughly correspond with
- the number of livestock operators,
- the number of grazing permits and leases held by these operators,
- how much grazing could have been authorized for use, and
- how much grazing was actually used.
The four categories are somewhat similar between the agencies, but the categories and terminology are not identical. For instance, whereas FS administers grazing through permits only, BLM authorizes grazing through both permits and leases.5 Also, both agencies authorize and bill for grazing in terms of livestock use and occupancy of the range for one month, under similar though not identical processes. The BLM measurement is referred to as animal unit months (AUMs), whereas FS uses the term head months (HD-MOs). As another example, those authorized to conduct grazing on BLM land—including individuals, groups, associations, or corporations—are referred to as livestock operators; on FS lands, they are referred to as permittees. Such differences are reflected in the titles of the data categories presented.
The four categories presented here do not reflect all potential indicators of livestock grazing that might be helpful in assessing changes over the specified time range, such as annual acreage of land available and used for livestock grazing. Although acreage statistics over time are not readily available, in recent years BLM has had more land available and used for livestock grazing than FS. For instance, in FY2015, BLM managed a total of 248.3 million acres, of which 154.8 million (62.3%) were available for livestock grazing and 138.8 million (55.9%) were used for grazing. By comparison, in FY2015, FS managed a total of 192.9 million acres, of which more than 95.0 million (49.2%) were available for grazing and 77.3 million (40.1%) were used for grazing.6
Table 1, Figure 1, and Figure 2 provide data for BLM. In Table 1, the first column essentially reflects the number of individuals or entities authorized to graze livestock on BLM lands. However, operators with multiple permits or leases for the same kind of livestock may be counted multiple times, thus overrepresenting the number of operators. The second column shows the number of grazing permits and leases held by these operators; some operators hold more than one permit or lease. The third column, on AUMs in force, reflects the number of AUMs that could have been authorized for use. The fourth column, AUMs authorized, reflects the number of AUMs actually used and billed for.
Table 2, Figure 3, and Figure 4 provide data for FS. In Table 2, the first column reflects the number of individuals or entities that had active grazing permits and could have been authorized to graze. The second column reflects the number of permits held by these permittees. The third column shows the permitted HD-MOs of grazing that could have been authorized for use. The fourth column reflects the number of HD-MOs authorized to graze and billed for.
For both agencies, the tables and figures show increases in grazing used over the period examined, as measured by the amount of time livestock spent on the range. For the other three categories of data, livestock grazing on BLM land was the same or somewhat less in FY2016 than in FY2002. FS had relatively larger declines over the years examined for the other three categories of livestock grazing.
BLM Livestock Grazing Data
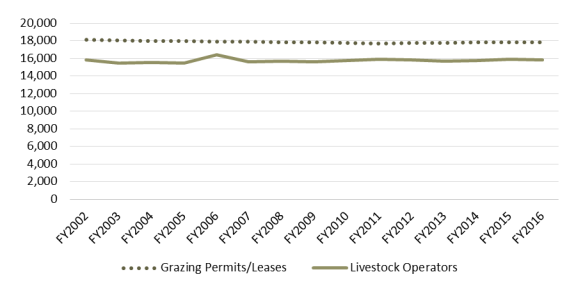
BLM livestock grazing data across all four categories examined remained relatively constant between FY2002 and FY2016. As shown in Table 1, column 1, the number of operators authorized to graze livestock on BLM land was nearly identical in FY2002 and FY2016, the first and last years of the period examined. The average number of operators annually was 15,755. During the 15-year period, the highest number of operators was 16,416 in FY2006, the only year in which the figure exceeded 16,000. There was a difference of 954 between this high year and the lowest level of 15,462 in FY2005.
|
Livestock Operators |
Grazing Permits/Leases |
AUMs in Force |
AUMs Authorized |
|
|
FY2002 |
15,851 |
18,142 |
12,697,367 |
8,287,394 |
|
FY2003 |
15,472 |
18,021 |
12,643,498 |
7,493,419 |
|
FY2004 |
15,544 |
17,962 |
12,689,124 |
7,574,004 |
|
FY2005 |
15,462 |
17,940 |
12,701,077 |
7,816,949 |
|
FY2006 |
16,416a |
17,880 |
12,634,580 |
8,515,292 |
|
FY2007 |
15,587 |
17,874 |
12,589,698 |
8,546,253 |
|
FY2008 |
15,682 |
17,812 |
12,526,006 |
8,531,813 |
|
FY2009 |
15,612 |
17,829 |
12,483,175 |
8,594,912 |
|
FY2010 |
15,751 |
17,740 |
12,435,157 |
8,673,822 |
|
FY2011 |
15,897 |
17,694 |
12,387,749 |
8,985,228 |
|
FY2012 |
15,815 |
17,729 |
12,393,414 |
8,781,600 |
|
FY2013 |
15,698 |
17,737 |
12,363,926 |
8,428,929 |
|
FY2014 |
15,787 |
17,792 |
12,400,988 |
8,322,058 |
|
FY2015 |
15,900 |
17,799 |
12,365,877 |
8,573,518 |
|
FY2016 |
15,852 |
17,830 |
12,363,602 |
8,722,209 |
|
Difference Between FY2002 and FY2016 |
0.0% |
-1.7% |
-2.6 |
+5.2% |
|
Average from FY2002 to FY2016 |
15,755 |
17,852 |
12,511,683 |
8,389,827 |
Sources: Table by CRS, with data from the Department of the Interior, Bureau of Land Management (BLM), Public Land Statistics, annual volumes, at https://www.blm.gov/about/data/public-land-statistics. In general, data for grazing permits/leases and AUMs in force were taken from the volume for the fiscal year indicated, whereas data for livestock operators and AUMs authorized were taken from the volume for the following fiscal year. However, for FY2008, the number of livestock operators was taken from the FY2008 volume, due to a potential error in the FY2009 source. Also, all data for FY2016 were taken from the FY2016 volume, because this is the most recent available.
Notes: AUM = animal unit month. For fee purposes, BLM defines an AUM as a month's use and occupancy of the range by one animal unit, which includes one yearling, one cow and her calf, one horse, or five sheep and goats.
In each column, the high figure is shown in bold and the low figure is shown in italics.
The first column essentially reflects the number of individuals and entities authorized to graze livestock on BLM land. However, operators with multiple permits or leases for the same kind of livestock may be counted multiple times in the figures, thus overrepresenting the number of operators. The second column shows the number of grazing permits and leases held by these operators; some operators hold more than one permit or lease. The third column, on AUMs in force, reflects the number of AUMs that could have been authorized for use. The fourth column reflects the number of AUMs actually used and billed for.
a. This figure of 16,416 operators is taken from the FY2007 volume of Public Land Statistics, in keeping with the general data sources and methods for this column. However, the FY2006 edition of Public Land Statistics contains a figure of 15,799 operators for FY2006. It is unclear why the two volumes contain such different figures for FY2006 and whether a consistent methodology of tabulating and reporting the FY2006 figures was used.
As shown in Table 1, column 2, the number of permits and leases held by livestock operators was 1.7% lower in FY2016 than in FY2002.7 During the 15-year period, the greatest number of permits and leases was 18,142 in FY2002. There was a difference of 448 between that high year and the lowest year during the period—FY2011—when there were 17,694 permits and leases. The average number of permits and leases was 17,852 annually.
Figure 1 illustrates the changes in the numbers of BLM livestock operators and grazing permits and leases from FY2002 to FY2016. During the first 10 years (FY2002-FY2011), permits and leases declined fairly steadily and by 2.5% overall, as noted. They rose by 0.6% during the last five years (FY2012-FY2016).
|
Figure 1. Livestock Operators and Grazing Permits/Leases on BLM Land, Change from FY2002 to FY2016 |
 |
|
Sources: Figure by CRS, with data from the Department of the Interior, Bureau of Land Management (BLM), Public Land Statistics, annual volumes, at http://www.blm.gov/public_land_statistics/index.htm. In general, data for grazing permits/leases were taken from the volume for the fiscal year indicated, whereas data for livestock operators were taken from the volume for the following fiscal year. However, for FY2008, the number of livestock operators was taken from the FY2008 volume, due to a potential error in the FY2009 source. Also, all data for FY2016 were taken from the FY2016 volume, because this is the most recent available. Notes: "Livestock operators" essentially reflects the number of individuals and entities authorized to graze livestock on BLM land. However, operators with multiple permits or leases for the same kind of livestock may be counted multiple times, thus overrepresenting the number of operators. "Grazing permits/leases" reflects the number of permits and leases held by livestock operators. Some operators hold more than one permit or lease. |
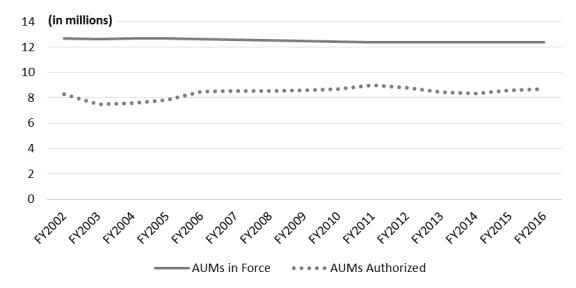
BLM authorizes grazing permits and leases in terms of AUMs, as noted above.8 Columns 3 and 4 of Table 1 provide data on AUMs. Figure 2 illustrates the changes in the numbers of AUMs in force and AUMs authorized for BLM lands. As shown in column 3 of the table, AUMs of grazing in force—reflecting AUMs that could have been authorized for use—have gradually decreased and were 2.6% less in FY2016 than in FY2002. The highest level of AUMs in force was 12.7 million in FY2005, for a difference of 337,475 between this year and the low of 12.4 million in FY2016. The average AUMS in force over the 15 years was 12.5 million. In each of the first seven years (FY2002-FY2008), AUMs in force ranged between approximately 12.5 million and 12.7 million annually. Since then, the annual totals have dropped to between 12.3 million and 12.5 million.
As shown in column 4 of Table 1, the number of AUMs that were actually authorized and billed for has varied over time and was 5.2% higher in FY2016 than in FY2002. This was the largest percentage difference of all four BLM data categories examined. AUMs authorized reached a high of nearly 9.0 million in FY2011. There was a difference of 1.5 million between this high and the period low of 7.5 million in FY2003. Over the 15 years, the average AUMs authorized each year was 8.4 million. As shown in Figure 2, authorized AUMs were lowest during the first four years (FY2002-FY2006), when they were below 8.3 million each year. Since then, the figures have fluctuated between 8.3 million and 9.0 million annually.
|
Figure 2. AUMs in Force and Authorized on BLM Land, Change from FY2002 to FY2016 |
 |
|
Sources: Figure by CRS, with data from the Department of the Interior, Bureau of Land Management (BLM), Public Land Statistics, annual volumes, at http://www.blm.gov/public_land_statistics/index.htm. In general, data for AUMs in force were taken from the volume for the fiscal year indicated, whereas data for AUMs authorized were taken from the volume for the following fiscal year. For FY2016, both categories of data were taken from the FY2016 volume, because this is the most recent available. Notes: AUM = animal unit month. For fee purposes, BLM defines an AUM as a month's use and occupancy of the range by one animal unit, which includes one yearling, one cow and her calf, one horse, or five sheep and goats. "AUMs in force" reflects the number of AUMs that could have been authorized for use. "AUMs authorized" reflects the number of AUMs actually used and billed for. |
FS Livestock Grazing Data
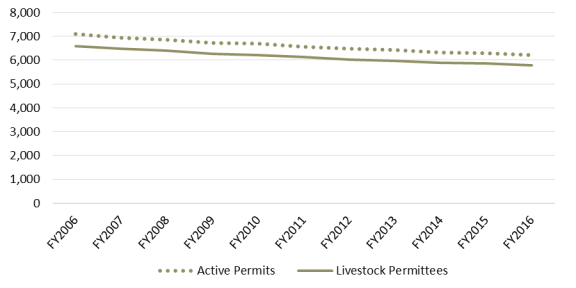
As noted above, FS data are provided for 15 years for two categories of livestock data but for 11 years for two other categories due to uncertainty about the reliability of earlier data. As shown in Table 2, column 1, the number of livestock permit holders allowed to graze commercial livestock on FS land was 12.4% lower in FY2016 than in FY2006. In fact, in FY2006, the most permittees were allowed to graze—6,598—whereas in FY2016 the fewest were allowed to graze—5,779. There was a difference of 819 between these high and low years. The average number of permittees throughout the 11 years was 6,146 annually.
|
Livestock Permittees |
Active Permits |
HD-MOs Under Permit |
HD-MOs Authorized |
|
|
FY2002 |
N/A |
N/A |
10,102,436 |
6,809,388 |
|
FY2003 |
N/A |
N/A |
9,320,029 |
5,936,232 |
|
FY2004 |
N/A |
N/A |
8,452,840 |
5,784,110 |
|
FY2005 |
N/A |
N/A |
9,432,572 |
6,806,797 |
|
FY2006 |
6,598 |
7,095 |
8,205,320 |
5,800,995 |
|
FY2007 |
6,479 |
6,947 |
8,410,754 |
6,110,070 |
|
FY2008 |
6,401 |
6,863 |
8,505,933 |
6,796,581 |
|
FY2009 |
6,264 |
6,718 |
8,476,128 |
5,099,311 |
|
FY2010 |
6,214 |
6,689 |
8,860,977 |
7,265,466 |
|
FY2011 |
6,123 |
6,560 |
8,425,451 |
6,979,735 |
|
FY2012 |
6,027 |
6,471 |
8,398,991 |
7,079,047 |
|
FY2013 |
5,975 |
6,420 |
8,416,419 |
6,557,177 |
|
FY2014 |
5,892 |
6,332 |
8,374,111 |
6,687,150 |
|
FY2015 |
5,851 |
6,300 |
8,478,832 |
6,937,876 |
|
FY2016 |
5,779 |
6,211 |
8,243,953 |
6,884,934 |
|
Difference Between First Year and FY2016 |
-12.4% |
-12.5% |
-18.4% |
+1.1% |
|
Average from First Year to FY2016 |
6,146 |
6,601 |
8,673,650 |
6,502,325 |
Sources: Table by CRS, with data from the following sources. For column 1 and column 2: Forest Service (FS), personal communication with CRS, August 2, 2017. For column 3 and column 4: Department of Agriculture, FS, Grazing Statistical Summary, annual volumes, at http://www.fs.fed.us/rangelands/reports/index.shtml.
Notes: N/A = not available because of uncertainty about the reliability of the data. HD-MO = head month. FS defines head month as the time in months that livestock spend on National Forest System land.
In each column, the high figure is shown in bold and the low figure is shown in italics.
The first column reflects the number of individuals or entities that had active grazing permits and could have been authorized to graze. The second column reflects the number of permits held by these permittees. The third column shows the permitted HD-MOs of grazing that could have been authorized for use. The fourth column reflects the number of HD-MOs authorized to graze and billed for.
Figure 3 illustrates the changes in the numbers of FS livestock permittees and active permits from FY2006 to FY2016. As shown in Figure 3, the number of permittees declined steadily throughout the 11-year period.
From FY2006 to FY2016, the number of active permits showed trends similar to those for the number of permit holders (see Table 2, column 2). For instance, the number of active permits was 12.5% lower in FY2016 than in FY2006. In addition, the highest level was reached in FY2006, when there were 7,095 active permits, and the lowest level occurred in FY2016, when there were 6,211. There was a difference of 884 between these high and low years. The number of active permits averaged 6,601. As with the number of permittees, the number of active permits decreased steadily over the 11-year period, as shown in Figure 3.
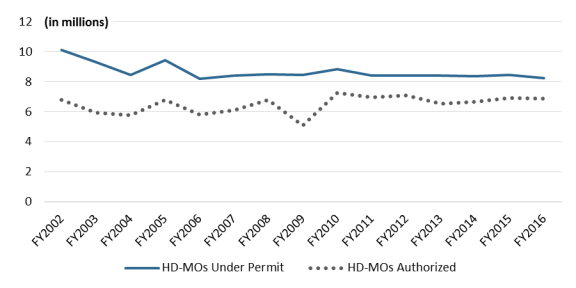
As noted above, FS administers grazing in terms of HD-MOs, defined as the time in months that livestock spend on FS land. Columns 3 and 4 of Table 2 provide data on HD-MOs. Figure 4 illustrates the changes in the numbers of HD-MOs under permit and HD-MOs authorized from FY2002 to FY2016. As shown in column 3 of Table 2, the number of HD-MOs under permit—the maximum number that could have been authorized for use—was 18.4% less in FY2016 than in FY2002. This was the largest change in the FS data categories examined. There was a high of 10.1 million HD-MOs under permit in FY2002 and a low of 8.2 million in FY2006, a difference of nearly 1.9 million. The average number of HD-MOs under permit was 8.7 million annually. There was significant annual variation in the data, particularly during the first four years of the 15-year period, as shown in Figure 4.
The number of HD-MOs that were actually authorized and billed for was 1.1% higher in FY2016 than in FY2002 (see column 4 of Table 2). Over the 15 years, HD-MOs ranged from a high of 7.3 million in FY2010 to a low of 5.1 million in FY2009, a difference of 2.2 million. Although the average was 6.5 million per year, the number of HD-MOs authorized varied widely over the period, as shown in Figure 4. During the first several years (FY2002-FY2009), the figures averaged 6.1 million annually. Since FY2010, the average has increased to 6.9 million annually.
|
Figure 4. HD-MOs Under Permit and Authorized on FS Land, Change from FY2002 to FY2016 |
 |
|
Sources: Figure by CRS, with data from the Department of Agriculture, Forest Service (FS), Grazing Statistical Summary, annual volumes, at http://www.fs.fed.us/rangelands/reports/index.shtml. Notes: HD-MO = head month. FS defines head month as the time in months that livestock spend on National Forest System land. "HD-MOs under permit" reflects the permitted HD-MOs of grazing that could have been authorized for use. "HD-MOs authorized" reflects the number of HD-MOs authorized to graze and billed for. |
Discussion
There are similarities in the BLM and FS livestock data over the 15-year period examined.9 For instance, both agencies had more grazing permits than livestock operators or permittees, because some operators and permittees held more than one permit. Also, both agencies had considerably higher levels of grazing that could have been authorized for use than were actually used. The AUMs and HD-MOs actually used for grazing were likely less than the potential maximum due to voluntary nonuse for economic and other reasons, resource-protection needs, and forage depletion caused by drought and fire, among other reasons.
In other ways, BLM and FS livestock grazing differed. As an example, BLM had higher levels of livestock grazing than FS in all four data categories. This difference is in part because BLM manages more acres of land generally and more acres of land for livestock grazing specifically than FS, as noted above.
During the period of analysis, the agencies also experienced different patterns and amounts of change in the four categories of data. The amount of grazing used increased for both agencies from FY2002 to FY2016, but the increase was higher for BLM (5.2%) than for FS (1.1%). Grazing use was based on the amount of time livestock spent on the range, as measured in AUMs or HD-MOs.
For the other three categories of data, there were either no changes or relatively small declines for BLM, whereas FS saw relatively larger decreases. With regard to the number of livestock operators, BLM started and ended the FY2002-FY2016 period with nearly the same level, with some fluctuation in between; by contrast, FS livestock permittees decreased steadily from FY2006 to FY2016 and ended the period down 12.4%. With regard to BLM permits and leases, there was a decrease over several years followed by a slight increase, with a 1.7% overall decline over the 15-year period. By contrast, FS active permits decreased steadily from FY2006 to FY2016 and by a larger amount—12.5% overall. With regard to the amount of grazing that could have been used, the BLM's AUMs declined between FY2002 and FY2016 by 2.6%, whereas FS's HD-MOs ended the same period down by 18.4%.
The size of the change in livestock grazing on BLM and FS lands depends in part on the length of the period examined. For example, although AUMs used on BLM lands increased by 5.2% over the last 15 years, over the past several decades they declined significantly—about 52.2% from the 1954 level of 18.2 million AUMs. The size of the change also depends on the particular start and end years chosen. For instance, since FY2002, the HD-MOs that could have been authorized on FS lands have declined by 18.4%. However, since FY2006, they have increased by 0.5%.
Changes in grazing on BLM and FS land nationally reflect a variety of different conditions on rangelands in diverse locations. No analysis was made for this report as to the extent of variation on particular rangelands in specific states or regions. Similarly, no examination was made of the effect of change in particular areas on the national levels reflected in this report.
The specific factors that influenced each annual change in grazing nationally were not analyzed for this report. However, national grazing changes identified herein can be attributed to a variety of factors, including amendments to agency land use plans to accommodate other land uses, such as increased recreation. Resource protection needs, typically for water and wildlife resources, also can affect the timing and the amount of grazing. Forage depletion caused by drought or fire can reduce the amount of grazing, and significant rainfall can augment the availability of forage. More generally, matching forage production with livestock production for the long-term health of the rangeland is a factor affecting grazing in some areas. Another factor is voluntary nonuse by ranchers for a variety of reasons, including market, lifestyle, conservation, and others, as in the case of ranchers who use or sell their land for other purposes. Development of nearby private land also can influence grazing on federal land, for example, by impacting the free flow of livestock between ownerships.
Author Contact Information
Footnotes
| 1. |
For the Bureau of Land Management (BLM), the Federal Land Policy and Management Act of 1976 (43 U.S.C. §§1701 et seq.). For the Forest Service (FS), the Multiple-Use Sustained Yield Act of 1960 (16 U.S.C. §§528-531). |
| 2. |
43 U.S.C. §§1901, 1905. Executive Order 12548, "Grazing Fees," 51 Federal Register 5985, February 19, 1986. These authorities govern grazing on BLM and FS lands in 16 contiguous western states. FS grasslands and "nonwestern" states have different fees. |
| 3. |
BLM regulations governing livestock grazing are at 43 C.F.R. 4100, and FS regulations are at 36 C.F.R. 222. For information on fees for livestock grazing on BLM and FS lands, see CRS Report RS21232, Grazing Fees: Overview and Issues, by [author name scrubbed]. |
| 4. |
For FY2002-FY2005, some of the FS data appear to have been defined, compiled, and presented differently in public sources than for subsequent fiscal years. Moreover, although data for both agencies for the four categories are available for years prior to FY2002, data for these earlier years also are not reflected in this report due to perceived differences in how they were defined, compiled, and reported in public documents. |
| 5. |
For BLM, permits are used for lands within grazing districts (under §3 of the Taylor Grazing Act, 43 U.S.C. §315b). Leases are used for lands outside grazing districts (under §15 of the Taylor Grazing Act, 43 U.S.C. §315m). In this report, permits is sometimes used to cover both BLM permits and BLM leases. |
| 6. |
The FY2015 figures on acreage used for livestock grazing are the most recent available, and thus FY2015 figures are presented here. |
| 7. |
The number of permits and leases is higher than the number of livestock operators because some operators hold more than one permit or lease. |
| 8. |
For fee purposes, BLM defines an animal unit month (AUM) as a month's use and occupancy of the range by one animal unit, which includes one yearling, one cow and her calf, one horse, or five sheep and goats. |
| 9. |
This discussion is generally based on 15 years of data. However, it is based on two categories of FS data for 11 years only, as noted above. It is likely that the changes over time and variation between the agencies would be different if the same number of years were compared for all data categories. |