Harbor Dredging: Issues and Historical Funding
Congress is debating whether to support increased funding for dredging to better maintain harbor channel depths and widths. A bill passed by the House (H.R. 2440) seeks to boost dredging activity by utilizing more of the collections from a port tax levied to fund harbor maintenance. However, it is not clear whether the additional funding would increase the volume of material dredged from U.S. harbors, as a variety of factors affect the cost and performance of harbor dredging. In contrast to the House bill, in S. 2470 the Senate Committee on Appropriations recommends a Gulf Coast demonstration program addressing concerns about dredging cost and availability. According to S.Rept. 116-102, among other goals, the program should reduce the number of contract solicitations that lead to no bids or bids that are more than 25% higher than the government cost estimate and should reduce the cost per cubic yard for hopper dredge contracts.
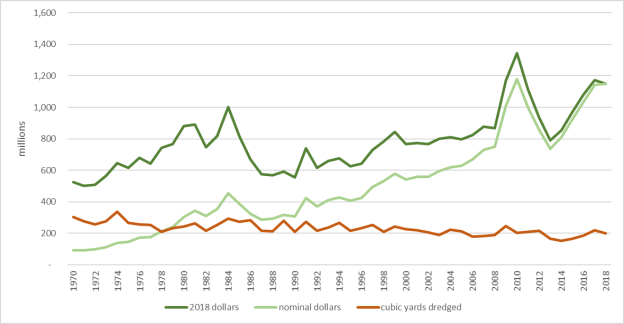
Data from the U.S. Army Corps of Engineers (USACE), the agency responsible for federal harbor maintenance, indicate that the amount of material dredged has declined slightly from FY1970 to FY2018 even though inflation-adjusted spending on harbor maintenance dredging has increased significantly (Figure 1).
|
Figure 1. Federal Harbor Maintenance Funding (fiscal years) |
 |
|
Source: USACE Navigation Data Center, "Actual Dredging Cost Data for 1963-2018." Notes: 2005-2012 includes hurricane supplemental work, 2009-2012 includes P.L. 111-5 (ARRA) amounts. 2018 dollars calculated using "nondefense" deflator, Table 10.1 in Federal Budget at https://www.whitehouse.gov/omb/historical-tables/. |
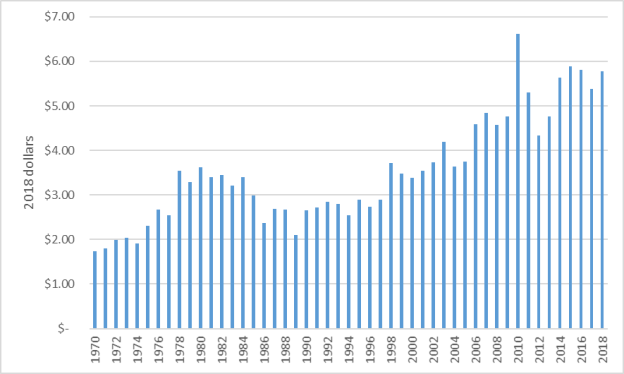
Looked at another way (Figure 2), the average annual cost per cubic yard of dredged material for harbor maintenance, adjusted for inflation, has risen from $1.74 in 1970 to $5.77 in 2018, an increase of 232%. The unit cost has been fairly steady since FY2014.
|
Figure 2. Cost Per Cubic Yard for Harbor Maintenance Dredging (inflation adjusted) |
 |
|
Source: USACE Navigation Data Center, "Actual Dredging Cost Data for 1963-2018." Notes: 2018 dollars calculated using "nondefense" deflator, Table 10.1 in Federal Budget at https://www.whitehouse.gov/omb/historical-tables/. |
Multiple factors are believed to have contributed to the increased cost per cubic yard: changes in dredged material disposal, mobilization costs, cost inflation of inputs (fuel and steel), environmental factors, and relatively little competition for dredging contracts. The relative significance of each is unclear. Old disposal sites can be full and newer ones more distant. Unknown is whether enactment of P.L. 104-303 (§§201, 207, 217) in 1996 led to more federal dollars being used to build and maintain disposal facilities, treat contaminated sediments, transport dredged material further for beneficial uses such as restoring wetlands and beaches, and paying for disposal tipping fees. One dredge firm states it has performed many contracts that have required more nondredge work (such as upland disposal and environmental remediation) than dredging. The largest domestic marine dredge firm states that upland disposal can be as much as 90% of total project cost. Mobilization and demobilization of the several vessels typically required for a dredge project can be more than one-third of project cost. To protect endangered species such as sea turtles, dredging firms might have to employ fishing trawlers or restrict dredging and dredged material disposal to winter months when bad weather raises costs.
Costs per cubic yard vary greatly among USACE districts, indicating that local circumstances are relevant (Table 1).
Table 1. Average Unit Cost of Dredging by Selected USACE District
(contracts >100,000 cubic yards, 2014 to 2018)
|
USACE District |
Cubic Yards Dredged |
Cost per Cubic Yard |
|
San Francisco |
5,398,939 |
$ 24.27 |
|
New York |
11,908,916 |
$ 23.17 |
|
Philadelphia |
6,037,757 |
$ 19.93 |
|
Jacksonville |
22,447,059 |
$ 14.86 |
|
Los Angeles |
1,283,153 |
$ 13.20 |
|
Detroit |
3,064,310 |
$ 9.40 |
|
Alaska |
5,550,057 |
$ 8.58 |
|
Savannah |
37,140,202 |
$ 6.52 |
|
Portland (OR) |
30,983,332 |
$ 5.29 |
|
Galveston |
76,646,189 |
$ 3.80 |
|
New Orleans |
105,894,803 |
$ 2.62 |
Source: CRS, using USACE Dredging Information Statistics at https://publibrary.planusace.us/#/series/Dredging%20Information.
In 1978 (P.L. 95-269), Congress directed the USACE to contract out dredging work to private firms whenever possible in order to expand the private dredging fleet and encourage increased competition. Foreign firms and foreign-built dredges are prohibited in U.S. waters. While many firms bid for USACE dredging projects, most individual projects draw few bidders. USACE data indicate that of the 701 dredging contracts the agency awarded from 2014 to 2018, 295 (42%) were sole-bid contracts and 178 (25%) attracted two bidders. However, the accuracy of the USACE's figures is disputed. A 2015 Government Accountability Office audit found the USACE dredging contracts database to be incomplete and contain inaccurate information, but a dredging firm contends the USACE maintains the most complete budget and cost data.
According to the USACE, hopper dredges are generally the most efficient vessels for dredging coastal harbors. Four firms own 99% of U.S. hopper dredging capacity and accounted for 59% of all USACE dredging contracts by dollar value from 2014 to 2018. This private hopper dredge fleet is relatively old, with 11 of the 15 vessels in service for more than 20 years. The USACE owns four hopper dredges employed for emergency work or when submitted bids are more than 25% above the USACE's estimated cost. A study for the State of Louisiana, published in 2011, found dredging costs have trended downward in foreign markets. One reason foreign firms may have a cost advantage is their use of semi-submersible heavy-lift ships to transport their dredge fleets. U.S. dredging firms would be required by law to use a U.S.-built heavy-lift ship for transport, but none exist. The need to tow individual vessels to job sites likely raises U.S. firms' costs.
The USACE reports that it is unable at times to schedule as much dredging as desired due to the limited capacity of the U.S. fleet. The USACE asserts that the number of times it has had to use its own dredges demonstrates that the current industry fleet cannot meet surge needs. Shippers using the Mississippi River entrance channel contend a shortage of dredges has resulted in a deficient channel. By way of comparison, four individual European firms each have a hopper fleet capacity three to four times that of all U.S. dredging firms combined.