Introduction
Economic growth and expanded global trade have led to substantial increases in goods movement over the past few decades. The growth in freight transportation demand, along with growing passenger demand, has caused congestion in parts of the transportation system, making freight movements slower and less reliable. Because the condition and performance of freight infrastructure play a considerable role in the efficiency of the freight system, federal support of freight infrastructure investment is likely to be of significant congressional concern in the reauthorization of the surface transportation program. The program is currently authorized by the Fixing America's Surface Transportation Act (FAST Act; P.L. 114-94), which is scheduled to expire on September 30, 2020.
Congress has begun to place greater emphasis on freight over the course of recent reauthorizations, but national policy is still vague or silent on a number of issues. There are ongoing disagreements about the best way to accomplish improvements in freight system infrastructure—notably, how to raise new funds for investment, the magnitude of the amounts required, which projects to prioritize, and the role of the federal government in the planning process. Meanwhile, technological advances in mobility have prompted new questions about how best to accomplish the efficient movement of people and goods in a multimodal transportation system. Autonomous vehicle technology could have potential applications in the trucking industry, as could greater deployment of automation in the rail and port industries.
While the FAST Act concerns many aspects of surface transportation funding and safety policy, the focus of this report is on truck freight and that portion of the rail and port industries that transports truck trailers and containers (intermodal freight). This report does not address operational issues that also may be of interest during reauthorization, such as hours of service and hazardous material transport safety. Moreover, this report does not contain in-depth discussion of environmental issues associated with freight movements, such as carbon emissions and climate change, or air and noise pollution, though these issues may be germane to the topics of funding and project selection.
The Freight Transportation System
The freight transportation system is a complex network of different types of transportation, known as modes, that carries everything from coal to small packages. It handles domestic shipments of a few miles as well as international shipments of thousands of miles. Often, a shipment of cargo will move across multiple modes before reaching its destination, using road, rail, air, pipeline, and/or maritime infrastructure in the process; when freight changes modes in this way, it is referred to as multimodal. Freight moved in stackable containers is easier to move among ships, trains, and trucks; this is referred to as intermodal freight.
Rail alone carries the second-largest share of domestic freight measured in ton-miles, but only a small proportion by value (Table 1), reflecting the fact that major rail cargos such as coal and grain have low ratios of value to weight. Trucks carry by far the most freight by value but a smaller proportion of ton-miles, as the average truck shipment travels a much shorter distance than the average rail shipment. Air transportation is a relatively minor mode for domestic shipments because it is expensive to ship goods by air. The proportions for international shipments to and from the United States are quite different from those for domestic shipments, with about three-quarters of goods, measured by weight, arriving or departing by ship. Measured by value, nearly one-fourth of U.S. international freight moves by air.1
|
Mode of Transport |
% of Total Value |
% of Total Tons |
% of Total Ton-Miles |
Average Miles per Shipment |
|
Truck |
73% |
72% |
42% |
188 |
|
Rail |
1% |
9% |
27% |
554 |
|
Air |
3% |
<1% |
<1% |
1,437 |
|
Parcel, U.S. Postal Service, Courier |
14% |
<1% |
1% |
890 |
|
Truck and Rail |
3% |
5% |
18% |
1,140 |
|
Pipeline |
3% |
7% |
NA |
NA |
|
Water |
1% |
5% |
6% |
225 |
Sources: U.S. Department of Transportation, Bureau of Transportation Statistics (BTS), and U.S. Census Bureau, 2017 Commodity Flow Survey, Preliminary Tables, December 2018.
Notes: One ton-mile is equal to one ton of freight transported one mile (a measure of both weight and distance). Figures do not total to 100% due to shipments by other multiple modes and due to rounding. "NA" indicates that data are not available.
Trucks operate over a four-million-mile system of public access highways and streets. Of this, approximately 209,000 miles has been designated by the Federal Highway Administration (FHWA) as the "National Truck Network," a network of highways able to accommodate large trucks. This network includes the Interstate Highway system, which extends approximately 47,000 miles, plus principal arterial highways designated by the states.2 Trucks account for about 9% of vehicle miles traveled on the entire U.S. road system, but 15% of vehicle miles on Interstates and 24% on rural Interstates.3
The railroad sector is dominated by seven large railroads, or Class I carriers, that generally focus on long-distance moves. The Class I railroads are complemented by more than 500 short line and regional railroads (Class II and Class III, respectively) that tend to haul freight shorter distances, provide connections between the Class I networks, or connect the Class I networks and ports. For the most part, railroad infrastructure, including track and associated structures and the land they occupy, is owned by the carriers themselves. The U.S. railroad network consists of approximately 140,000 miles of railroad, of which approximately 94,000 miles could be considered transcontinental or mainline railroad and 46,000 miles could be considered regional or local railroad. In some places, freight trains share space with intercity and commuter passenger trains.
The Flow of Freight
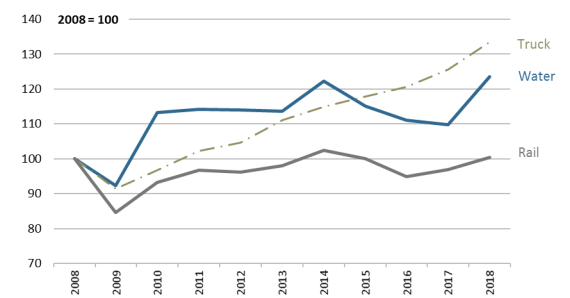
Overall, freight traffic has recovered to the level prior to the 2007-2009 recession, but the modal composition of freight traffic is now quite different (Figure 1). While truck tonnage has risen steadily and is now 33% higher than a decade ago, rail tonnage dropped sharply in 2008-2009 and has recovered more slowly. Increased intermodal traffic has offset declining volumes of coal and crude oil shipped by rail. Barge traffic on inland waterways recovered from recession lows in 2010, but since then has grown only slightly.
|
Figure 1. Freight Tonnage Relative to 2008 Levels, by Selected Modes Indexed Annual Average of Seasonally Adjusted Monthly Tonnage |
 |
|
Source: Bureau of Transportation Statistics Seasonally Adjusted Transportation Data, https://www.transtats.bts.gov/osea/seasonaladjustment/. Notes: "Truck" and "Water" are tonnage indices. "Rail" is the sum of carloads and intermodal units as reported to BTS by the Association of American Railroads (AAR). |
Truck, Train, and Intermodal Freight
The steady growth in truck traffic, which includes smaller delivery trucks in addition to tractor-trailer "combination" trucks, has been linked to the growth of e-commerce establishments and just-in-time delivery services. As companies push to offer quicker delivery, they are opening new distribution centers in urban areas. These centers depend on large trucks to replenish inventory, and on small trucks to quickly deliver products to consumers.
Coal has been the most significant revenue source for the rail industry aside from intermodal traffic, and the decline in rail traffic reflects a general decline in demand for coal. Since 2011, the volume of coal carried by railroads has declined significantly despite rebounding slightly in 2017. This decline has been mitigated somewhat by an increase in intermodal traffic, and by more short-lived booms in other commodity groups. A spike in oil production and a shortage of pipeline capacity contributed to a bump in rail shipments from 2012 to 2016, but the quantity of oil moved by rail has since receded. Crude industrial sand, which includes sand used in hydraulic fracturing of oil and gas wells, saw a similar rise and fall in that period before spiking again in 2017.
Tonnage carried by trucks as a single mode has increased a modest 2% over the past decade. Meanwhile, tonnage moving only by rail has decreased 16%, due largely to a significant decline in coal shipments. Most of the growth in surface freight has occurred in intermodal tonnage (mainly involving combined truck/rail shipment), which has increased by 188% in 10 years.4
The U.S. Department of Transportation (DOT) forecasts that domestic freight tonnage will increase by an average of about 1.4% per year from 2015 to 2045. In that span, truck tonnage is projected to increase by 38%, rail tonnage by 20%, and multimodal tonnage (of which intermodal is a subset) by 120%.5 Overall, this would represent an acceleration compared to recent trends. Freight tonnage in the United States grew at an average annual rate of 1.1% from 1993 to 2017, with truck tonnage growing slightly faster (1.4%) in that period. By contrast, DOT forecasts truck tonnage to grow more slowly than total tonnage over the coming decades.6
Maritime Freight
River and coastal ports are hubs for considerable truck and rail activity, making the road and rail links to these facilities an important component of surface transportation infrastructure. Over the last two decades, barge traffic on inland rivers has been flat or declining.7 Meanwhile, the volume of containerized cargo grew rapidly from 17.9 million twenty-foot equivalent units (TEUs) in 2000 to 32.0 million TEUs in 2015. Container traffic declined during the 2007-2009 recession but has since recovered. In 2018 it was approximately 40% above its 2009 low.
The Ports of Los Angeles and Long Beach together handled 29.9% of all container traffic at ocean ports in the United States in 2017. Container trade at these two ports increased by 64% between 2000 and 2017, but was outpaced by the growth in container trade for the entire United States, which grew by 106%.8 Congress has requested studies on the condition of road and rail links to ports (also known as intermodal connectors) in past surface transportation reauthorization legislation. The most recent study by DOT indicates that of the approximately 1,484 miles of freight intermodal connectors in the National Highway System, roughly half are two lanes wide.9
Certain port projects are eligible for funding from surface transportation programs, including the BUILD10 and INFRA11 competitive grant programs discussed later in this report, but eligibility reflects a primary concern with the intermodal connections to these facilities. Most capital programs to benefit marine transportation, such as harbor dredging and lock repair, are undertaken by other federal agencies, notably the U.S. Army Corps of Engineers, rather than by DOT. Historically, these programs have not been included in surface transportation legislation.
Evolution of National Freight Transportation Policy
Until recently, there was no separate federal freight transportation program, but instead a relatively loose collection of freight-related programs that were embedded in a larger surface transportation program aimed at supporting both passenger and freight mobility. Historically, most highway funding has been distributed to the states via several large "core" formula programs, leaving states to decide how to use their allocated funds. Other, smaller programs provide grant awards for more targeted projects. The Safe, Accountable, Flexible, Efficient Transportation Equity Act: A Legacy for Users (SAFETEA; P.L. 109-59), which was enacted in 2005 and expired in 2012 after a series of extensions, funded over 70 highway programs. Almost all of these have now been combined into a handful of formula programs with broader objectives.
Core surface transportation program funds are distributed to states by formula, but freight transportation is often interstate in nature. The funds received by a single state may not be sufficient to construct the infrastructure necessary to relieve congestion at freight bottlenecks whose effects are felt several states away. Recognizing this, Congress created the Projects of National and Regional Significance program within SAFETEA as a way of directing federal funds to large projects with wide-ranging benefits. All funds made available through the program were earmarked in the legislation and were not available for other projects.
The American Recovery and Reinvestment Act of 2009 (P.L. 111-5) created a discretionary grant program for transportation infrastructure investments, originally known as the Transportation Investment Generating Economic Recovery (TIGER) program and now called the Better Utilizing Investments to Leverage Development (BUILD) program. BUILD grants are distributed at the discretion of the Secretary of Transportation, subject to a set-aside for rural areas and limits on maximum and minimum grant size. The program is not authorized in law, but has received funding in appropriations bills every year since its introduction in FY2009 through FY2018. Since its inception, roughly one-quarter of grants have gone to freight-specific projects, and almost half to road projects that could benefit freight as well as passengers (see Table 2).
|
Project Type |
Grants Awarded |
Percent of Grants Awarded |
Federal Funding (millions of dollars) |
Percent of Funding |
|
Freight (Rail & Port) |
126 |
23% |
1,796 |
26% |
|
Highway |
244 |
44% |
3,131 |
44% |
|
Other |
183 |
33% |
2,115 |
30% |
|
TOTAL |
553 |
100% |
7,042 |
100% |
Source: DOT, "About BUILD Grants," https://www.transportation.gov/BUILDgrants/about.
Note: Some freight rail projects may also benefit commuter or intercity passenger service.
Moving Ahead for Progress in the 21st Century (MAP-21) Act
The successor to SAFETEA, the Moving Ahead for Progress in the 21st Century Act (MAP-21; P.L. 112-141) of 2012, contained the first articulation of a national freight policy. Whether the federal government should make a more focused effort toward funding projects that benefit freight movement was a major policy question in the reauthorization debate. The Senate version of MAP-21 (S. 1813, 112th Congress) would have created a separate program for funding freight-related projects, but this was not enacted. Instead, MAP-21 allowed a larger share of project costs to come from federal sources if a project could be demonstrated to improve the efficient movement of freight: the state cost share for freight-specific projects on Interstate Highways was reduced from 10% to 5% and on other highways from 20% to 10%.
MAP-21 enacted planning provisions related to identifying infrastructure components critical to freight transport. It directed DOT to designate a "Primary Freight Network" (PFN) consisting of 27,000 centerline miles of existing roadways (independent of the number of lanes), based primarily on freight volume and in consultation with shippers and carriers. The Secretary of Transportation could designate up to an additional 3,000 centerline miles of existing or planned roads as part of the PFN based on their future importance to freight movement. States could designate "critical rural freight corridors" based on the density of truck traffic if they connect the PFN or Interstate System with sufficiently busy freight terminals. The act designated a larger National Freight Network to include the critical rural freight corridors, portions of the Interstate System not designated as parts of the PFN, and roads in the PFN. DOT, in consultation with partners and stakeholders, was directed to develop a National Freight Strategic Plan that identifies highway bottlenecks and to report every two years on the condition and performance of the National Freight Network.
Each state was encouraged, but not required, to create a state freight advisory committee comprising representatives of freight interests and a state freight plan "that provides a comprehensive plan for the immediate and long-range planning activities and investments of the State with respect to freight."12 Among other things, a state's freight plan was to describe how it will improve the ability of the state to meet the national freight goals established by DOT.
Fixing America's Surface Transportation (FAST) Act
National freight policy was updated significantly by the FAST Act. The act repealed the Primary Freight Network and National Freight Networks established by MAP-21. It instead directed DOT to create a National Freight Strategic Plan and identify the components of a National Highway Freight Network, consisting only of highways, and a National Multimodal Freight Network, which must include railroads, marine highways, and the infrastructure necessary to connect these networks to one another in order to facilitate the movement of containerized freight. The multimodal network was to be officially designated within a year of enactment. However, while DOT sought public comment on an interim network and released a draft strategic plan, it has not taken final action.13 No public comment was sought on the National Highway Freight Network, as the FAST Act defined it by expanding upon the Primary Freight Network already defined by MAP-21.14
The FAST Act also directed a portion of federal funds toward highway segments and other projects deemed most critical to freight movement. It did this by creating a new discretionary grant program and a new formula program for distributing federal funds to states. The stated goals of these two programs are very similar: to increase U.S. global economic competitiveness, reduce congestion and bottlenecks, increase the efficiency and reliability of the highway network, and reduce the environmental impact of freight movement.15
|
Program |
National Highway Freight Program (NHFP) |
Nationally Significant Freight and Highway Projects |
|
Type |
Formula |
Discretionary |
|
Citation |
23 U.S.C. §167 |
23 U.S.C. §117 |
|
FY2016 |
1,150 |
800 |
|
FY2017 |
1,100 |
850 |
|
FY2018 |
1,200 |
900 |
|
FY2019 |
1,350 |
950 |
|
FY2020 |
1,500 |
1,000 |
|
TOTAL |
6,300 |
4,500 |
Sources: 23 U.S.C. §104(b)(5) and P.L. 114-94, §1101(a)(5).
Notes: Amounts are subject to an obligation limitation; actual amounts made available may vary.
National Highway Freight Program
The National Highway Freight Program created in the FAST Act is a formula program with funding of $1.1 billion in FY2016 rising to $1.5 billion in FY2020. Funds are administered by state departments of transportation and must be directed toward highway components designated as especially important to freight movement. These components include a Primary Highway Freight Network (PHFN) designated by the Federal Highway Administration, "critical rural freight corridors" designated by the states, and "critical urban freight corridors" designated by either states or metropolitan planning organizations, depending on the population size of an urban area. These components, along with other Interstate Highway segments, comprise the National Highway Freight Network.
States containing 2% or more of the total mileage of the PHFN are required to spend their program funds on the PHFN, critical rural, or critical urban freight corridors.16 Other states may spend their program funds on any part of the larger National Highway Freight Network. Up to 10% of a state's apportionment can be directed toward projects within rail or port terminals "that provide surface transportation infrastructure necessary to facilitate direct intermodal interchange, transfer, and access into or out of the facility."17
Nationally Significant Freight and Highway Projects Program (FASTLANE/INFRA)
The Nationally Significant Freight and Highway Projects Program is a discretionary grant program with funding of $800 million in FY2016 rising to $1 billion in FY2020. It was initially known as the Fostering Advancements in Shipping and Transportation for the Long-Term Achievement of National Efficiencies (FASTLANE) program, but is now called Infrastructure for Rebuilding America (INFRA). Public entities are eligible to apply, including states and groups of states, metropolitan planning organizations, local governments or groups of local governments, political subdivisions of states or local governments, transportation-related authorities such as port authorities, and tribal governments. Eligible uses of funds include highway projects, railway-highway grade crossing projects, connections to ports and intermodal freight facilities, and elements of private freight rail projects that provide public benefits. However, grants for freight intermodal or freight rail projects are capped at $500 million over the life of the program. A grant is to provide not more than 60% of the cost of a project, but other federal assistance can be used to provide up to a total federal share of 80% (i.e., the local cost share required must be at least 20%).18
This grant program is designed primarily for relatively high-cost projects; each grant awarded must be at least $25 million, and the project must have eligible costs amounting to at least $100 million or a significant share of a state's highway funding apportionment the previous fiscal year (e.g., 30% in the case of a project within a single state). However, 10% of grant funds are reserved for smaller projects with minimum grants of $5 million. DOT is to consider the dispersion of projects geographically, including between rural and urban communities. Congress has 60 days to disapprove a DOT grant approval.19
While not an explicit focus of federal freight programs, it can be argued that projects that do not serve freight directly can reduce traffic in areas where infrastructure is shared between passengers and freight, freeing up roadway capacity and alleviating some impacts of congestion. For example, reconstruction of the Memorial Bridge in Washington, DC, was partially funded by a $90 million FASTLANE grant in 2016. This bridge is not currently open to trucks, but supporters of the project argued that returning the infrastructure to a state of good repair for use by passenger vehicles would relieve congestion on other crossings of the Potomac River used by freight carriers.20
Implementation of Provisions in MAP-21 and FAST
National Freight Strategic Plan
In October 2015, DOT published a draft National Freight Strategic Plan, fulfilling one of the requirements of MAP-21 (three months after the deadline initially set by law). A comment period would have required a final version of that plan to be released by December 2016, but the passage of the FAST Act in the interim updated the requirements of the National Freight Strategic Plan with a new deadline of December 2017; DOT opted to complete the document required by the FAST Act rather than continue updating the MAP-21 strategic plan, now superseded. As of year-end 2018, this requirement of the FAST Act had not been met.
Conditions and Performance Reports
The Federal Highway Administration Conditions and Performance Report released in May 2018 was the first to fulfill the requirement of Section 1116 of the FAST Act to report specifically on the conditions of the National Highway Freight Network. This report found that in 2014, 77% of network mileage had "good" pavement, while 19% of miles were graded "fair" and the remaining 4% "poor." The report also found that there are approximately 57,600 bridges on the network, of which 4.3% are structurally deficient.21 The report contains measures of congestion at the 25 most congested points in the freight network, and for key freight corridors, generally dealing with speed and trip times. Since this is the first report to contain these figures, it can be used as a baseline to assess whether the condition and functioning of the network are improving over time.
The FAST Act also required DOT to report on the conditions and performance of the National Multimodal Freight Network, but as this network has not yet been defined, no report has been issued.
Financing Initiatives
The federal government supports surface transportation projects mostly through funds distributed to the states. Financing initiatives, on the other hand, are arrangements that rely primarily on borrowing. The federal government supports freight infrastructure financing arrangements mainly through direct loans, loan guarantees, and tax preferences for certain types of bonds. The FAST Act created a new Surface Transportation Infrastructure Finance Bureau to consolidate some of the support functions for several of these programs.
TIFIA Program
The Transportation Infrastructure Finance and Innovation Act (TIFIA) program provides loans for highway projects, public or private freight rail facilities providing intermodal transfer, infrastructure providing access to intermodal freight facilities, and surface transportation improvements facilitating intermodal transfers or improved access at port terminals.22 Since FY1999, according to DOT, TIFIA financing for all types of projects amounted to $30.1 billion. This assistance was provided to 77 projects that have a total cost of $108.4 billion.23 Highway and freight projects account for approximately 60% of TIFIA assistance. The largest project specifically related to freight, receiving a $341 million TIFIA loan, is the Port of Miami Tunnel, which opened August 3, 2014, to improve truck access to and from the port.24
The FAST Act provided a total of $1.435 billion for TIFIA loans, including $300 million in each of FY2019 and FY2020. Because the government expects most of the loans to be repaid, the program's funding need only cover the subsidy cost of credit assistance and administrative costs. According to the Federal Credit Reform Act of 1990, Title XIII, Subtitle B of the Omnibus Budget Reconciliation Act of 1990 (P.L. 101-508), the subsidy cost is "the estimated long-term cost to the government of a direct loan or a loan guarantee, calculated on a net present value basis, excluding administrative costs."25 Consequently, the loan capacity of the TIFIA program is much larger than the budget authority available. DOT estimates that since each dollar of funding has historically allowed TIFIA to provide $14 in credit assistance, FAST Act funding levels could allow for up to $20 billion in total credit assistance over the life of the law.26
RRIF Program
The Railroad Rehabilitation and Improvement Financing (RRIF) program provides loans and loan guarantees for rail infrastructure and equipment through the Federal Railroad Administration up to a total of $35 billion of unpaid principal, with $7 billion reserved for Class II and III railroads.27 Direct loans can be up to 100% of a project's cost and for a maximum term of 35 years. Interest is charged at the rate paid by the U.S. Treasury to issue bonds of a similar maturity. Eligible borrowers are state and local governments, government-sponsored authorities and corporations, railroads, joint ventures that include at least one railroad, freight rail shippers served by one railroad wanting to connect a facility to a second railroad, and interstate compacts.
The RRIF program does not receive an appropriation from Congress, but allows project sponsors to pay the subsidy cost (termed the credit risk premium). FRA evaluates applications for RRIF loans in terms of each applicant's creditworthiness and the value of collateral offered to secure the loan. These factors determine the credit risk premium.
Since 2002, there have been 40 loan agreements totaling $6.3 billion. Loans for freight railroads have ranged in size from $234 million, made to the Dakota Minnesota and Eastern Railroad in 2004, to $56,000, made in 2011 to C&J Railroad. Loans are typically relatively small; while the mean size of a loan is $142 million, the median is $21 million. While Class II and Class III freight operators have received most of the loans, the largest loans by value have gone to Amtrak or commuter railroads. A 2018 loan for $6 million to the Port of Everett, WA, the first extended to a port authority, is to be used to increase rail freight capacity.
Similar to the TIGER/BUILD program, many projects financed by TIFIA or RRIF loans may benefit passengers as well as freight.
Issues and Options for Congress
Funding Needs in Freight Infrastructure
In reauthorizing federal surface transportation programs, the primary freight-related issues before Congress are likely to be setting funding levels and, if necessary, raising revenue. Key questions include whether there should be a dedicated revenue stream for freight-related purposes and whether additional federal funding should be dedicated to freight projects selected by DOT rather than distributed by formula for spending at the discretion of the states.
Goods Movement Charges
One idea that has come before Congress is the creation of a new dedicated revenue stream for freight infrastructure, funded not by the motor fuels taxes that fund most federal surface transportation spending, but by a charge on goods movement. Under one such proposal, which was introduced in the 113th, 114th, and 115th Congresses28 but not passed, a 1% tax would be assessed on the cost of freight shipments, with the revenue deposited in a new trust fund. A National Freight Program would then distribute these funds to states by formula for exclusive use for freight projects. A similar proposal would reserve 5% of the import duties collected by Customs and Border Patrol for freight purposes, directing the money into a Freight Trust Fund.29
Proposals for taxes and fees on freight traffic have been raised before, including taxes based on trucking charges, a combined weight-distance or ton-mile tax such as those assessed already by certain states, and a tax on every maritime container imported and exported. Some proponents have advocated such fees specifically to raise money for freight-related projects, while others see them as a means of raising additional sums for general surface transportation use.
Tolls
Existing law generally permits tolling of existing federal-aid highways only when they are rebuilt or replaced.30 In the case of Interstate Highways, the existing non-tolled lane count must be maintained, even if the facility is reconstructed (with exceptions for some toll roads that predate the Interstate System). In 1998, Congress created the Interstate System Reconstruction and Rehabilitation Pilot Program, allowing up to three states to toll Interstate segments in order to repair or rehabilitate them.31 One of the states accepted into the pilot program, Missouri, considered reconstructing 200 miles of Interstate 70 to include two truck-only lanes in each direction, with the entire project to be funded by tolls. The proposal encountered strong resistance in the state and is no longer being pursued. The other states participating in the pilot program, Virginia and North Carolina, also did not undertake proposed projects.32 The only other way an existing toll-free federal-aid highway (including non-tolled existing Interstate Highway lanes) may be converted is under the Value Pricing Pilot Program, a separate program established in 1991 that is designed primarily to mitigate congestion.
Congress has no direct control over the decision to impose highway tolls, which is up to the state or local entity that owns the infrastructure.33 It could, however, widen the circumstances under which states are permitted to toll Interstate Highways. Tolls could provide a source of funding for freight-related projects. Trucking interests generally oppose additional tolling, especially truck-only tolling, largely out of concern that political considerations will make it easier to raise tolls on trucks than on cars, and prefer higher motor fuels taxes to fund highway improvements.34 Studies have concluded that funding highways with motor fuels taxes provides trucks a cross-subsidy from automobile users' gas tax payments, due to the fact that the wear and tear caused by a heavy truck is much greater than that caused by a light vehicle.35
Addressing Congestion
Growth in freight and passenger transportation demand has brought an increase in truck and rail congestion. This congestion is particularly pronounced in major urban areas that contain important freight hubs such as ports, airports, border crossings, and rail yards. Many of the trucks delayed may be simply passing through the region rather than serving local shippers. As identified by DOT, the 25 most congested segments for trucks are generally urban Interstate Highway interchanges.
The most recent rankings published by DOT are based on 2014 data, so the impact of FAST Act programs on alleviating freight bottlenecks has not yet been assessed. However, a number of metropolitan areas have been at or near the top of the congestion list for several consecutive years. Five of the 25 most congested segments are in Houston and two are in each of Chicago, Atlanta, Los Angeles, Seattle, and Cincinnati. While the rankings of individual cities can fluctuate, 13 interchanges have been listed among the top 20 most congested for at least the last five years. The interchange of I-290 and I-90/94 in Chicago has ranked no better than second-worst since 2010, and the interchange of I-95 and SR 4 in Fort Lee, NJ, just outside New York City, has ranked no better than fourth-worst. A trucking industry study estimates that 86% of the total costs of congestion for trucks are concentrated on 17% of Interstate Highway mileage.36
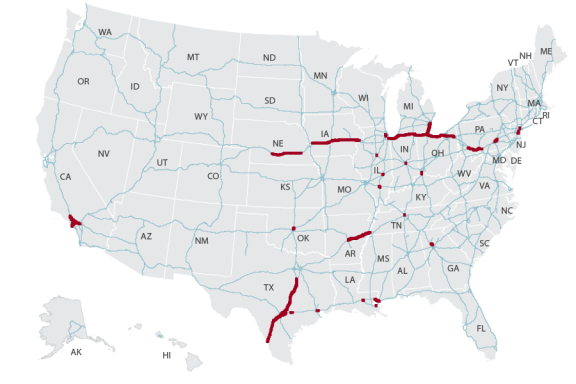
Similarly, the projected increase in highway freight traffic over the coming decades is not likely to be uniformly distributed across the nation's highways. Segments of the Interstate Highway system that are projected to see an increase of more than 10,000 trucks per day are spread out over parts of 15 states (see Figure 2). This is roughly equivalent to an additional truck traveling on a segment every 8.6 seconds. At the same time, many Interstate Highway segments are projected to have only small increases in truck traffic through 2045. The formula used to distribute most federal surface transportation funds to the states, including formula grants under the National Highway Freight Program, does not incorporate anticipated increases in truck traffic volume, meaning that the states expected to face the largest increases in truck traffic are not entitled to greater federal funding to address capacity constraints.
As Figure 2 indicates, the largest increases in truck traffic are expected to occur where Interstates intersect, but also along stretches of highway that connect busy nodes to each other. For example, a stretch of I-40 in Arkansas, connecting Little Rock to Memphis, TN, is one such segment. The nature of interstate commerce means that much of the truck traffic using this highway may simply be crossing Arkansas rather than moving freight to or from businesses in Arkansas. Although only Arkansas can use its federal highway funds to increase the capacity of the road, much of the benefit from such a project would likely accrue to other states, potentially limiting Arkansas's incentive to undertake the work.
One way for Congress to address this situation would be to adjust the methodology for calculating each state's apportionment of funds distributed under the National Highway Freight Program to consider freight-related metrics. The NHFP currently takes into account each state's share of National Highway Freight Network miles. The dedicated freight funding proposals introduced in the 113th, 114th, and 115th Congresses, discussed above, would have incorporated several other measures intended to reflect a state's importance to the national freight system into the distribution formula. These would have included each state's share of the nation's ports, miles of freight rail track, cargo-handling airports, freight tonnage, and freight value relative to the national total.
Instead of adjusting formula programs to reflect freight-related needs, Congress has provided DOT with discretionary funds it can distribute for freight and other purposes through the INFRA and BUILD grant programs. These programs have proven to be popular and routinely receive applications for more funding than they can make available, but they have also been criticized for lacking transparent processes for project selection and for funding projects that may not have the highest estimated benefit/cost ratios. A 2017 Government Accountability Office report concluded that the INFRA (then known as FASTLANE) application review process allowed for broad discretion during certain team reviews, and that certain large projects were forwarded to the Secretary of Transportation for approval even if they did not initially meet certain statutory requirements.37
A third approach would be to direct spending congressionally. From the start of the 112th Congress in 2011 until the end of the 115th Congress in January 2019, the House and Senate observed a ban on congressionally directed spending, also known as earmarking. The earmark ban effectively blocked Members of Congress from inserting language in authorization or appropriations bills to designate funds for specific freight-related projects, as frequently occurred prior to 2011. The ban was established through rules adopted by the House Republican Conference, the Senate Republican Conference, and the Senate Appropriations Committee.38 The Democratic Party majority that has controlled the House since January 2019 has not adopted similar language, and it is unclear whether earmarks are permitted in proposed legislation in that chamber.
Research, Development, and Technology
Freight Performance Data and Statistics
Because freight infrastructure decisions are often made at the state or local level, it would be helpful for transportation planners to know the characteristics of the trucks traveling particular highway segments. Information about the industries served, the origin and destination of the shipments, and daily or seasonal variations in volume could help planners identify freight users that share an economic interest in mitigating a bottleneck or determine the feasibility of moving some of the traffic to off-peak hours or to other modes.
DOT's Bureau of Transportation Statistics and the Census Bureau conduct a survey of shippers every five years (the Commodity Flow Survey cited in Table 1) that provides information on outbound shipments. However, the sample size is not sufficient to provide reliable data for any specific urban area. The survey does not record through traffic, does not distinguish between imports and domestic freight, and occurs too infrequently to identify trends in freight patterns. The survey was designed more to provide a national picture of freight transport than to meet local or regional needs. In the FAST Act, Congress requested DOT to "... consider any improvements to existing freight flow data collection efforts that could reduce identified freight data gaps and deficiencies...."39 A policy decision for Congress is whether the federal government should be responsible for providing adequate freight data for state and local transportation planners.
Autonomous Vehicles
Autonomous vehicle technology has potential applications in the freight sector. Autonomous trucks potentially offer significant freight transportation savings, as driver compensation represents either the largest or second-largest cost component for truck carriers, depending on the price of fuel. Fuel and driver compensation typically each account for about one-third of total operating costs. A truck driver may not drive for more than 11 hours per day under federal regulations, so it is difficult for carriers to improve labor productivity except by using larger trucks. Because driver error is the overwhelming cause of vehicle accidents, automation that reduces accident rates could improve public safety. Also, long-distance truck carriers experience exceptionally high driver turnover, and automation may reduce the need for drivers.
Despite the economic motivation, many in the trucking industry doubt whether driverless trucks are feasible in the foreseeable future given the current horizon of autonomous technology. An alternative scenario, at least for the next decade or two, is that truck driver jobs may come to resemble those of airline pilots in that drivers would spend part of their time monitoring an autonomous driving system rather than directly controlling the vehicle at all times. The skills of truck drivers when backing up an 18-wheeler to a warehouse or driving on local roads may be irreplaceable. In addition, some carriers may not be eager to forgo personal contact between drivers and customers, which may create sales opportunities.
The 115th Congress debated federal policy regarding autonomous vehicle technology at length. H.R. 3388, passed by the House, sought to establish new rules for testing and adoption of autonomous technology for cars and light trucks, but had no provisions pertaining to commercial vehicles. In the Senate, S. 1885 would have subjected commercial vehicles to the same safety evaluation requirements as private vehicles. Neither measure was enacted, but in debating these bills, Congress evaluated to what extent federal policy should assist autonomous vehicle technology by granting exemptions to certain federal requirements that otherwise would impede testing and demonstrations of these vehicles. Congress also considered preempting states from issuing certain regulations that are contrary to federal regulations or contrary to other states' regulations in order to avoid differing state requirements.
These provisions were relevant to a technology being tested in the trucking industry known as "platooning." In a platoon, trucks follow each other closely enough to save fuel by reducing drag at high speeds (around 10% for a following truck and 5% for the lead truck). All the trucks in a platoon have drivers, but only the driver of the lead truck is in full control of the vehicles. The drivers in the following trucks steer their vehicles, but their feet are off the accelerator and brake because truck speed is controlled by wireless communication from the lead truck. This communication reduces the braking response times of the following trucks and therefore allows trucks to follow closely enough to significantly reduce wind resistance. Absent federal legislation, it is possible that states would enact conflicting limits on platooning, reducing its utility in interstate commerce.
What About Hyperloop?
Congress may also be asked to support a technology known as Hyperloop, which proposes the use of pods or sleds to transport containers in vacuum-sealed tubes at high speed. While this technology has gone through some testing, it has not yet been commercially deployed. Hyperloop projects are not currently eligible for funding under surface transportation formula grant programs or any of DOT's discretionary grant programs, which are limited to road, rail, and some port projects.
There is no federal program dedicated solely to research and development of freight-specific technology. The federal government supports research and development of some surface transportation technologies through the Highway Research and Development Program (23 U.S.C. §503(b)) and the Technology and Innovation Deployment Program (23 U.S.C. §503(c)). The FAST Act currently authorizes $250 million and $135 million, respectively, for these programs through FY2020.