Introduction
The Earned Income Tax Credit (EITC) is a refundable tax credit available to eligible workers earning relatively low wages. Since the credit is refundable, an EITC recipient need not owe taxes to receive the benefit. Many low-income workers, especially those with children, may be eligible to receive the EITC.
The EITC, enacted more than 40 years ago, has evolved from a relatively modest tax benefit to a significant antipoverty program. As the credit has expanded and changed over time, researchers have evaluated various aspects of the credit, including
- how the EITC affects recipients' decision to start working (and number of hours they work);
- how the credit affects poverty rates; and
- difficulties that taxpayers have with complying with the credit's rules.
This report reviews current economic research on the EITC. An understanding of the economic impacts of the credit, as well as its limitations and potential drawbacks, may inform future legislative modifications of the EITC or the structure of other social benefits provided in the tax code.
This report first briefly outlines the history of the EITC, focusing on its evolution from a modest "work bonus" to a major antipoverty program. Next the report turns to an evaluation of the credit, reviewing the economic literature on how the credit has affected taxpayers' decisions to work (what economists refer to as "labor supply decisions"), how it has affected certain education and health outcomes of recipients and their children, how it has affected tax burdens among different taxpayers, and the complexity of administering this tax provision. This report does not provide a detailed overview of the credit. For more information on eligibility for and calculation of the EITC, see CRS Report R43805, The Earned Income Tax Credit (EITC): An Overview, by [author name scrubbed] and [author name scrubbed].
Purpose and History of the Credit
Before the EITC's enactment in 1975, cash welfare payments were the primary form of federal financial support for poor families with children. However, during the 1960s and 1970s, in the face of increasing concern over growing welfare rolls,1 some policymakers became interested in alternative forms of aid. Economist Milton Friedman proposed a negative income tax (NIT) that would have provided a guaranteed minimum level of income administered through the tax code.2 President Nixon, influenced by the NIT, proposed in 1969 a "family assistance plan" (FAP) that would have benefited both the working and nonworking poor with children, effectively replacing the existing cash welfare program known at the time as Aid to Families with Dependent Children (AFDC). While the Nixon plan never became law, it was twice approved by the House.3
Senator Russell Long, then chairman of the Senate Finance Committee, expressed interest in an alternative government assistance program which would encourage the poor to work by providing them with a "work bonus" or supplement to their wages. Senator Long's "primary objection to the NIT was that it provided its largest benefits to those without earnings"4 and would hence discourage people from working. In contrast, Senator Long stated that his proposed "work-bonus plan" was "a dignified way" to help poor Americans "whereby the more he [or she] works the more he [or she] gets."5
In addition, the work-bonus plan was seen as a way to help reduce increasing payroll tax burdens. The worker's share of payroll taxes had risen from 1.5% in 1950, to 3.0% in 1960, and 4.8% in 1970.6 During the 1960s and 1970s, there was a growing belief among policymakers that payroll taxes, as a regressive tax, especially burdened the working poor. Several antipoverty task forces also "showed that future refinancing of the Social Security system might encumber the poor even more."7 Advocates of the work-bonus plan believed that payroll taxes reduced the poor's income to such an extent that the only way they could make ends meet was to receive welfare. According to Long, his "work bonus plan" would "prevent the social security tax from taking away from the poor and low-income earners the money they need for support of their families."8
In 1975, the work bonus plan was enacted on a temporary basis as part of the Tax Reduction Act of 1975 and renamed the Earned Income Tax Credit.9 In addition to encouraging the poor to work and reducing their dependence on cash welfare, the credit was also viewed as a means to encourage economic growth in the face of the 1974 recession and rising food and energy prices.10 Since the EITC was viewed in part as an alternative to cash welfare, it was generally targeted to the same recipients—single mothers with children.11 (Childless poor adults would not receive the credit until the 1990s, discussed subsequently.) The credit was extended several more times on a temporary basis before being expanded and made permanent by the Revenue Act of 1978 (P.L. 95-600).12 Making the credit permanent reflected Congress's belief "that the earned income credit is an effective way to provide work incentives and relief from income and Social Security taxes to low-income families who might otherwise need large welfare payments."13
In the late 1980s and 1990s, policymakers remained interested in the EITC as an antipoverty program. A Wall Street Journal article from 1989 described the EITC as "emerging as the antipoverty tool of choice among poverty experts and politicians as ideologically far apart as Vice President Dan Quayle and Representative Tom Downey, a liberal New York Democrat."14 President Bill Clinton, a champion of the EITC as a poverty-reduction tool, declared that expanding the credit would "reward the work of millions of working poor Americans by realizing the principle that if you work 40 hours a week and you've got a child in the house, you will no longer be in poverty."15 As one scholar noted, "President Clinton's declaration completed the evolution of the EITC from Senator Long's modest 'work bonus' to a major antipoverty initiative."16
Before the 1990s, the EITC's structure limited its ability to reduce poverty among families of different sizes. As illustrated in Table 1, the EITC as originally designed did not vary by family size. Thus, as family size increased, the credit became less effective at helping a family meet its needs. The EITC was restructured to vary based on family size beginning modestly with the Omnibus Reconciliation Act of 1990 (OBRA90; P.L. 101-508) and greatly expanded by the Omnibus Reconciliation Act of 1993 (OBRA93; P.L. 103-66).17 Specifically, the EITC was now calculated such that at any given level of earnings, the credit was one size for a taxpayer with a single child and larger for taxpayers with two or more children. For example, when OBRA93's legislative changes had fully phased in, taxpayers with one child could receive a maximum credit of $2,152, while families with two or more children could receive a maximum credit of $3,556 in 1996. The 1993 bill also extended the credit to childless workers for the first time (see Table 1). Unlike the expansion of the credit for workers with children, the main rationale for this "childless EITC" was not poverty reduction. Instead the credit was intended to partly offset a gasoline tax increase included in OBRA93.18 The credit for childless workers was smaller than the credit for workers with children. It was calculated as 7.65% of the first $4,000 of earnings, for a $323 maximum credit in 1996. Notably, aside from inflation adjustments, the formula for the childless EITC has remained unchanged since OBRA93.
At the beginning of 2000, there was congressional interest among both political parties in reducing marriage penalties (although the means by which they intended to achieve this goal varied).19 For low-income taxpayers with little or no tax liability, a marriage penalty is said to occur when a married couple receives a smaller refund than the combined refund of each partner filing as unmarried. (Marriage bonuses also arise in the U.S. federal income tax code.20) In 2001, the Joint Committee on Taxation (JCT) identified the structure of the EITC as one of the primary causes of the marriage penalty among low-income taxpayers.21
In 2001, Congress chose to reduce the marriage penalty in the EITC. The Economic Growth and Tax Relief Reconciliation Act of 2001 (EGTRRA; P.L. 107-16) gradually increased the income level at which the credit phased out for married couples by $3,000 (adjusted for inflation). In 2009, ARRA temporarily increased EITC marriage penalty relief to $5,000, also adjusted for inflation. This change was originally in effect for 2009 and 2010. The increased marriage penalty relief was extended for 2011 and 2012 by the Tax Relief, Unemployment Insurance Reauthorization, and Job Creation Act of 2010 (P.L. 111-312) and further extended from 2013 until the end of 2017 by the American Taxpayer Relief Act of 2012 (P.L. 112-240; ATRA). The Protecting Americans from Tax Hikes (PATH) Act (Division Q of P.L. 114-113) made the $5,000 of EITC marriage penalty relief permanent.
|
1975 |
1978 |
1984 |
1986 |
1990 |
1993 |
2001 |
2009 |
||
|
Adjust Formula Parameters Such that the Amount of Credit Increases from Previous Statutory Levels |
Enacting legislation |
Yes |
Yes |
Yes |
Yes |
Yes |
No |
Yes |
|
|
Credit Available Only to Workers with Children |
Yes |
Yes |
Yes |
Yes |
Yes |
No |
No |
No |
|
|
Credit Amount Based on: |
|||||||||
|
Earnings |
Yes |
Yes |
Yes |
Yes |
Yes |
Yes |
Yes |
Yes |
|
|
Number of Children |
No |
No |
No |
No |
Yes (credit formulas for families w/ 1 & 2+children) |
Yes (credit formulas for families w/ 1 & 2+children) |
Yes (credit formulas for families w/ 1 & 2+children) |
Yes |
|
|
Marital Status |
No |
No |
No |
No |
No |
No |
Yes |
Yes |
|
|
Credit Available to Childless Workers |
No |
No |
No |
No |
No |
Yes |
Yes |
Yes |
|
|
Credit Adjusted Annually for Inflation |
No |
No |
No |
Yes |
Yes |
Yes |
Yes |
Yes |
|
Source: CRS analysis of P.L. 94-12, P.L. 95-600, P.L. 98-369, P.L. 99-514, P.L. 101-508, P.L. 103-66, P.L. 107-16, and P.L. 111-5.
Notes: This table does not reflect all the legislative changes that occurred to the EITC between 1975 and 2009, but instead focuses on major legislative changes to the credit formula. These include adjusting the credit for family size (including to those with no children), marital status, and for inflation, as well as parameter changes (like the credit rate, earned income amount, phase-out rate, and phase-out threshold).
Current Structure of the EITC22
There are eight formulas currently in effect to calculate the EITC (four for unmarried individuals and four for married couples, depending on the number of children they have), as illustrated in Table 2.
|
Number of qualifying children |
0 |
1 |
2 |
3 or more |
|
Unmarried tax filers (single and head of household filers) |
||||
|
Credit rate |
7.65% |
34% |
40% |
45% |
|
Earned income amount |
$6,780 |
$10,180 |
$14,290 |
$14,290 |
|
Maximum credit amount |
$519 |
$3,461 |
$5,716 |
$6,431 |
|
Phase-out threshold |
$8,490 |
$18,660 |
$18,660 |
$18,660 |
|
Phase-out rate |
7.65% |
15.98% |
21.06% |
21.06% |
|
Income when credit = 0 |
$15,270 |
$40,320 |
$45,802 |
$49,194 |
|
Married tax filers (married filing jointly) |
||||
|
Credit rate |
7.65% |
34% |
40% |
45% |
|
Earned income amount |
$6,780 |
$10,180 |
$14,290 |
$14,290 |
|
Maximum credit amount |
$519 |
$3,461 |
$5,716 |
$6,431 |
|
Phase-out threshold |
$14,170 |
$24,350 |
$24,350 |
$24,350 |
|
Phase-out rate |
7.65% |
15.98% |
21.06% |
21.06% |
|
Income when credit = 0 |
$20,950 |
$46,010 |
$51,492 |
$54,884 |
Source: IRS Revenue Procedure 2018-18 and Internal Revenue Code (IRC) Section 32.
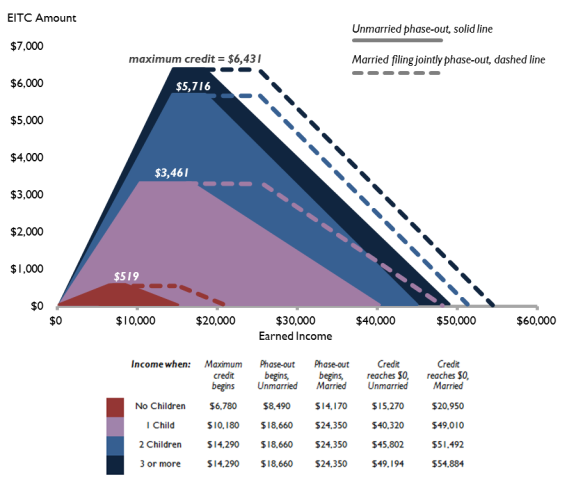
For any claimant, the credit has three value ranges that vary by income, as illustrated in Figure 1. First, the credit value increases to its maximum value from the first dollar of earnings until earnings reach the "earned income amount." Over this "phase-in range" the credit value is equal to the credit rate multiplied by earnings and is represented as the upward sloping line of the schedule. When earnings are between the "earned income amount" and the "phase-out threshold"—referred to as the "plateau"—the credit amount remains constant at its maximum level. For each dollar over the "phase-out threshold," the credit is reduced by the phase-out rate until the credit equals zero, which is represented by the downward sloping line of the schedule. This final range of income over which the credit falls in value is referred to as the "phase-out range."
 |
|
Source: Congressional Research Service, based on information in IRS Revenue Procedure 2018-18 and Internal Revenue Code Section 32. In this simplified example, adjusted gross income (AGI) is assumed to equal earned income. |
|
How to Calculate the EITC The following examples illustrate how to calculate the EITC for an unmarried taxpayer with one qualifying child at varying levels of income, as illustrated in the purple shape of Figure 1 and using the parameters in Table 2. (For simplicity, these examples assume that earned income equals adjusted gross income (AGI).) Earned Income of $9,000: The taxpayer's income places them in the phase-in range of the credit. Their credit equals the credit rate multiplied by their earned income. In this case, 34% x $9,000 or $3,060. Earned Income of $15,000: The taxpayer's income places them in the plateau of the credit. Their credit equals the maximum amount of the credit or $3,461. Earned Income of $30,000: The taxpayer's income places them in the phase-out range of the credit. The maximum value of the credit ($3,461) is reduced by 15.98 cents for every dollar above the phase-out threshold of $18,660 ($30,000 minus $18,660 multiplied by 15.98 cents, or $1,812). In other words the credit would equal $1,649 ($3,461 minus $1,812). |
Evaluation of the Credit
Generally, economists evaluate tax policies—including the EITC—through three different lenses: how the tax provision affects taxpayers' behavior ("efficiency"), how the tax provision affects tax burdens ("equity" or "fairness," however they may be defined), and the complexity of administering the tax provision ("administration"). A provision may be seen differently through these lenses. For example, a tax provision may simplify the tax code (improve administration), but result in an undesirable behavior (reduce efficiency). This report examines research evaluating the EITC across these metrics, as well as the effects of the EITC on certain health and education outcomes.23
Efficiency: How Has the Credit Affected Recipients' Decisions to Work?
Most economic research on the EITC has focused on how the credit affected the work decisions of the original target population of the EITC—unmarried mothers. Unmarried claimants with children remain the majority of EITC recipients and receive the majority of EITC dollars.24 More recently, as the goals and structure of the credit have changed, there has also been some interest in how the credit affects the labor force decisions of married couples. A smaller body of research has examined the impact the EITC has on married secondary earners with children, generally assumed to be women.25 Research tends to examine either the impact that the credit had on a population's decision to start working ("work force participation") or on their decision to work a different number of hours. In some cases, research looks at both of these labor supply decisions. A detailed overview of the economic theory of the labor supply effect (decision to work and number of hours worked) of the EITC is provided in the Appendix.
Workforce Participation of Unmarried Workers
Studies indicate that the EITC has a positive effect on the labor force participation of single mothers.26 These studies generally examine how significant legislative expansions of the EITC influenced previously nonworking single mothers' decisions to enter the workforce.27 For example, one study found that the creation of a larger credit for unmarried individuals with two or more children in the early-1990s resulted in a sharp increase in employment among single mothers.28 Another study found that 34% of the increase in employment among single mothers between 1993 and 1999 was due to legislative expansions of the EITC.29 Other research found that "60% of the 8.7 percentage point increase in annual employment of single mothers between 1984 and 1996 is attributable to the EITC with its expansion."30 In addition to encouraging many single mothers to enter the workforce, the EITC also played a role in reducing welfare caseloads. Research evaluating the interaction between welfare policy and the EITC in the 1990s found that the EITC had a substantial effect in reducing new entries into the cash welfare program.31 In other words, many single mothers chose to work, and receive the EITC, rather than apply for welfare.
Workforce Participation of Married Workers
In comparison to unmarried workers, research is less conclusive as to the impact of the EITC on married secondary earners' decisions to start working. Some empirical evidence suggests that the EITC has caused a small percentage of married mothers to stay out of the labor force. One study, which assumed that married secondary earners were women, found that "the 1993 EITC expansion led to a one percentage point reduction in the participation rate of married mothers."32 Another study found that legislative changes that expanded the EITC resulted in some married women choosing not to work.33 Couples may decide, for example, that one spouse's EITC is sufficiently large to allow the other spouse to stay out of the workforce and instead raise children. These couples could determine that having two earners would not only reduce their EITC, but may also increase the cost of other expenses, like child care, ultimately lowering their disposable income. However, more recent research has found that among married women, the EITC has had a negligible effect on labor force participation.34
If the EITC is discouraging some secondary earners from working it would effectively be "subsidizing the lower earning partner in a married couple to stay home."35 Whether that is desirable from a policy perspective depends on policymakers' goals with respect to married couples with children.
Hours Worked of Unmarried Workers
|
Basic Economic Theory of How Economists often use the theoretical framework of "income" and "substitution" effects to assess the impact income tax policies—including the EITC—have on labor supply (the decision to work and the number of hours worked). Underlying this framework is the assumption that when a worker is deciding whether to work more or work less, they are ultimately choosing between two goods: leisure (i.e., hours of not working) and consumption (after-tax dollars they can spend on goods). Substitution Effect: When wages increase, the cost of leisure also increases, since the cost of leisure is implicitly the foregone wages from not working.36 Given the laws of supply and demand (as the price of a good rises, consumption falls and vice versa), a worker will "consume less leisure" and hence work more according to the substitution effect. Income Effect: As wages increase, a worker will have more income and consume more of all goods, including leisure. In other words, an individual will work less. The ultimate impact a wage increase has on hours worked depends on which effect is greater. If the substitution effect is larger, an individual will work more hours as their wages increase. If the income effect is larger, an individual will work fewer hours as their wages increase. |
Among unmarried workers, research on the impact of the EITC on hours worked is generally inconsistent with theoretical predictions. Fundamental to the theoretical impact of the EITC on hours worked are the concepts of "income" and "substitution" effects. These effects can help economists predict how a worker will behave in response to a policy like the EITC.
For example, in the phase-in region of the credit, the EITC increases the compensation per hour worked (or the "marginal return to work"). For an unmarried worker with one child, $1 of wages pre-EITC will yield $1.34 of wages post-EITC. This additional income makes the worker feel richer for the same amount of work. If the worker has an income target ("I need to make $200 this week"), an increase in wages from the EITC means they can work less to achieve the same level of income. Economists refer to this as the "income effect" of the EITC. At the same time, an increase in the marginal return to work means that "not working" or "leisure" implicitly costs more in terms of foregone wages. Returning to the example of the unmarried worker with one child, not working now costs the individual $1.34 in foregone income instead of $1. Hence, the individual will consume less leisure, and work more. Economists refer to this as the "substitution effect" of the EITC. Hence, if a worker is in the phase-in range of the credit, the impact of the EITC is theoretically ambiguous. The income effect implies they work less, while the substitution effect implies they work more.
However, most EITC recipients' income places them in the plateau or phase-out region of the credit, where the economic framework of income and substitution effects suggests workers will be encouraged to reduce the hours they work.37
- Plateau: If taxpayers' income places them in the plateau region, they would receive the same amount of the EITC regardless of the number of hours worked. In this region, the EITC neither increases nor decreases hourly wages, and hence has no substitution effect. But since workers still receives the credit, then according to the income effect, they will work fewer hours. Hence, overall, economic theory suggests workers will cut back on hours worked.
- Phase-out: If recipients' income places them in the phase-out region of the credit, the value of the credit falls for each additional hour worked, and according to the substitution effect, "leisure" became less costly, and so workers work less. In addition, in the phase-out region, the credit is still available, and so according to the income effect, workers would also be encouraged to work fewer hours. Hence, overall, economic theory suggests that both the income and substitution effects will encourage workers to cut back the hours they work.
Yet, despite the theoretical predictions, most of the empirical evidence indicates the EITC has "had little effect on the number of hours they work."38 As one study stated,
...theory implies that the EITC will decrease hours worked among those already working because most recipients are on the plateau or phase-out portion of the credit schedule. However, recent hours worked patterns for EITC eligible individuals do not appear to fit this second prediction. Hours and weeks worked by likely recipient groups have not fallen.39
There are several explanations as to why the EITC may have had little impact on the number of hours unmarried parents work. Chief among them is that the complexity and timing of the EITC limits its work incentive effect. Taxpayers may not understand the complex relationship between the credit's value and the worker's earnings, complexity that is likely compounded by receiving the credit the year after employment decisions are made. In addition, some experts suggest that instead of responding to the marginal impact that work has on their EITC amount (and overall tax liability), tax filers instead make their decision about how much they will work based on their average tax rate (their total taxes or refund divided by their total income).40 The impact of additional earnings on average tax rates is generally lower than its impact on marginal tax rates, which may also account for the limited impact of the EITC on hours worked. Finally, workers in low-wage jobs may not have the flexibility to alter the number of hours they work, even if they would like to.
Recent Research
More recent research has provided a more complex picture of taxpayer behavior with respect to the EITC, behavior that might not be apparent in the previous analyses of aggregate data. Specifically, it is possible that in certain circumstances a worker may adjust their income level (including by adjusting hours worked) to maximize their credit. To understand this finding, it is important to remember that there are two inflection or "kink" points in the EITC schedule: at the earned income amount and at the phase-out threshold, as illustrated in Figure 1. The earned income amount is the lowest earnings level at which the credit reaches its maximum amount. The phase-out threshold is the highest earnings level at which the credit remains at its maximum amount. Recent research has examined whether taxpayers "bunch" around these inflection points. In other words, do taxpayers tend to earn the exact amount of money needed to get the largest credit?
|
Does the EITC Affect Individuals' Decisions to Marry? Some policymakers are interested in the impact of the EITC on unmarried workers' decision to marry, especially since many married EITC recipients may receive a smaller EITC as a married couple than their combined EITCs as two single tax filers. A smaller EITC for married couples (known as a "marriage penalty") could discourage cohabitating couples from marrying.41 (Certain couples can receive a marriage bonus from the EITC.) For example, in 2018, two single parents, each with one child and earned income of $15,000, would receive an EITC of $3,461 each, for a total EITC of $6,922. If they married, their combined income would be $30,000, and with two children, their EITC would be $4,526. The EITC marriage penalty for this couple would be $2,396. While limited, research indicates that the EITC's effects on marriage patterns are small and ambiguous.42 |
One study found "clear evidence of bunching around the first kink point of the EITC—the point at which the credit reaches its maximum level."43 In addition, bunching tended to increase over time, suggesting taxpayers were learning about the structure of the EITC. This effect, however, was concentrated among the self-employed, who can adjust their earnings more easily than wage earners (by reducing hours worked or their reported earnings). No bunching effect was found among EITC recipients with only wage income and the authors did not report evidence of bunching around the second kink point of the EITC. However, these results did indicate that some self-employed individuals were aware of the EITC formula, and how it varied by earnings. Using high rates of "self-employed bunching" as a proxy for "high knowledge" about the structure of the EITC, a subsequent study focusing on wage earners found that EITC claimants who live in "high knowledge" neighborhoods tended to have wage earnings concentrated in the EITC plateau.44 Crucially, the authors noted that
the welfare consequences of the EITC depend on whether the higher concentration of earnings around the refund-maximizing plateau of the EITC schedule comes from increased earnings for those who would have been in the phase-in region or reduced earnings for those who would have been in the phase-out region.45
Assuming no changes in wage rates, this would imply workers would adjust the number of hours they work to maximize the credit. The authors found that the majority of the clustering effect in the plateau region was from workers whose income originally placed them in the phase-in region working more hours, rather than from those in the phase-out region working fewer hours. These studies suggest that low-income workers may respond to the EITC by increasing hours worked.
However, this newer research still does not explain why the EITC apparently does not lead to an overall reduction in hours worked among workers whose income places them in the phase-out range, even though economic theory suggests otherwise. As Hoynes states with respect to workers whose income places them in the phase-out region of the credit "we expect hours to decrease ... the literature has failed to find a consistent negative impact of the EITC on hours worked. This, I think, is a bit of a puzzle."46 One possible theory is that workers in the phase-in range are part-time workers and can increase their hours in response to the EITC, whereas workers in the phase-out range are likely full-time workers who might not have the option to cut back their hours.
Hours Worked of Married Workers
With respect to married couples, research focusing on the secondary earner found that the EITC does tend to result in a slight reduction of hours worked among these workers. One study found that EITC expansions resulted in a 0.57% to 4.37% reduction in hours worked among married women,47 while another study found a similar reduction of 1% to 4% of hours worked among married women.48
Decisions to Work of Childless Workers
Studies have not focused on the labor supply effects of the EITC for childless workers. One reason may be because the EITC for childless workers was enacted after the credit for workers with children and unlike the credit for workers with children, the childless EITC formula was never expanded. As previously discussed, many studies of the EITC looked at how legislative expansions of the credit for workers with children affected their labor force decisions. The EITC for childless workers has effectively remained unchanged from its 1993 formula—except for annual inflation adjustments. In addition, the EITC for childless workers is likely too small to encourage workers to work at a low-wage job, especially on a full-time basis. For example, a single childless worker working full time at a minimum wage job49 (40 hours a week, 50 weeks a year) would receive a $59 credit in 2018. In contrast, a single parent with just one child working full time at a minimum wage job would receive a $3,461 credit.
Equity: How Has the Credit Affected Poverty Rates, Health and Education Outcomes, and Tax Burdens?
When examining the impact the EITC has on fairness or equity, research has tended to focus on how the credit affects poverty rates and tax burdens among different groups of recipients. The EITC has had a significant impact on reducing poverty among recipients with children, but little impact among childless individuals. Research also indicates that in addition to reducing poverty, the credit may improve certain health and education outcomes of some of its recipients. Finally, the EITC has increased inequity in the tax code between those with and without children.
Poverty Reduction
The EITC is one of the federal government's largest antipoverty programs,50 reflecting a trend toward reducing poverty through the tax code.51 The official poverty measure, however, is unable to capture the antipoverty impact of the EITC. The official poverty measure is calculated by comparing an individual's or family's resources, measured as pre-tax cash income (hence excluding the EITC), to a poverty threshold, roughly equal to three times the cost of spending on the U.S. Department of Agriculture's Economy Food Plan. If an individual's or family's resources are less than their applicable threshold, the individual or family is counted as poor.52
New experimental poverty measures that include government benefits like the EITC provide evidence of such programs' antipoverty effects. The U.S. Census Bureau found that when government tax and transfer programs were included in a broader measure of poverty, refundable tax credits were estimated to reduce poverty by three percentage points. This compares to a 1.6 percentage-point reduction for food assistance (known as SNAP or the Supplemental Nutrition Assistance Program) and a 0.2 percentage-point reduction for welfare (known as TANF, or Temporary Assistance for Needy Families).53 Although this analysis includes both the EITC and refundable portion of the child tax credit, the EITC is the largest refundable tax credit targeted to the poor, and previous research indicates that most of the antipoverty impact of refundable tax credits can be attributed to the EITC.54
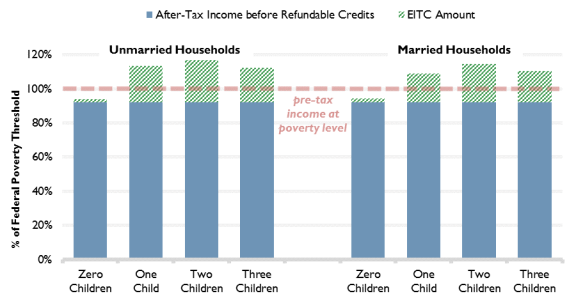
The antipoverty effects of the EITC are not uniform across different types of households and tax filers. Figure 2 illustrates how pre-tax income of workers at the federal poverty level (FPL)55 changes after subtracting taxes owed (including payroll taxes) and adding back the EITC. Under the current federal income tax, married and unmarried childless workers with pre-tax income at the FPL tend to see their income remain below the poverty line after taxation, even when including the EITC. In contrast, married and unmarried workers with children whose pre-tax income is at the FPL will have post-tax income above the FPL because the EITC is greater than their payroll tax liability. Many poor tax filers, especially those with children, do not generally owe federal income tax.56
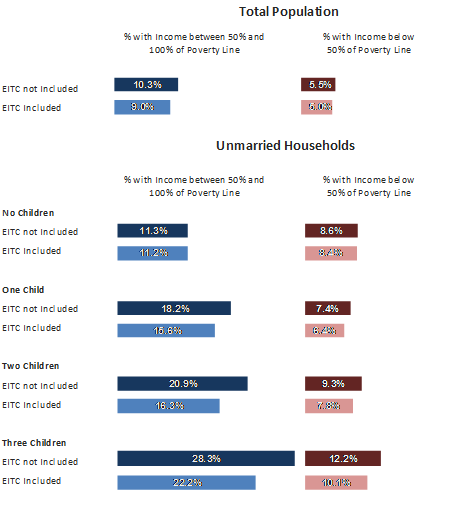
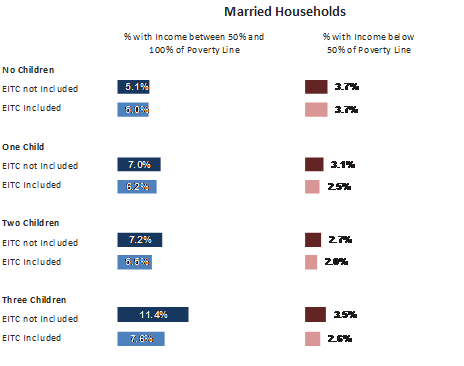
CRS estimates of poverty rates based on the most recently available Census data indicate that the EITC reduces poverty, with the greatest reduction being among unmarried households with children, as illustrated in Figure 3. For example, in 2016, without the EITC, 12.2% of unmarried households with three children were in deep poverty (below 50% of the FPL), and 28.3% had income between deep poverty and poverty (50% to 100% of the FPL). With the EITC, those proportions fell 10.1% and 22.2%, respectively. The relatively smaller impact of the credit on reducing poverty rates among families with children who are in deep poverty (as compared to having incomes 50% to 100% of the FPL) may be because the credit in dollar terms is too small to push these families over the poverty threshold. In addition, families in deep poverty may be less likely to work and hence receive work-based credits like the EITC. CRS estimates that 30.4% of unmarried households with three children in deep poverty were not working—as compared with 24.2% of households with the same family structure, but income between 50% and 100% of the FPL. This reflects a broader limitation of work-based credits—those who do not or cannot work do not receive them.
|
Figure 3. Estimated Effects of EITC on Households |
 |
 |
|
Source: CRS analysis of the 2017 Current Population Survey (CPS) Annual Social and Economic Supplement (ASEC) which reflect 2016 data. Notes: The estimated poverty rates in this table—both pre- and post-EITC—do not reflect the official poverty rate calculations. The poverty rates in this table are calculated by comparing a family's resources to the official poverty threshold. For the purposes of this analysis (and unlike the official poverty rate), a family's resources include government benefits (like Social Security, food assistance, housing assistance, health benefits) net of taxes paid and expenses associated with work, like child care. The EITC is then included in one measure of resources, but excluded in the other. Both measures of resources are then compared with the official poverty threshold to determine if the individual or family is poor. These data illustrate several key aspects of the antipoverty effectiveness of the EITC based on marital status and number of children. |
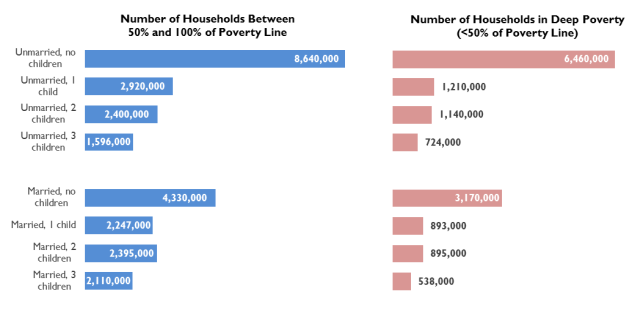
In addition, as illustrated in Figure 3, the EITC results in a relatively small reduction in poverty rates among childless workers in comparison to workers with children. For example, among unmarried childless individuals, CRS estimates 19.9% (11.3% + 8.6%) are poor without including the EITC. When the EITC is included in their income, 19.6% are considered poor, a 1.5% reduction. Among unmarried households with three children, CRS estimates 40.5% are poor without the EITC, falling to an estimated 32.3% when the EITC is included, a 20.5% reduction. Of note, while a smaller proportion of childless workers are in poverty and deep poverty compared to their peers with children, a greater number of childless households are in poverty, as illustrated in Figure 4.
Health and Education Outcomes
Recent economic and public health research suggests that the EITC may improve the health of some poor Americans. Decades of research has linked poverty to poorer health outcomes among infants and children,57 suggesting that measures to alleviate poverty—like the EITC—could improve certain health outcomes. Recent research indicates that in addition to its broad antipoverty impact, the EITC may also improve the health of children born to low-income mothers. One widely used indicator of infant health is the infant's weight at birth and whether the baby is considered low birth weight (LBW), which is defined as weighing less than 2,500 grams at birth. LBW babies have been found to have a number of health complications at above-average levels.58 Several recent studies suggest that the EITC is associated with increases in birth weight and a reduction in the incidence of LBW.59 One study found that a $1,000 increase in the EITC was associated with a reduction in the incidence of LBW by approximately 3%, and an increase in mean birth weight.60 Another study found that the EITC was associated with improvements in maternal health; EITC-eligible mothers were less likely to have risky levels of certain biomarkers (i.e., high blood pressure or other indicators associated with cardiovascular disease and inflammation).61
Some possible causal mechanisms have been offered to explain the association of the EITC with higher birthweight, and research on the matter is ongoing. Some studies have found an association between EITC receipt and reduction in maternal smoking.62 Maternal smoking during pregnancy has been consistently associated with LBW.63 The EITC may also result in improved access to prenatal care, or reduce maternal stress.64 Researchers acknowledge that they are unable to decouple the income effects of the EITC from the labor effects. In other words, it remains unclear to what extent health effects flow from the boost in income the credit provides as opposed to the effects of having a previously unemployed mother enter the workforce.
The impact of the EITC on adult health outcomes is less conclusive. A 2013 systematic review by the Cochrane Group found no evidence of an effect on the health status of working-age adults.65 Since 2013, some researchers have found an association with EITC eligibility and improvements in health outcomes of the working-age population,66 although these studies may not adequately control for other influencing factors.67
In addition to exploring the effects of the EITC on health outcomes, many researchers have studied the effects of the credit on education outcomes of low-income populations. Researchers looking at the test scores of children in elementary school in a large urban school district found that children in families that received larger EITCs (and the refundable portion of the child tax credit)68 tended to score higher on English and math tests.69 (Similar results were found by researchers looking at the impact of legislative expansions to the EITC in the 1990s. They found that the children in families that received the largest increase in the credit tended to score higher on math and reading tests.70) The authors acknowledge that "their results do not shed light on the mechanism through which an increase in tax credits aids student achievement. Are families directly spending more on school-related resources for children? Are families moving into neighborhoods with better schools and peers?"71 In addition, as with the research on the health implications of the EITC, researchers are unable to decouple the income effects of the credit from its labor supply effects. While it remains unclear how credits may improve student achievement, these studies indicate that the EITC (and the child tax credit) may contribute to the improvement of academic achievement among low-income children.
Research has also found that the EITC also improves the college attendance rates of low-income high school students. One recent study72 found that among low-income high school seniors, an increase in their family's EITC by $1,000 increases their chances of enrolling in college by 1.3 percentage points.73 (Depending on what proportion of a family's EITC is spent on college costs, the authors note that their estimated impact of the EITC on college enrollment may be comparable to traditional student aid.) In contrast, the authors note that their research suggests there is no effect on enrollment decisions from tax refunds received in the spring of the high school student's junior year. Hence the timing of when the credit is received—around the time college enrollment decision are being made—may be a large factor in why the credit influences enrollment decisions. In their comprehensive survey of the EITC literature, Nichols and Rothstein note that "[t]aking all of the estimates together, these is robust evidence of quite large effects of the EITC on children's academic achievement and attainment, with potentially important consequences for later-life outcomes."74 The authors continue, "[T]he effects are large enough to demand an explanation for the relatively small estimates of effects of family income on student outcomes that come from non-EITC settings."75
These studies are illustrative of relatively recent EITC research that examines a broader impact of retributive policies on social outcomes, like health and education. While the EITC was not designed as a health or education benefit, current research suggests that it may improve the health and educational achievement of low-income populations.
Tax Burdens
Tax burdens are the percentage of a taxpayer's income that is paid in taxes. In this report, the terms tax burdens, effective average tax rates, and average tax rates are used interchangeably.
Tax Burdens by Income
The EITC changes the distribution of the tax burden across taxpayers at different income levels. Data from the Tax Policy Center (TPC), summarized in Table 3, illustrate the impact of the EITC on the average tax rates paid by tax units in different income classes. TPC estimates that in 2017, the EITC lowered the average tax rates for tax units with income below $100,000, providing the greatest benefit to those with income between $20,000 and $40,000. Notably, the TPC estimates show that the EITC does not result in the poorest tax units paying the lowest average tax rates, as many tax units in the lowest income class are ineligible for the EITC or only eligible for a small EITC.76
|
Average Federal Tax Rate |
Average Decrease in Federal Tax Liability from Credit |
Percent of Tax Units Who Receive the Benefit |
Share of Total Value of EITC |
||
|
Tax Units' |
Without |
With |
|||
|
Less than $10,000 |
10.4% |
7.4% |
$170 |
23.5% |
3.5% |
|
$10,000-$20,000 |
7.4% |
3.5% |
$580 |
26.4% |
22.0% |
|
$20,000-$30,000 |
9.1% |
5.4% |
$910 |
25.3% |
31.6% |
|
$30,000-$40,000 |
10.8% |
8.4% |
$800 |
26.1% |
20.8% |
|
$40,000-$50,000 |
12.2% |
10.9% |
$580 |
24.0% |
12.2% |
|
$50,000-$75,000 |
13.9% |
13.5% |
$230 |
12.2% |
8.6% |
|
$75,000-$100,000 |
16.0% |
16.0% |
$30 |
2.2% |
0.8% |
|
$100,000-$200,000 |
19.0% |
18.9% |
$10 |
0.2% |
0.2% |
|
$200,000+ |
24.3% |
24.3% |
$0 |
0.0% |
0.0% |
Source: Tax Policy Center, Distribution Table T17-0124, https://www.taxpolicycenter.org/model-estimates/individual-income-tax-expenditures-april-2017/t17-0124-tax-benefit-earned-income-tax.
Notes: Tax units in each income class include both those eligible and ineligible for the EITC. Cash income includes wages and salaries, investment (taxable dividends, realized net capital gains) and business income, as well as government transfer payments (Social Security, SSI, veterans' benefits), employee contributions to tax-deferred retirement savings plans, and business income or loss. In addition, it includes both filing and nonfiling units but excludes those that are dependents of other tax units. Tax units with negative adjusted gross income are excluded from their respective income class but are included in the totals. For a description of expanded cash income, see http://www.taxpolicycenter.org/TaxModel/income.cfm.
|
What Is a "Tax Unit"? When economists analyze the tax code or tax provisions, their analysis often focuses on the impact of tax policy on a "tax unit." A tax unit is defined as either an individual, or in the case of those filing a married joint return, a married couple, and all the dependents of the individual or married couple. For the purposes of the analysis of tax burdens in this report only, "tax units" will sometimes be used interchangeably with the terms "families" or "households." However, the technical definition of "families" and "households" used by other government agencies like the Census Bureau may result in tax units and families and households differing.77 |
Tax Burdens by Family Structure
Economists also evaluate how tax provisions affect the tax burdens of different families. In effect, they evaluate the tax burdens of "equivalent" families or families that have the same standard of living. These families will have the same "ability-to-pay" a tax. Tax policies that result in families with the same "ability-to-pay" having the same tax burden are referred to as horizontally equitable by economists.
A family's ability to pay will be affected by the size and composition of the family. As families increase in size, they tend to need additional income to have the same standard of living as smaller families. However, the amount of additional resources will not be the same for each additional family member. For example, one study found that by using a commonly accepted formula—called an "equivalence scale"—to adjust for family size, a family composed of one individual with a cash income of $10,000, was equivalent to (i.e., had the same standard of living) as a family with two members and a cash income of $14,142, a family with three members and cash income of $17,321, and a family of four and cash income of $20,000.78
Using an equivalence scale developed to determine poverty thresholds for families of different sizes,79 one study concluded that the EITC resulted in tax rates among low-income tax filers that were horizontally inequitable.80 For example, when comparing families whose incomes were equivalent to $10,000 (what the researchers called "the reference income level"),81 the authors found that
At a $10,000 reference income, all effective tax rates are negative, and the rates range from -1.47 percent for a married couple with no children to -39.21 percent for a head-of-household return with two children, a difference of more than a third of income.82
Using equivalence scales developed by the Census Bureau,83 and calculating 2018 effective average tax rates based on these income levels and family compositions, more recent analysis indicates that horizontal inequity also exists at higher income levels, as illustrated in Table 4. A major factor in this horizontal inequity among low-income tax filers is the larger EITC credit for families with children, which results in "dramatic differences between families with and without children."84 As incomes rise to around $25,000, the variation in effective average tax rates falls among equivalent families, as fewer tax filers are eligible for the EITC or are eligible for a smaller EITC due to the phase out of the credit. In addition, the child tax credit further increases horizontal inequity between those with and without children. This has led researchers to conclude that "the clearest change that would increase horizontal equity ... is a larger EITC for single workers and childless couples."85
While the average tax rates of "equivalent families" provided in Table 4 depend in part on the equivalence scale used, research indicates that horizontal inequities will still exist—though to different degrees—even when assumptions used to construct equivalence scales differ.86
|
Single |
Married |
Married |
Married |
Married |
HOH |
HOH |
HOH |
||
|
Reference Income Level: $10,000 for a Married Couple with No Children |
|||||||||
|
Equivalent Income |
$7,071 |
$10,000 |
$13,429 |
$15,257 |
$16,995 |
$10,670 |
$12,668 |
$14,538 |
|
|
Effective Tax Rate (w/o CTC) |
-7.35% |
-5.20% |
-25.77% |
-37.46% |
-37.84% |
-32.44% |
-40.00% |
-40.00% |
|
|
Effective Tax Rate (w/CTC) |
-7.35% |
-5.20% |
-36.20% |
-50.01% |
-50.63% |
-43.92% |
-52.04% |
-52.42% |
|
|
Effective Tax Rate (w/CTC & payroll) |
7.95% |
10.10% |
-20.90% |
-34.71% |
-35.33% |
-28.62% |
-36.74% |
-37.12% |
|
|
Reference Income Level: $15,000 for a Married Couple with No Children |
|||||||||
|
Equivalent Income |
$10,607 |
$15,000 |
$20,143 |
$22,886 |
$25,493 |
$16,005 |
$19,001 |
$21,807 |
|
|
Effective Tax Rate (w/o CTC) |
-3.38% |
-3.04% |
-17.18% |
-24.98% |
-23.70% |
-21.62% |
-29.18% |
-24.71% |
|
|
Effective Tax Rate (w/CTC) |
-3.38% |
-3.04% |
-24.13% |
-37.21% |
-37.23% |
-30.37% |
-42.20% |
-37.99% |
|
|
Effective Tax Rate (w/CTC & payroll) |
11.92% |
12.26% |
-8.83% |
-21.91% |
-21.93% |
-15.07% |
-26.90% |
-22.69% |
|
|
Reference Income Level: $25,000 for a Married Couple with No Children |
|||||||||
|
Equivalent Income |
$17,678 |
$25,000 |
$33,572 |
$38,143 |
$42,489 |
$26,676 |
$31,669 |
$36,344 |
|
|
Effective Tax Rate (w/o CTC) |
3.21% |
0.40% |
-3.07% |
-3.66% |
-1.79% |
-4.92% |
-5.08% |
-2.14% |
|
|
Effective Tax Rate (w/CTC) |
3.21% |
0.40% |
-6.17% |
-7.37% |
-6.14% |
-9.16% |
-13.39% |
9.06% |
|
|
Effective Tax Rate (w/CTC & payroll) |
18.51% |
15.70% |
9.13% |
7.93% |
9.16% |
6.14% |
1.91% |
24.36% |
|
Source: CRS calculations using a three-parameter "equivalence" scale used to calculate equivalent families for the supplemental poverty measure. For more information see Kathleen Short, The Supplemental Poverty Measure: 2013, U.S. Census Bureau, Current Population Reports, October 2014, p. 19. Effective tax rates calculated using NBER's TAXSIM model for tax year 2018.
Notes: HOH: Head of Household filing status. CTC: The child tax credit. Negative tax rates indicate that that the tax filer receives a refund. These rates are calculated as the total tax divided by income. For the calculations, all income is assumed is assumed to be wage income, the taxpayer taxes no above-the line deductions, and the taxpayer takes the standard deduction and appropriate number of personal exemptions when calculating their taxable income. With respect to the number of children, all are assumed to be under 17, and hence with respect to the child tax credit, eligible for that credit. Payroll taxes are calculated as 7.65% of income.
Simplicity and Administrability: Are the EITC Eligibility Rules and Formula Calculations Easy for Taxpayers to Comply with and for the IRS to Administer?
One concern with the EITC is that its complex rules and formulas make it difficult for taxpayers to comply with and difficult for the Internal Revenue Service to administer. Studies indicate that EITC errors by taxpayers (whether intentional or unintentional) result in a relatively high proportion of EITC payments being issued incorrectly. Monitoring for EITC compliance remains a challenge for the IRS.
Taxpayer Challenges Complying with the EITC
Taxpayer error in claiming the EITC has been an ongoing concern with the credit.87 Evidence suggests that the EITC's complex formulas and eligibility rules may result in taxpayers claiming the EITC in error. For example, a noncustodial parent who pays child support may erroneously assume they can claim that child for the credit—resulting in a larger credit than they would otherwise receive. Hence, taxpayer error—whether intentional or unintentional—can result in significant dollar amounts of the credit being claimed incorrectly.
Taxpayer noncompliance with the EITC is often measured in two ways—improper payments and overclaims.
- EITC overclaims are the amount of the credit claimed incorrectly and do not include the impact of enforcement activities.
- EITC improper payments are an annual fiscal year measure of the amount of the credit that is erroneously claimed (generally overclaimed) net of any amounts recovered by the IRS from their enforcement activities (i.e., audits).88 In other words, recovered amounts of the credit are subtracted from erroneous claims of the credit to calculate improper payments.
Improper payments are generally smaller than overclaims since improper payments net out amounts recovered or protected by the IRS, while overclaims do not. In addition, the amount of EITC improper payments is reported annually. In contrast, overclaims—which are often discussed in research studies of the factors that lead to tax filer noncompliance—have historically been reported less frequently. The last two comprehensive IRS studies that examined overclaims were released in 1999 and 2014.89
The IRS estimates that in FY2017, between $14.9 billion and $17.6 billion in EITC payments (i.e., between 21.9% and 25.8% of payments) were issued improperly.90 EITC improper payments and rates are high when compared to the improper payments and rates of traditional spending programs (discussed further below in "Improper Payments and Administering a Social Benefit Through the Tax Code").91
In August 2014, the IRS released its most recent EITC compliance study examining the causes of EITC overclaims on 2006, 2007, and 2008 tax returns (henceforth referred to as the "2006-2008 EITC Compliance Study"). Total overclaims from the 2006-2008 EITC Compliance Study were estimated to be between $14.0 billion and $19.3 billion. The study found that between 79% and 85% of EITC dollars claimed incorrectly were claimed by tax filers ineligible for the credit (as opposed to those eligible for a smaller credit).
This study concluded that there were three major reasons92 for errors among claimants
- EITC claimants claimed children who were not their qualifying children for the credit;
- EITC claimants misreported their income; and
- EITC claimants used an incorrect filing status when claiming the credit.
The 2006-2008 EITC Compliance Study found that the most frequent EITC error was incorrectly reporting income—in most cases self-employment income—and the largest error (in terms of overclaim dollars) was incorrectly claiming a child for the credit, as illustrated in Table 5. The most common qualifying child error was claiming a child who did not fulfill the residency requirement. The study also found that filing status errors are a source of EITC overclaims, although they are a relatively smaller cause of errors in comparison to income reporting and qualifying child errors.
Paid Tax Preparers
Unlike previous studies, the 2006-2008 EITC Compliance Study examined different types of paid tax preparers who prepared tax returns which included EITC claims (these tax returns are sometimes referred to as "EITC returns"). The study found that among paid tax preparers, unenrolled preparers were both the most common type of tax preparers of EITC returns and among the most prone to erroneous claims of the credit. Unenrolled tax preparers generally do not pass the same testing requirements as enrolled preparers (e.g., attorneys and CPAs), and, in contrast to enrolled tax preparers, are limited in how they represent their clients before the IRS. The IRS does not conclude that these data are sufficient to indicate which preparers tend to be less capable or unscrupulous. More research may help to determine "the relative ability or integrity of unenrolled preparers."
|
Amount Overclaimed (billions $2008) |
|||
|
Error Type |
Number of Returns with Error (millions) |
Low Estimate |
High Estimate |
|
Income Reporting Error |
6.5 |
$4.5 |
$5.6 |
|
Qualifying Child Error |
3.0 |
$7.2 |
$10.4 |
|
Filing Status Error |
1.0 |
$2.3 |
$3.3 |
|
Total |
11.9 |
$14.0 |
$19.3 |
|
Addendum |
|||
|
Total Number of Returns Claiming the EITC |
23.7 |
Total Dollar Amount of EITC Claimed ($2008) |
$49.3 |
Source: Table 1 (Addendum) and Table 5 of the 2006-2008 EITC Compliance Study.
Note: According to the IRS, the totals may be greater than the sum of each error type due to double counting. First, more than one type of error may occur on a given return. Second the estimate of overclaim dollars treats each error in isolation. Each estimate is calculated assuming the respective error is the only error eliminated. However a given amount of overclaim dollars may occur on a return with multiple errors, with the cost of one error influenced by presence and cost of the other error.
IRS Challenges in Administering the EITC
In addition to taxpayers facing challenges in complying with the EITC rules, the IRS may also face challenges in administering the credit. Specifically, the IRS may or may not be able to detect these errors and administer this tax benefit. Generally, the IRS does not reveal how it detects errors or flags questionable tax returns to prevent persons from using this information to circumvent IRS detection. However, public documents that evaluate the efficacy of the IRS error detection procedures do provide a general overview of some of the ways the IRS may attempt to detect errors, especially before a refund is issued. They also indicate challenges the IRS may face in accurately detecting taxpayer error.
One of the largest sources of qualifying child errors is the child failing to meet the EITC's residency requirement. But the IRS does not have a database containing information on children and with whom they live and for how long. While the IRS may use databases like the Federal Case Registry of child support orders (FCR) or various Social Security databases to try to verify the child meets the residency requirement, they may not always be accurate. For example, an IRS study examining the accuracy of the FCR in validating the residency requirement of the EITC found that of a sample of tax returns that FCR data flagged for audit, 23% of these returns once audited were found to have no adjustments in taxes owed.93 In other words, 23% of these taxpayers were effectively compliant even though the FCR had flagged them as being noncompliant with the residency requirement of the EITC.
Similarly with respect to some income reporting errors, the IRS may not have information to accurately detect errors. Some observers have suggested that to verify income used to claim the credit the IRS may be able to compare income reported on the tax filer's tax return to information reported on third-party forms. In other cases—especially among the self-employed—the IRS may have incomplete information. Self-employed individuals generally have their compensation reported on a Form 1099. But this compensation does not necessarily represent self-employment income. Taxpayers may deduct a variety of business expenses from their compensation to determine their self-employment income. The IRS, however, does not receive third-party verification of these deductible expenses when a taxpayer files his or her income tax return. In contrast, wage income is directly reported on Form W-2 and is provided to both the taxpayer and the IRS. The availability of wage income information to both the taxpayer and the IRS may be a factor in the lower dollar amount of overclaims attributable to wage income reporting errors.
While the IRS may have challenges in detecting EITC errors, they are permitted to take certain measures to penalize those taxpayers who claim the credit in error. The IRS can, once it has determined a tax filer improperly claimed the EITC, subject that taxpayer to financial penalties and disallow them from claiming the credit in future years. If upon examination by the IRS, all or part of a taxpayer's EITC is denied, the taxpayer94
(1) must pay back the amount in error with interest; (2) may need to file the Form 8862, Information to Claim Earned Income Credit after Disallowance; (3) may be banned from claiming EITC for the next two years if we [the IRS] find the error is because of reckless or intentional disregard of the rules; or (4) may be banned from claiming EITC for the next ten years if we [the IRS] find the error is because of fraud.
Tax return preparers who erroneously claim the credit on behalf of clients may also be subject to financial penalties, suspension or expulsion from e-file, injunction preventing them from preparing returns or subjecting them to certain limitations, and other disciplinary action.
Improper Payments and Administering a Social Benefit Through the Tax Code
Since the EITC is both a needs-tested transfer to low-income Americans as well as a tax benefit, it is important to put the IRS's challenges in administering the EITC (as well as the high improper payment rate of the credit) in the context of both traditional spending programs and other tax benefits. Often the EITC error rate is compared to the error rates of other spending programs. For example, the Office of Management and Budget (OMB) has designated the EITC as a "high-error program" in comparison to other spending programs, with EITC improper payments the second highest in terms of the total dollar amount (behind Medicare Fee-for-Service) and the highest in terms of improper payment rate (improper payments as a percentage of total payments).95 However, the EITC is not administered like a traditional spending program, but administered as a tax benefit, which may ultimately affect error rates.
For example, some experts stress that spending programs may have lower improper payment rates than the EITC because they screen every participant before the benefit can be claimed. Such screenings generally involve high up-front administrative costs, but may lower the amount of benefits incorrectly paid out. In contrast, the administrative cost of the EITC is relatively minimal. In congressional testimony, the IRS Taxpayer Advocate noted that96
Using tax returns as the "application" for EITC benefits rather than a traditional screening process results in low cost with high participation as well as the risk of improper payment. The IRS has pointed out that for the EITC current administration costs are less than 1% of benefits delivered. This is quite different from other non-tax benefits programs in which administrative costs related to determining eligibility can range as high as 20% of program expenditures.
Minimal pre-filing eligibility verification—generally the norm among tax benefits—may reduce administrative costs but also lead to substantial amounts of the credit being claimed in error.
When revenue losses that arise from EITC errors are compared with other provisions of the tax code, they appear relatively small. The most recent IRS report on the tax gap—tax liabilities not paid—estimated that the annual average gross tax gap for the tax years 2008 to 2010 period was $458 billion.97 (Over the same time period the IRS collected $52 billion in payments, for a net tax gap of $406 billion.) The majority of the gross tax gap—$319 billion—is associated with the individual income tax. The largest source of noncompliance with individual income tax laws was the underreporting of business income on individual income tax returns, resulting in $125 billion of the tax gap. The next largest source of the tax gap (in dollar terms) was the underreporting of self-employment tax, estimated to be $65 billion annually during the 2008 to 2010 period.98 As the Taxpayer Advocate stated in the Fiscal Year 2015 Objectives, when comparing the tax gap from the EITC noncompliance versus underreporting business income, "EITC overclaims account for 6% of the gross individual income tax noncompliance while business income underreported by individuals accounts for 51.9%."99
Concluding Remarks
When initially enacted in the 1970s, there were two major purposes of the EITC. First, the credit was meant to encourage the nonworking poor (only those with children) to enter the workforce and be more self-sufficient. Second, the credit was intended to help reduce the tax burdens of working poor families with children. While these families were generally not subject to income taxes, they were subject to payroll taxes on their earnings. Some policymakers at the time worried that payroll taxes would reduce poor families' take home pay to such an extent that they would need to rely on cash welfare. In the 1990s, the purposes of the credit were expanded to include poverty reduction, with a focus on encouraging welfare recipients—generally unmarried mothers—to work.
If policymakers want to modify the EITC, it may be helpful to understand both the benefits and limitations or problems with the credit. Research on the EITC suggests that the EITC has generally achieved many policymakers' original goals: It has encouraged single mothers to enter the workforce and it has reduced poverty among families with children. Evidence also suggests that the credit may improve health and education outcomes of low-income populations. However, studies also indicate limitations, unintended consequences, or problems with the EITC. Some research suggests the EITC could discourage some married women from working. It has also been shown to exacerbate inequities in the tax code between taxpayers with and without children. In addition, approximately a quarter of all EITC payments are issued improperly. Improper payments are likely related to the complex eligibility rules of the credit, which can be difficult for taxpayers to comply with and difficult for the Internal Revenue Service to verify. For workers without children, the EITC has generally been shown to be ineffective at reducing poverty. No research has indicated the EITC has any effect on encouraging childless individuals to enter the workforce.
Appendix. The Economic Theory of the Impact of the EITC on Labor Supply
The EITC, insofar as it changes the marginal returns to work (compensation for each hour of work), will theoretically affect both unmarried and married workers' decisions to work and the amount that they work (i.e., the number of hours). The following is a detailed overview of the theoretical impact of the EITC on labor supply decisions (the decision to work and the number of hours worked).
Workforce Participation
According to economic theory, the EITC will unambiguously increase the workforce participation of single workers because these workers can only receive the credit if they work.100 And those who do not work are no better or worse off as a result of the EITC. As Eissa and Hoynes state "[t]he well-being of a taxpayer who does not work has not changed and any taxpayer who preferred working before [the EITC] will still prefer working, and some taxpayers may find that the additional after-tax income from the EITC makes it worth entering the workforce."101
Among married couples however, the theoretical impact the credit has on each spouse's labor force participation may differ and can be understood using the theoretical framework of "income" and "substitution" effects. In summary, when a tax policy, like the EITC, increases the marginal returns to work, this additional income makes the worker feel richer for the same amount of work. If the worker has an income target ("I need to make $200 this week"), an increase in wages from the EITC means they can work less to achieve the same level of income. Economists refer to this as the "income effect" of the EITC. At the same time, an increase in the marginal return to work means that "not working" or "leisure" implicitly costs more in terms of foregone wages. Hence, the individual will consume less leisure, and work more. This is referred to as the "substitution effect" of the EITC by economists.
Economists generally assume that in a married couple, one spouse is the primary earner, and earns more of the household income than the secondary earner. In addition, economists generally assume that the primary earner makes their labor force participation decision first, and then the secondary earner decides whether to work (this is referred to as sequential family labor supply decisions). In such a model, the primary earner's labor force decision is the same as the one faced by an unmarried worker. They (and their family) will only receive the credit if they work, and hence the labor force participation of primary earners should unambiguously increase.
Given that the value of the EITC for a family is based on the combined earnings of both spouses, the secondary earner's labor force participation decision will depend on the distribution of income between the spouses. If the income of the primary earner is sufficiently low that it places the family in the phase-in region of the credit, then the secondary earner's decision to work will theoretically be ambiguous. On the one hand, by working, the secondary earner would increase the marginal returns to work of the married couple. According to the substitution effect, the secondary earner would be encouraged to work. On the other hand, the family might decide that the additional income from the EITC is sufficient for the family to meet their needs, and according to the income effect, the secondary earner may choose to remain out of the labor force. Given that these two effects move in opposing directions, it is unclear as to whether the labor force participation of secondary earners will increase in this situation, although most empirical research suggests that over this income range, the substitution effect is dominant (and hence the secondary earner will decide to start working).
However, the income of most earners implies that if they were to marry, the combined family income would place the family in the plateau or phase-out range of the credit.102 Over this income range, the income and substitution effects suggest that the secondary earner would be better off staying out of the labor force, which could lead to a reduction of the labor force participation of these individuals. If the secondary earner were to start working, the family's EITC would either remain constant (if the family remained in the plateau region of the credit), or fall in value (if the family was in the phase-out region of the credit). In either region, the family would still receive a credit, and the income effect would suggest that the secondary earner would be discouraged from entering the workforce. If the family's income placed them in the plateau region, the family would receive the same amount of the EITC regardless of the number of hours worked. In other words, the credit would not increase their hourly wage, and hence would have no substitution effect. If the family's income placed them in the phase-out region of the credit, the value of the credit would fall for each additional hour worked. Hence, the cost of leisure would decline, and according to the substitution effect, a secondary earner would be discouraged from working. Thus, in either case, the combined income and substitution effects would discourage some secondary earners from working.
Hours Worked
Economic theory suggests that the decision workers face in terms of how many hours to work will—like the decision a secondary earner faces in terms of working or not working—depend on the income and substitution effects of the credit. For unmarried workers, the impact of the credit will depend on their individual income, while for married workers the impact will depend on their combined family income. For clarity, the following discussion will refer to a single worker, but the same analysis holds for combined family income of a married couple.
As previously discussed, as the EITC phases in, it increases the marginal return to work for the worker.103 For example, as illustrated in Figure 1, in the phase-in range, one dollar of wages pre-EITC leads to $1.34 of wages post-EITC. An increase in the marginal return to work, will lead to the worker feeling richer and working less—the income effect—while also simultaneously raising the cost of not working and encouraging workers to work more—the substitution effect. Given these two opposing forces, the theoretical impact of the EITC on hours worked in this earnings range is ambiguous.
For workers whose income places them in the plateau region of the credit, the framework of income and substitution effects implies a worker will work less. In this plateau region, the worker receives the same amount of the EITC no matter how many hours they work. In other words, the credit does not increase their hourly wage, and hence has no substitution effect. But the credit does have an income effect, encouraging that worker to work less. In effect, if workers receive the same credit amount over a range of earnings, economic theory suggests some workers will choose to work the least number of hours to receive the credit (other workers in the plateau region may work more hours to receive more in wages).
As the credit phases out, it decreases a worker's marginal return to work (i.e., in the example in Figure 1, every additional dollar of pre-EITC earnings leads to a reduction of the EITC by almost 16 cents). Hence, the cost of leisure declines, and according to the substitution effect, a worker will work fewer hours. Even though the amount of the EITC is falling, it is still greater than zero in this range, meaning it still boosts income. Hence, according to the income effect, a worker will consume more leisure and work less. Therefore, economic theory suggests that workers whose incomes places them in the phase-out region of the credit will work less.