Federal Spending on Benefits and Services for People with Low Income: In Brief
Need-Tested Programs; Means-Tested Programs; Poverty; Low-Income; Cash Assistance; Medical Assistance; Housing Assistance; Educational Assistance; Social Services; Employment and Training.
Federal Spending on Benefits and Services for People with Low Income: In Brief
Contents
- Introduction
- Trends in Spending on Federal Benefits and Services for People with Low Income
- Federal Spending on Benefits and Services for Low-Income People by Category
- Mandatory and Discretionary Spending
- Federal Spending on Benefits and Services for Low-Income People by Program
Figures
- Figure 1. Federal Spending on Benefits and Services for People with Low Income, FY2008-FY2016
- Figure 2. Federal Spending on Benefits and Services for People with Low Income, Health and Non-health, FY2008-FY2016
- Figure 3. Federal Spending on Benefits and Services for People with Low Income, by Budget Classification, FY2016
Introduction
The Congressional Research Service (CRS) regularly receives requests about spending on programs that target low-income individuals and families for benefits and services. CRS has produced a series of reports that identify these programs and provides their spending amounts and recent spending trends. The most recent of this series is CRS Report R44574, Federal Benefits and Services for People with Low Income: Overview of Spending Trends, FY2008-FY2015. This In Brief report provides an interim update of the federal spending information in R44574 by extending it to include FY2016, the most recent year for which the federal spending data were available as of January 2018.
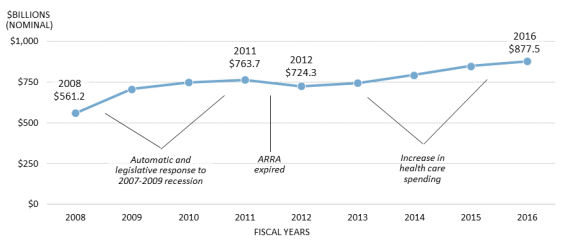
In FY2016, the federal government spent $877.5 billion on benefits and services for people with low income. This was a 3.5% increase from the prior fiscal year. The increase was faster than both the rate of inflation over the year (1.2%) and the rate of economic growth (2.8%).1
While the programs in this report share the common feature of an explicit low-income focus, the individual programs are highly diverse in their purpose, design, and target population. They were established at different times, in response to different policy challenges. In terms of target population, the largest portion of low-income assistance goes to families with children with working parents and the disabled (see CRS In Focus IF10355, Need-Tested Benefit Receipt by Families and Individuals).
Trends in Spending on Federal Benefits and Services for People with Low Income
Figure 1 shows the trend in federal spending on benefits and services for people with low income for FY2008 through FY2016. The early portion, FY2008 through FY2011, represents a period of time where spending increased because of automatic or legislated responses to the recession of 2007 through 2009. The largest low-income assistance programs are entitlements, and their spending increased automatically as more people became eligible for their benefits as incomes fell due to the recession. Additionally, Congress and the President responded to the recession with time-limited expansions or funding increases in some of these programs in the American Recovery and Reinvestment Act of 2009 (ARRA, P.L. 111-5). Total spending on these programs increased by 36% over this period.
Federal spending on benefits and services for low-income people stabilized in FY2011 and FY2012 as ARRA expired and other spending increases associated with the recession abated. However, from FY2012 through FY2016 spending for these programs increased at a steady pace, stemming from increases in spending on health care for low-income people.
Federal Spending on Benefits and Services for Low-Income People by Category
CRS's series of reports on benefits and services for low-income people divides spending for the programs into eight categories:
- health care,
- cash aid,
- food aid,
- education,
- housing and development,
- social services,
- employment and training, and
- energy assistance.
Table 1 shows federal spending for the programs by category for FY2008 through FY2016. The categories are sorted by the amount of their spending, with the largest (health care) first and the smallest (energy aid) last. Health care represents more than half of total spending for the programs in FY2016 and almost three times the amount of the next largest category, cash aid. The two smallest categories are employment and training programs (exclusive of education spending) and energy assistance.
Table 1. Federal Spending on Benefits and Services for People with Low Income, by Category, FY2008-FY2016
Billions of dollars
|
2008 |
2009 |
2010 |
2011 |
2012 |
2013 |
2014 |
2015 |
2016 |
|
|
Health Care |
$259.2 |
$318.8 |
$347.0 |
$352.2 |
$328.1 |
$344.0 |
$389.2 |
$444.2 |
$467.8 |
|
Cash Aid |
116.4 |
129.6 |
145.3 |
149.1 |
142.4 |
150.3 |
155.3 |
154.7 |
159.4 |
|
Food Aid |
58.9 |
77.6 |
93.9 |
101.4 |
104.8 |
107.1 |
102.0 |
103.1 |
100.7 |
|
Education |
41.9 |
58.2 |
58.6 |
66.5 |
58.6 |
55.1 |
53.7 |
52.2 |
53.7 |
|
Housing and Development |
39.7 |
60.0 |
51.8 |
46.2 |
44.0 |
41.4 |
45.1 |
44.6 |
46.3 |
|
Social Services |
36.0 |
43.9 |
39.7 |
37.0 |
36.7 |
36.7 |
38.1 |
38.4 |
39.4 |
|
Employment and Training |
6.2 |
8.6 |
7.7 |
6.5 |
6.1 |
6.0 |
6.5 |
7.0 |
6.5 |
|
Energy Assistance |
2.9 |
10.3 |
5.6 |
4.9 |
3.6 |
3.4 |
3.6 |
3.7 |
3.6 |
|
Total |
561.2 |
707.2 |
749.7 |
763.7 |
724.3 |
744.1 |
793.6 |
847.8 |
877.5 |
Source: Prepared by the Congressional Research Service (CRS) from information contained in federal budget documents for Presidential budget submissions, FY2010-FY2018.
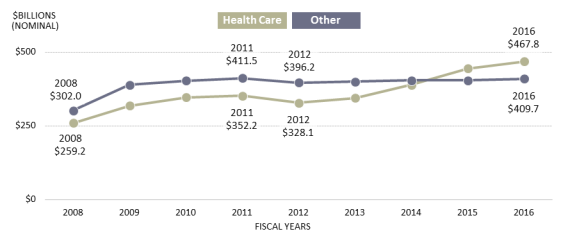
Figure 2 breaks out total federal spending on benefits and services for people with low income into two groups: health programs and all other programs. As shown in the figure, the increase in spending in the earlier portion of the period (affected by recession-related spending) stemmed from increases in both health and other program spending. However, since FY2012 the increase is attributable to higher spending on health care. Much of this is increased Medicaid spending, and partially reflects increases to states that implemented the Affordable Care Act's (ACA, P.L. 111-148, as amended)2 Medicaid expansion as well as increases in Medicaid spending caused by other factors.3
Mandatory and Discretionary Spending
The largest programs providing benefits and services to low-income people are mandatory spending programs. These are programs where spending is controlled by the terms of their authorizing laws—such as entitlements either to individuals or states—rather than the annual appropriation process. Discretionary spending is generally determined through annual appropriations.
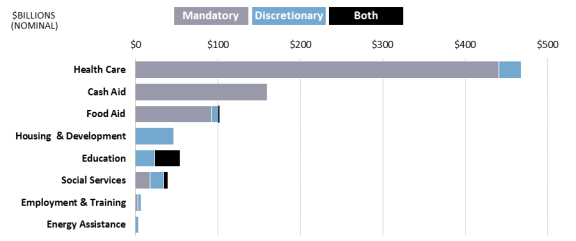
Figure 3 shows federal spending in FY2016 on benefits and services for people with low income by category and budget classification (mandatory, discretionary, or some programs have spending classified as both). The largest categories (health, cash aid, and food aid) are dominated by mandatory spending. Housing is almost entirely discretionary spending, determined through annual appropriations. Education is split between discretionary spending and the Pell Grant program, which has both mandatory and discretionary components. Social services and employment and training have a mix of mandatory spending (much of it coming from the broad-based Temporary Assistance for Needy Families (TANF) block grant) and discretionary funding. Energy assistance is entirely discretionary.
Federal Spending on Benefits and Services for Low-Income People by Program
Table 2 shows spending for federal benefits and services to low-income persons by program for FY2008 to FY2016. The programs were classified into the eight categories of spending noted above, and are ranked within each category by FY2016 spending. Note that in many categories, spending is dominated by a few large programs. For example, in FY2016, Medicaid accounted for 85% of health care spending, Supplemental Security Income and two refundable tax credits for low-income workers (the Earned Income Tax Credit and the refundable portion of the Child Tax Credit) accounted for 92% of all cash aid, Supplemental Nutrition Assistance Program (SNAP) accounted for 70% of all food aid, and Pell Grants plus aid to school districts with large shares of disadvantaged children accounted for 82% of all education aid.
Most programs had spending that was classified in a single category. The exceptions are the broad-purpose TANF block grant and SNAP. TANF, though best known as a program that provides cash assistance to needy families with children, had $6.4 billion in federal spending on cash aid, making it the fourth largest cash program and accounting for 4% of cash spending. In contrast, TANF spending on social services made it the second largest social services program (behind only Head Start), and its employment and training expenditures made it the largest employment and training program. SNAP spending was divided into its food assistance and its employment and training components. SNAP is the largest food assistance program ($70 billion in food assistance in FY2016), but it also contributed $427 million in employment and training expenditures in FY2016.
Table 2. Federal Spending on Benefits and Services for Low-Income People, by Program, FY2008-FY2016
(Millions of dollars)
|
Program |
FY08 |
FY09 |
FY10 |
FY11 |
FY12 |
FY13 |
FY14 |
FY15 |
FY16 |
|||||||||
|
Health Care |
||||||||||||||||||
|
Medicaid |
$214,015 |
$265,058 |
$290,461 |
$295,836 |
$270,914 |
$286,920 |
$329,019 |
$378,896 |
$398,217 |
|||||||||
|
Voluntary Medicare Prescription Drug Benefit—Low-Income Subsidy |
18,100 |
19,600 |
21,100 |
22,200 |
22,500 |
23,200 |
24,300 |
25,600 |
26,700 |
|||||||||
|
State Children's Health Insurance Program (CHIP) |
6,360 |
9,534 |
10,717 |
8,740 |
9,362 |
9,357 |
10,111 |
11,353 |
14,069 |
|||||||||
|
Medical Care for Veterans without Service-Connected Disability |
10,246 |
11,201 |
11,780 |
12,000 |
11,970 |
11,737 |
11,921 |
13,087 |
13,130 |
|||||||||
|
Indian Health Service |
4,347 |
5,416 |
5,668 |
5,544 |
5,729 |
5,661 |
5,910 |
6,074 |
5,207 |
|||||||||
|
Consolidated Health Centers |
2,021 |
3,665 |
3,049 |
3,295 |
3,384 |
2,882 |
3,587 |
4,701 |
5,040 |
|||||||||
|
Ryan White HIV/AIDS Program |
2,141 |
2,227 |
2,286 |
2,310 |
2,367 |
2,220 |
2,290 |
2,318 |
2,266 |
|||||||||
|
State Grants and Demonstrations |
556 |
625 |
418 |
758 |
416 |
534 |
524 |
680 |
1,536 |
|||||||||
|
Maternal and Child Health Block Grant |
666 |
662 |
661 |
656 |
639 |
605 |
632 |
637 |
637 |
|||||||||
|
Transitional Cash and Medical Services for Refugees |
296 |
282 |
353 |
353 |
323 |
401 |
391 |
383 |
532 |
|||||||||
|
Family Planning |
300 |
307 |
316 |
298 |
294 |
278 |
286 |
286 |
286 |
|||||||||
|
Breast/Cervical Cancer Early Detection |
201 |
206 |
210 |
206 |
213 |
197 |
207 |
207 |
209 |
|||||||||
|
Total Health Care |
259,249 |
318,783 |
347,019 |
352,196 |
328,111 |
343,992 |
389,178 |
444,222 |
467,829 |
|||||||||
|
Cash Aid |
||||||||||||||||||
|
Supplemental Security Income (SSI) |
48,926 |
52,446 |
54,463 |
59,854 |
53,773 |
59,756 |
62,159 |
62,055 |
66,751 |
|||||||||
|
Earned Income Tax Credit (EITC) (refundable component) |
40,600 |
42,418 |
54,712 |
55,652 |
54,890 |
57,513 |
60,087 |
60,084 |
60,580 |
|||||||||
|
Additional Child Tax Credit (refundable portion) |
16,690 |
24,284 |
22,659 |
22,691 |
22,106 |
21,608 |
21,490 |
20,592 |
20,188 |
|||||||||
|
Temporary Assistance for Needy Families (TANF) |
6,364 |
6,341 |
9,118 |
6,594 |
6,737 |
6,263 |
6,340 |
6,444 |
6,407 |
|||||||||
|
Pensions for Needy Veterans |
3,777 |
4,134 |
4,345 |
4,294 |
4,892 |
5,195 |
5,258 |
5,497 |
5,468 |
|||||||||
|
Total Cash Aid |
116,357 |
129,623 |
145,297 |
149,085 |
142,398 |
150,335 |
155,334 |
154,672 |
159,394 |
|||||||||
|
Food Aid |
||||||||||||||||||
|
Supplemental Nutrition Assistance Program (SNAP) |
37,179 |
53,396 |
68,192 |
74,943 |
77,828 |
79,365 |
73,721 |
73,615 |
70,406 |
|||||||||
|
National School Lunch Program (free/reduced price components) |
7,863 |
8,498 |
9,462 |
9,831 |
9,984 |
10,549 |
10,801 |
11,515 |
11,777 |
|||||||||
|
Special Supplemental Nutrition Program for Women, Infants and Children (WIC) |
6,400 |
7,028 |
7,245 |
7,300 |
7,168 |
6,945 |
7,019 |
6,774 |
6,864 |
|||||||||
|
School Breakfast Program (free/reduced price components) |
2,307 |
2,513 |
2,811 |
2,987 |
3,256 |
3,514 |
3,618 |
3,956 |
4,135 |
|||||||||
|
Child and Adult Care Food Program (lower-income components) |
2,029 |
2,217 |
2,358 |
2,499 |
2,616 |
2,799 |
2,920 |
3,154 |
3,259 |
|||||||||
|
Nutrition Assistance for Puerto Rico |
1,623 |
2,000 |
2,000 |
2,001 |
2,000 |
2,001 |
1,903 |
1,951 |
1,959 |
|||||||||
|
Nutrition Program for the Elderly |
756 |
905 |
817 |
820 |
814 |
765 |
807 |
812 |
834 |
|||||||||
|
Summer Food Service Program |
312 |
356 |
374 |
377 |
400 |
437 |
464 |
517 |
540 |
|||||||||
|
The Emergency Food Assistance Program (TEFAP) |
240 |
425 |
359 |
298 |
309 |
312 |
318 |
370 |
374 |
|||||||||
|
Commodity Supplemental Food Program |
141 |
165 |
183 |
196 |
189 |
187 |
180 |
198 |
223 |
|||||||||
|
Fresh Fruit and Vegetable Program |
0 |
0 |
0 |
115 |
157 |
165 |
166 |
139 |
167 |
|||||||||
|
Food Distribution Program on Indian Reservations (FDPIR) |
0 |
119 |
114 |
0 |
103 |
100 |
119 |
143 |
145 |
|||||||||
|
Total Food Aid |
58,850 |
77,622 |
93,915 |
101,367 |
104,824 |
107,139 |
102,036 |
103,144 |
100,683 |
|||||||||
|
Housing |
||||||||||||||||||
|
Section 8 Housing Choice Vouchers |
15,552 |
16,289 |
18,071 |
18,510 |
18,316 |
17,897 |
19,181 |
19,333 |
19,634 |
|||||||||
|
Section 8 Project-Based Rental Assistance |
7,004 |
9,390 |
8,991 |
9,444 |
9,311 |
8,818 |
9,870 |
9,810 |
10,680 |
|||||||||
|
Public Housing |
6,894 |
10,843 |
7,360 |
6,999 |
5,847 |
5,954 |
6,383 |
6,421 |
5,954 |
|||||||||
|
Community Development Block Grants |
3,645 |
4,733 |
3,956 |
3,341 |
3,245 |
2,971 |
3,213 |
2,664 |
3,193 |
|||||||||
|
Homeless Assistance Grants |
1,538 |
2,861 |
1,813 |
1,888 |
2,079 |
2,086 |
1,957 |
2,109 |
2,137 |
|||||||||
|
Rural Rental Assistance Program |
479 |
902 |
979 |
954 |
905 |
837 |
1,110 |
1,088 |
1,390 |
|||||||||
|
Home Investment Partnerships Program (HOME) |
1,647 |
1,911 |
1,857 |
1,485 |
1,208 |
919 |
1,023 |
848 |
961 |
|||||||||
|
Indian Housing Block Grants |
556 |
1,149 |
762 |
663 |
691 |
627 |
665 |
653 |
670 |
|||||||||
|
Water and Waste Disposal for Rural Communities |
685 |
1,370 |
1,443 |
648 |
583 |
524 |
685 |
604 |
622 |
|||||||||
|
Supportive Housing for the Elderly |
778 |
800 |
580 |
509 |
1,056 |
389 |
362 |
456 |
437 |
|||||||||
|
Housing Opportunities for Persons with AIDS (HOPWA) |
310 |
318 |
314 |
352 |
352 |
302 |
349 |
290 |
342 |
|||||||||
|
Supportive Housing for Persons with Disabilities |
256 |
284 |
216 |
149 |
243 |
102 |
209 |
207 |
189 |
|||||||||
|
Public Works and Economic Development |
170 |
285 |
149 |
115 |
129 |
0 |
133 |
101 |
111 |
|||||||||
|
Grants to States for Low-Income Housing in Lieu of Low-Income Housing Credit Allocations |
0 |
2,465 |
3,083 |
160 |
0 |
0 |
0 |
0 |
0 |
|||||||||
|
Single-Family Rural Housing Loans |
178 |
279 |
277 |
0 |
0 |
0 |
0 |
0 |
0 |
|||||||||
|
Neighborhood Stabilization Program-1 |
0 |
3,920 |
1,980 |
969 |
0 |
0 |
0 |
0 |
0 |
|||||||||
|
Tax Credit Assistance Program |
0 |
2,250 |
0 |
0 |
0 |
0 |
0 |
0 |
0 |
|||||||||
|
Total Housing |
39,692 |
60,049 |
51,831 |
46,186 |
43,965 |
41,426 |
45,140 |
44,584 |
46,320 |
|||||||||
|
Education |
||||||||||||||||||
|
Federal Pell Grants |
18,000 |
26,019 |
32,905 |
41,458 |
34,308 |
31,887 |
29,808 |
28,153 |
29,106 |
|||||||||
|
Education for the Disadvantaged—Grants to Local Educational Agencies (Title I-A) |
13,352 |
21,495 |
14,526 |
14,472 |
14,490 |
13,757 |
14,383 |
14,410 |
14,893 |
|||||||||
|
Improving Teacher Quality State Grants |
2,946 |
2,687 |
2,955 |
2,460 |
2,450 |
2,334 |
2,341 |
2,370 |
2,325 |
|||||||||
|
21st Century Community Learning Centers |
1,082 |
1,127 |
1,166 |
1,157 |
1,150 |
1,091 |
1,146 |
1,149 |
1,163 |
|||||||||
|
Federal Work-Study |
989 |
1,156 |
995 |
986 |
986 |
934 |
978 |
990 |
990 |
|||||||||
|
Federal TRIO Programs |
885 |
905 |
910 |
883 |
840 |
796 |
838 |
840 |
900 |
|||||||||
|
Indian Education |
684 |
699 |
784 |
753 |
803 |
766 |
747 |
808 |
835 |
|||||||||
|
Higher Education—Institutional Aid and Developing Institutions |
755 |
801 |
764 |
833 |
816 |
780 |
792 |
777 |
818 |
|||||||||
|
Federal Supplemental Educational Opportunity Grant |
759 |
760 |
759 |
740 |
738 |
698 |
736 |
733 |
733 |
|||||||||
|
Adult Basic Education Grants to States |
569 |
585 |
641 |
607 |
606 |
576 |
575 |
593 |
597 |
|||||||||
|
Title I Migrant Education Program |
380 |
395 |
395 |
394 |
393 |
373 |
375 |
375 |
364 |
|||||||||
|
Gaining Early Awareness and Readiness for Undergraduate Programs (GEAR-UP) |
303 |
313 |
323 |
303 |
302 |
286 |
302 |
302 |
323 |
|||||||||
|
Pre-School Development Grants |
0 |
0 |
0 |
497 |
133 |
370 |
250 |
250 |
253 |
|||||||||
|
Rural Education Achievement Program |
172 |
174 |
175 |
175 |
179 |
170 |
170 |
170 |
176 |
|||||||||
|
Mathematics and Science Partnerships |
182 |
176 |
180 |
179 |
148 |
141 |
150 |
152 |
153 |
|||||||||
|
Indian Education Grants to Local Educational Agencies |
0 |
0 |
104 |
104 |
106 |
100 |
100 |
100 |
100 |
|||||||||
|
Reading First and Early Reading First |
560 |
129 |
0 |
0 |
0 |
0 |
0 |
0 |
0 |
|||||||||
|
College Access Challenge Grants |
0 |
0 |
145 |
150 |
128 |
0 |
0 |
0 |
0 |
|||||||||
|
Academic Competitiveness and Smart Grant Program |
297 |
690 |
918 |
350 |
0 |
0 |
0 |
0 |
0 |
|||||||||
|
Education for Homeless Children and Youth |
0 |
135 |
0 |
0 |
0 |
0 |
0 |
0 |
0 |
|||||||||
|
Total Education |
41,915 |
58,246 |
58,645 |
66,501 |
58,576 |
55,059 |
53,691 |
52,172 |
53,729 |
|||||||||
|
Social Services |
||||||||||||||||||
|
Head Start |
6,877 |
9,077 |
8,757 |
7,559 |
7,968 |
7,573 |
8,105 |
8,717 |
9,119 |
|||||||||
|
Temporary Assistance for Needy Families (TANF) |
9,411 |
10,594 |
9,837 |
8,828 |
8,913 |
9,491 |
9,295 |
8,729 |
8,682 |
|||||||||
|
Child Care and Development Fund |
4,979 |
7,034 |
5,083 |
5,152 |
5,218 |
5,140 |
5,288 |
5,379 |
5,712 |
|||||||||
|
Foster Care |
4,525 |
4,705 |
4,603 |
4,456 |
4,180 |
4,133 |
4,746 |
4,669 |
4,815 |
|||||||||
|
Child Support Enforcement |
4,585 |
4,719 |
5,044 |
4,671 |
4,179 |
4,278 |
4,324 |
4,347 |
4,379 |
|||||||||
|
Adoption Assistance |
2,038 |
2,324 |
2,438 |
2,362 |
2,296 |
2,278 |
2,450 |
2,473 |
2,587 |
|||||||||
|
Social Services Block Grant |
1,700 |
2,300 |
1,700 |
1,700 |
1,700 |
1,613 |
1,577 |
1,576 |
1,584 |
|||||||||
|
Community Services Block Grant |
654 |
1,692 |
708 |
678 |
677 |
635 |
667 |
674 |
715 |
|||||||||
|
Maternal, Infant, and Early Childhood Home Visiting Program |
0 |
0 |
100 |
250 |
344 |
378 |
394 |
430 |
391 |
|||||||||
|
Legal Services Corporation |
351 |
392 |
422 |
406 |
351 |
343 |
368 |
378 |
387 |
|||||||||
|
Older Americans Act Grants for Supportive Services and Senior Centers |
351 |
361 |
368 |
369 |
367 |
348 |
348 |
348 |
348 |
|||||||||
|
Older Americans Act Family Caregiver Program |
153 |
154 |
154 |
154 |
154 |
146 |
145 |
146 |
151 |
|||||||||
|
Indian Human Services |
118 |
115 |
118 |
115 |
110 |
100 |
135 |
150 |
145 |
|||||||||
|
Chafee Foster Care Independence Program |
140 |
140 |
140 |
140 |
140 |
140 |
140 |
140 |
140 |
|||||||||
|
Guardianship |
0 |
0 |
0 |
0 |
0 |
0 |
0 |
101 |
120 |
|||||||||
|
Emergency Food and Shelter Program |
153 |
300 |
200 |
121 |
120 |
114 |
120 |
120 |
120 |
|||||||||
|
Total Social Services |
36,035 |
43,907 |
39,672 |
36,961 |
36,717 |
36,710 |
38,102 |
38,377 |
39,395 |
|||||||||
|
Employment and Training |
||||||||||||||||||
|
Temporary Assistance for Needy Families (TANF) |
1,694 |
1,826 |
2,682 |
1,845 |
1,683 |
1,579 |
1,696 |
2,228 |
2,216 |
|||||||||
|
Job Corps |
1,558 |
1,804 |
1,713 |
1,777 |
1,735 |
1,718 |
1,984 |
1,751 |
1,552 |
|||||||||
|
Workforce Investment Act (WIA) Youth Activities |
984 |
2,218 |
994 |
946 |
902 |
856 |
898 |
906 |
875 |
|||||||||
|
Workforce Investment Act (WIA) Adult Activities |
827 |
1,357 |
862 |
766 |
773 |
731 |
766 |
775 |
813 |
|||||||||
|
Supplemental Nutrition Assistance Program (SNAP) |
351 |
367 |
344 |
354 |
334 |
368 |
400 |
630 |
427 |
|||||||||
|
Community Service Employment for Older Americans |
504 |
708 |
820 |
454 |
448 |
429 |
440 |
384 |
321 |
|||||||||
|
Social Services and Targeted Assistance for Refugees |
203 |
203 |
203 |
202 |
152 |
198 |
198 |
198 |
222 |
|||||||||
|
Foster Grandparents |
109 |
109 |
111 |
111 |
111 |
105 |
108 |
108 |
108 |
|||||||||
|
Total Employment and Training |
6,230 |
8,592 |
7,729 |
6,455 |
6,138 |
5,984 |
6,490 |
6,980 |
6,534 |
|||||||||
|
Energy Assistance |
||||||||||||||||||
|
Low-Income Home Energy Assistance Program (LIHEAP) |
2,590 |
5,100 |
5,100 |
4,701 |
3,472 |
3,255 |
3,401 |
3,395 |
3,372 |
|||||||||
|
Weatherization Assistance Program |
291 |
5,240 |
517 |
234 |
126 |
182 |
234 |
255 |
270 |
|||||||||
|
Total Energy Assistance |
2,881 |
10,340 |
5,617 |
4,935 |
3,598 |
3,437 |
3,635 |
3,650 |
3,642 |
|||||||||
|
|
|
|
|
|
|
|
|
|
||||||||||
|
Totals |
561,209 |
707,162 |
749,725 |
763,686 |
724,327 |
744,082 |
793,606 |
847,801 |
877,526 |
|||||||||
Source: Prepared by the Congressional Research Service (CRS) from obligations data contained in the U.S. Budget Appendix for each of FY2010-FY2017.
Author Contact Information
Acknowledgments
Clarissa Gregory of CRS's Domestic Social Policy Division provided research assistance for this report. Amber Wilhelm, CRS Visual Information Specialist, produced the graphics in this report.
Footnotes
| 1. |
The rate of inflation used here was the Gross Domestic Product (GDP) price index; the rate of economic growth is the growth in the GDP in nominal terms, because the spending increase was not adjusted for price inflation. |
| 2. |
See CRS In Focus IF10399, Overview of the ACA Medicaid Expansion. |
| 3. |
The major factors other than the ACA Medicaid expansion affecting health expenditures and Medicaid spending are population growth, changes in the use of health care services, and changes in the prices of health care services. See Office of the Actuary, Centers for Medicare and Medicaid Services, United States Department of Health and Human Services, 2016 Actuarial Report on the Financials Outlook for Medicaid, 2016, p. 12. |