The Secure Rural Schools and Community Self-Determination Act: Background and Issues
Changes from April 21, 2020 to June 6, 2023
This page shows textual changes in the document between the two versions indicated in the dates above. Textual matter removed in the later version is indicated with red strikethrough and textual matter added in the later version is indicated with blue.
The Secure Rural Schools and Community Self-Determination Act: Background and Issues
Contents
- Background
- Forest Service 25 Percent Payments
- Bureau of Land Management O&C and CBWR Revenue-Sharing Payments
- Payments in Lieu of Taxes (PILT) Program
- Revenue-Sharing Program Concerns and Issues
- Payment Stability
- Linkage
- Declining Timber Receipts
- Secure Rural Schools and Community Self-Determination Act of 2000
- SRS Payment Formula
- Payment Election
- Payment Allocations: Title I, Title II, and Title III
- Resource Advisory Committees (RACs)
- Payment Data and Analysis
- FY2017 and FY2018 Payments
- FY2019 and FY2020 Payments
- Sequestration
- Legislative Issues
- Payment Formula
- Lands Covered
- Geographic Distribution of SRS and PILT Payments
- Source of Funds
- Authorized and Required Uses of the Payments
- Reauthorization and Duration of the Programs
- COVID-19
Figures
- Figure 1. FS and BLM Total Secure Rural Schools (SRS) Payments
- Figure 2. FS and BLM Total Secure Rural Schools (SRS) Payments by Title
- Figure 3. Forest Service (FS) Payments and Estimated Payments
- Figure 4. FS and BLM Payments, FY2001-FY2019
- Figure 5. PILT, BLM, and FS Payments Made in FY2019
- Figure 6. Source and Distribution of Forest Service (FS) Payments
Tables
- Table 1. Secure Rural Schools (SRS) Legislative History
- Table 2. FS and BLM Total Secure Rural Schools (SRS) Payments, FY2001-FY2019
- Table 3. Secure Rural Schools (SRS) Title Allocations
- Table 4. Forest Service (FS) Payments
- Table 5. Bureau of Land Management (BLM) Payments
- Table 6. FS, BLM, and PILT Payments Made in FY2019, by State
Summary
The Secure Rural Schools and Community Self-
June 6, 2023
Determination Act: Background and Issues
Katie Hoover
Under federal law, state and local governments receive payments through various programs due
Specialist in Natural
to the presence of federally owned land within their jurisdictions. Some of these payment
Resources Policy
programs are based on the revenue generated from specific land uses and activities. For example,
Congress has authorized payments to the counties containing national forests—managed by the Forest Service—based on the revenue generated from those lands. In addition, Congress has
authorized the 18 counties in western Oregon containing the Oregon and California (O&C) lands and Coos Bay Wagon Road (CBWR) lands—managed by the Bureau of Land Management (BLM)—to also receive a payment based on the revenue generated from those lands.
Revenue-generating activities include timber sales, recreation, grazing permits, and land use rentals, among other activities; timber sales have been the largest historical source of revenue. Starting in the 1990s, however, federal timber sales began to decline substantially, which led to substantially reduced payments to the counties. In response, Congress enacted the Secure Rural Schools and Community Self-Determination Act of 2000 (SRS; P.L. 106-393) as a temporary, optional program of payments, starting in FY2001. Congress has since extended the payments for every year —except FY2016—through FY2023. Counties with eligible lands (national forests, O&C, and CBWR lands) canmay opt to receive either an SRS payment or a revenue-sharing payment, althoughbased payment; most counties have elected to receive the SRS payment. Because a larger subset of counties are eligible, the bulk of the SRS payment goes to the lands managed by the Forest Service.
Each county'’s SRS payment is determined by a formula based on historic revenues, area of eligible federal lands, and county incomes. Because theypayments are based on historic, rather than current, revenue, the SRS payments are not affected by any annual fluctuations in the revenue streams from the specified lands. (This means that the SRS payments would not be impacted by any potential revenue fluctuations associated with COVID-19). The total SRS payment, however, declines by 5% annually revenue, fluctuations in current revenue streams from the specified lands do not affect SRS payments. Congress has changed the SRS payment formula several times. For example, Congress amended the formula so the payment declined by 10% annually from FY2008 through FY2011 and again amended the formula so the payment declined by 5% annually from FY2012 to FY2020. More recently, the Infrastructure Investment and Jobs Act (IIJA; P.L. 117-58) removed the annual decline and established a set annual payment amount. The program is funded through mandatory spending, with funds coming first from agency receipts and then from the Treasury. SRS payments are disbursed after the fiscal year ends, so the FY2020FY2023 SRS payment—the last authorized payment—areis due to be made in FY2021.
FY2024.
The SRS payment is divided into three parts, each named after its respective title in the authorizing law and each with different requirements for how the funds may be used. Title I payments are to be used in the same manner as the revenue-sharingbased payment (restricted to roads and schools purposes for the Forest Service payment but available for a broader range of governmental purposes for the BLM payment). Title II payments are retained by the relevant federal agency to be used for projects on or to benefit the federal lands within the county. Title III payments are to be used for specified county purposes. There are different requirements for how a county may allocate its payment among the three titles, and those requirements vary depending on the total payment amount the county is set to receivereceives. The bulk of the payment, however, is allocated to the Title I payment (around 80%-85% of the payment for most counties). Congress has continued the allocations of the total payment among titles set by each county in FY2013.
Prior to the Infrastructure Investment and Jobs Act (P.L. 117-58), Congress had frozen the payment allocations chosen by each county for the FY2013 payment and continued that allocation through the FY2020 payment.
When SRS payments temporarily expired for FY2016, county payments returned to the revenue-based system and were significantly lower than the payments received under SRS. With the pending expiration of SRS after the FY2020 paymentFY2023 payments, county payments arewould be set to return to the revenue-based system for FY2024. Congress may consider several options to address county payments, including reauthorizing SRS (with or without modifications), implementing other legislative proposals to address the county payments, and taking no action, among others. Congressional debates over reauthorization have considered the basis, level, and distribution of payments and interaction with other compensation programs (e.g., the Payments in Lieu of Taxes program); the authorized and required uses of the payments; the duration of any changes (temporary or permanent); and the source of funds (receipts, the Treasury, or other revenue source). In addition. More generally, legislation with mandatory spending—such as SRS—raises policy questions about congressional control of appropriations. Current budget rules to restrain deficit spending typically impose a procedural barrier to such legislation, generally requiring offsets by additional receipts or reductions in other spending.
The FY2019 SRS payment was distributed in April 2020. The totalIn addition, as with non-defense mandatory spending, SRS payments are generally subject to sequestration, though that has varied over the years based on when payments were reauthorized.
The FY2022 SRS payment was distributed in spring 2023. The total, post-sequester FY2022 SRS payment (Titles I, II, and III) was $254.3267.0 million ($225.8239.0 million FS; $28.427.9 million BLM). The total FY2022 SRS payment made to counties (Titles I and III only) was $228.7241.1 million ($202.6215.5 million FS; $26.0 million BLM).
Under federal law, local governments are compensated25.6 million BLM).
Congressional Research Service
link to page 6 link to page 6 link to page 7 link to page 8 link to page 8 link to page 9 link to page 9 link to page 10 link to page 13 link to page 14 link to page 15 link to page 18 link to page 19 link to page 23 link to page 23 link to page 24 link to page 25 link to page 26 link to page 26 link to page 26 link to page 29 link to page 30 link to page 30 link to page 13 link to page 15 link to page 22 link to page 27 link to page 29 link to page 10 link to page 12 link to page 16 link to page 19 link to page 20 link to page 28 Secure Rural Schools and Community Self-Determination Act: Background and Issues
Contents
Background ..................................................................................................................................... 2
Forest Service 25 Percent Payments ......................................................................................... 2 Bureau of Land Management O&C and CBWR Revenue-Based Payments ............................ 3 Revenue-Based Program Concerns and Issues ......................................................................... 4
Payment Stability ................................................................................................................ 4 Linkage ............................................................................................................................... 5 Declining Timber Receipts ................................................................................................. 5
Secure Rural Schools and Community Self-Determination Act of 2000 ........................................ 6
SRS Payment Formula .............................................................................................................. 9 Payment Election .................................................................................................................... 10 Payment Allocations: Title I, Title II, and Title III ................................................................... 11
Resource Advisory Committees (RACs) .......................................................................... 14
Payment Data and Analysis ........................................................................................................... 15
FY2019 and FY2020 Payments .............................................................................................. 19 FY2021-FY2023 Payments ..................................................................................................... 19 Sequestration ........................................................................................................................... 20
Legislative Issues .......................................................................................................................... 21
Payment Formula .................................................................................................................... 22 Lands Covered ........................................................................................................................ 22 Geographic Distribution of SRS and PILT Payments ............................................................. 22 Source of Funds....................................................................................................................... 25 Authorized and Required Uses of the Payments ..................................................................... 26 Reauthorization and Duration of the Programs ....................................................................... 26
Figures Figure 1. FS and BLM Total Secure Rural Schools (SRS) Payments ............................................. 9 Figure 2. FS and BLM Total Secure Rural Schools (SRS) Payments by Title ............................... 11 Figure 3. FS and BLM Payments, FY2001-FY2022 ..................................................................... 18 Figure 4. PILT, BLM, and FS Payments Made in FY2022 ........................................................... 23 Figure 5. Source and Distribution of Forest Service (FS) Payments ............................................. 25
Tables Table 1. Secure Rural Schools (SRS) Legislative History .............................................................. 6 Table 2. FS and BLM Total Secure Rural Schools (SRS) Payments, FY2001-FY2022 ................. 8 Table 3. Secure Rural Schools (SRS) Title Allocations ................................................................. 12 Table 4. Forest Service (FS) Payments .......................................................................................... 15 Table 5. Bureau of Land Management (BLM) Payments.............................................................. 16 Table 6. FS, BLM, and PILT Payments Made in FY2022, by State .............................................. 24
Congressional Research Service
link to page 32 link to page 35 link to page 37 Secure Rural Schools and Community Self-Determination Act: Background and Issues
Appendixes Appendix A. SRS Reauthorizations Through FY2017 .................................................................. 28 Appendix B. FY2013 Sequestration Issues ................................................................................... 31
Contacts Author Information ........................................................................................................................ 33
Congressional Research Service
Secure Rural Schools and Community Self-Determination Act: Background and Issues
nder federal law, local governments receive federal funding through various programs due to the presence of federal lands within their borders. Federally-This is in part because federally
U owned lands cannot be taxed, but may create demand for services from state or local
entities, such as fire protection, police cooperation, or longer roads to skirt the property. Many of the compensation programs are based on revenue generated from specific land uses and activities (referred to as revenue-sharingbased programs throughout this report).
Counties containing national forests managed by the Forest Service (FS) have historically received a percentage of agency revenues. Similarly, counties containing the Oregon and California (O&C) and Coos Bay Wagon Road (CBWR) lands, primarily managed by the Bureau of Land Management (BLM), also have received a payment based on agency revenues. For many decades, the primary source of revenue from those lands was the sale of timber.11 In the 1990s, timber sales declined substantially from the historic levels in the 1980s—by more than 90% in some areas—which led to substantially reduced payments to the counties. In response, Congress enacted the Secure Rural Schools and Community Self-Determination Act of 2000 (SRS) to provide a temporary, optional system to supplant the FS and BLM revenue-sharingbased programs.22 The authorization for the SRS payments originally expired at the end of FY2006, but Congress extended the payments an additional 1316 years—through FY2020FY2023, with a one-year lapse in the authorization for FY2016—through several reauthorizations.3 SRS is set to expire after the FY2020FY2023 payments are made, after which county payments are to return to a revenue-based system.
This report provides background information on FS and BLM revenue-sharingbased payments and a brief overview of a related payment program—the Payments in Lieu of Taxes (PILT) program.3 4 Because the revenue-sharingbased, SRS, and PILT payments interact with each otherone another in varying ways, proposals to amend the revenue-sharingbased programs or SRS have often included modifications to the PILT program as well. This report then provides on overview of the SRS payments and a discussion of some of the legislative issues facing Congress when considering these payment programs, including the potential effects from the Coronavirus Disease 2019 (COVID-19) pandemic.4
Background
programs.
Payment Terminology
The fol owing definitions reflect how the different payments are defined and referred to in this report (note that other sources may use different terms or report the data differently). For the payments in which both Forest Service (FS) and Bureau of Land Management (BLM) lands are applicable, the appropriate agency wil be specified in the text. BLM payment reflects the payments made to the counties containing the Oregon and California (O&C) and Coos Bay Wagon Road (CBWR) lands as authorized for that year. For years prior to FY1993, this was the respective revenue-based payment; starting in FY1993, this was the BLM safety-net payment. For years starting in FY2001, however, this generally refers to the BLM Secure Rural Schools and Community Self-Determination Act (SRS) Title I and Title II payments. BLM total payment includes the BLM payment plus the SRS Title II payment retained by the agency. FS 25 Percent Payments are the revenue-based payments authorized through the Act of May 23, 1908. Data for the 25 Percent Payments may also include the Special Act Payments as specified, such as the Payments to Minnesota
1 For more information on federal timber sales, see CRS Report R45688, Timber Harvesting on Federal Lands. 2 The Secure Rural Schools and Community Self-Determination Act of 2000 (SRS; P.L. 106-393), 16 U.S.C. §§7101-7153.
3 SRS payments for FY2021-FY2023 were reauthorized in the Infrastructure Investment and Jobs Act (IIJA; P.L. 117-58, §41202).
4 Payments in Lieu of Taxes Act of 1976 (PILT; P.L. 94-565 as amended, 31 U.S.C. §§6901-6907). For more information, see CRS Report R46260, The Payments in Lieu of Taxes (PILT) Program: An Overview.
Congressional Research Service
1
Secure Rural Schools and Community Self-Determination Act: Background and Issues
Counties. For the years FY1993 through FY2000, the data for the 25 Percent Payments also include the FS safety-net payments. FS payment reflects the payments authorized to be made to eligible counties for that year. Prior to FY2001, this includes the FS 25 Percent Payment and the FS safety-net payment. Starting in FY2001, this includes the FS revenue-based payment plus the SRS Title I and Title II payments, except in FY2016, when SRS payments were not authorized. FS total payment includes the FS county payment plus the SRS Title II payment retained by the agency. Revenue-based payment for the FS comprises the 25 Percent Payments. For the BLM, this comprises the O&C and CBWR payments. Safety-net payment includes payments made from FY1993 to FY2000 to certain counties in Washington, Oregon, and California for both FS and BLM (for Oregon, only BLM). SRS Title I, II, or III payment reflects the payment made pursuant to one or more of the SRS titles, as specified in the text. SRS total payment includes the sum of the Title I, Title II, and Title III payments.
Background
Forest Service 25 Percent Payments Forest Service 25 Percent Payments
Congress has authorized several different revenue-sharingbased payments for the counties containing lands managed by the FS.55 SRS affects one of those payments—the payments authorized under the Act of May 23, 1908, referred to as the "25 Percent Payments" in this report. The other payments (e.g., Payments to Counties for the national grasslands and Special Act Payments) are much narrower in scope and application and, consequently, much smaller.66 These payments are sometimes included in FS revenue-sharingbased payment totals, but they are not affected by the SRS payments.
Congress first directed the FS to begin revenue-sharingbased payments in appropriations laws for 1906 and 1907. For those years, the requirement was for the FS to pay 10% of its gross receipts per year to states for use on roads and schools in the counties in which the national forests are located. In 1908, Congress raised the payment to 25% of gross receipts and permanently authorized the 25 Percent Payments as mandatory spending.77 The compensation rate remained at 25% of gross receipts annually for the next 100 years, until it was changed in 2008 to 25% of average gross receipts over the previous 7 years—essentially a 7-year rolling average of receipts.8 8 Receipts come from eligible sales, leases, rentals, or other fees for using national forest lands or
5 Compensation programs related to energy and mineral development on national forest system lands are administered by the Department of the Interior (DOI) and are not addressed in this report.
6 The Payments to Counties program requires payments of 25% of net receipts generated on the national grasslands to be paid directly to the counties ($52.0 million for FY2021). Special Act Payments include various other revenue-based payments authorized for specific purposes or limited to specific places, such as the Payments to Minnesota Counties program, which provides payments to three counties in northern Minnesota based on the appraised value of certain lands within the Superior National Forest ($5.7 million for FY2021). Special act payments also include payments for quartz mined from the Ouachita National Forest in Arkansas and for revenue generated on the Quinault Special Management Area in the Olympic National Forest in Washington (~$4,000 in FY2020 for both). Data from the Forest Service (FS), FY2022 Budget Justification and FS’s Payments to Counties website at https://www.fs.usda.gov/working-with-us/secure-rural-schools/bankhead-jones-payments. For more information on these programs and FS’s mandatory appropriations generally, see CRS Report R46557, Forest Service Appropriations: Ten-Year Data and Trends (FY2011-FY2020).
7 Act of May 23, 1908, 16 U.S.C. §500. 8 P.L. 110-343 §601.
Congressional Research Service
2
Secure Rural Schools and Community Self-Determination Act: Background and Issues
Receipts come from eligible sales, leases, rentals, or other fees for using national forest lands or resources (e.g., timber sales, recreation fees, and communication site leases), although Congress has designated some activities exempt from the revenue-sharing requirement.9 Because the payments areFS revenues for the purposes of revenue-sharing payments.9 Because the payment amounts are calculated based on the average annual revenue generated during a seven-year period, the payment amounts cannot be calculated—and thus payments cannot be made— until after the most recent fiscal year in each period is completed (for example, payments reflecting the annual average for FY2014-FY2020 are to bewere made in FY2021).
The 25 Percent Payments are sometimes referred to as the Payments to States program because the FS first sends the payment to the states.1010 The states have no discretion in assigning the funds to the appropriate county, however. FS determines the amount of the total state payment to be allocated to each county based on each county'’s national forest acreage and provides that amount to the state. The states cannot retain any of the funds; the funds must be passed through to local governmental entities for use at the county level (but not necessarily to county governments themselves).1111 Each state must spend the funds on road and school programs, and state law sets forth how the payments are to be allocated between road and school projects. The state laws differ widely, generally ranging from 30% to 100% for school programs, with a few states providing substantial local discretion on the split.
Bureau of Land Management O&C and CBWR Revenue-Sharing Payments
Based Payments Congress has also enacted revenue-sharingbased programs for BLM lands for various types of resource use, including the Oregon and California (O&C) payments and Coos Bay Wagon Road (CBWR) payments.12payments.12 The O&C payments are made to the 18 counties in western Oregon containing the revested Oregon and California grant lands, which are lands that were returned to federal ownership for failure of the state to fulfill the terms of the grant. The O&C counties receive 50% of the receipts from these lands, and the funds may be used for any local governmental purposes.1313 The CBWR lands are located in two of the same counties in western Oregon that also contain O&C lands. A portion of the revenue generated from the CBWR lands also must be paid to the two counties, and those funds may be used for schools, roads, bridges, and highways.14
14
The O&C and CBWR payments are mandatory payments that are paid directly to the counties. The CBWR and O&C lands and payments are often grouped together, and in this report "O&C" “O&C” refers to both, unless otherwise specified.
9 For example, revenue generated through stewardship contracts is not counted toward the revenue-based requirement (16 U.S.C. §6591c(e)(3)(A)). For more information on the authorized uses and revenue-generating activities on the national forests, see CRS Report R43872, National Forest System Management: Overview, Appropriations, and Issues for Congress.
10 FS sometimes includes other payment programs within the Payments to States program, which is also the name of the Treasury account from which the payments are made. This includes the Payments to Counties and Payments to Minnesota Counties. SRS is included when authorized.
11 For example, funds may be allocated directly to a school district. 12 FS also manages a portion (19%) of the O&C lands. For more information, see CRS Report R42951, The Oregon and California Railroad Lands (O&C Lands): Issues for Congress. Compensation programs related to grazing, land sales, and energy and mineral development are not addressed in this report.
13 43 U.S.C. §§2601 et seq. 14 Per statute (43 U.S.C. §§2621 et seq.), 75% of the gross receipts from Coos Bay Wagon Road (CBWR) lands are deposited to a special fund and used to make tax-equivalency payments; any portion remaining in the fund after a 10-year period is transferred to the General Fund of the Treasury.
Congressional Research Service
3
link to page 30 Secure Rural Schools and Community Self-Determination Act: Background and Issues
Payments in Lieu of Taxes (PILT) Program
Payments in Lieu of Taxes (PILT) Program
In addition to the FS and BLM revenue-sharingbased programs, Congress has enacted other programs to compensate for the presence of federal land. The most widely applicable program, administered by the Department of the Interior, is the Payments in Lieu of Taxes (PILT) Program.15 (31 U.S.C. §§6901-6907). PILT payments to counties are calculated in dollarsdol ars per acre of federal land and are based on eligible federal lands, as specified in statute (the total payment amounts are restricted in counties with very low populations). The eligible lands include national forests and O&C lands, among others, in each county.
PILT payments are reduced (to a minimum payment per acre) by other payment programs as specified in statute.16 The PILT payments are reduced by the FS payments but not by the O&C payments. This means that the PILT payment for counties containing national forests is affected by the FS payment (either revenue-sharingbased or SRS), but the PILT payment for counties containing O&C lands is not similarly affected. This also means that decreases in FS payments may increase a county'’s payments under PILT in the followingfol owing year (and vice versa), although the difference is rarely proportionate. Proposals to amend the revenue-sharingbased programs or SRS have often included modifications to the PILT program.
Revenue-SharingPILT payments are reduced (to a minimum payment per acre) by other payment programs as specified in statute. For more information, see CRS Report R46260, The Payments in Lieu of Taxes (PILT) Program: An Overview.
Revenue-Based Program Concerns and Issues Program Concerns and Issues
Prior to the enactment of SRS, Congress, counties containing FS and O&C lands, and other observers raised three principal concerns about FS and O&C revenue-sharing programs,17 which werethree principal concerns about FS and O&C revenue-based programs had been raised by Congress, counties containing FS and O&C lands, and other observers:15 (1) payment stability and the annual uncertainty about payment amounts; (2) the linkage between timber revenue and county payments; and (3) the decline in FS and O&C receipts due to the decline in timber sales. SRS addresses some of these concerns, but they may again be at issue when SRS expires.
if the authorization for SRS payments were to expire. Payment Stability
One concern about the FS and O&C revenue-sharingbased payments was that payments would fluctuate annually based on the revenue received in the previous year. Even in areas with modest declines or increases in revenuetimber sales, payments have varied widely from year to year. For example, from FY1985 to FY2000, the payments from each national forest fluctuated an average of nearly 30% annually—that is, on average, a county'’s payment in any year was likely to be nearly 30% higher or lower than its payment the preceding year. This is in part due to fluctuations in timber sale locations and market forces, among other factors. Such wide annual fluctuations imposed serious budgeting uncertainties on the counties.
The concern over annual fluctuations led to Congress changing the compensation rate to a rolling seven-year average of receipts in 2008.1816 Thus, payments increase more slowly than in the past when and where national forest receipts are rising but decline more slowly when and where receipts are falling. The extent to which this provides more stability for the counties is not clear. Since this change has been enacted, most counties have opted to receive an SRS payment instead of the revenue-sharingbased payment, except for the one year when the SRS payments were not authorized. Relatedly, however, the expiration and reauthorization of the SRS payments over the past few years has introduced a different kind of budgeting uncertainty for the counties, discussed further in the " “Reauthorization and Duration of the Programs" ” section of this report.
Linkage
15 Forest Counties Payments Committee, Recommendations for Making Payments to States and Counties: Report to Congress (Washington: GPO, 2003). Hereinafter referred to as Forest Counties Payments Committee Report, 2003. The committee was established in Section 320 of the FY2001 Interior and Related Agencies Appropriations Act, P.L. 106-291.
16 P.L. 110-343 §601.
Congressional Research Service
4
Secure Rural Schools and Community Self-Determination Act: Background and Issues
Linkage
A longer-term concern is referred to as linkage. Some observers noted that because the counties received a portion of receipts, they were financially rewarded for advocating receipt-generating activities (principally timber sales) and for opposing management decisions that might reduce or constrain such activities, thus reducing the direct financial benefits from receipts (e.g., designating wilderness areas or protecting commercial, tribal, or sport fish harvests). Some interests support retaining the linkage between county compensation and agency receipts because such activities usually also provide local employment and income, especially in rural areas where unemployment is often high. Others assert that ending the linkage is important so that the direct financial incentive for maximizing receipts would be removed as one of the factors for local government officials to consider in their decisionmaking regarding use of the lands for activities other than timber sales.19
17 Declining Timber Receipts
A primary concern about the FS 25 Percent Payments and O&C payments was the effect of declining timber sale revenue on counties. National forest receipts (subject to the 25% sharing) declined from their peak of $3.02.9 billion in FY1989 to $664.3691.0 million in FY1999, in inflation-adjusted FY2019 dollars.20constant FY2022 dollars.18 The decline was primarily due to declining receipts from decreasing timber production. For example, FS harvested 12.0 billion board feet of timber in FY1989 (at a value of $2.72 billion in FY2019constant dollars); in FY1999, FS harvested 2.9 billion board feet (at a value of $525.8 million in FY2019constant dollars).2119 The decline in timber sales began in the Pacific Northwest but eventually was experienced nationwide, owing to a combination of changing forest management policies and practices, increased planning and procedural requirements, changing public preferences, economic and industry factors, and other developments. BLM experienced a similar trend in receipts over the same time period.
Consequently, the revenue-sharingbased payments to counties also declined. For example, the FY1989 FS 25 Percent Payments totaled $751.4 million (FY2019 dollars).22722.3 million.20 By FY1993, the payment was $540.6 million (FY2019 dollars).23 Similar0 million.21 Similarly to the decline in timber receipts, the decline in the revenue-sharingbased payments also began in the Pacific Northwest. For example, payments to the counties in Oregon containing national forests decreased by 20% from FY1989 to FY1993, and payments to the counties containing the
17 Forest Counties Payments Committee Report, 2003, p. 24. 18 FS revenue data compiled from annual budget documents. In nominal dollars, the receipts in FY1989 were $1.44 billion and the receipts in FY1999 were $432.5 million. Figures adjusted to constant (estimated FY2022) dollars using the Gross Domestic Product (GDP) Chained Price Index (CPI) from the White House Office of Management and Budget (OMB) Table 10.1, “Gross Domestic Product and Deflators Used in the Historical Tables” at https://www.whitehouse.gov/omb/budget/historical-tables/.
19 FS timber data compiled from annual Cut & Sold reports available at https://www.fs.usda.gov/forestmanagement/products/cut-sold/index.shtml. In nominal dollars, the value of the FY1989 timber sales was $1.31 billion, and the value of the FY1999 timber sales was $342.3 million. Figures adjusted to constant (estimated FY2022) dollars using the GDP-CPI from the White House OMB Table 10.1, “Gross Domestic Product and Deflators Used in the Historical Tables” in Historical Tables. For more information on federal timber sales, see CRS Report R45688, Timber Harvesting on Federal Lands.
20 FS historical payment data provided by FS Legislative Affairs office, 2005. In nominal dollars, the FY1989 25 Percent Payment was $361.9 million and was adjusted to constant (estimated FY2022) dollars using the GDP-CPI from the White House OMB Table 10.1, “Gross Domestic Product and Deflators Used in the Historical Tables” in Historical Tables.
21 FS historical payment data provided by FS Legislative Affairs office, 2005. In nominal dollars, the FY1993 25 Percent Payment was $304.7 million and was adjusted to constant (estimated FY2022) dollars using the GDP-CPI from the White House OMB Table 10.1, “Gross Domestic Product and Deflators Used in the Historical Tables” in Historical Tables.
Congressional Research Service
5
link to page 10 link to page 32 Secure Rural Schools and Community Self-Determination Act: Background and Issues
forests decreased by 20% from FY1989 to FY1993, and payments to the counties containing the O&C lands decreased by 28%.2422 In California, FS payments to counties decreased by 30% over that same time frame, and in Washington, FS payments decreased by 35%. The extent of declining revenues in individual counties within those states varied, ranging from minimal to substantial (and often was a function of the amount of applicable federal land located within the county).
In 1993, Congress authorized FS and BLM to make "safety-net payments" to several counties in the Pacific Northwest, including in Oregon, California, and Washington.2523 These payments were set at a declining percentage of the average revenue-sharingbased payments made to those counties between FY1986 and FY1990.2624 As federal timber sales—and revenue-sharingbased payments—began to decline nationwide, however, Congress replaced the regional safety-net payments with the nationwide SRS program starting in FY2001.
Secure Rural Schools and Community Self-Determination Act of 2000
In 2000, Congress enacted the Secure Rural Schools and Community Self-Determination Act (SRS) after extensive debates and several different bill versions.2725 The act established an optional alternative to the revenue-sharingbased payments for FS and O&C lands, starting with the FY2001 payment. Each county with FS or O&C land could choose to receive either the regular revenue-sharingbased payments or the SRS payment.
SRS was originally enacted as a temporary program, expiring after payments were made for FY2006. However, SRS was reauthorized and modified several times, and payments were authorized annually through the FY2015 payment (see Table 1 and Appendix B)A). The authorization lapsed for the FY2016 payment, but payments were reauthorized starting in FY2017 and extended through FY2023.26 SRS payments—like the revenue-basedFY2017 and are set to expire at the end of FY2020. The longest reauthorization was for four years; otherwise, the reauthorizations have extended the payments for one or two years each. SRS payments—like the revenue-sharing payments—are disbursed after the end of the fiscal year, so, barring any congressional action, payments are set to expire after the FY2023 the FY2020 payment is to be made in FY2021.
payment is made in FY2024.
Table 1. Secure Rural Schools (SRS) Legislative History
Statute (Date
Enacted)
Duration
Authorized Payment Level
Major Changes
P.L. 106-393
FY2001-FY2006 Determined by formula; average
Established program
(10/30/00)
annual payment was around $500 mil ion total
Table 1. Secure Rural Schools (SRS) Legislative History
|
Statute (Date Enacted) |
Duration |
Authorized Payment Level |
Major Changes |
|
P.L. 106-393 (10/30/00) |
FY2001-FY2006 |
Determined by formula; average annual payment was around $500 million total |
Established program |
P.L. 110-28 |
FY2007 |
$525 million |
$425 million was paid from discretionary appropriations |
(10/03/08) |
FY2008-FY2011 |
|
|
rol ing seven-year average
P.L. 112-141 |
FY2012 |
95% of FY2011 level ($344 million) |
Modified the declining full funding amount to -5% annually |
§100101
FY2012
95% of FY2011 level ($344 mil ion) Modified the declining ful funding
(07/06/12)
amount to -5% annually
P.L. 113-40 |
FY2013 |
95% of FY2012 level ($329 million) |
None |
§10
FY2013
95% of FY2012 level ($329 mil ion) None
(10/02/13)
P.L. 114-10 (04/16/15) |
FY2014-FY2015 |
|
None |
|
P.L. 115-141 Division O, §401 (03/23/18) |
FY2017-FY2018 |
95% of FY2015 level ($281 million for FY2017, $268 million for FY2018) |
Modified payment allocations |
P.L. 116-94 (12/20/19) |
FY2019-FY2020 |
95% of the previous year funding ($254 million for FY2019, ~$241 million estimated for FY2020) |
None |
Division
FY2019-FY2020
95% of the previous year funding
None
H, Title III
($254 mil ion for FY2019, ~$241
(12/20/19)
mil ion estimated for FY2020)
P.L. 117-58 Division
FY2021-FY2023
Equal to the payment made in
Established a set ful funding
D, Title XII (11/15/21)
FY2017 (~$282 mil ion)
amount and removed the annual decline; reauthorized payment elections and allocations; and modified membership requirements for Resource Advisory Committees
Source: Congressional Research Service (CRS). Source: Congressional Research Service (CRS).
Notes: Except for the FY2007 payment, Congress authorized the payments as mandatory spending, with a portion of the payment derived from agency revenue and the balance from the General Fund of the Treasury. Duration reflects the fiscal years in which authorized payments were based, not the year the payments were made. The payments were made in the followingfol owing fiscal year (e.g., the payment authorized for FY2018 was disbursed in FY2019). For more information on the reauthorizations through FY2015FY2017, see Appendix B.
a. A. a. The transition payments for specific states authorized in P.L. 110-343 for FY2008-FY2010 resulted in the
total payment amount exceeding the "full funding" amount defined in the act.
The SRS payments are determined by a formula based on historic revenue generated on the applicable federal lands. Originally, each county'’s SRS payment was calculated as the average of the three highest payments received by the county between FY1986 and FY1999. The formula was later amended to include other factors and to decline annually, as discussed in the " “SRS Payment Formula"” section. . Funds needed to achieve the full payment are mandatory spending and come first from agency receipts (excluding deposits to special accounts and trust funds) and then from "“any amounts in the Treasury not otherwise appropriated."28”27 The program is also authorized to receive discretionary funding, although this has happened only one time (FY2007, see Appendix B A for more information).
27 16 U.S.C. §7112(b)(3).
Congressional Research Service
7
link to page 12 link to page 13 link to page 13 link to page 13 link to page 13 link to page 13 Secure Rural Schools and Community Self-Determination Act: Background and Issues
The SRS payment is divided into three parts, based on three of the titles in the authorizing law. Each county can allocate the payment among the three titles, with different requirements depending on the amount a county was set to receive.
-
• Title I payments are to be used in the same manner as the revenue-
sharingbased payment (for roads and schools purposes for the FS payment, or, for the BLM payment, for any governmental purpose).29 - 28
• Title II payments are not made to the county but are retained by FS or BLM to be
used for projects on the relevant federal lands within the county.
30 - 29
• Title III payments are made to the county, and the funds are to be used for
specified county projects.
31
30
The bulk of the SRS payment (8384% on average) is for counties containing the national forests (see Table 2 andand Figure 1). This is because the FS payment is more broadly applicable, whereas the BLM payment is applicable only for the 18 counties in one state—Oregon—containing the O&C lands. Because a portion of the SRS payment is retained by the agency, it is common to see only the portion of the payment that was made to the county—the Title I and Title III payments—provided in various reports.
Table 2. FS and BLM Total Secure Rural Schools (SRS) Payments, FY2001-FY2019
FY2022
(nominal dollars in millions)
Receipt
TOTAL
Receipt
TOTAL
Yeara
FS
BLM
SRS
Yeara
FS
BLM
SRS
FY2001
$371.1
$109.7
$480.8
FY2012
$305.9
$38.0
$343.9
FY2002
373.9
110.6
484.5
FY2013
289.0
39.6
328.6
FY2003
388.8
111.9
500.7
FY2014
273.9
38.3
312.2
FY2004
393.9
113.3
507.2
FY2015
261.0
35.6
296.6
FY2005
404.9
115.9
520.9
FY2016b
—
—
—
FY2006
409.0
117.1
526.1
FY2017
249.3
32.2c
281.5
FY2007
408.1
116.9
525.0
FY2018
237.5
30.1
267.6
FY2008
517.9
105.4
623.3
FY2019
225.8
28.4
254.3
FY2009
467.6
94.9
562.4
FY2020
214.7
25.4
240.1
FY2010
415.8
85.5
501.3
FY2021
250.7
30.1
281.7
FY2011
321.9
40.0
361.9
FY2022
239.0
27.9
267.0
Sources: FS FY2001-FY2005, FY2007 data from FS legislative affairs office; FS FY2006, FY2008-FY2022 data from annual FS report, All Service Receipts: Title I, II, and III Region Summary (ASR-18-3), available at https(nominal dollars in millions)
|
FS |
BLM |
TOTAL SRS |
|
FS |
BLM |
TOTAL SRS |
|
|
FY2001 |
$371.1 |
$109.7 |
$480.8 |
FY2011 |
$321.9 |
$40.0 |
$361.9 |
|
|
FY2002 |
373.9 |
110.6 |
484.5 |
FY2012 |
305.9 |
38.0 |
343.9 |
|
|
FY2003 |
388.8 |
111.9 |
500.7 |
FY2013 |
289.0 |
39.6 |
328.6 |
|
|
FY2004 |
393.9 |
113.3 |
507.2 |
FY2014 |
273.9 |
38.3 |
312.2 |
|
|
FY2005 |
404.9 |
115.9 |
520.9 |
FY2015 |
261.0 |
35.6 |
296.6 |
|
|
FY2006 |
409.0 |
117.1 |
526.1 |
|
— |
— |
— |
|
|
FY2007 |
408.1 |
116.9 |
525.0 |
FY2017 |
249.3 |
|
281.5 |
|
|
FY2008 |
517.9 |
105.4 |
623.3 |
FY2018 |
237.5 |
30.1 |
267.6 |
|
|
FY2009 |
467.6 |
94.9 |
562.4 |
FY2019 |
225.8 |
28.4 |
254.3 |
|
|
FY2010 |
415.8 |
85.5 |
501.3 |
— |
— |
— |
— |
Sources: FS FY2001-FY2005, FY2007 data from FS legislative affairs office; and FS FY2006, FY2008-FY2018 data from annual FS report, All Service Receipts: Title I, II, and III Region Summary (ASR-18-3), available at http://www.fs.usda.gov/main/pts/home://www.fs.usda.gov/working-with-us/secure-rural-schools/payments. BLM data from annual Official Payments Made to Counties reports, available at https://www.blm.gov/programs/natural-resources/forests-and-woodlands/oc-lands.
oc-lands. Notes: FS = Forest Service; BLM = Bureau of Land Management. Some years may reflect sequestration. Totals may not add due to rounding.
a.
28 P.L. 106-393, Title I, Secure Payments for States and Counties Containing Federal Land (16 U.S.C. §§7111-7113). 29 P.L. 106-393, Title II, Special Projects on Federal Land (16 U.S.C. §§7121-7128). 30 P.L. 106-393, Title III, County Funds (16 U.S.C. §§7141-7144).
Congressional Research Service
8
link to page 32
Secure Rural Schools and Community Self-Determination Act: Background and Issues
Notes (continued): a. Receipt Year reflects the fiscal year in which the payment is based, not the year the payments are made.
The payments are made in the followingfol owing fiscal year (e.g., the FY2018 payment was disbursed in FY2019).
b.
b. SRS payments were not authorized for the FY2016 receipt year.
c. c. BLM does not include the $18.5 millionmil ion revenue-sharingbased payment made prior to the reauthorization of the
SRS payment for FY2017 as part of the total SRS payment for that year. Instead, BLM reports the FY2017 SRS payment to be $14.0 millionmil ion. This is a departure from how the FY2014 SRS payment was reported, which was also reauthorized after the revenue-sharingbased payment had been disbursed. For this report, however, the revenue-sharingbased payment is included in the Title I payment for consistency purposes.
. Figure 1. FS and BLM Total Secure Rural Schools (SRS) Payments (FY2001-FY2019) |
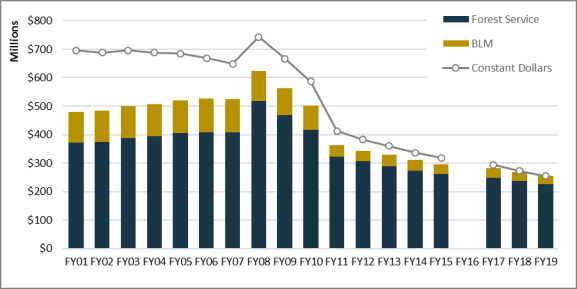 |
. Notes: FS = Forest Service; BLM = Bureau of Land Management.
|
The following sections discuss the payment formula, payment allocations, and use of the funds in more depth and provide payment data and analysis. Information on the two most recent reauthorizationsreauthorization (authorizing payments for FY2017FY2021 through FY2020FY2023) is included in the payment data section. Information on the prior reauthorizations is available in Appendix B.
A. SRS Payment Formula
The SRS payment formula has been modified several times. When SRS was first enacted, each county'county’s payment was calculated as the average of the three highest revenue-sharingbased payments received by the county between FY1986 and FY1999. The total authorized payment for FY2001-
Congressional Research Service
9
Secure Rural Schools and Community Self-Determination Act: Background and Issues
FY2006 was the sum of the payments calculated for each participating county for each year. When the program was reauthorized in FY2008, however, Congress modified the program in several ways, including by establishing a new payment formula and specifying the total authorized payment level.
The payment formula is still based on each eligible county’s historic revenue-sharingbased payments, but it also takes into account each county'the changes incorporated the county’s share of federal land and relative income level into the calculation.31 In essence, the new formula differed from the original SRS formula by basing half the payment on relative historic revenue and half on relative proportion of FS and O&C land, with an adjustment based on relative county income. This was done because the majority of payments under the original SRS went to Oregon, Washington, and California (more than 65% of payments in FY2006). Because of the altered allocation, several counties opted out of the amended SRS system, and others opted in. Because payments are based on historic revenue, fluctuations in current revenue streams from the specified lands do not affect SRS payments.
Under the modified formula, the total authorized SRS payment level—defined as full funding—was set at $500 million for FY2008.32 From FY2008 through FY2020, this full funding amount was set to decline annually (originally by 10%, later changed to 5%). The annual decline, however, was removed starting with the FY2021 payment, with the full funding amount set to a constant amount equal to the FY2017 payment.33 The full funding amount is allocated among all counties that elect to receive an SRS payment in lieu of the revenue-based payment. Thus, the fewer counties that participate (i.e., the more that opt for the revenue-based payment programs rather than SRS), the more each eligible county receives.
s share of federal land and relative income level.
Under the modified formula, the total SRS payment level—defined as full funding—is set at $500 million for FY2008, and this full funding amount declines annually (originally by 10%, later changed to 5%).32 The full funding amount is allocated among all counties that elect to receive an SRS payment in lieu of the revenue-sharing payment (eligible counties). Thus, the fewer counties that participate (i.e., the more that opt for the revenue-sharing payment programs rather than SRS), the more each eligible county receives. Each eligible county's payment is calculated using multiple steps:
- Step 1. Determine the three highest revenue-sharing payments (high-three) between FY1986 and FY1999 for each eligible county, and calculate the average of the three.33
- Step 2. Calculate the proportion of these payments in each eligible county: divide each county's high-three average [from Step 1] by the total of the high-three averages in all eligible counties, with separate calculations for FS lands and O&C lands.
- Step 3. Calculate the proportion of FS and O&C lands in each eligible county: divide each eligible county's FS and O&C acreage by the total FS and O&C acreage in all eligible counties, with separate calculations for FS lands and O&C lands.
- Step 4. Determine the base share for counties with FS lands and the 50% base share for counties with O&C lands: add the payment proportion [from Step 2] and the acreage proportion [from Step 3] and divide by 2, with separate calculations for FS lands and O&C lands.
- Step 5. Calculate each county's income adjustment: divide the per capita personal income in each county by the median per capita personal income in all eligible counties, and then square the result.34
- Step 6. Divide each county's base share or 50% base share [from Step 4] by its income adjustment [from Step 5].
- Step 7. Calculate each county's adjusted share or 50% adjusted share: divide each county's result from Step 6 by the total for all eligible counties (FS and O&C combined).
- Step 8. Calculate each county's payment: multiply each county's adjusted share or 50% adjusted share by the full funding amount.
In essence, the new formula differed from the original SRS formula by basing half the payment on relative historic revenue and half on relative proportion of FS and O&C land, with an adjustment based on relative county income. This was done because the majority of payments under the original SRS went to Oregon, Washington, and California (more than 65% of payments in FY2006). Because of the altered allocation, several counties opted out of the amended SRS system, and others opted in.
FY2008-FY2010 Transition Payments FY2008-FY2010 Transition Payments
In lieu of the payments calculated using the formula described above, counties in eight states—California, Louisiana, Oregon, Pennsylvania, South Carolina, South Dakota, Texas, and Washington—received transition payments for three fiscal years, FY2008 through FY2010 (16 U.S.C. §7113). These counties were included in the calculations, but received payments of a fixed percentage of the FY2006 payments they received under |
Payment Election
Initially, each county could elect to receive the revenue-sharingbased payment or the SRS payment and could transmit that election to the respective Governor, who transmitted the elections to the appropriate Secretary (for FS, the Secretary of Agriculture; for BLM, the Secretary of the Interior).35
31 Eligible counties are those that choose to receive payments under this program; counties that choose to continue to receive payments under the original revenue-based programs are excluded from these calculations. Relative income is calculated using an income adjustment based on the per capita personal income in each county relative to the median per capita personal income in all eligible counties. Income data is calculated using the most recent data available from the Department of Commerce Bureau of Economic Analysis. For a step-by-step guide on calculating payments, see FS’s SRS website at https://www.fs.usda.gov/working-with-us/secure-rural-schools/payments. 32 16 U.S.C. §7102(11). 33 IIJA, P.L. 117-58, §41202.
Congressional Research Service
10
link to page 15 link to page 16 link to page 16
Secure Rural Schools and Community Self-Determination Act: Background and Issues
Interior).34 Although the election was good for two years, a county could opt to receive an SRS payment one year and the revenue-sharingbased payment the following year.36 However, the The authority to make such an election had expired at the end of FY2013, and an extension hashad not been included in the three reauthorizations that since have been enacted. following three reauthorizations. Essentially, Congress had frozen the payment elections each county made for the FY2013 payment and continued that election through the FY2020 payment. Those counties that opted to receive an SRS payment in FY2013 have continued to receive an SRS payment (for those years that payments arewere authorized). Counties; counties that opted to receive a revenue-sharingbased payment in FY2013 continuecontinued to receive the revenue-sharingbased payment and havedid not hadhave the opportunity to opt in to SRS. Most (90%) counties have elected to receive the SRS payment.
The FY2021 reauthorization ended the freeze on payment elections. Initially, the freeze on payment elections was set to end for the FY2023 payment, but Congress enacted legislation removing the sunset date on the payment freeze.35 Payment Allocations: Title I, Title II, and Title III
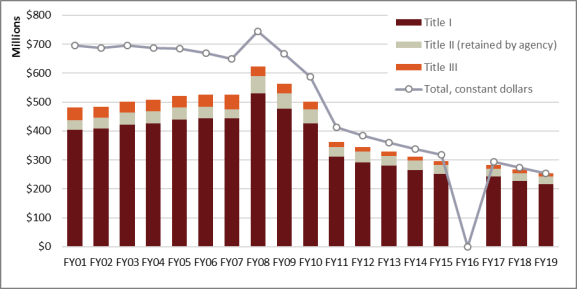
The SRS payment is divided into three parts, based on three of the titles in the SRS statute (see Figure 2 and Table 3). There are different requirements for how the payment is allocated among the three titles, depending on the payment amount a county is set to receive (see Table 3 for descriptions). Since the original authorization, Congress has modified the required allocations as well as the authorized uses of Title II and Title III funds.
Figure 2. FS and BLM Total Secure Rural Schools (SRS) Payments by Title (FY2001-FY2019) |
 |
oc-lands.
34 16 U.S.C. §§7112(b)(1)-(2). Election submissions must be submitted to the respective Secretary by August every two years. If no election is made, counties receive an SRS payment.
35 The timing of the reauthorization of SRS payments as enacted in IIJA in November 2022 was after the August deadline specified in statute for making payment elections for the following two years. P.L. 117-102, however, allowed for a payment election to be made for FY2021.
Congressional Research Service
11
link to page 18 link to page 18 link to page 17 link to page 30 link to page 30 Secure Rural Schools and Community Self-Determination Act: Background and Issues
Notes: FS = Forest Service; BLM = Bureau of Land Management. Some years reflect sequestration. The bars reflect nominal |
Regardless of the allocation, however, the bulk of each county'’s payment is allocated to Title I payments, and those funds are to be used in the same manner as the revenue-sharingbased payment (for roads and schools purposes for the FS payment; schools, roads, bridges, and highways for the CBWR lands; or any governmental purpose for the O&C lands). The Title II payment is not made to the county, but is retained by the relevant federal agency to be used for projects on the federal lands within the county and supported by local Resource Advisory Committees (RACs; see " “Resource Advisory Committees (RACs)" ” for further information). The Title III payment is made to the county, and the funds are to be used for specified county projects, such as community wildfire preparedness planning and to reimburse county expenditures for emergency services related to the federal lands.37
36
The authority to initiate projects under Title II or Title III expires on September 30, 20222025; project funds not obligated by September 30, 20232026, are to be returned to the Treasury.37
Table 3. Secure Rural Schools (SRS) Title Allocations
SRS Payment
Use of Funds
Allocation Requirements
Title I
Same as specified in the revenue-based, are to be returned to the Treasury.38 The authority for RACs to initiate projects and to obligate Title II funds had expired at the end of FY2013 and FY2014, respectively, but has been reauthorized and extended in each of the three previous SRS reauthorizations.
|
SRS Payment |
Use of Funds |
Allocation Requirements |
Title I Secure Payments |
| 80%-85%, except counties with minor distributions (less than $100,000) may allocate up to 100% |
Title II Special Projects on Federal Lands |
(less than $100,000) may
§7112d(1)(A))
allocate up to 100%
Title II
Funds may be used on projects on or to benefit the federal
0%-20%
Special Projects on
land within the county as suggested or approved by
Federal Lands
Resource Advisory Committees (RACs). At least 50% of the funds should be for projects primarily dedicated to road
maintenance or decommissioning or stream and watershed restoration. Up to 10% of the funds may be used to cover administrative expenses for RAC operations.a The authority to initiate projects expires at the end of |
0%-20% |
Title III County Funds |
Funds may not be used for lobbying activities.b The authority to initiate projects expires at the end of |
0%-20% for all other counties |
Source: CRS, compiled from 16 U.S.C. §§7101-7153.
Notes: The authorized uses and allocation requirements are as of the FY2019 reauthorization (P.L. 116-94, , Division H, Title III). The allocation requirements are codified at 16 U.S.C. §7112d(1). Counties may also allocate up to 20% of the payment to be returned to the Treasury (16 U.S.C. §§7112(d)(1)(B)(iiii i), 7112(d)(1)C(iiii i)). a. )).
a. Prior to FY2017, a portion of the Title II funds was also to be used for a program piloting the use of
separate contracts for the harvesting and sale of merchantable material. This requirement was removed in the FY2017 reauthorization (P.L. 115-141, Division O, §401(b)(1)).
b.
b. Prior to FY2008, Title III funds were not available for training and equipment costs or law enforcement
patrols but could have been used for other activities, such as for reimbursing costs associated with community service work centers, acquiring conservation or access easements, or conducting forestry education programs. The authorized uses and prohibitions were subsequently amended in several of the reauthorizations, starting in FY2008 (P.L. 110-343, §601) and most recently in the FY2017FY2021 reauthorization (P.L. 115-141(P.L. 117-58, Division O, §402).
c. D, §41202).
c. Prior to FY2008, all counties had the option to allocate up to 20% of their payment to Title III. This
requirement was added in the FY2008 reauthorization (P.L. 110-343, §601).
, §601).
In the original SRS authorization, counties with minor distributions (less than $100,000 in annual payments) could allocate 100% of the payment to Title I purposes. Counties receiving more than $100,000 in annual payments, however, could allocate only 80%-85% of their payment to Title I. The remaining 15%-20% of the payment could be allocated to Title II or Title III purposes, or the funds could be returned to the Treasury.
The allocation requirements were changed, however, in the FY2008 reauthorization.3938 Starting in FY2008, counties with modest distributions (annual payments between $100,000 and $350,000) could continue to allocate any portion of the remaining 15%-20% to Title II or Title III, as previously authorized. Counties with distributions above $350,000 were limited to allocating up to 7% of the payment to Title III. (Counties with minor distributions could continue to allocate 100% of the payment to Title I.)
The legislative text was also changed in the FY2017 reauthorization by defining counties with major distributions (payments more than $350,000 annually), but this did not result in any substantive changes to the allocation system.40 In the previous three reauthorizations, however, Congress has continued the payment allocations the counties made for the FY2013 payment. This means that counties have had the same payment allocations since that time and have not had the option to make any changes.
39
The authority to make changes to a county’s payment allocations was frozen from FY2013 through the FY2020 payment similarly to how the payment election decisions were frozen. The FY2021 reauthorization ended the freeze on payment allocations.40
38 P.L. 110-343, §601. 39 P.L. 115-161, Division O, §401(a)(3)(C). 40 Initially, the reauthorization enacted in IIJA would have set the payment allocations for the FY2021 payment at the default allocation (80% to Title I; 20% to Title II). Similar to the issue with payment elections, this was a function of (continued...)
Congressional Research Service
13
Secure Rural Schools and Community Self-Determination Act: Background and Issues
Resource Advisory Committees (RACs)
Resource Advisory Committees (RACs)
SRS authorized both FS and BLM to establish RACs to improve collaborative relationships and to provide recommendations for Title II projects.4141 Both agencies had established advisory committees for various purposes prior to the enactment of SRS. For instance, BLM'’s preexisting advisory councils in Oregon are charged with administering the duties of the RACs as established by SRS.4242 RACs also must operate in accordance with the provisions of the Federal Advisory Committee Act.4343 Pursuant to SRS, each unit of eligible federal land has access to a RAC, although the Secretary concerned may combine RACs as needed. For example, a single RAC may cover multiple national forests, or a single RAC may cover part of a national forest while other RACs cover the rest.44
44
RACs generally must consist of 15 members appointed by the respective Secretary and representing a broad and balanced range of specified community interests (i.e., 5 members each from user interests, environmental interests, and the general public). A majority of the members must be present for a meeting to achieve a quorum, and a majority of the members representing each community interest must agree for a project to be approved and for project funds to be obligated.
Because many of the RACs have been unable to meet the membership or project agreement requirements, they have been unable to approve projects. In some cases, the funds were returned to the Treasury because they were not obligated before the authority to obligate funds expired or was reauthorized. For example, over $9 million of Title II funds were returned to the Treasury at the end of FY2014.45 However, the45
To address this issue, Congress has enacted several changes to the RAC membership requirements. The Agriculture Improvement Act of 2018 (the 2018 farm bill) authorized the Secretary concerned to reduce the membership requirement to nine members if there are not enough qualified candidates.46 In addition, the46 The 2018 farm bill also established a pilot program in Montana and Arizona to allow the Secretary concerned to name a designee to appoint RAC members through FY2023 (rather than requiring the Secretary to make the appointment).47
Payment Data and Analysis48
In any given year, a combination of different FS and BLM payments may be authorized and made. Some of these payments are made entirely to counties (e.g., the FS 25 Percent Payments), whereas the agencies retain a portion of the SRS payment. Because the agency, type of payment, and payment recipient vary by year, it may sometimes be unclear which data are being reported. This is particularly an issue for the FS payment because even when SRS payments are authorized, some counties may still receive a 25 Percent Payment. This is less of an issue for the BLM payment, however, because all 18 eligible counties have elected to receive the SRS payment.
|
Payment Terminology The following definitions reflect how the different payments are defined and referred to in this report (note that other sources may use different terms or report the data differently). For the payments in which both Forest Service (FS) and Bureau of Land Management (BLM) lands are applicable, the appropriate agency will be specified in the text. BLM payment reflects the payments made to the counties containing the Oregon and California (O&C) and Coos Bay Wagon Road (CBWR) lands as authorized for that year. For years prior to FY1993, this was the respective revenue-sharing payment; starting in FY1993, this was the BLM safety-net payment. For years starting in FY2001, however, this generally refers to the BLM Secure Rural Schools and Community Self-Determination Act (SRS) Title I and Title II payments. BLM total payment includes the BLM payment plus the SRS Title II payment retained by the agency. FS 25 Percent Payments are the revenue-sharing payments authorized through the Act of May 23, 1908. Data for the 25 Percent Payments may also include the Special Act Payments as specified, such as the Payments to Minnesota Counties. For the years FY1993 through FY2000, the data for the 25 Percent Payments also include the FS safety-net payments. FS payment reflects the payments authorized to be made to eligible counties for that year. Prior to FY2001, this includes the FS 25 Percent Payment and the FS safety-net payment. Starting in FY2001, this includes the FS revenue-sharing payment plus the SRS Title I and Title II payments, except in FY2016, when SRS payments were not authorized. FS total payment includes the FS county payment plus the SRS Title II payment retained by the agency. Revenue-sharing payment for the FS includes the 25 Percent Payments. For the BLM, this includes the O&C and CBWR payments. Safety-net payment includes payments made from FY1993 to FY2000 to certain counties in Washington, Oregon, and California for both FS and BLM (for Oregon, only BLM). SRS Title I, II, or III payment reflects the payment made pursuant to one or more of the SRS titles, as specified in the text. SRS total payment includes the sum of the Title I, Title II, and Title III payments. |
Table 4 and Table 5 appointments).47 The FY2021 reauthorization renamed the farm bill pilot as the Regional Pilot Program (RPP) and established a separate National Pilot Program (NPP) available for all other states (other than Montana and Arizona) through FY2023.48 The NPP allows the FS Chief or BLM Director to nominate RAC members, with automatic approval after 30 days if the applicable Secretary does not act on the nomination.
the timing of IIJA’s enactment relative to a statutory deadline for transmitting payment allocations. P.L. 117-102, however, allowed for counties to make payment elections for FY2021.
41 16 U.S.C. §7125(a)(2). 42 43 U.S.C. §1739. For more information on BLM’s Resource Advisory Councils (RACs), see https://www.blm.gov/get-involved/resource-advisory-council.
43 5 U.S.C., App. 2. For more information, see CRS Report R44253, Federal Advisory Committees: An Introduction and Overview.
44 For more information on FS RACs, see https://www.fs.usda.gov/main/pts/specialprojects/racs. 45 U.S. Department of Agriculture Office of Inspector General, Forest Service Secure Rural Schools Program, Audit Report 08601-006-41, August 2017. Hereinafter referred to as USDA OIG 2017.
46 P.L. 115-334, Title VIII, §8702. 47 P.L. 115-334, Title VIII, §8702. 48 P.L. 117-58, Division D, §41202.
Congressional Research Service
14
link to page 19 link to page 20 link to page 20 link to page 20 link to page 20 link to page 20 Secure Rural Schools and Community Self-Determination Act: Background and Issues
Payment Data and Analysis49 In any given year, a combination of different FS and BLM payments may be authorized and made. Some of these payments are made entirely to counties (e.g., the FS 25 Percent Payments), whereas the agencies retain a portion of the SRS payment. Because the agency, type of payment, and payment recipient vary by year, it may sometimes be unclear which data are being reported. This is particularly an issue for the FS payment because even when SRS payments are authorized, some counties may still receive a 25 Percent Payment. This is less of an issue for the BLM payment, however, because all 18 eligible counties have elected to receive the SRS payment. Table 4 and Table 5 provide data on FS and BLM payments, respectively, since the first SRS payments were made in FY2001.
Payments made to counties under SRS are substantial and significantly greater than the revenue-sharingbased payments. For example, in FY2000, counties received an FS payment of $193.4 million (all figures in the text are in nominal dollars unless otherwise specified).4950 In FY2001, the first year SRS payments were made, counties received an FS payment of $361.8 million.5051 For the initial six years SRS was authorized, the counties received $359.1 million annually on average for FS SRS Title I and III payments. That was more than 55% above what the counties received annually on average for the six years prior to the enactment of SRS ($231.4 million).5152 Over the life of the program, the FS SRS Title I and III payments have averaged $325.9303.6 million annually, and the BLM SRS Title I and III payments have averaged $7263.7 million per year ($398.5 million combined, FS and BLM).52
. Table 4. Forest Service (FS) Payments
(nominal dollars in millions)
Secure Rural Schools (SRS)
Total FS
Payment
Receipt
25%
SRS
FS Total
(to
Yeara
Paymentsb
Title I
Title II
Title III
Total
Paymentc
Counties)d
FY2001
$15.6
$311.7
$24.9
$34.5
$371.1
$386.7
$361.8
FY2002
17.7
313.7
30.4
29.8
373.9
391.6
361.2
FY2003
11.2
326.6
32.6
29.5
388.8
400.0
367.3
FY2004
11.0
330.4
33.0
30.4
393.9
404.8
371.8
FY2005
8.8
340.0
33.6
31.3
404.9
413.7
380.0
FY2006
8.6
343.2
32.3
33.5
409.0
417.6
385.3
FY2007
8.1
345.0
26.5
36.6
408.1
416.2
389.7
49 Unless otherwise specified, FS data are from various reports available from https://www.fs.usda.gov/main/pts/securepayments/projectedpayments and BLM data from annual Official Payments Made to Counties reports, available from http://www.blm.gov/or/rac/ctypaypayments.php.
50 This figure includes the FS revenue-based payments as well as the safety-net payments, which were made only to certain counties in California, Oregon, and Washington.
51 This figure reflects an FS SRS Title I and III payment ($346.2 million) plus the FS revenue-based payment ($15.6 million). Including the SRS Title II payment ($24.9 million, retained by the agency), the FS SRS total payment in FY2001 was $371.1 million and the FS total payment was $386.7 million. Revenue-based data provided by FS Legislative Affairs office, 2005. FS SRS data from annual Forest Service report, All Service Receipts: Title I, II, and III Region Summary (ASR-18-3), available from http://www.fs.usda.gov/main/pts/home.
52 Including SRS Title II, the average SRS total payment for FS over the first six years the program was authorized (FY2001 through FY2007) was $392.8 million annually. The FS payments for the six years prior to the authorization of SRS (FY1995-FY2000) include the revenue-based payments plus the safety-net payments.
Congressional Research Service
15
link to page 20 link to page 20 link to page 20 link to page 20 link to page 21 link to page 21 link to page 21 Secure Rural Schools and Community Self-Determination Act: Background and Issues
Secure Rural Schools (SRS)
Total FS
Payment
Receipt
25%
SRS
FS Total
(to
Yeara
Paymentsb
Title I
Title II
Title III
Total
Paymentc
Counties)d
FY2008
11.8
439.8
51.8
26.3
517.9
529.7
477.9
FY2009
15.9
397.5
45.1
25.0
467.6
483.5
438.4
FY2010
15.9
353.4
42.0
20.4
415.8
431.7
389.7
FY2011
16.4
276.3
30.7
15.0
321.9
338.3
307.7
FY2012
17.4
259.9
31.9
14.1
305.9
323.3
291.4
FY2013
17.2
245.8
29.9
13.2
289.0
306.2
276.3
FY2014
17.2
233.0
28.3
12.6
273.9
291.0
262.7
FY2015
17.4
222.1
26.8
12.1
261.0
278.4
251.6
FY2016
64.4
0.0
0.0
0.0
0.0
64.4
64.4
FY2017
18.4
212.2
25.5
11.5
249.3
267.7
242.1
FY2018
18.3
202.2
24.4
11.0
237.5
255.8
231.5
FY2019
18.8
192.3
23.2
10.4
225.8
244.6
221.4
FY2020
18.6
182.7
22.0
9.9
214.7
233.3
211.2
FY2021
19.6
213.4
25.8
11.5
250.7
270.2
244.5
FY2022
19.0
202.6
23.6
12.9
239.0
258.1
234.5
Sources: FS FY2001-FY2005, FY2007 data from FS legislative affairs office; and FS FY2006, FY2008-FY2022 data (nominal dollars in millions)
|
|
Secure Rural Schools (SRS) |
|
| |||
|
Title I |
Title II |
Title III |
SRS Total |
||||
|
FY2001 |
$15.6 |
$311.7 |
$24.9 |
$34.5 |
$371.1 |
$386.7 |
$361.8 |
|
FY2002 |
17.7 |
313.7 |
30.4 |
29.8 |
373.9 |
391.6 |
361.2 |
|
FY2003 |
11.2 |
326.6 |
32.6 |
29.5 |
388.8 |
400.0 |
367.3 |
|
FY2004 |
11.0 |
330.4 |
33.0 |
30.4 |
393.9 |
404.8 |
371.8 |
|
FY2005 |
8.8 |
340.0 |
33.6 |
31.3 |
404.9 |
413.7 |
380.0 |
|
FY2006 |
8.6 |
343.2 |
32.3 |
33.5 |
409.0 |
417.6 |
385.3 |
|
FY2007 |
8.1 |
345.0 |
26.5 |
36.6 |
408.1 |
416.2 |
389.7 |
|
FY2008 |
11.8 |
439.8 |
51.8 |
26.3 |
517.9 |
529.7 |
477.9 |
|
FY2009 |
15.9 |
397.5 |
45.1 |
25.0 |
467.6 |
483.5 |
438.4 |
|
FY2010 |
15.9 |
353.4 |
42.0 |
20.4 |
415.8 |
431.7 |
389.7 |
|
FY2011 |
16.4 |
276.3 |
30.7 |
15.0 |
321.9 |
338.3 |
307.7 |
|
FY2012 |
17.4 |
259.9 |
31.9 |
14.1 |
305.9 |
323.3 |
291.4 |
|
FY2013 |
17.2 |
245.8 |
29.9 |
13.2 |
289.0 |
306.2 |
276.3 |
|
FY2014 |
17.2 |
233.0 |
28.3 |
12.6 |
273.9 |
291.0 |
262.7 |
|
FY2015 |
17.4 |
222.1 |
26.8 |
12.1 |
261.0 |
278.4 |
251.6 |
|
FY2016 |
64.4 |
0.0 |
0.0 |
0.0 |
0.0 |
64.4 |
64.4 |
|
FY2017 |
18.4 |
212.2 |
25.5 |
11.5 |
249.3 |
267.7 |
242.1 |
|
FY2018 |
18.3 |
202.2 |
24.4 |
11.0 |
237.5 |
255.8 |
231.5 |
|
FY2019 |
18.8 |
192.3 |
23.2 |
10.4 |
225.8 |
244.6 |
221.4 |
Sources: FS FY2001-FY2005, FY2007 data from FS legislative affairs office; and FS FY2006, FY2008-FY2019 data from annual FS reports, All Service Receipts: Final Payment Summary Report (ASR-1-0-01) and All Service Receipts: Title I, II, and III Region Summary (ASR-18-3), available at httphttps://www.fs.usda.gov/main/pts/home.
working-with-us/secure-rural-schools/payments. Notes: Totals may not add due to rounding.
a. Some years reflect sequestration. a. Receipt Year reflects the fiscal year in which the payment is based, not the year the payments are made.
The payments are made in the followingfol owing fiscal year (e.g., the FY2019 payment was disbursed in FY2020).
b.
b. The 25% Payments column also includes revenue-sharingbased payments made under various special acts, such as
the Payments to Minnesota Counties. These payments ranged from around $2 millionmil ion annually in the early FY2000s to around $6 millionmil ion starting in FY2010.
c.
c. The FS Total Payment column reflects the total of the 25% payments and the SRS total payments.
d. d. The Total FS Payment (to Counties) column reflects the total payment received by the states (and then
passed to the counties) for the year, which is the combined total of the 25% payments, SRS Title I, and SRS Title III. (SRS Title II funds are retained by the agency.)
Table 5. Bureau of Land Management (BLM) Payments
(nominal dollars in millions)
Secure Rural Schools (SRS)
O&C and
Total BLM
Receipt
CBWR
Payment (to
Title I
Title II
Title III
SRS
Yeara
Paymentsb
Total
Counties)c
FY2001
$—
$93.2
$7.7
$8.8
$109.7
$102.0
FY2002
—
94.0
8.3
8.3
110.6
102.3
FY2003
—
95.1
8.6
8.2
111.9
103.3
FY2004
—
96.3
8.8
8.2
113.3
104.5
Congressional Research Service
16
link to page 21 link to page 21 link to page 21 link to page 21 link to page 21 link to page 21 link to page 21 Secure Rural Schools and Community Self-Determination Act: Background and Issues
Secure Rural Schools (SRS)
O&C and
Total BLM
Receipt
CBWR
SRS
Payment (to
Year
Title I
Title II
Title III
a
Paymentsb
Total
Counties)c
FY2005
—
98.6
8.9
8.5
115.9
107.1
FY2006
—
99.5
8.3
9.3
117.1
108.9
FY2007
—
99.3
5.0
12.5
116.9
111.9
FY2008
—
89.6
8.7
7.1
105.4
96.7
FY2009
—
80.6
7.7
6.5
94.9
87.2
FY2010
—
72.7
7.5
5.4
85.5
78.0
FY2011
—
34.0
3.7
2.3
40.0
36.3
FY2012
—
32.3
3.7
2.0
38.0
34.3
FY2013
—
33.7
3.3
2.6
39.6
36.3
FY2014
—
32.5
3.2
2.5
38.3
35.1
FY2015
—
30.2
3.0
2.3
35.6
32.6
FY2016
20.5d
0.0
0.0
0.0
0.0
20.5
FY2017
18.5e
11.9e
1.2
0.9
14.0e
31.3
FY2018
—
25.6
2.5
2.0
30.1
27.6
FY2019
—
24.2
2.4
1.9
28.4
26.0
FY2020
—
22.8
2.3
1.8
26.9
24.6
FY2021
—
26.4
2.6
2.0
31.0
28.4
FY2022
—
23.8
2.3
1.9
27.9
27.9
Sources(nominal dollars in millions)
|
|
Secure Rural Schools (SRS) |
| |||
|
Title I |
Title II |
Title III |
SRS Total |
|||
|
FY2001 |
$— |
$93.2 |
$7.7 |
$8.8 |
$109.7 |
$102.0 |
|
FY2002 |
— |
94.0 |
8.3 |
8.3 |
110.6 |
102.3 |
|
FY2003 |
— |
95.1 |
8.6 |
8.2 |
111.9 |
103.3 |
|
FY2004 |
— |
96.3 |
8.8 |
8.2 |
113.3 |
104.5 |
|
FY2005 |
— |
98.6 |
8.9 |
8.5 |
115.9 |
107.1 |
|
FY2006 |
— |
99.5 |
8.3 |
9.3 |
117.1 |
108.9 |
|
FY2007 |
— |
99.3 |
5.0 |
12.5 |
116.9 |
111.9 |
|
FY2008 |
— |
89.6 |
8.7 |
7.1 |
105.4 |
96.7 |
|
FY2009 |
— |
80.6 |
7.7 |
6.5 |
94.9 |
87.2 |
|
FY2010 |
— |
72.7 |
7.5 |
5.4 |
85.5 |
78.0 |
|
FY2011 |
— |
34.0 |
3.7 |
2.3 |
40.0 |
36.3 |
|
FY2012 |
— |
32.3 |
3.7 |
2.0 |
38.0 |
34.3 |
|
FY2013 |
— |
33.7 |
3.3 |
2.6 |
39.6 |
36.3 |
|
FY2014 |
— |
32.5 |
3.2 |
2.5 |
38.3 |
35.1 |
|
FY2015 |
— |
30.2 |
3.0 |
2.3 |
35.6 |
32.6 |
|
FY2016 |
|
0.0 |
0.0 |
0.0 |
0.0 |
20.5 |
|
FY2017 |
|
|
1.2 |
0.9 |
|
31.3 |
|
FY2018 |
— |
25.6 |
2.5 |
2.0 |
30.1 |
27.6 |
|
FY2019 |
— |
24.2 |
2.4 |
1.9 |
28.4 |
26.0 |
Sources: CRS, compiled from the BLM SRS Official Payment reports and the Timber Receipt payment reports available at https://www.blm.gov/programs/natural-resources/forests-and-woodlands/oc-lands.
. Notes: Totals may not add due to independent rounding. As of the date of publication of this report, BLM has not released data on its FY2019 payments.
Some years reflect sequestration. O&C = Oregon and California; CBWR = Coos Bay Wagon Road.
a. Receipt Year reflects the fiscal year in which the payment is based, not the year the payments are made.
The payments are made in the followingfol owing fiscal year (e.g., the FY2018 payment was disbursed in FY2019).
b.
b. The O&C Payments are made to 18 counties in Oregon containing the Oregon and California Railroad
Grant lands, and the CBWR Payments are made to 2 of those same counties, which contain the Coos Bay Wagon Road lands. These payments are not made in the years for which SRS is authorized because all of the eligible counties have opted to receive the SRS payments.
c.
c. The Total BLM Payment (to Counties) column reflects the total payment received by the counties for the
year, which is the combined total of the O&C and CBWR payments, and SRS Title I and SRS Title III. (SRS Title II funds are retained by the agency.)
d.
d. This figure reflects $1.4 millionmil ion paid in FY2018 as a "“pop-up"” payment repaying funds that were initially
withheld due to sequestration.
e.
e. The O&C and CBWR payments were made prior to the reauthorization of the SRS payment for FY2017.
The SRS reauthorization specified that the FY2017 SRS payment was to be offset by the already distributed payments. BLM reports the FY2017 SRS payment to be $14.0 millionmil ion, which is the total payment after accounting for the $18.5 millionmil ion O&C and CBWR payment. This is a departure from how BLM reported the FY2014 SRS payment, which was also reauthorized after the revenue-sharingbased payment had been disbursed. For that year, BLM included the O&C and CBWR payment as part of the SRS Title I payment. Throughout most of this report, the O&C and CBWR payment is included in the SRS Title I payment for consistency purposes, , bringing the Title I total to $30.4 millionmil ion and the SRS total to $32.5 million.
Figure 3 shows FS payments compared tomil ion.
Congressional Research Service
17
link to page 22
Secure Rural Schools and Community Self-Determination Act: Background and Issues
Initially, SRS payments were higher than estimates of what the payments would have been had SRS not been enacted. To illustrate, FS receipts (for revenue-sharingbased purposes) in FY2001 totaled $271.3 million.5353 Without SRS or the safety-net payments, the FS 25 Percent payment would have been around $67.8 million for that year. With SRS, the FS payment in FY2001 totaled $361.8 million.5454 Similarly, BLM receipts from the O&C lands totaled approximately $16.4 million in FY2001.5555 Without SRS or the safety-net payments, the 50% revenue-sharingbased payment would have been approximately $8.2 million in FY2001, compared towith the $102.0 million payment under SRS (Title I and Title III).
SRS (Title I and Title III).56
|
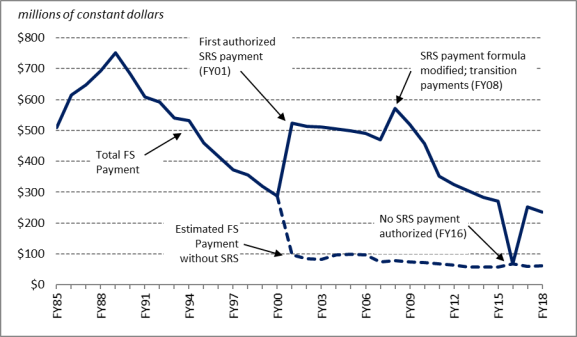 |
|
Under the original payment formula, the first SRS Title I and Title III payments were $448.2 million (FS and BLM combined) for FY2001 and increased to $493.5 million for FY2007 (see Figure 4).573). The SRS Title I and Title III payments increased and peaked for FY2008 ($562.8 million) when the payment formula was modified.58 The SRS payments declined steeply over the next few years in part based on the annual 10% decline in the full funding level, but also because certain states were no longer receiving the higher transition payments. The annual decline was changed to 5% starting in FY2012. With the exception of FY2016, when SRS payments were not authorized, the payments have continued to decline by 5% annually.
Figure |
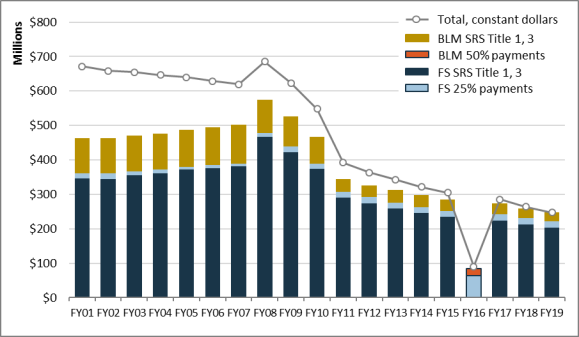 |
FY2022
Source: Forest Service (FS) payment data are from the annual FS report, All Service Receipts: Final Payment Summary Report PNF (ASR-10-01), available at .
53 Data provided by the Forest Service Legislative Affairs Office, February 21, 2013. 54 This figure reflects an SRS Title I and III payment of $346.2 million plus $15.6 million revenue-based payment. Including the SRS Title II payment ($24.9 million, retained by the agency), the FS SRS total payment in FY2001 was $371.1 million and the FS total payment was $386.7 million.
55 Historical data on O&C receipts and payments from BLM Legislative Affairs office, 2011.
Congressional Research Service
18
link to page 12 link to page 19 link to page 20 link to page 32 Secure Rural Schools and Community Self-Determination Act: Background and Issues
Notes: SRS payments were not authorized for FY2016, so the payments made that year were the revenue- |
Some years reflect sequestration.
Because SRS payments were not authorized for FY2016, the counties received a revenue-sharing based payment of $84.9 million ($64.4 million for FS; $20.5 million for BLM).5956 Had SRS been authorized, the SRS payment would have been $254.7 million (95% of the FY2015 payment). When SRS payments were reauthorized for FY2017, the full funding amount was set at 95% of the FY2015 payment amount.
FY2017 and FY2018 Payments60
FY2019 and FY2020 Payments57 SRS payments were reauthorized for FY2017 and FY2018 in the Stephen Sepp Wildfire Suppression Funding and Forest Management Activities Act, enacted as Division O of theFY2019 and FY2020 in the Further Consolidated Appropriations Act, 2018 (P.L. 115-141, commonly referred to as the FY2018 omnibus).61 The reauthorization was signed into law on March 23, 2018, after the FS and BLM had distributed the FY2017 revenue-sharing payments to the states and counties.
Because the revenue-sharing payment had already been distributed for the year, the reauthorization included provisions for a "make-up" FY2017 SRS payment.62 This make-up payment was set at 95% of the FY2015 SRS payment level, since there had been no payment for FY2016 on which to base or calculate the annual decline. The counties received a payment that was the difference between the revenue-sharing payment they already received and their authorized SRS payment. In effect, the counties received their FY2017 SRS payment in two installments.
The FS SRS payment (Titles I and III) was $223.7 million for FY2017, and the payment was $213.2 million for FY2018.63 BLM does not officially include the $18.5 million revenue-sharing payment made prior to the reauthorization of the SRS payment for FY2017 as part of the total SRS payment for that year. Instead, BLM reports the FY2017 SRS total payment to be $14.0 million.64 This is a departure from how the FY2014 SRS payment was reported, which was also reauthorized after the revenue-sharing payment had been disbursed. For consistency purposes in this report, the revenue-sharing payment will be included in the Title I payment. Thus, the BLM SRS payment was $31.3 million for FY2017 and was $27.6 million for FY2018.65 Combined, the FS and BLM SRS payment was $255.0 million in FY2017 and $240.8 million in FY2018.66
FY2019 and FY2020 Payments
SRS payments were reauthorized for FY2019 and FY2020 in the Further Consolidated Appropriations Act, FY2020 (P.L. 116-94, Division H, Title III). The reauthorization also extended the deadlines for the authority to initiate projects under Title II or Title III but did not include any other changes to the program or the payments.67 Those counties that opted to receive an SRS payment for FY2013 are to automatically receive the FY2019 payment, and the payment is to be allocated among the titles based on the allocations made by the county in FY2013.
Unlike the previous two reauthorizations, this reauthorization was enacted before the revenue-sharing payments had been disbursed. For FY2019, the SRS total payment for FS and BLM combined was $254.3FY2020 (P.L. 116-94, Division H, Title III). The reauthorization also extended the deadlines for the authority to initiate projects under Title II or Title III but did not include any other changes to the program or the payments.58 Those counties that opted to receive an SRS payment for FY2013 automatically received the FY2019 payment, and the payment was allocated among the titles based on the allocations made by each county in FY2013.
Unlike earlier reauthorizations, this reauthorization was enacted before the revenue-based payments had been disbursed. For FY2019, the SRS total payment for FS and BLM combined was $254.3 million and the combined SRS payment made to counties (Title I and Title III) was $228.7 million. The FS SRS total payment was $225.8 million for FY2019 and the FS SRS payment made to counties (Title I and Title III) was $202.6 million. The BLM SRS total payment was $28.4 million for FY2019, and the BLM SRS payment made to counties (Title I and Title III) was $26.0 million. See also Table 2, Table 4, and Table 5.
For FY2020, the SRS total payment for FS and BLM combined was $241.5 million and the combined SRS payment made to counties (Title I and Title III) was $217.2 million. The FS SRS total payment was $214.7 million for FY2020, and the FS SRS payment made to counties (Title I and Title III) was $192.6 million. The BLM SRS total payment was $26.8 million for FY2020, and the BLM SRS payment made to counties (Title I and Title III) was $25.6 million.
FY2021-FY2023 Payments SRS payments were reauthorized for FY2021, FY2022, and FY2023 in the Infrastructure Investment and Jobs Act (IIJA; P.L. 117-58, Division D, Title XII). The reauthorization set the payment level (full funding amount) as equal to the payment made in FY2017, removing the annual decline in payment levels. The payments received by counties for FY2021-FY2023 will not necessarily equal the payment that county received in FY2017. This is because the payment formula is based on the total number of counties that receive an SRS payment, meaning each
56 The revenue-based payment initially disbursed by BLM was $19.1 million, because BLM withheld 6.9% of the payment pursuant to the sequestration order for FY2016 nonexempt, nondefense mandatory spending. BLM later reversed this decision, and issued a payment of $1.4 million in FY2018 to account for the difference. Although the payment was not made until FY2018, the $1.4 million is included in the FY2016 payment in this report for consistency.
57 For information on payments from earlier authorizations, see Appendix A. 58 16 U.S.C. §7128, §7144.
Congressional Research Service
19
link to page 12 link to page 19 link to page 20 link to page 35 Secure Rural Schools and Community Self-Determination Act: Background and Issues
county’s payment may vary based on the number of participating counties, but also because counties may alter their payment allocations, and subsequently, the amount they receive. IIJA, and subsequent legislation enacted by the 117th Congress, ended the freeze on payment elections and allocations and modified RAC membership requirements.59
For FY2021, the SRS total payment for FS and BLM combined was $281.7 million and the combined SRS payment made to counties (Title I and Title III) was $228.7 million.68253.3 million. The FS SRS total payment was $225.8250.7 million for FY2019FY2021 and the FS SRS payment made to counties (Title I and Title III) was $202.6 million.69224.9 million. The BLM SRS total payment was $28.431.0 million for FY2019, FY2021, and the BLM SRS payment made to counties (Title I and Title III) was $26.0 million.70
Full funding for the FY2020 total payment is estimated to be approximately $241 million (95% of the FY2019 payment).
Sequestration
As nonexempt, nondefense mandatory spending, the revenue-sharing28.4 million. See also Table 2, Table 4, and Table 5.
For FY2022, the SRS total payment for FS and BLM combined was $267.0 million and the combined SRS payment made to counties (Title I and Title III) was $241.1 million. The FS SRS total payment was $239.0 million and the FS SRS payment made to counties (Title I and Title III) was $215.5 million. The BLM SRS total payment was $27.9 million and the BLM SRS payment made to counties (Title I and Title III) was $25.6 million.
The difference in payments between FY2021 and FY2022 is due to sequestration, as discussed below.
Sequestration As nonexempt, nondefense mandatory spending, the revenue-based payments and the SRS payments may be subject to an annual sequestration of budgetary authority through FY2029 pursuant to the Budget Control Act of 2011.7160 The extent that the payments are subject to sequestration has been controversial, starting with the sequestration order issued for FY2013.72
61
Generally, whether the revenue-sharingbased payments and the SRS payments were subject to annual sequestration depended on the timing of the enactment of the SRS reauthorization in relation to the calculation and publication of the sequestration order for the applicable year.7362 Because the FY2014-FY2015 and FY2017-FY2018 reauthorizations were enacted after the sequestration orders were issued for those years, both FS and BLM—eventually—interpreted that the payments were not subject to sequestration for those fiscal years. At different times during those years, , however, both FS and BLM have withheld funds for sequestration during those years and haveand later reversed their decisions and remitted the funds. For example, FS initially withheld 6.2% of the FY2018 SRS payment for sequestration and then reversed the decision and issued those funds later in the year. Similarly, BLM initially interpreted the revenue-sharingbased payment for FY2016 as being subject to sequestration but later reversed the decision and issued a "“pop-up"” payment to cover the difference a couple of years later. It is unclear how sequestration will be treated for the FY2019 and FY2020 payments.
59 Although IIJA ended the freeze on payment elections and allocation decisions, the law was enacted after the due dates established in statute, meaning the authority to implement those changes would have been delayed. P.L. 117-102, however, allowed for counties to make payment election and allocation decisions for FY2021.
60 P.L. 112-25. For more information, see CRS Report R42972, Sequestration as a Budget Enforcement Process: Frequently Asked Questions or CRS Report R45941, The Annual Sequester of Mandatory Spending through FY2029.
61 For more information on the FY2013 sequestration issues, see Appendix B. 62 The sequestration reports are available from https://www.whitehouse.gov/omb/legislative/sequestration-reports-orders/.
Congressional Research Service
20
Secure Rural Schools and Community Self-Determination Act: Background and Issues
The FY2021 payments were not subject to sequestration, but the FY2022 payments were subject to sequestration (5.7%).63
Legislative Issues Legislative Issues
Congress may consider severala range of options to address the expiration of the SRS payments at the end of FY2020. These include reauthorizing SRS, with or without modifications, implementing other legislative proposals to address FS or BLM payments, or taking no action (thus continuing the revenue-based system that took effect upon the program'’s expiration). Several issues have been raised about payment programs generally and SRS specifically, including the
- payment formula,
- lands covered,
-
• payment formula, • lands covered, • geographic distribution of the payments,
- • source of funds,
- • authorized and required uses of the payments,
- • lack of implementing regulations, and
- • duration of the payments.
duration of the payments.
In addition, Congress may be interested in the potential impact of the COVID-19 pandemic on SRS and the revenue-sharing payments. Each of these issues is discussed in the following sections.
If Congress were to reauthorize SRS, modify it, or both (or the FS and BLM payment programs generally), there would be a range of potential fiscal impacts. If the legislative option were to include any new mandatory spending, then it could be subject to congressional pay-as-you-go (PAYGO) or other budgetary rules. If the new mandatory spending were to result in an increase in the deficit (in excess of the baseline), these rules would require budgetary offsets through increasing revenue or decreasing other spending.7464 Alternatively, Congress may choose to waive or set aside these rules. Congress has at times provided such a waiver by including a specific type of provision, called a reserve fund, for SRS in the annual budget resolution. Several SRS reauthorizations, however, have been included in large legislative packages and as such have been offset by unrelated programs. Further, Congress might consider funding the program through the regular annual discretionary appropriations process (the program was funded through discretionary appropriations once, for FY2007). This would provide less certainty of funding from year to year, as funding for the program would compete with other congressional priorities within overall budget constraints.
In general, any legislative option that results in a higher authorized payment (whether through SRS or another payment program) would either require a larger offset or would increase the federal deficit. Depending on the specific changes, however, many or most of the counties would receive higher payments. Modifications that result in a lower authorized payment would have the opposite potential fiscal impact to the Treasury but would also likely result in lower payments to the counties.
63 FS, SRS Sequestration in Previous Years, https://www.fs.usda.gov/sites/default/files/sequestration-chart-2019-2023.pdf.
64 For an overview of federal budget procedures, see CRS Report 98-721, Introduction to the Federal Budget Process, or CRS Report R45789, Long-Term Budgeting within the Congressional Budget Process: In Brief.
Congressional Research Service
21
link to page 27 link to page 28 Secure Rural Schools and Community Self-Determination Act: Background and Issues
Payment Formula Payment Formula
The original SRS formula was based entirely on the revenue generated historically by the eligible lands. The total authorized payment was the sum of the payments calculated for each participating county and fluctuated annually based on participation. Congress amended the formula to also take into account each county'’s share of federal land and relative income level and established an annually declining payment level. Though the payment level declines by 5% annually,. For several years, the formula declined annually; this was changed starting with the FY2021 payment. The payment level is set at a constant rate, though the formula does not include any adjustment for inflation.
Congress may consider modifying the SRS payment formula in a variety of ways. These include relatively minor changes, such as by adjusting thechanges such as reapplying an annual decline so that the payments continue to decrease annually but at a different rate, or so that payments increase annually, or so that payments are set at a constant rate. Another modification could be adding an inflation adjustment to the formula. Alternatively, Congress may consider more comprehensive modifications, such as using a different historical revenue range, or adjusting the formula by other factors (e.g., population). In addition, some have proposed combining SRS, PILT, and other revenue-sharingbased payment programs.75
65 Lands Covered
SRS provides payments to the counties containing national forests (managed by the FS) and the O&C lands (managed by BLM). Federal lands managed by other agencies, as well as other lands managed by FS or BLM, were not included in SRS. For example, national forests and national grasslands are both part of the National Forest System managed by the FS, although the laws authorizing their establishment differ. Both are subject to a revenue-sharingbased requirement with the counties containing those lands—although the counties containing national grasslands receive 25% of net receipts—and were excluded from SRS. The counties containing national forests receive 25% of gross receipts averaged over the previous seven years and were included in SRS. It is unclear why the national grassland payments were not included in SRS; it is also unclear why the national grasslands payments are based on net receipts, and the national forests payments are based on gross receipts.
Counties containing other types of federal lands may receive little or no compensation. PILT provides compensation to counties containing a broad array of federal lands, but many lands—inactive military bases, Indian trust lands, and certain wildlife refuge lands, for example—are excluded from PILT. The counties containing the national forests and O&C lands, however, get PILT payments in addition to the SRS or revenue-sharingbased payments. Congress could consider several options related to extending a compensation program to all tax-exempt federal lands and trust lands, although determining the basis of compensation likely would generate significant debate.76
66 Geographic Distribution of SRS and PILT Payments
Another issue for Congress is the geographic allocation of federal land payment programs generally, and specifically the distribution of the SRS and PILT payments (seesee Figure 5)4). Table 6
65 Mark Haggerty, “Rethinking the Fiscal Relationship Between Public Lands and Public Land Counties: County Payments 4.0,” Humboldt Journal of Social Relations, vol. 1, no. 40 (2018), pp. 116-136. 66 For more discussion, see CRS Report R42439, Compensating State and Local Governments for the Tax-Exempt Status of Federal Lands: What Is Fair and Consistent?.
Congressional Research Service
22
link to page 28
Secure Rural Schools and Community Self-Determination Act: Background and Issues
. Table 6 shows the payments that each state received in FY2019.77FY2022.67 The BLM SRS payment is made to one state—Oregon—for the O&C lands, and Oregon received the largest FS SRS payment. In total, Oregon received one-fifthnearly 30% of the total SRS payments made in FY2019FY2022. The next-largest SRS payments were in California and Idaho, which both received 1211% and 109% of the SRS payment that year, respectively. PILT payments are more evenly distributed, with no state receiving more than 10% of the total payments.
California receiving the largest share (11%) in FY2022. Oregon received the highest combined SRS and PILT payment in FY2022 (12%), followed by California (11%) and Idaho (7%).
The preponderance of payments going to western states is in large part reflective of the large percentage of federal lands located within those states.78
68
Figure FY2022
(sum total of all payments |
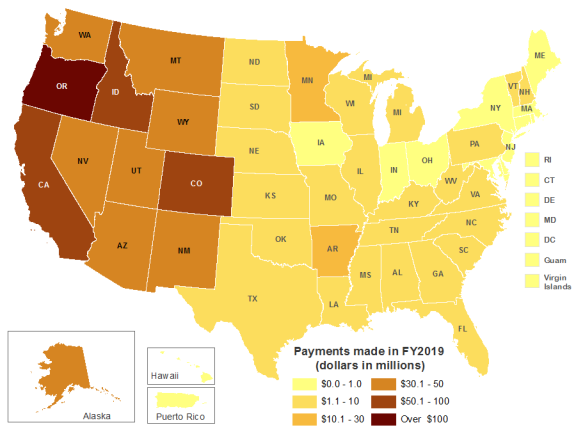 |
per state) Source: Prepared by CRS from data reported in Table 6. Notes: The data reflect payments made in |
Table 6. FS, BLM, and PILT Payments Made in FY2019FY2022, by State
(in thousands of nominal dollars)
FS and
FS and
BLM
BLM
Payments
PILT
Payments
PILT
Alabama
$1,670.0
$1,635.8
Nebraska
$170.0
$1,313.2
Alaska
10,837.0
33,486.1
Nevada
3,495.0
29,146.7
Arizona
10,256.0
41,186.8
New Hampshire
433.0
2,177.3
Arkansas
6,531.0
8,022.9
New Jersey
0.0
121.0
California
29,942.0
58,778.2
New Mexico
9,800.0
43,629.7
Colorado
12,607.0
44,194.6
New York
18.0
184.3
Connecticut
0.0
35.6
North Carolina
1,583.0
5,014.1
Delaware
0.0
25.1
North Dakota
0.4
1,900.1
Florida
2,448.0
6,505.6
Ohio
226.0
883.3
Georgia
1,345.0
3,190.4
Oklahoma
950.0
3,782.3
Hawaii
0.0
425.3
Oregon
76,373.3
25,975.9
Idaho
23,429.0
35,794.3
Pennsylvania
2,885.0
1,344.1
Il inois
216.8
1,471.3
Rhode Island
0.0
0.0
Indiana
239.0
736.4
South Carolina
1,549.0
1,473.1
Iowa
0.0
562.3
South Dakota
1,373.0
7,608.2
Kansas
0.0
736.4
Tennessee
1,071.0
2,975.4
Kentucky
1,374.0
562.3
Texas
2,141.0
6,087.2
Louisiana
1,663.0
1,514.5
Utah
8,206.0
43,452.5
Maine
65.0
762.7
Vermont
285.0
1,104.1
Maryland
0.0
130.3
Virginia
1,484.0
6,071.9
Massachusetts
0.0
126.7
Washington
16,022.0
26,312.4
Michigan
3,148.0
5,656.7
West Virginia
1,615.0
3,618.0
Minnesota
8,332.0
5,290.8
Wisconsin
1,506.0
3,910.9
Mississippi
4,788.0
2,622.0
Wyoming
5,012.0
31,521.8
Missouri
3,207.0
4,744.4
Othera
190.0
148.9
Montana
14,382.0
38,238.8
Total
275,465.2
549,416.6
Sources: Forest Service (FS) data from FS, “(in thousands of nominal dollars)
|
FS and BLM Payments |
PILT |
FS and BLM Payments |
PILT |
|||||
|
Alabama |
$1,485.0 |
$1,375.4 |
Nebraska |
$139.2 |
$1,202.9 |
|||
|
Alaska |
9,396.3 |
30,941.0 |
Nevada |
3,331.5 |
27,250.0 |
|||
|
Arizona |
9,805.5 |
38,718.1 |
New Hampshire |
439.8 |
2,049.4 |
|||
|
Arkansas |
5,450.0 |
7,418.6 |
New Jersey |
0.0 |
120.1 |
|||
|
California |
26,751.5 |
51,729.7 |
New Mexico |
9,601.4 |
40,268.2 |
|||
|
Colorado |
11,801.5 |
40.94 |
New York |
17.7 |
168.9 |
|||
|
Connecticut |
0.0 |
33.1 |
North Carolina |
1,494.6 |
4,749.0 |
|||
|
Delaware |
0.0 |
23.7 |
North Dakota |
0.5 |
1,849.6 |
|||
|
Florida |
2,371.0 |
5,936.1 |
Ohio |
220.8 |
437.1 |
|||
|
Georgia |
1,239.8 |
2,818.4 |
Oklahoma |
795.5 |
3,411.8 |
|||
|
Hawaii |
0.0 |
402.3 |
Oregon |
46,651.4 |
37,168.8 |
|||
|
Idaho |
22,499.5 |
32,271.8 |
Pennsylvania |
2,934.1 |
1,217.3 |
|||
|
Illinois |
261.9 |
1,269.4 |
Rhode Island |
0.0 |
0.0 |
|||
|
Indiana |
221.6 |
650.6 |
South Carolina |
1,474.0 |
844.9 |
|||
|
Iowa |
0.0 |
529.2 |
South Dakota |
1,301.0 |
7,121.6 |
|||
|
Kansas |
0.0 |
1,272.4 |
Tennessee |
932.3 |
2,547.9 |
|||
|
Kentucky |
1,376.0 |
2,640.0 |
Texas |
2,021.9 |
5,648.1 |
|||
|
Louisiana |
1,534.8 |
1,119.4 |
Utah |
8,558.9 |
40,938.3 |
|||
|
Maine |
62.4 |
718.4 |
Vermont |
259.9 |
1,137.0 |
|||
|
Maryland |
0.0 |
126.5 |
Virginia |
1,341.7 |
5,765.3 |
|||
|
Massachusetts |
0.0 |
115.9 |
Washington |
14,929.9 |
23,059.2 |
|||
|
Michigan |
3,203.7 |
5,146.2 |
West Virginia |
1,582.4 |
3,358.4 |
|||
|
Minnesota |
8,156.8 |
5,234.6 |
Wisconsin |
1,381.1 |
3,424.1 |
|||
|
Mississippi |
4,504.5 |
2,163.0 |
Wyoming |
4,615.4 |
30,210.2 |
|||
|
Missouri |
3,008.1 |
4,118.0 |
|
133.0 |
75.2 |
|||
|
Montana |
14,176.9 |
33,990.2 |
Total |
|
515,729.5 |
Sources: Forest Service (FS) data from FS, "All Service Receipts (ASR), Final Payment Summary Report PNF (ASR-10-01),"” at https://www.fs.usda.gov/Internet/FSE_DOCUMENTS/fseprd622581.pdf.sites/default/files/2022-04/Final-2021-10-1-Report.pdf. Bureau of Land Management (BLM) data from U.S. Dept. of the Interior (DOI), BLM, FY2018FY2021 Secure Rural Schools Act Payments, at https://www.blm.gov/sites/blm.gov/files/orwa-srs-2018sites/default/files/docs/2023-03/orwa-srs-2021-payments.pdf. Payments in Lieu of Taxes (PILT) data from DOI, Payments in Lieu of Taxes (PILT) Payments by State, at https://www.nbc.gov/pilt/states-payments.cfm.
. Notes: The data reflect payments made in FY2019FY2022. This includes the FY2019FY2022 PILT payment and the FY2018 FY2021 BLM and FS payments made in FY2019FY2022. The FS payments include the revenue-sharingbased payment and FS SRS Title I and Title III payments. The BLM payment consists of the SRS Title I and Title III payments ($32.6 million), which were, which are paid to the Oregon and California (O&C) counties in Oregon only.
a. "Other" a. “Other” includes the District of Columbia, Guam, Puerto Rico, and the Virgin Islands.
Congressional Research Service
24
link to page 29
Secure Rural Schools and Community Self-Determination Act: Background and Issues
Source of Funds Source of Funds
As noted above, the FS 25 Percent Payments and BLM'’s O&C payments are permanently appropriated mandatory spending, with the funds coming from eligible agency receipts. Congress specified that the SRS payments are to first come from discretionary appropriations, then agency receipts, and if agency receipts are not sufficient to cover the entire payment, the remainder of the payment comes from the General Fund of the Treasury.7969 Congress has funded SRS through discretionary appropriations only one time (FY2007).8070 Agency receipts have never been sufficient to cover the entire SRS payment, so a portion has been derived from the Treasury every year SRS payments have been authorized (seesee Figure 6).5).71 The amount of funding that comescame from the Treasury has declined, however, in part duedeclined for several years, corresponding to the declining full fundingpayment level but also due to fluctuations in the level offset by receipts.
Critics of SRS are concerned about the continued availability of Treasury funds, given the desire of some Members to reduce government spending or spend money on other priorities. On the other hand, proponents of SRS argue that continuing Treasury funding is fair compensation for the presence of the national forests or O&C lands in their jurisdictions.
Figure (FY2009-FY2015) |
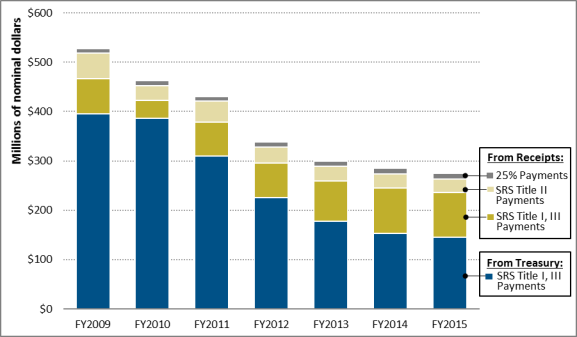 |
|
Authorized and Required Uses of the Payments
Under the revenue-sharingbased programs, the O&C payments are available for any local governmental purpose; the CBWR payments are available for schools, roads, highways, and bridges; and the FS payments are to be used for the benefit of roads and schools. Compared to the revenue-sharing based programs, SRS modified how the counties could use the payments by requiring (for counties with at least $100,000 in annual payments) that 15%-20% of the payments be used for other specified purposes: certain local governmental costs (Title III) or federal land projects (Title II). Although Congress has enacted modifications to the required allocations, counties have not had the opportunity to change their SRS payment allocations since FY2013.
Some have supported the use of the Title II funds as "reinvesting"“reinvesting” agency receipts in federal land management, but opponents argue that this reduces funding for local schools and roads or other governmental purposes. Further, some of those funds have been forfeited back to the Treasury due to issues with the RAC membership requirements. These Title II projects were also intended to provide local employment opportunities, and it's is not clear ifwhether that objective has been evaluated.81
achieved.72
The authorized uses for Title III funds have changed several times since SRS was first authorized, potentially causing confusion on what is an appropriate use for those funds. Counties are supposed to certify their Title III expenditures annually, and the agencies are supposed to review the certifications for compliance. A 2012 report from the Government Accountability Office (GAO), however, found inconsistent compliance with those requirements, resulting in issues with agency oversight and county use of SRS Title III funds.82
73
The U.S. Department of Agriculture Office of Inspector General (OIG) also examined and reported issues with the distribution and use of Title II and Title III funds.8374 To address these issues, both GAO and OIG have recommended FS and BLM issue regulations implementing the program, as directed by the original authorization enacted in 2000.8475 Neither FS nor BLM have done so, with FS citing the sporadicimpermanent nature of the program and subsequent reauthorizations as prohibiting its commitment of resources.85
76 Reauthorization and Duration of the Programs
Other policy questions that arise from the SRS payments are related to the reauthorization and duration of the program. SRS was originally enacted as a six6-year program that expired on September 30, 2006, but was extended an additional 1316 years through seven8 separate reauthorizations. As noted earlier, SRS payments are set to expire on September 30, 20202023, with the final payment made in FY2024made in FY2021. The last four reauthorizations have been for one or two years, and counties have not had the opportunity to elect between the SRS or the revenue-sharing payments since FY2013. In contrast, the 25 Percent, O&C, and CBWR payment programs are permanently authorized.
72 Forest Counties Payments Committee Report, 2003. 73 GAO, Payments to Counties: More Clarity Could Help Ensure County Expenditures Are Consistent with Key Parts of the Secure Rural Schools Act, GAO-12-775, July 2012, at https://www.gao.gov/products/GAO-12-775.
74 USDA OIG 2017. 75 16 U.S.C. §7151. 76 USDA OIG 2017, pp. 4-7.
Congressional Research Service
26
Secure Rural Schools and Community Self-Determination Act: Background and Issues
The uncertainty about the continuation of the SRS program, and the annual changes in the authorized funding level, may concern those interested in providing a consistent and predictable payment for local governments. On the other hand, the opportunity to revisit the SRS reauthorization at more frequent intervals may be of interest to those wanting to review federal spending more broadly, among other potential reasons.
Congressional Research Service
27
Secure Rural Schools and Community Self-Determination Act: Background and Issues
Appendix A. SRS Reauthorizations Through FY2017 The following sections briefly describe each SRS reauthorization through FY2018. SRS payments were not authorized for FY2016, though payments were reauthorized in FY2017.
permanently authorized.
The uncertainty about the continuation of the SRS program, and the annual changes in the authorized funding level, may concern those interested in providing a consistent and predictable payment for local governments. On the other hand, the opportunity to revisit the SRS reauthorization at more frequent intervals may be of interest to those wanting to review federal spending more broadly, among other potential reasons.
COVID-19
The potential impact of the COVID-19 pandemic on federal land revenue generation and, subsequently, revenue sharing to states and counties is uncertain.86 It is possible that the revenue generated on FS and BLM land in FY2020 (and future years) will be less than the revenue generated in previous years. Because SRS payments are not based on current revenue, however, the SRS payments would not be affected by any revenue reductions for the years that SRS payments are authorized. The counties that receive FS revenue-sharing payments instead of SRS payments, however, could see a reduced revenue-sharing payment starting with the FY2020 payment (which is to be made in FY2021).
Appendix A.
Historical Proposals to Change the Revenue-Sharing System
Concerns that many raised about the FS and BLM programs have led to various proposals over the years to alter the compensation system. Most have focused on some form of tax equivalency, compensating the states and counties at roughly the same level the tax revenue collected as if the lands were privately owned and managed. Many consider this to be a fair and consistent approach for compensating state and county governments. However, most also note the difficulty in developing a tax equivalency compensation system, because counties and states use a wide variety of mechanisms to tax individuals and corporations—property taxes, sales taxes, income taxes, excise taxes, severance taxes, and more. Thus, developing a single federal compensation system for the tax-exempt status of federal lands may be difficult, if not impossible.
In his 1984 budget request, President Reagan proposed replacing the receipt-sharing programs with a tax equivalency system that would have included a guaranteed minimum payment. The counties argued that the proposal was intended to reduce payments, noting that the budget request projected savings of $40.5 million (12%) under the proposal. The change was not enacted. The FY1986 FS budget request included a proposal to change the payments to 25% of net receipts (after deducting administrative costs). Legislation to effect this change was not offered.
In 1993, President Clinton proposed a 10-year payment program to offset the decline in FS and O&C timber sales, and thus payments, resulting from efforts to protect various resources and values including northern spotted owls in the Pacific Northwest. Congress enacted this program in Section 13982 of the 1993 Omnibus Budget Reconciliation Act (P.L. 103-66). These "owl" payments began in 1994 at 85% of the FY1986-FY1990 average payments, declining by 3 percentage points annually, to 58% in 2003, but with payments after FY1999 at the higher of either this formula or the standard payment.
In his FY1999 budget request, President Clinton announced that he would propose legislation "to stabilize the payments" by extending the owl payments formula to all national forests. The proposal would have directed annual payments from "any funds in the Treasury not otherwise appropriated," at the higher of (1) the FY1997 payment, or (2) 76% of the FY1986-FY1990 average payment. This approach would have increased payments in areas with large payment declines while decreasing payments in other areas, as well as eliminating annual fluctuations in payments and de-linking the payments from receipts. The Administration's proposed legislation was not introduced in Congress. The FY2000 and FY2001 FS budget requests contained similar programs, but no legislative proposals were offered.
The National Association of Counties (NACo) proposed an alternative in 1999.87 The NACo proposal would have provided the counties with the higher of (1) the standard payment, or (2) a replacement payment determined by the three highest consecutive annual payments for each county between FY1986 and FY1995, indexed for inflation. NACo also proposed "a long-term solution ... to allow for the appropriate, sustainable, and environmentally sensitive removal of timber from the National Forests" by establishing local advisory councils. The NACo approach would have maintained or increased the payments and might have reduced the annual fluctuations, and would likely have retained the linkage between receipts and payments in at least some areas.
Appendix B.
SRS Reauthorizations Through FY2015
The following sections briefly describe each SRS reauthorization through FY2015. SRS payments were not authorized for FY2016, though payments were reauthorized in FY2017 (see "FY2017 and FY2018 Payments" section).
FY2007 Reauthorization SRS expired at the end of FY2006, with final payments made in FY2007. Legislation to extend the program was considered in the 110th110th Congress; various bills would have extended the program for one or seven years. An initial version of an emergency supplemental appropriations bill for FY2007 would have extended SRS for one year, but the bill was vetoed by President George W. Bush.8877 Congress then passed and the President signed a new version of the emergency supplemental appropriations act for FY2007, which included a one-year extension of SRS payments.8978 The extension authorized payments of $100 million from receipts and $425 million from discretionary appropriations to "“be made, to the maximum extent practicable, in the same amounts, for the same purposes, and in the same manner as were made to States and counties in 2006 under that Act."90”79 Thus, preliminary FY2007 payments were made at the end of September 2007, with final payments made at the end of December 2007. This is the only time SRS payments have been made using discretionary appropriations.
Four-Year Extension Through FY2011
In October 2008, Congress passed the Emergency Economic Stabilization Act (P.L. 110-343), which extended SRS payments for four years (through FY2011) and made several changes to the program.9180 Changes included providing full funding that declined over four years; altering the basis for calculating payments; providing transition payments for certain states; and modifying the use of SRS funds for Title II and Title III activities.9281 In addition, Section 601(b) modified the original FS 25 Percent Payment program by basing the payment on the average revenue generated over the preceding seven years.
One-Year Extension Through FY2012
SRS was set to expire at the end of FY2011, with final payments made at the end of December 2012 (FY2012). Legislation to extend the program for five years was considered in the 112th 112th Congress but not enacted.9382 However, the Moving Ahead for Progress in the 21st21st Century Act (MAP-21) contained a one-year extension for SRS.9483 MAP-21 authorized an FY2012 SRS
77 110th Congress, H.R. 1591, the U.S. Troop Readiness, Veterans’ Care, Katrina Recovery, and Iraq Accountability Appropriations Act, 2007.
78 P.L. 110-28, H.R. 2206, the U.S. Troop Readiness, Veterans’ Care, Katrina Recovery, and Iraq Accountability Appropriations Act, 2007.
79 P.L. 110-28, Title V, Chapter 4, Section 5401. 80 P.L. 110-343, Section 601(a). 81 The authorized uses for Title III funds include reimbursing the participating county for search, rescue, and emergency services performed on federal land and fire prevention and county planning activities, such as developing community wildfire protection plans or activities under the Firewise Communities program (16 U.S.C. §7142(a)).
82 The County Payments Reauthorization Act of 2011 (S. 1692 and H.R. 3599) would have extended SRS through FY2016 and included provisions to slow the decline of the full funding levels to 95% of the preceding fiscal year. Neither the Senate nor the House version was reported out of committee.
83 P.L. 112-141, §100101.
Congressional Research Service
28
link to page 35 Secure Rural Schools and Community Self-Determination Act: Background and Issues
MAP-21 authorized an FY2012 SRS payment set at 95% of the FY2011 level ($344 million) and included requirements for the counties to select their payment option in a timely manner.
One-Year Extension Through FY2013
SRS was again set to expire at the end of FY2012, with final payments made in February 2013 (FY2013). In the first session of the 113th113th Congress, Congress enacted the Helium Stewardship Act of 2013, which included a one-year extension of SRS through FY2013 at 95% of the FY2012 SRS payment ($329 million).9584 The payments were disbursed in early 2014.
The 113th
The 113th Congress also conducted oversight on the SRS program, particularly regarding the sequestration of the FY2012 SRS payment (see Appendix CB).85
).96
Two-Year Extension Through FY2015
SRS expired after the FY2013 payments were made in early 2014. Although the 113th113th Congress considered options for reauthorizing or modifying SRS for FY2014,9786 the program was not reauthorized prior to adjournment.
In April 2015, Congress passed and the President signed into law the Medicare Access and CHIP Reauthorization Act of 2015 (P.L. 114-10), which included a two-year reauthorization of mandatory spending for SRS payments in Section 524. Payment amounts were to continue at 95% of the funding level for the preceding fiscal year. P.L. 114-10 provided that counties that elected to receive an SRS payment for FY2013 would automatically receive SRS payments for FY2014 and FY2015. The FY2014 payment was to be made within 45 days of enactment and take into account the revenue-sharingbased payment already disbursed to the counties.
After the FY2015 payments were made, the 114th114th Congress considered, but did not enact, several additional options to extend or modify the expired SRS program, so no payments were made for FY2016.
Two-Year Extension Through FY2018 SRS payments were reauthorized for FY2017 and FY2018 in the Stephen Sepp Wildfire Suppression Funding and Forest Management Activities Act, enacted as Division O of the Consolidated Appropriations Act, 2018 (P.L. 115-141, commonly referred to as the FY2018
84 P.L. 113-40. 85 House Natural Resources Committee, press release, November 5, 2013, at http://naturalresources.house.gov/news/documentsingle.aspx?DocumentID=360388http://naturalresources.house.gov/news/documentsingle.aspx?DocumentID=360388.
86 The House passed the Restoring Healthy Forests for Healthy Communities Act (113th Congress, H.R. 1526), which would have directed FS and BLM to distribute a payment to eligible counties in February 2015, essentially an FY2014 SRS payment. The payment amount would have been equal to the FY2010 payment for the counties receiving FS payments. For the O&C counties, the payment amount would have been $27 million less than the FY2010 payment. After that payment had been made, county payments would have returned to a revenue-based system. The bill would have established Forest Resource Revenue Areas within at least half of the National Forest System and created a fiduciary responsibility to generate revenue by removing forest products for the beneficiary counties. The bill also would have changed the calculation for the FS revenue-based payment. It would have changed the payment from 25% of average gross receipts over the past seven years back to the original calculation of 25% of current-year gross receipts. The Senate did not take up the measure.
Congressional Research Service
29
link to page 32 Secure Rural Schools and Community Self-Determination Act: Background and Issues
omnibus).87 The reauthorization was signed into law on March 23, 2018, after the FS and BLM had distributed the FY2017 revenue-based payments to the states and counties.
Because the revenue-based payment had already been distributed for the year, the reauthorization included provisions for a “make-up” FY2017 SRS payment.88 This make-up payment was set at 95% of the FY2015 SRS payment level, since there had been no payment for FY2016 on which to base or calculate the annual decline. The counties received a payment that was the difference between the revenue-based payment they already received and their authorized SRS payment. In effect, the counties received their FY2017 SRS payment in two installments.
The FS SRS payment (Titles I and III) was $223.7 million for FY2017, and the payment was $213.2 million for FY2018. BLM does not officially include the $18.5 million revenue-based payment made prior to the reauthorization of the SRS payment for FY2017 as part of the total SRS payment for that year. Instead, BLM reports the FY2017 SRS total payment to be $14.0 million.89 This is a departure from how the FY2014 SRS payment was reported, which was also reauthorized after the revenue-based payment had been disbursed. For consistency in this report, the revenue-based payment was included in the Title I payment. Thus, the BLM SRS payment was $31.3 million for FY2017 and was $27.6 million for FY2018. Combined, the FS and BLM SRS payment was $255.0 million in FY2017 and $240.8 million in FY2018.
87 The Consolidated Appropriations Act, 2019 (P.L. 116-6), amended the FY2018 omnibus and renamed the title of Division O.
88 Similarly, SRS payments were reauthorized for FY2014 after the revenue-based payment had been distributed, and the reauthorization specified that the SRS payment would be offset by the amounts already received by the counties pursuant to the revenue-based payment. For more information, see Appendix A.
89 $11.9 million Title I, $1.2 million Title II, $0.92 million Title III.
Congressional Research Service
30
Secure Rural Schools and Community Self-Determination Act: Background and Issues
Appendix B. FY2013 Sequestration Issues Section 302 of the Budget Control Act (BCA)90 required the President to sequester, or cancel, budgetary resources for FY2013, if Congress did not enact a specified deficit reduction by January 15, 2012.91 Congress did not enact such deficit reduction by that date, and on March 1, 2013, the Office of Management and Budget (OMB) determined the amount of the total sequestration for FY2013 to be approximately $85 billion.92
Under the BCA, half of the total reduction for FY2013 was allocated to defense spending, and the other half to nondefense spending.93 Within each half, the reductions were further allocated between discretionary appropriations and direct spending.94 Discretionary appropriations are defined in the BCA as budgetary resources provided in annual appropriations acts.95 In contrast, direct spending was defined to include budget authority provided by laws other than appropriations acts.96 The BCA further required OMB to calculate a uniform percentage reduction to be applied to each program, project, or activity within the direct spending category.97 For the direct spending category, OMB determined this percentage to be 5.1% for FY2013.
Section 102(d)(3)(e) of SRS directed that payments for a fiscal year were to be made to the state as soon as practicable after the end of that fiscal year, meaning that the FY2012 payment was made in FY2013.98 Because the authority to make these payments is not provided in an annual appropriations act, such payments are not discretionary spending for purposes of the BCA. These payments were classified as nondefense, direct spending for purposes of sequestration.99 The BCA exempts a number of programs from sequestration; however, the payments under SRS were not identified in the legislation as exempt.100 Consequently, these payments were subject to sequestration as nondefense, direct spending. However, BLM and FS managed the sequestration of the FY2013 payments in different ways.
BLM Sequestration of SRS Funds BLM issues SRS payments only for the O&C lands in Oregon. In February 2013, BLM distributed $36 million to the 18 O&C counties in Oregon for FY2012 SRS payments. However, the Department of the Interior (DOI) had held back 10% of the scheduled payments across all three titles in anticipation of the possibility of sequestration. The reduction to DOI’s SRS program
90 P.L. 112-25, as amended by P.L. 112-240. 91 2 U.S.C. §901A. The sequester was originally supposed to be ordered on January 2, 2013, but was delayed by the American Taxpayer Relief Act of 2012, P.L. 112-240, until March 1, 2013. For more information on sequestration issues, see CRS Report R42972, Sequestration as a Budget Enforcement Process: Frequently Asked Questions, by Megan S. Lynch.
92 This amount was identified based on a formula set forth in Section 302 of the BCA. 93 2 U.S.C. §901A(4). 94 2 U.S.C. §901A(6). 95 2 U.S.C. §900(7). 96 2 U.S.C. §900(8). Budget authority is further defined as “the authority provided by Federal law to incur financial obligations.” 2 U.S.C. §622. 97 Although not relevant here, additional restrictions are placed on the degree by which Medicare payments in the direct spending category may be reduced. 2 U.S.C. §901a(8).
98 16 U.S.C. §7112(e). 99 2 U.S.C. §900(8). 100 2 U.S.C. §905.
Congressional Research Service
31
Secure Rural Schools and Community Self-Determination Act: Background and Issues
required by sequestration was 5.1% of the total payment, or $2.0 million.101 Since the sequestered amount was less than the amount withheld, DOI-BLM owed an additional SRS payment for the difference. In May 2013, BLM distributed the remaining 4.9% of the payment, resulting in a total of $38 million for the SRS payment to the O&C counties for FY2012.102
Forest Service Sequestration of SRS Funds The Forest Service distributed the full FY2012 SRS payments in January and February 2013, without withholding any amount in preparation for the potential sequester order. On March 19, 2013, the Forest Service announced it would seek to recover from the states the 5.1% of the payments that were subject to sequestration.103 In letters sent to each affected governor, the Forest Service outlined two repayment options and asked for the states to respond by April 19, 2013, with how they planned to repay. Invoices for repayment were not included. In addition to repaying the 5.1%, the FS offered the states the option of having the full sequestered amount taken out of Title II funds (for those states with enough Title II money). Three states—Alaska, Washington, and Wyoming—publicly indicated their intention not to repay the SRS funds.104 In an April 16, 2013, hearing before the Senate Committee on Energy and Natural Resources, the FS indicated that invoices for the repayment would be sent in late April 2013.
On August 5, 2013, the Forest Service sent additional letters which included invoices for the repayment to the governors of the 18 states with insufficient Title II money to cover the sequestered amount.105 The invoices outlined three options for the affected states to take within 30 days: pay the debt in full; agree to a payment plan; or petition for administrative review of the debt. The invoices also included a Notice of Indebtedness to the U.S. Forest Service and Intent to Collect by Administrative Offset, which describes the basis of the indebtedness and the Forest Service’s intent to offset future payments—without assessing penalties—from future Forest Service and Department of Agriculture state payments. As of May 21, 2014, two states had remitted an SRS sequester-related payment—New Hampshire paid $27,884.17 and Maine paid $3,648—and no collection efforts have been initiated by the Forest Service or Department of the Treasury in the remaining 16 states.106 On August 20, 2013, the Forest Service sent additional letters to the governors of the 22 states that had sufficient Title II money to cover the sequestered amount.107 The letters informed the governors that the Title II allocations were reduced by the sequestered amount.
101FY2016.
Appendix C.
FY2013 Sequestration Issues
Section 302 of the Budget Control Act (BCA)98 required the President to sequester, or cancel, budgetary resources for FY2013, in the event that Congress did not enact a specified deficit reduction by January 15, 2012.99 Congress did not enact such deficit reduction by that date, and on March 1, 2013, the Office of Management and Budget (OMB) determined the amount of the total sequestration for FY2013 to be approximately $85 billion.100
Under the BCA, half of the total reduction for FY2013 was allocated to defense spending, and the other half to nondefense spending.101 Within each half, the reductions were further allocated between discretionary appropriations and direct spending.102 Discretionary appropriations are defined in the BCA as budgetary resources provided in annual appropriations acts.103 In contrast, direct spending was defined to include budget authority provided by laws other than appropriations acts.104 The BCA further required OMB to calculate a uniform percentage reduction to be applied to each program, project, or activity within the direct spending category.105 For the direct spending category, OMB determined this percentage to be 5.1% for FY2013.
Section 102(d)(3)(e) of SRS directed that payments for a fiscal year were to be made to the state as soon as practicable after the end of that fiscal year, meaning that the FY2012 payment was made in FY2013.106 Because the authority to make these payments is not provided in an annual appropriations act, such payments are not discretionary spending for purposes of the BCA. These payments were classified as nondefense, direct spending for purposes of sequestration.107 The BCA exempts a number of programs from sequestration; however, the payments under SRS were not identified in the legislation as exempt.108 Consequently, these payments were subject to sequestration as nondefense, direct spending. However, BLM and FS managed the sequestration of the FY2013 payments in different ways.
BLM Sequestration of SRS Funds
BLM issues SRS payments only for the O&C lands in Oregon. In February 2013, BLM distributed $36 million to the 18 O&C counties in Oregon for FY2012 SRS payments. However, the Department of the Interior (DOI) had held back 10% of the scheduled payments across all three titles in anticipation of the possibility of sequestration. The reduction to DOI's SRS program required by sequestration was 5.1% of the total payment, or $2.0 million.109 Since the sequestered amount was less than the amount withheld, DOI-BLM owed an additional SRS payment for the difference. In May 2013, BLM distributed the remaining 4.9% of the payment, resulting in a total of $38 million for the SRS payment to the O&C counties for FY2012.110
Forest Service Sequestration of SRS Funds
The Forest Service distributed the full FY2012 SRS payments in January and February 2013, without withholding any amount in preparation for the potential sequester order. On March 19, 2013, the Forest Service announced it would seek to recover from the states the 5.1% of the payments that were subject to sequestration.111 In letters sent to each affected governor, the Forest Service outlined two repayment options and asked for the states to respond by April 19, 2013, with how they planned to repay. Invoices for repayment were not included. In addition to repaying the 5.1%, the FS offered the states the option of having the full sequestered amount taken out of Title II funds (for those states with enough Title II money). Three states—Alaska, Washington, and Wyoming—publicly indicated their intention not to repay the SRS funds.112 In an April 16, 2013, hearing before the Senate Committee on Energy and Natural Resources, the FS indicated that invoices for the repayment would be sent in late April 2013.
On August 5, 2013, the Forest Service sent additional letters which included invoices for the repayment to the governors of the 18 states with insufficient Title II money to cover the sequestered amount.113 The invoices outlined three options for the affected states to take within 30 days: pay the debt in full; agree to a payment plan; or petition for administrative review of the debt. The invoices also included a Notice of Indebtedness to the U.S. Forest Service and Intent to Collect by Administrative Offset, which describes the basis of the indebtedness and the Forest Service's intent to offset future payments—without assessing penalties—from future Forest Service and Department of Agriculture state payments. As of May 21, 2014, two states had remitted an SRS sequester-related payment—New Hampshire paid $27,884.17 and Maine paid $3,648—and no collection efforts have been initiated by the Forest Service or Department of the Treasury in the remaining 16 states.114 On August 20, 2013, the Forest Service sent additional letters to the governors of the 22 states that had sufficient Title II money to cover the sequestered amount.115 The letters informed the governors that the Title II allocations were reduced by the sequestered amount.
Author Contact Information
Acknowledgments
Ross Gorte, retired CRS Specialist in Natural Resources Policy, contributed to earlier versions of this report.
Footnotes
| 1. |
For more information on federal timber sales, see CRS Report R45688, Timber Harvesting on Federal Lands, by Anne A. Riddle. |
| 2. |
The Secure Rural Schools and Community Self-Determination Act of 2000 (SRS; P.L. 106-393), 16 U.S.C. §§7101-7153. |
| 3. |
Payments in Lieu of Taxes Act of 1976 (P.L. 94-565 as amended, 31 U.S.C. §§6901-6907). For more information, see CRS Report R46260, The Payments in Lieu of Taxes (PILT) Program: An Overview, by R. Eliot Crafton. |
| 4. |
For more information on the pandemic, see the CRS resource page: https://www.crs.gov/resources/coronavirus-disease-2019. |
| 5. |
Compensation programs related to energy and mineral development on national forest system lands are administered by the Department of the Interior (DOI) and are not addressed in this report. |
| 6. |
The Payments to Counties program requires payments of 25% of net receipts generated on the national grasslands to be paid directly to the counties ($35.1 million for FY2018). Special Act Payments include various other revenue-sharing payments authorized for specific purposes or limited to specific places, such as the Payments to Minnesota Counties program, which provides payments to three counties in northern Minnesota based on the appraised value of certain lands within the Superior National Forest ($5.7 million for FY2018). Special act payments also include payments for quartz mined from the Ouachita National Forest in Arkansas and for revenue generated on the Quinault Special Management Area in the Olympic National Forest in Washington (~$51,000 in FY2018 for both). Data from the Forest Service (FS), FY2021 Budget Justification, p. 115. For more information on these programs and FS's mandatory appropriations generally, see CRS Report R45994, Federal Land Management Agencies' Mandatory Appropriations Accounts, coordinated by Carol Hardy Vincent. |
| 7. |
Act of May 23, 1908, 16 U.S.C. §500. |
| 8. |
P.L. 110-343 §601. |
| 9. |
For example, revenue generated through stewardship contracts is not counted toward the revenue-sharing requirement (16 U.S.C. §6591c(e)(3)(A)). For more information on the authorized uses and revenue-generating activities on the national forests, see CRS Report R43872, National Forest System Management: Overview, Appropriations, and Issues for Congress, by Katie Hoover and Anne A. Riddle. |
| 10. |
FS sometimes includes other payment programs within the Payments to States program, which is also the name of the Treasury account from which the payments are made. This includes the Payments to Counties and Payments to Minnesota Counties. SRS is included when authorized. |
| 11. |
For example, funds may be allocated directly to a school district. |
| 12. |
For more information, see CRS Report R42951, The Oregon and California Railroad Lands (O&C Lands): Issues for Congress, by Katie Hoover. Compensation programs related to grazing, land sales, and energy and mineral development are not addressed in this report. |
| 13. |
43 U.S.C. §§2601 et seq. |
| 14. |
Per statute (43 U.S.C. §§2621 et seq.), 75% of the gross receipts from Coos Bay Wagon Road (CBWR) lands are deposited to a special fund and used to make tax-equivalency payments; any portion remaining in the fund after a 10-year period is transferred to the General Fund of the Treasury. |
| 15. |
|
| 16. |
31 U.S.C. §6903(a)(1). |
| 17. |
Forest Counties Payments Committee, Recommendations for Making Payments to States and Counties: Report to Congress (Washington: GPO, 2003). Hereinafter referred to as Forest Counties Payments Committee Report, 2003. The committee was established in Section 320 of the FY2001 Interior and Related Agencies Appropriations Act, P.L. 106-291. |
| 18. |
P.L. 110-343 §601. |
| 19. |
Forest Counties Payments Committee Report, 2003, p. 24. |
| 20. |
|
| 21. |
In nominal dollars, the value of the FY1989 timber sales was $1.31 billion, and the value of the FY1999 timber sales was $342.3 million. For more information on federal timber sales, see CRS Report R45688, Timber Harvesting on Federal Lands, by Anne A. Riddle. |
| 22. |
In nominal dollars, the FY1989 25 Percent Payment was $362.2 million. Data provided by FS Legislative Affairs office, 2005. |
| 23. |
In nominal dollars, the FY1993 25 Percent Payment was $304.7 million. Data provided by FS Legislative Affairs office, 2005. |
| 24. |
Historical data on O&C receipts and payments from BLM Legislative Affairs office, 2011. |
| 25. |
Omnibus Budget Reconciliation Act of 1993, P.L. 103-66 §13982-3. These payments are also sometimes referred to as the "owl payments." The payments were originally authorized through FY2003 but were replaced by the SRS payments starting in FY2001. |
| 26. |
The payment amount began at 85% of the average FY1986-FY1990 payment, and declined by 3 percentage points annually. |
| 27. |
|
| 28. |
16 U.S.C. §7112(b)(3). |
| 29. |
P.L. 106-393 Title I, Secure Payments for States and Counties Containing Federal Land (16 U.S.C. §§7111-7113). |
| 30. |
P.L. 106-393 Title II, Special Projects on Federal Land (16 U.S.C. §§7121-7128). |
| 31. |
P.L. 106-393 Title III, County Funds (16 U.S.C. §§7141-7144). |
| 32. |
16 U.S.C. §7102(11). |
| 33. |
Eligible counties are those that choose to receive payments under this program; counties that choose to continue to receive payments under the original revenue-sharing programs are excluded from these calculations. |
| 34. |
The income adjustment is calculated using the most recent data available from the Department of Commerce Bureau of Economic Analysis. |
| 35. |
16 U.S.C. §§7112(b)(1)-(2). |
| 36. |
Elections were required every two years, and counties received an SRS payment if no election was made. |
| 37. |
A 2012 U.S. Government Accountability Office (GAO) report found inconsistencies among agency (FS and BLM) oversight and county use of SRS Title III funds. For more information, see GAO, Payments to Counties: More Clarity Could Help Ensure County Expenditures Are Consistent with Key Parts of the Secure Rural Schools Act, GAO-12-755, July 16, 2012, at http://www.gao.gov/products/GAO-12-775. For more information, see the "Authorized and Required Uses of the Payments" section. |
| 38. |
16 U.S.C. §7128, §7144. |
| 39. |
P.L. 110-343 §601. |
| 40. |
P.L. 115-161 Division O, §401(a)(3)(C). |
| 41. |
16 U.S.C. §7125(a)(2). |
| 42. |
43 U.S.C. §1739. For more information on BLM's Resource Advisory Councils (RACs), see https://www.blm.gov/get-involved/resource-advisory-council. |
| 43. |
5 U.S.C., App. 2. For more information, see CRS Report R44253, Federal Advisory Committees: An Introduction and Overview, by Meghan M. Stuessy. |
| 44. |
For more information on FS RACs, see https://www.fs.usda.gov/main/pts/specialprojects/racs. |
| 45. |
U.S. Department of Agriculture Office of Inspector General, Forest Service Secure Rural Schools Program, Audit Report 08601-006-41, August 2017, https://www.usda.gov/oig/webdocs/08601-0006-41.pdf. Hereinafter referred to as "USDA OIG 2017." |
| 46. |
P.L. 115-334 Title VIII, §8702. |
| 47. |
P.L. 115-334 Title VIII, §8702. |
| 48. |
Where figures are provided in this section for only Title I and Title III of the SRS payment, the SRS total payment will be provided in a footnote. Unless otherwise specified, FS data are from various reports available from https://www.fs.usda.gov/main/pts/securepayments/projectedpayments and BLM data from annual Official Payments Made to Counties reports, available from http://www.blm.gov/or/rac/ctypaypayments.php. |
| 49. |
This figure includes the FS revenue-sharing payments as well as the safety-net payments, which were made only to certain counties in California, Oregon, and Washington. |
| 50. |
This figure reflects an FS SRS Title I and III payment of $346.2 million plus $15.6 million FS revenue-sharing payment. Including the SRS Title II payment ($24.9 million, retained by the agency), the FS SRS total payment in FY2001 was $371.1 million and the FS total payment was $386.7 million. Revenue-sharing data provided by FS Legislative Affairs office, 2005. FS SRS data from annual Forest Service report, All Service Receipts: Title I, II, and III Region Summary (ASR-18-3), available from http://www.fs.usda.gov/main/pts/home. |
| 51. |
Including SRS Title II, the average SRS total payment for FS over the first six years the program was authorized (FY2001 through FY2007) was $392.8 million annually. The FS payments for the six years prior to the authorization of SRS (FY1995-FY2000) include the revenue-sharing payments plus the safety-net payments. |
| 52. |
Over the life of the program (FY2001-FY2015, FY2017-FY2018), the average SRS total payment for FS was $358.2 million annually and for BLM was $78.5 million annually ($436.7 million combined). |
| 53. |
Data provided by the Forest Service Legislative Affairs Office, February 21, 2013. |
| 54. |
This figure reflects an SRS Title I and III payment of $346.2 million plus $15.6 million revenue-sharing payment. Including the SRS Title II payment ($24.9 million, retained by the agency), the FS SRS total payment in FY2001 was $371.1 million and the FS total payment was $386.7 million. |
| 55. |
Historical data on O&C receipts and payments from BLM Legislative Affairs office, 2011. |
| 56. |
The SRS total payment for BLM in FY2001 was $109.7 million, which included $7.7 million in Title II funds that were retained by the agency. |
| 57. |
The FS and BLM SRS total payment was $480.8 million combined for FY2001, and was $525.0 million for FY2007. |
| 58. |
The FS and BLM total SRS payment was $623.3 million combined for FY2008. |
| 59. |
The revenue-sharing payment initially disbursed by BLM was $19.1 million, because BLM withheld 6.9% of the payment pursuant the sequestration order for FY2016 nonexempt, nondefense mandatory spending. BLM later reversed this decision, and issued a payment of $1.4 million in FY2018 to account for the difference. Although the payment was not made until FY2018, the $1.4 million is included in the FY2016 payment for consistency purposes in this report. |
| 60. |
|
| 61. |
The Consolidated Appropriations Act, 2019 (P.L. 116-6) amended the FY2018 omnibus and renamed the title of Division O. |
| 62. |
|
| 63. |
The FS SRS total payment was $249.3 million for FY2017 and was $237.5 million for FY2018, which reflect Title II payments of $25.5 million and $24.4 million, respectively. |
| 64. |
$11.9 million Title I, $1.2 million Title II, $0.92 million Title III. |
| 65. |
The BLM SRS total payment was $32.5 million for FY2017 and was $30.1 million for FY2018, which reflect Title II payments of $1.2 million and $2.5 million, respectively. |
| 66. |
The SRS total payment (FS and BLM combined) was $281.7 million for FY2017 and was $267.6 million for FY2018, which reflect Title II payments of $26.7 million and $26.9 million, respectively. |
| 67. |
16 U.S.C. §7128, §7144. |
| 68. |
The FY2019 SRS Title II payment for FS and BLM combined was $25.6 million. |
| 69. |
The total FS payment made to counties for FY2019 was $221.4 million (including a revenue-sharing payment of $18.8 million and SRS Title I and Title III). |
| 70. |
The FY2019 BLM SRS Title II payment was $2.4 million. |
| 71. |
P.L. 112-25. For more information, see CRS Report R42972, Sequestration as a Budget Enforcement Process: Frequently Asked Questions, by Megan S. Lynch or CRS Report R45941, The Annual Sequester of Mandatory Spending through FY2029, by Charles S. Konigsberg. |
| 72. |
|
| 73. |
|
| 74. |
For an overview of federal budget procedures, see CRS Report 98-721, Introduction to the Federal Budget Process, coordinated by James V. Saturno, or CRS Report R45789, Long-Term Budgeting within the Congressional Budget Process: In Brief, by Megan S. Lynch. |
| 75. |
Mark Haggerty, "Rethinking the Fiscal Relationship Between Public Lands and Public Land Counties: County Payments 4.0," Humboldt Journal of Social Relations, vol. 1, no. 40 (2018), pp. 116-136. |
| 76. |
For more discussion, see CRS Report R42439, Compensating State and Local Governments for the Tax-Exempt Status of Federal Lands: What Is Fair and Consistent?, by Katie Hoover. |
| 77. |
This includes the FY2018 SRS payment and the FY2019 PILT payment. |
| 78. |
For more information on the federal estate, see CRS Report R42346, Federal Land Ownership: Overview and Data, by Carol Hardy Vincent, Lucas F. Bermejo, and Laura A. Hanson. |
| 79. |
16 U.S.C. §7112(b)(3). |
| 80. |
P.L. 110-28 §5401. |
| 81. |
Forest Counties Payments Committee Report, 2003. |
| 82. |
GAO, Payments to Counties: More Clarity Could Help Ensure County Expenditures are Consistent, GAO-12-775, July 2012, at https://www.gao.gov/products/GAO-12-775. |
| 83. |
U.S. Department of Agriculture (USDA) Office of Inspector General (OIG), Forest Service Secure Rural Schools Program, Audit Report 08601-006-41, August 2017, at https://www.usda.gov/oig/webdocs/08601-0006-41.pdf. Hereinafter referred to as "USDA OIG 2017." |
| 84. |
16 U.S.C. §7151. |
| 85. |
USDA OIG 2017, pp. 4-7. |
| 86. |
For more information on the pandemic, see the CRS resource page: https://www.crs.gov/resources/coronavirus-disease-2019. |
| 87. |
National Association of Counties, NACo Resolution in Support of a Forest Counties "Safety Net," Washington, DC, April 21, 1999. |
| 88. |
110th Congress, H.R. 1591, the U.S. Troop Readiness, Veterans' Care, Katrina Recovery, and Iraq Accountability Appropriations Act, 2007. |
| 89. |
P.L. 110-28, H.R. 2206, the U.S. Troop Readiness, Veterans' Care, Katrina Recovery, and Iraq Accountability Appropriations Act, 2007. |
| 90. |
P.L. 110-28 Title V, Chapter 4, Section 5401. |
| 91. |
P.L. 110-343, Section 601(a). |
| 92. |
The authorized uses for Title III funds include reimbursing the participating county for search, rescue, and emergency services performed on federal land and fire prevention and county planning activities, such as developing community wildfire protection plans or activities under the Firewise Communities program (16 U.S.C. §7142(a)). |
| 93. |
|
| 94. |
P.L. 112-141, §100101. |
| 95. | |
| 96. |
House Natural Resources Committee, press release, November 5, 2013, at http://naturalresources.house.gov/news/documentsingle.aspx?DocumentID=360388http://naturalresources.house.gov/news/documentsingle.aspx?DocumentID=360388. |
| 97. |
The House passed the Restoring Healthy Forests for Healthy Communities Act (113th Congress, H.R. 1526), which would have directed FS and BLM to distribute a payment to eligible counties in February 2015, essentially an FY2014 SRS payment. The payment amount would have been equal to the FY2010 payment for the counties receiving FS payments. For the O&C counties, the payment amount would have been $27 million less than the FY2010 payment. After that payment had been made, county payments would have returned to a revenue-sharing system. The bill would have established Forest Resource Revenue Areas within at least half of the National Forest System and created a fiduciary responsibility to generate revenue by removing forest products for the beneficiary counties. The bill also would have changed the calculation for the FS revenue-sharing payment. It would have changed the payment from 25% of average gross receipts over the past seven years back to the original calculation of 25% of current-year gross receipts. The Senate did not take up the measure. |
| 98. |
P.L. 112-25, as amended by P.L. 112-240. |
| 99. |
2 U.S.C. §901A. The sequester was originally supposed to be ordered on January 2, 2013, but was delayed by the American Taxpayer Relief Act of 2012, P.L. 112-240, until March 1, 2013. For more information on sequestration issues, see CRS Report R42972, Sequestration as a Budget Enforcement Process: Frequently Asked Questions, by Megan S. Lynch. |
| 100. |
This amount was identified based on a formula set forth in Section 302 of the BCA. |
| 101. |
2 U.S.C. §901A(4). |
| 102. |
2 U.S.C. §901A(6). |
| 103. |
2 U.S.C. §900(7). |
| 104. |
2 U.S.C. §900(8). Budget authority is further defined as "the authority provided by Federal law to incur financial obligations." 2 U.S.C. §622. |
| 105. |
Although not relevant here, additional restrictions are placed on the degree by which Medicare payments in the direct spending category may be reduced. 2 U.S.C. §901a(8). |
| 106. |
16 U.S.C. §7112(e). |
| 107. |
2 U.S.C. §900(8). |
| 108. |
2 U.S.C. §905. |
| 109. | Testimony of DOI Deputy Assistant Secretary Pamela K. Haze, in U.S. Congress, Senate Committee on Energy and Natural Resources, Keeping the Commitment to Rural Communities, hearing, |
| 110. | 102 Personal communication with BLM Legislative Affairs office, June 19, 2013. |
| 111. | 103 Testimony of Forest Service Chief Thomas Tidwell, in U.S. Congress, Senate Committee on Energy and Natural Resources, Keeping the Commitment to Rural Communities, hearing, |
| 112. |
104 Phil Taylor, |
| 113. | 105 The following states did not have sufficient Title II funds to cover the sequester and received invoices: AL, AR, GA, IL, IN, ME, MN, MO, NC, ND, NE, NH, NY, OH, PA, PR, TN, VT, and VA. WA received a letter and invoice to collect money from a special act payment, but the letter also indicated the total SRS Title II reduction. |
| 114. |
106 WA paid $317.15 to reimburse for the sequester-related overpayment of a special act payment. Personal communication with Katherine Armstrong, Legislative Affairs Specialist, Forest Service, November 13, 2013. |
| 115. |
107 The following states had the sequester withheld entirely from their Title II funds: AK, AZ, CA, CO, FL, ID, KY, LA, MI, MS, MT, NM, NV, OK, OR, SC, SD, TX, UT, WI, WV, and WY. |