The SALT Cap: Overview and Analysis
Changes from March 6, 2020 to April 3, 2025
This page shows textual changes in the document between the two versions indicated in the dates above. Textual matter removed in the later version is indicated with red strikethrough and textual matter added in the later version is indicated with blue.
The SALT Cap: Overview and Analysis
Contents
- Introduction
-
Contents
- Introduction
SALT Cap Mechanics and Revenue Effects EffectsEffect on State and Local Governments-
- Relevant State and Local Actions Since 2018
Distributional Effects -
Distribution Across States and
Congressional Districts - Localities
- Distribution Across Income Levels
- Interaction of Income and State and Local Jurisdictions
Tables
- Table 1. Projected Revenue Losses from the SALT Deduction
- Table 2. SALT Deduction Activity by State, Tax Year 2022
- Table 3. SALT Deduction Activity by Adjusted Gross Income (AGI), Tax Year 2022
- Table 4. Estimated Income Distribution of SALT Deduction Benefit, 2017 and 2024
- Table 5. Illustrative Example: State and Local Tax Rates and SALT Cap Effects
- Table 6. SALT Deduction Activity Among Filers with $50,000-$99,999 in Adjusted Gross Income, Tax Year 2022, Selected States
- Table A-1. SALT Deduction and Cap Activity by Congressional District, Tax Year 2022
Summary
Taxpayers who itemize their deductions may reduce their federal income tax liabilities by claiming a deduction for certain state and local taxes (SALT)Distribution Across Income Levels - State Responses to the SALT Cap
- Legislation in the 116th Congress
Figures
- Figure 1. Effective State and Local Tax Rates, 2017
- Figure 2. Average SALT Deduction Amount by Congressional District, 2017
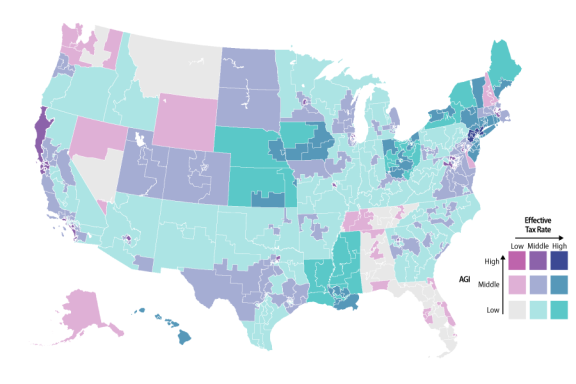
- Figure 3. Average Effective SALT Rate and Adjusted Gross Income (AGI) by Congressional District, 2017
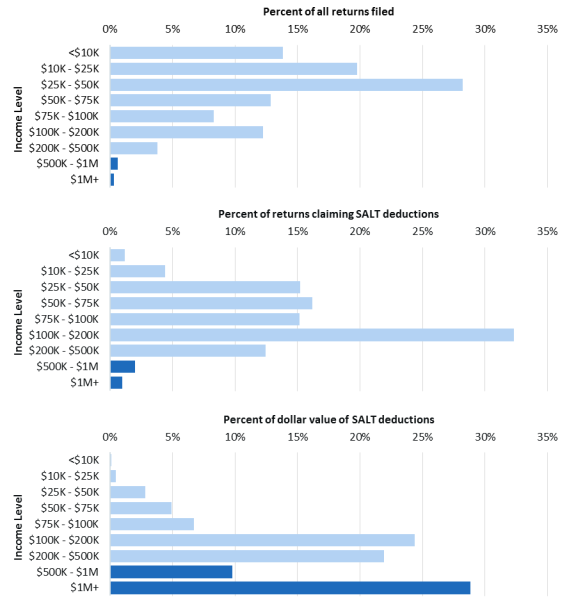
- Figure 4. Percentage of Returns Claiming the SALT Deduction and SALT Deduction Amounts by Income, 2017
Summary
Taxpayers who elect to itemize their deductions may reduce their federal income tax liability by claiming a deduction for certain state and local taxes paid, often called the "SALT deduction." The 2017 tax revision (paid, often called the "SALT deduction." The 2017 tax revision (P.L. 115-97, commonly referred to as the Tax Cuts and Jobs Act, TCJA; P.L. 115-97 or TCJA) made a number of changes to the SALT deduction. Most notably, the TCJA established a limit, or "SALT cap," on the amounts claimed as SALT deductions for tax years 2018 through 2025. The SALT cap is $105,000 for singlemarried taxpayers and married couples filing jointly and $5,000 for married taxpayers filing separately.
filing separately and $10,000 for all other filers.
The changes enacted in the TCJA willhave considerably affectaffected SALT deduction activity in the next several years. The increased value of the standard deduction (roughly doubling from its pre-TCJA value for tax years 2018 through 2025), along with the reduced availability ofincreased limitations on SALT and other itemized deductions, are projected tohave significantly reducereduced the number of SALT deduction claims made in those years. The percentage of tax returns with any SALT claim decreased from 31% in tax year 2017 (the last year before the SALT cap became effective) to 9% of all returns in tax year 2022. The Joint Committee on Taxation (JCT) projected that repealing that SALT cap for tax year 2019 would increase federal revenues by $77.4 billion.
The SALT deduction reduces the cost of state and local government taxes to taxpayers because a portion of the taxes deducted is effectively paid for byprojects that following the SALT cap's scheduled expiration, federal revenue losses attributable to SALT will increase from $23 billion in FY2025 to $197 billion in FY2027.
The SALT deduction shifts some of the burden of state and local taxes from taxpayers to the federal government. By reducing the deduction's value, the SALT cap therefore increases the cost to the taxpayer of state and local taxes to taxpayers. That may affect state and local tax and spending behavior, as any reductionreductions in state and local revenues from increased sensitivity to SALT-eligible tax rates must be offset by reductions in outlays or increases in other revenuerevenues to maintain budget outcomes.
Following enactment of the TCJA, several states proposed or passed legislation that provided possible avenues to reduce the SALT cap's effect on taxpayers without reducing their state or local tax burdens. A 2020 Internal Revenue Service (IRS) regulation clarified that pass-through businesses may claim SALT deductions in states where the tax burden is shifted from individual owners to the business as an entity, essentially excluding that income from the SALT cap in states using this "pass-through workaround." Prior IRS guidance had eliminated state and local use of charitable donations tax rules that could otherwise shield residents from the SALT cap.The SALT cap's effectThe estimated reduction in federal revenues from the SALT deduction declined from 7.7% of all state and local government tax collections from SALT-eligible taxes in 2017 to 1.3% in 2022.
basebases for those taxes are another source of disparity in SALT cap exposure. Internal Revenue Service (IRS) data showed that in 2017, the average SALT deduction claimed in New York ($23,804) was more than four times the average in Alaska ($5,451).
The SALT cap predominantly affects taxpayers with higher incomesIRS data from 2022 showed that the nationwide difference between eligible SALT taxes (before the cap was applied) was about $16,600 higher, on average, than the value of the (after-cap) SALT deduction. That average, however, belies considerable variation across geographic areas: the comparable value in the state with the greatest difference (New York, $43,200) was more than 20 times that in the state with the lowest difference (Alaska, $1,900).
The SALT cap predominantly affects high-income taxpayers. State and local tax payments tend to increase with income, both as a direct function of the income tax structure and because higher incomes lead to increased consumption and thus sales and property tax payments. Increased income, therefore, makes higher-income taxpayers more likely to make SALT-eligible tax payments in amounts exceeding the SALT cap value. The benefit of SALT deductions in terms of tax savings is also larger for taxpayers with higher incomes because a federal tax deduction's value is proportional to the taxpayer's marginal income tax rate. JCT projected that more than half of 2019 benefits for the SALT deduction will accrue to estimates that taxpayers with incomes exceedingof $200,000 or more will represent 12% of all tax units and receive 65% of the SALT deduction's tax benefits in 2024, while individuals and couples with incomes under $50,000 represent 53% of all tax units and claim less than 1% of SALT benefits. Areas that are most affected by the SALT cap generally also tend to have larger SALT cap effects on middle-income taxpayers.
Introduction
Taxpayers who itemize their deductions may reduce their federal income tax liabilities by claiming a deduction for certain state and local taxes (SALT) $200,000.
Several pieces of legislation introduced in the 116th Congress would modify the SALT cap, including legislation that would (1) repeal the SALT cap entirely; (2) increase the SALT cap's value for all taxpayers; (3) increase the SALT cap's value for some taxpayers; (4) make the SALT cap permanent; and (5) repeal IRS regulations affecting SALT cap liability.
Following enactment of the TCJA, several states proposed or passed legislation that provided possible avenues to reduce the SALT cap's effect on taxpayers without reducing their relevant state or local tax burdens. Subsequent guidance by the IRS, however, makes it unclear or unlikely that those laws will prevent taxpayers from experiencing the SALT cap's effects.
Introduction
Taxpayers who elect to itemize their deductions may reduce their federal income tax liability by claiming a deduction for certain state and local taxes paid, often called the "SALT deduction." The 2017 tax revision (paid, often called the "SALT deduction." The 2017 tax revision (P.L. 115-97, commonly referred to as the Tax Cuts and Jobs Act, TCJA; P.L. 115-97 or TCJA) established a temporary $10,000 limit, or "SALT cap," on annual SALT deduction claims. By limiting the amount of of $5,000 for married taxpayers filing separately and $10,000 for all other filers. By limiting the SALT deduction, the SALT cap increases the tax liabilityliabilities of certain taxpayers, which increases federal tax revenues relative to what otherwise would have been collected without a limitation in place.
The SALT cap's effect on tax liability varies significantly with taxpayer income and with state and local tax rates. A number of bills introduced in the 116th Congress would modify the SALT cap, and federal regulatory efforts responding to related state and local government activity are ongoingWith the SALT cap and other temporary TCJA provisions scheduled to expire at the end of 2025, there has been substantial discussion regarding the merits of keeping or modifying the cap. This report discusses the SALT cap's features,mechanics; analyzes its potential impact, for different taxpayers, states, and localities; and summarizes recent legislationlegislative and regulatory action to modify the cap.
Cap Mechanics and Revenue Effects
developments pertinent to the SALT cap.
A snapshot of SALT deduction and SALT cap activity across congressional districts in tax year 2022 can be found in Table A-1 of the Appendix.
SALT Cap Mechanics and Revenue Effects
Under current law, taxpayers itemizing deductions (in lieu of claiming the standard deduction) may reduce their taxable incomeincomes by claiming the SALT deduction for certain state and local taxes paid during the tax year. The state and local taxes eligible for the SALT deduction are income taxes, general sales taxes (claimed in lieu of income taxes), personal property taxes, and certain real property taxes not paid in the carrying on of a trade or business.1
For taxpayers who would have itemized their deductions without access to the SALT deduction, it generates tax savings equal to the amount deducted multiplied by the taxpayer's marginal income tax rate. For example, a taxpayer with $206,000 of eligible state and local taxes and a top marginal tax rate of 3537% would save $7,0002,220 from the SALT deduction (i.e., $206,000*0.3537). For taxpayers who would have claimed the standard deduction without access to the SALT deduction, it generates tax savings equal to the difference between their tax liability if they had claimed the standard deduction and their total tax liability with itemized deductions (inclusive ofincluding the SALT deduction).2
the SALT deduction). (Throughout this report, the tax savings attributable to the SALT deduction is also referred to as the benefit from the deduction.)
The TCJA established a temporary SALT cap for tax years 2018 through 2025. The SALT cap is set atto $10,000 for singleall taxpayers orexcept married couples filing jointly and $5,000 for married taxpayers filing separatelytaxpayers filing separately, for which it is $5,000. By limiting the SALT deduction available to certain taxpayers, the SALT cap decreases the tax savings associated with the deduction relative to prior law, thereby increasing federal revenues.
The TCJA also changed a number of tax code features (e.g., standard deduction amounts, marginal tax rates)2 that indirectly affect SALT deduction eligibility and the value of the tax savings it generates. The TCJA roughly doubled the standard deduction and limited other itemized deductions.3 The TCJA also prohibited SALT deduction claims on taxes paid on foreign real property for tax years 2018 through 2025.4
3
The SALT cap, the increased value of the standard deduction, and other tax changes enacted by the TCJA have both (1) reduced the number of taxpayers claiming the SALT deduction; and (2) reduced the total tax benefit provided to taxpayers who claim a SALT deduction and the total tax savings from those claims. Table 1 shows the most recent estimates of reductions in federal revenues attributable to the SALT deduction for FY2017, the last full year before enactment of P.L. 115-97, and FY2019 through FY2023.5 Revenue losses from the SALT deduction in FY2017 ($100.9 billion) nearly equaled the total losses projected from FY2019 through FY2023 ($117.2 billion). The Joint Committee on Taxation (JCT) projects that 16.4 million taxpayers will claim a SALT deduction for tax year 2019,6 compared to 46.6 million taxpayers who the Internal Revenue Service (IRS) reported claiming the deduction in 2017.7
|
FY2017 |
FY2019 |
FY2020 |
FY2021 |
FY2022 |
FY2023 |
|
100.9 |
21.2 |
22.5 |
23.6 |
24.6 |
25.3 |
Source: Joint Committee on Taxation, Estimates of Federal Tax Expenditures For Fiscal Years 2017-2021, May 2018, JCX-34-18; and Joint Committee on Taxation, Estimates of Federal Tax Expenditures For Fiscal Years 2019-2023, December 2019, JCX-55-19.
Notes: FY2017 projections were estimated in May 2018, and FY2019-FY2023 projections were estimated in December 2019. Figures are not adjusted for inflation.
Recent research has estimated the SALT cap's effect on SALT deduction claims independent of other tax changes enacted through the TCJA. A 2019 Treasury Inspector General report examined the SALT cap's hypothetical effect had it been imposed in tax year 2017, prior to the other TCJA changes taking effect.8 The report found that the cap would have reduced SALT deduction benefits for 10.9 million taxpayers (about 25% of all households claiming the deduction) and reduced deduction amounts by $323 billion, or just over half of the actual amounts deducted in that year.9 In June 2019, JCT estimated that holding all other portions of the tax code constant, repealing the SALT cap for tax year 2018 would decrease FY2019 federal revenues by $77.4 billion.10
Effects on State and Local Governments
The SALT deduction provides state and local governments with an increased ability to levy taxes by reducing the after-tax cost of state and local taxes to taxpayers. By limiting the deduction's benefits, the SALT cap increases the cost (or "price") of state and local taxes for affected taxpayers. For example, consider a taxpayer with itemized deductions, a 35% marginal tax rate, and $20,000 in eligible SALT payments. Without a SALT cap in place, the net price of those taxes for the taxpayer would be $13,000 (or $20,000*[1-0.35]), as the taxpayer can use all $20,000 of those tax payments to reduce federal tax liability. When a $10,000 SALT cap is imposed, the final price of those taxes rises to $16,500 (or $10,000 + [$10,000*(1-0.35)]).
The basic economic law of demand—there is an inverse relationship between the price of a good and the quantity demanded—suggests that by increasing the price of state and local taxes, a SALT cap would lead to a decline in demand for state and local government activity. The size of the decrease would be a function of the sensitivity of public desire for state and local services, paid for by taxes, to changes in the price of those services (i.e., the elasticity of demand). Research has found indications that state and local governments respond to federal tax changes with shifts in their own tax and spending practices.11
Response to the SALT cap could be a function of its salience, that is, the public awareness of its effect on tax liability.12 SALT cap salience may depend on awareness of the state and local taxes themselves, which can vary significantly across tax system features.13 Salience for taxpayers who take the standard deduction, but who would be better off itemizing deductions if not for the SALT cap, may be particularly low, as the SALT cap's effects may not be apparent in tax filing software. Taxpayers could also have difficulty differentiating SALT cap-related liability changes from other changes enacted through the TCJA.
(in billions of dollars) FY2024 FY2025 FY2026 FY2027 FY2028 21.7 22.6 144.7 197.1 208.5 The SALT deduction provides state and local governments with an increased ability to levy taxes by "discounting" (reducing the after-federal-tax cost of) state and local taxes to taxpayers. By limiting the deduction's benefits, the SALT cap increases the cost (or "price") of state and local taxes for affected taxpayers. For example, consider a taxpayer with itemized deductions, a 35% marginal tax rate, and $20,000 in eligible SALT payments. Without the SALT cap, the net price of those taxes for the taxpayer would be $13,000 (or $20,000*[1-0.35]), as the taxpayer can use the SALT deduction to reduce their federal taxes by $7,000. When a $10,000 SALT cap is imposed, the final price of those taxes rises to $16,500 (or $10,000 + [$10,000*(1-0.35)]). State and local governments raised a combined $1.8 trillion in individual income taxes, general sales taxes, and property taxes in 2022, an average of about $11,600 per federal income taxpayer.7 State governments collected $1.0 trillion (56%) of that total, including the majority of the income and sales taxes. Local governments collected the remaining $0.8 trillion (44 %), including the majority of property taxes.8 There is considerable geographic variation in the rates at which taxes are levied, and in the incomes and prices to which those taxes apply. Aggregate data suggest that the SALT cap and other TCJA changes had a considerable effect on the nationwide discount that the SALT deduction provides to state and local taxes. The JCT estimated that in FY2017, the last year before the SALT cap and TCJA took effect, the SALT deduction reduced federal revenues by $101 billion, or 7.7% of all state and local government tax collections from general sales, individual income, and property taxes in the 2017 tax year.9 In 2022, the $23 billion reduction in federal revenues attributable to the SALT deduction represented 1.3% of the comparable total from those tax sources.10 The basic economic law of demand—there is an inverse relationship between the price of a good and the quantity demanded—suggests that by increasing the price of state and local taxes, the SALT cap causes a decline in demand for state and local government activity. The size of the decline is a function of the sensitivity of public desire for state and local services, paid for by taxes, to changes in the prices of those services (i.e., the elasticity of demand). Research has found that state and local governments respond to federal tax changes with shifts in their own tax and spending practices.11 State and local governments are generally limited in their ability to respond to shifts in demand for government services withfrom FY2024 through FY2028.4 (Because fiscal years run from October 1 of the previous calendar year to September 30 of the given year, FY2027 is the first full fiscal year after the SALT cap and other temporary TCJA provisions are scheduled to expire.)5 Revenue losses from the SALT deduction in FY2027 are projected to be $197 billion, more than eight times the projected revenue loss in FY2025 ($23 billion), the last full fiscal year for which the SALT cap is in effect. Internal Revenue Service (IRS) data show that only 9% of all taxpayers claimed a SALT deduction in tax year 2022, less than one-third the share from 2017 (31%), the final year before the SALT cap took effect.6
Table 1. Projected Revenue Losses from the SALT Deduction
Source: U.S. Congress, Joint Committee on Taxation, Estimates of Federal Tax Expenditures for Fiscal Years 2024-2028, Joint committee print, JCX-48-24, 118th Congress (GPO, 2024).
Effect on State and Local Governments
year or two-year period.14 Governments with a binding balanced-budget requirement would therefore need to match any reduction in SALT revenue resulting from the cap with a reduction in spending on services provided or increases in other revenue sources.
Distributional Effects
This section explores features of localities and households that are likely to influence the distribution and intensity of SALT cap effects on tax liability.15 The recent enactment and implementation of the SALT cap means that tax return data on its impact by state, locality, and income level are currently unavailable. However, analyzing the SALT deduction's distribution prior to the cap's imposition can provide insight into its likely impact. The data indicate that the SALT cap's effects will vary significantly across state and local jurisdictions and household income.
Distribution Across States and Congressional Districts
The SALT cap's effect is in part a function of state and local tax policies. For example, greater effective rates levied on taxes that qualify for the deduction (income taxes, general sales taxes, real and personal property taxes) would increase the amount of SALT-eligible tax payments and therefore increase the probability that a taxpayer will have SALT deductions that exceed the cap. State and local tax rates could thus affect both the number of taxpayers with higher tax liability from the SALT cap (sometimes referred to as SALT cap exposure) and the amount of those increases (sometimes referred to as the SALT cap burden).
revenues with reductions in spending or increases in other revenue sources.
Relevant State and Local Actions Since 2018
State and local responses to the SALT cap have varied across units of government. Some governments changed their tax codes to reduce the SALT cap's effects on their taxpayers, while others have taken legal action against the federal government. Federal and legal responses to those actions upheld the legality of the SALT cap and prohibited use of the "charitable workaround" that was designed to reduce SALT cap exposure, but allowed the "pass-through workaround" as a means of reducing the effects of the SALT cap. The "charitable workaround" describes laws enacted in certain states that provided taxpayers a credit against state taxes for charitable donations to state entities, which would then be eligible for the federal charitable deduction under Section 170 of the Internal Revenue Code. The IRS has since issued a final ruling limiting the availability of Section 170 charitable deductions in such a way that would render the new charitable activity ineligible.15 Several states also took legal action related to the SALT cap following TCJA enactment, filing suit against the U.S. government in July 2018 and challenging the cap's constitutionality.16 A September 2019 federal district court ruling upheld the SALT cap's constitutionality, asserting that it did not unconstitutionally penalize certain jurisdictions.17 Other state actions to provide a so-called "pass-through workaround" more effectively reduced SALT cap exposure. The SALT cap does not limit SALT deductions associated with the carrying on of a trade or business, so taxpayers whose SALT tax payments are based on pass-through business income (including income from S corporations and partnerships) may not be subject to the SALT cap in the same manner as other taxpayers.18 Certain state governments have adjusted for this activity by enacting laws that levy or raise taxes on the pass-through business entity itself that are offset (holding total tax revenues constant) by tax reductions for the individual income liabilities of pass-through business owners subject to the business entity tax increase. A 2020 IRS notice clarified that pass-through entity businesses may claim SALT deductions in states where the tax burden is shifted from pass-through business owners to business entities, essentially excluding such income from the $10,000 limitation for affected individual owners.19 A 2024 review of state activity indicated that 36 of the 41 states with pass-through entity income taxes had enacted legislation intending to limit the SALT cap exposure of such tax payments.20 This section explores features of localities and households that influence the distribution and intensity of SALT cap effects on tax liability.21 Available data indicate that the SALT cap's effects vary significantly across state and local jurisdictions and household income. The SALT cap's effect is in part a function of state and local tax policies. For example, higher effective rates for taxes that qualify for the deduction (income taxes, general sales taxes, real and personal property taxes) would increase the amount of SALT-eligible tax payments for a taxpayer, and therefore increase the probability that they will have SALT deductions that exceed the cap. State and local tax rates could thus affect both the number of taxpayers with higher tax liability due to the SALT cap and the amount of taxes paid above the cap.setsamounts of goods and services. Although each household faces the same set of purchasing options on the public and private markets, the higher-income household facing higher price levels is more likely to have SALT payments in excess of the SALT cap.
State and local governments raised a combined $1.30 trillion in individual income taxes, general sales taxes, and property taxes in 2017, an average of about $8,500 per federal income taxpayer.16 Those revenues are divided almost evenly between state governments ($667 billion in revenues), which collected the majority of the income and sales taxes, and local governments ($632 billion), which collected the majority of property taxes.17 There is considerable geographic variation in the rates at which taxes are levied and in the incomes and prices to which those taxes apply.
Figure 1 shows effective state and local tax rates for all SALT-eligible taxes in each state, calculated as the percentage of total adjusted gross income paid in-state and local general sales taxes, individual income taxes, and property taxes.18 In 2017, New York (17.2% effective tax rate), Washington, DC (16.9%), Hawaii (16.1%), Maine (15.0%), and Nebraska (14.2%) had the highest combined effective state and local tax rates. Delaware (6.8%), Alaska (7.6%), Florida (7.7%), New Hampshire (8.3%) and Tennessee (8.4%) had the lowest combined tax rates. All else equal, states with higher SALT-eligible effective tax rates are likely to experience greater SALT cap effects on tax liability than states with lower rates.
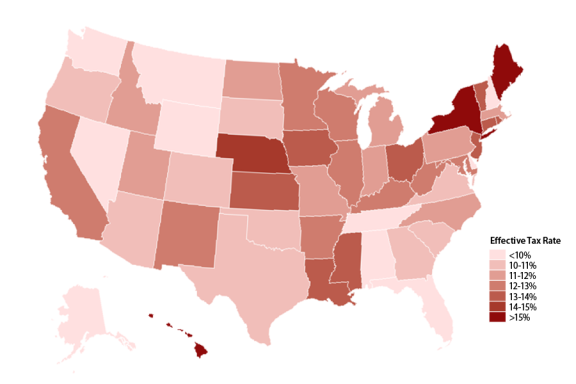
Figure 2 plots the average SALT deduction amount for each 2017 congressional district (districts are from the 115th Congress). The districts with the 20 highest average SALT deductions are located in states with above-average effective tax rates in Figure 1, including New York, California, Connecticut, and New Jersey. Nineteen of the districts with the 20 lowest average SALT deductions are located in Florida, Texas, Tennessee, Alabama, Nevada, Arizona, and Alaska, all states with below-average effective state and local tax rates. Figure 2 shows the potential significance of local tax and economic activity on the SALT cap's effects.
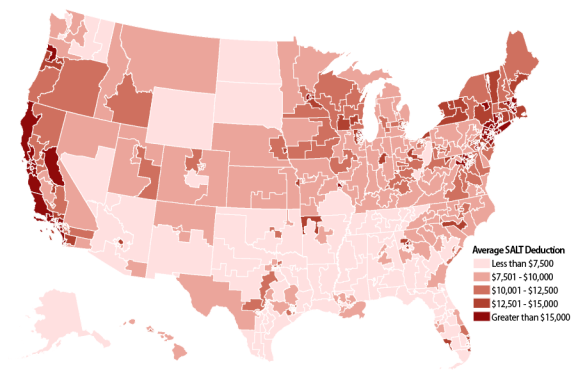
Figure 3 adds a layer of analysis by plotting two variables on each congressional district: (1) average adjusted gross income (AGI) of taxpayers and (2) average effective SALT rates. Each district categorized as having low effective SALT rates in Figure 3 had an average AGI below $75,000, and 13 of these districts had average AGI below $50,000. Nineteen of the 20 districts with the highest effective SALT rates had an average AGI above $100,000, and four of the top five districts had an average AGI above $200,000. The distribution of SALT deductions across household income is discussed further in the next section. Figure 3 demonstrates the importance of considering both tax rates and the tax base when examining potential SALT cap effects.
Distribution Across Income Levels
As with other tax deductions, SALT deduction benefits accrue more for higher-income taxpayers than lower-income taxpayers. Two factors explain this pattern: (1) higher incomes directly lead to more state and local income taxes and are correlated with higher sales and property tax payments stemming from greater consumption; and (2) taxpayers with higher incomes are subject to higher marginal tax rates, so each dollar deducted from tax liability results in greater tax savings.
Table 2 shows the JCT projections of SALT benefits by income class in tax years 2017 (the last year before the TCJA took effect) and 2019. Taxpayers with more than $100,000 of AGI received the vast majority of SALT benefits in both 2017 (93%) and 2019 (89%). Taxpayers with income between $50,000 and $200,000 received a larger share of total benefits in 2019 (44%) than 2017 (29%), whereas the opposite trend occurs for taxpayers with more than $200,000 (declining from 71% to 56%). Taxpayers with less than $50,000 received relatively little benefit from the SALT deduction in both years.
|
Tax Year 2017 |
Tax Year 2019 |
|||
|
Income Class |
SALT Benefit (in billions of $) |
Share of SALT Benefit |
SALT Benefit (in billions of $) |
Share of SALT Benefit |
|
Less than $10,000 |
<0.1 |
0% |
<0.1 |
0% |
|
$10,000-$20,000 |
<0.1 |
0% |
<0.1 |
0% |
|
$20,000-$30,000 |
<0.1 |
0% |
<0.1 |
0% |
|
$30,000-$40,000 |
0.1 |
0% |
<0.1 |
0% |
|
$40,000-$50,000 |
0.2 |
0% |
0.1 |
0% |
|
$50,000-$75,000 |
1.7 |
2% |
0.7 |
3% |
|
$75,000-$100,000 |
2.9 |
4% |
1.5 |
7% |
|
$100,000-$200,000 |
15.5 |
22% |
6.8 |
33% |
|
More than $200,000 |
49.3 |
71% |
11.7 |
56% |
Source: Joint Committee on Taxation, Estimates of Federal Tax Expenditures For Fiscal Years 2016-2020, December 2019, JCX-3-17; and Joint Committee on Taxation, Estimates of Federal Tax Expenditures For Fiscal Years 2019-2023, December 2019, JCX-55-19.
Notes: The tax benefit from the deduction is equal to the tax savings associated with the deduction. 2017 projections were estimated in January 2017, while 2019 projections were estimated in December 2019. Income categories reflect an adjusted gross income (AGI) concept. Table excludes taxpayers with negative income.
Data from Table 2 suggest that the SALT cap increased the federal tax burden of high-income taxpayers. This occurs because the SALT cap (1) reduced the number of taxpayers claiming the SALT deduction, who disproportionately fell in higher income classes; and (2) reduced SALT benefit levels of taxpayers with more than $10,000 in SALT payments, who were particularly likely to have high levels of income.19 JCT estimated that were the SALT cap eliminated in tax year 2019, more than half of the additional tax benefits would have been claimed by taxpayers with incomes exceeding $1 million.20 The SALT cap's total effect on the combined federal, state, and local tax burden across income levels will depend on the state and local government response to the SALT cap, which is uncertain.
Figure 4 plots the percentage of all tax returns, the percentage of returns claiming SALT deductions, and the percentage of SALT deduction amounts claimed across income levels in tax year 2017, the latest year for which data are available. (The amount of SALT deduction claimed reflects the dollars deducted and not the tax savings associated with the deduction.) Tax returns with AGI exceeding $1 million represented less than 1% of all tax returns, but claimed over 25% of all SALT deduction amounts. Tax returns with over $100,000 in AGI claimed more than 78% of the SALT deduction amounts claimed, while returns with AGI below $50,000 claimed less than 10% of that total.
The effect of the SALT cap will also vary based on the degree to which states are dependent on a single revenue source or multiple sources. This is because taxpayers may deduct either their income tax payments or their sales tax payments, but not both. For example, a single individual who pays $8,000 of state income taxes and $8,000 of state sales taxes can deduct $8,000 when paying his or her federal income taxes. By contrast, an individual who pays the same amount of state and local taxes ($16,000) over the course of a year but pays that amount only in the form of income taxes or sales taxes would have $16,000 of SALT-eligible tax payments. The SALT cap will therefore have a more significant effect in states exclusively dependent on income taxes or on sales taxes rather than on both forms of revenue. State Average Income, All Filers % of All Filers with SALT Claim SALT-Eligible Taxes Before Cap, per Claimant SALT Deduction After Cap, per Claimant SALT-Eligible Taxes—Deduction Claimed, per Claimant NY $105,300 10.2% $52,600 $9,400 $43,200 CT $119,900 11.5% $39,900 $9,300 $30,600 CA $107,900 15.4% $36,500 $9,100 $27,400 DC $136,100 20.4% $33,000 $8,700 $24,300 NJ $110,000 13.4% $31,200 $9,200 $22,000 MA $119,500 12.2% $28,400 $8,900 $19,500 VT $81,100 5.8% $27,600 $8,500 $19,200 U.S. Average $93,200 9.5% $25,000 $8,300 $16,600 MN $92,800 9.0% $24,800 $8,400 $16,400 IL $95,700 8.7% $23,800 $8,600 $15,100 AR $74,600 5.8% $22,200 $7,100 $15,100 ME $77,500 5.8% $22,900 $8,400 $14,600 OR $86,800 12.4% $22,600 $8,700 $13,900 KS $83,600 6.7% $21,800 $8,100 $13,700 WY $105,700 5.2% $19,700 $6,000 $13,700 MT $82,700 8.0% $21,300 $7,900 $13,400 IN $76,600 5.2% $20,100 $7,700 $12,400 VA $99,400 13.5% $20,600 $8,500 $12,200 PA $87,700 6.9% $20,100 $8,300 $11,800 OH $77,700 5.2% $19,600 $7,900 $11,800 RI $85,200 8.1% $20,100 $8,500 $11,500 WI $83,000 6.1% $19,600 $8,100 $11,500 NC $84,300 8.0% $18,900 $7,800 $11,200 MD $96,300 20.0% $19,600 $8,600 $11,000 CO $101,200 11.5% $19,000 $8,000 $10,900 HI $81,800 11.8% $18,800 $7,900 $10,800 KY $71,000 5.5% $18,600 $8,000 $10,600 UT $93,900 13.9% $19,000 $8,400 $10,600 MO $78,900 6.2% $18,100 $7,800 $10,200 DE $85,000 9.3% $17,700 $7,700 $10,000 MI $78,600 5.9% $18,000 $8,200 $9,800 FL $101,200 7.6% $17,100 $7,200 $9,800 WV $65,800 3.4% $17,600 $7,800 $9,800 ID $84,600 8.4% $17,300 $7,700 $9,700 GA $83,100 11.4% $17,300 $7,800 $9,500 SC $77,300 7.5% $17,200 $7,700 $9,500 IA $83,300 6.3% $17,100 $7,700 $9,400 ND $92,800 4.6% $15,500 $6,300 $9,100 NV $94,300 8.3% $15,000 $6,400 $8,600 AZ $85,800 8.7% $15,500 $7,000 $8,500 LA $72,400 6.0% $14,300 $6,800 $7,500 NH $105,900 7.5% $15,700 $8,300 $7,300 OK $73,900 6.6% $13,900 $7,100 $6,800 NE $85,800 6.2% $14,200 $8,100 $6,100 NM $66,400 5.9% $13,300 $7,200 $6,100 AL $74,700 7.1% $12,800 $6,800 $6,000 MS $63,200 6.4% $12,100 $6,500 $5,600 TX $92,400 7.6% $13,400 $8,000 $5,500 WA $111,900 11.6% $12,200 $7,900 $4,200 SD $88,400 4.4% $10,500 $6,400 $4,200 TN $83,100 5.6% $9,900 $6,200 $3,700 AK $87,600 5.2% $8,400 $6,500 $1,900 Source: IRS, SOI Income Tax Stats, Historic Table 2. Calculations performed by CRS. Notes: Dollar amounts reflect taxable income, not tax liability. "Average Income" reflects an adjusted gross income (AGI) concept. Calculations exclude taxpayers with negative incomes. 'U.S. Average' entry reflects average across nationwide tax units. Dollar amounts rounded to the nearest hundred. Adjusted Gross Income (AGI) Category % of All Filers with SALT Claim SALT-Eligible Taxes Before Cap, per Claimant SALT Deduction After Cap, per Claimant SALT-Eligible Taxes—Deduction Claimed, per Claimant Less than $50,000 2.2% $6,000 $5,200 $800 $50,000-$199,999 13.0% $10,800 $8,100 $2,700 More than $199,999 38.6% $57,800 $9,900 $47,900 Source: IRS, SOI Income Tax Stats, Historic Table 2. Calculations performed by CRS. Notes: Dollar amounts reflect taxable income, not tax liability. Calculations exclude taxpayers with negative incomes. Dollar amounts rounded to the nearest hundred. Tax Year 2017 Tax Year 2024 Income Class % of All Returns % of Itemized Returns % of SALT Benefit % of All Returns % of Itemized Returns % of SALT Benefit Less than $50,000 52.7% 12.8% 0.6% 39.9% 5.1% 0.6% $50,000-$199,999 41.6% 68.0% 28.9% 48.6% 51.4% 34.3% More than $199,999 5.7% 19.2% 70.6% 11.5% 43.5% 65.1% Source: Joint Committee on Taxation, Estimates of Federal Tax Expenditures For Fiscal Years 2016-2020, January 2017, JCX-3-17; and Joint Committee on Taxation, Estimates of Federal Tax Expenditures For Fiscal Years 2024-2028, December 2024, JCX-48-24. Notes: The SALT benefit is equal to the tax savings associated with the deduction. Table does not include dependent taxpayers or taxpayers with negative incomes. The income measure includes tax-exempt cash payments and benefits. 'Share of Itemized Returns' refers to the share of all itemized tax returns that fall within the given income rangeThe composition of state and local taxes also affects the SALT cap's ultimate effect on taxpayers within a local jurisdiction. Table 3 illustrates how SALT cap burden distribution can differ when the composition of state and local taxes changes while holding total tax revenue constant. In both jurisdictions, total tax revenues are $44,000. In Jurisdiction I, relatively high income tax rates generate higher income tax payments, and the SALT cap burden falls on Tax Units A and B, the taxpayers with higher incomes. In Jurisdiction II, property tax rates are higher than income tax rates, and the SALT cap burden instead falls on Tax Units A and C, the taxpayers with high property values. More of the state and local tax revenue in Jurisdiction II is above the SALT cap, meaning that taxpayers in Jurisdiction II are able to deduct less in SALT deductions
on their federal income tax returns. This analysis highlights the importance of state and local tax structure in determining the SALT cap's effect on taxpayer liability even when holding the average level of taxes constant.
Jurisdiction I Income Tax Rate > Property Tax Rate | Jurisdiction II Property Tax Rate > Income Tax Rate | ||||||||||||||||||||||||||||||||||||||||||||||||||||||||||||||||||||||||||||||||||||||||||||||||||||||||||||||||||||||||||||||||||||||||||||||||||||||||||||||||||||||||||||||||||||||||||||||||||||||||||||||||||||||||||||||||||||||||||||||||||||||||||||||||||||||||||||||||||||||||||||||||||||||||||||||||||||||||||||||||||||||||||||||||||||||||||||||||||||||||||||||||||||||||||||||||||||||||||||||||||||||||||||||||||||||||||||||||||||||||||||||||||||||||||||||||||||||||||||||||||||||||||||||||||||||||||||||||||||||||||||||||||||||||||||||||||||||||||||||||||||||||||||||||||||||||||||||||||||||||||||||||||||||||||||||||||||||||||||||||||||||||||||||||||||||||||||||||||||||||||||||||||||||||||||||||||||||||||||||||||||||||||||||||||||||||||||||||||||||||||||||||||||||||||||||||||||||||||||||||||||||||||||||||||||||||||||||||||||||||||||||||||||||||||||||||||||||||||||||||||||||||||||||||||||||||||||||||||||||||||||||||||||||||||||||||||||||||||||||||||||||||||||||||||||||||||||||||||||||
|
Tax Unit |
Inc. |
Prop. Value |
Tax Unit Inc. Prop. Value Eff. Inc. Tax % |
Eff. Prop. Tax % |
Total Taxes |
Eff. Prop. Tax %
State and Local Taxes | Eff. Inc. Tax % |
Eff. Prop. Tax % State and Local Taxes Amt. Above SALT Cap A $500K $750K 3.0% 0.5% $18,750 $8,750 1.0% 2.0% $20,000 $10,000 B $500K $50K 3.0% 0.5% $15,250 $5,250 1.0% 2.0% $6,000 $0 C $100K $750K 3.0% 0.5% $6,750 $0 1.0% 2.0% $16,000 $6,000 D $100K $50K 3.0% 0.5% $3,250 $0 1.0% 2.0% $2,000 $0 Total $44K $14K $44K $16K Notes: Examples not intended to correlate to specific localities. Eff. = Effective; Inc. = Income; Prop. = Property; Amt. = Amount; K = Thousand. General sales taxes and other taxes subject to the SALT cap are assumed to be set to zero. States with 5 Highest Average Differences Between SALT-Eligible Taxes and SALT Deduction Claimed States with 5 Lowest Average Differences Between SALT-Eligible Taxes and SALT Deduction Claimed State % of Total SALT Claimants SALT-Eligible Taxes—Deduction Claimed, per Claimant State % of Total SALT Claimants SALT-Eligible Taxes—Deduction Claimed, per Claimant NY 24% $2,700 TX 24% $600 CT 27% $1,900 WA 21% $800 CA 22% $1,700 SD 23% $400 DC 20% $800 TN 22% $300 NJ 26% $2,000 AK 23% $600 Source: IRS, SOI Income Tax Stats, Historic Table 2. Calculations performed by CRS. Notes: Dollar amounts reflect changes in taxable income, not changes in tax liability. Calculations exclude taxpayers with negative incomes. The column "% of Total SALT Claimants" refers to the percentage of SALT claimants in a given state with incomes between $50,000 and $99,999. Deduction values rounded to the nearest hundred. State Cong. District Average Income, All Filers % of All Filers with SALT Claim SALT Eligible Taxes Before Cap, per Claimant SALT Deduction After Cap, per Claimant SALT-Eligible Taxes—Deduction Claimed, per Claimant U.S. Avg. - $93,200 9.5% $25,000 $8,300 $16,600 AK At-Large $87,600 5.2% $8,400 $6,500 $1,900 AL 1 $73,400 6.6% $13,600 $7,100 $6,500 AL 2 $64,700 5.3% $9,700 $5,800 $3,900 AL 3 $66,600 6.8% $10,100 $6,200 $3,900 AL 4 $68,000 4.8% $11,800 $6,500 $5,200 AL 5 $83,600 8.1% $11,300 $6,900 $4,400 AL 6 $106,100 12.0% $17,800 $7,800 $10,000 AL 7 $52,000 5.5% $9,300 $5,800 $3,500 AR 1 $59,600 4.4% $12,300 $6,500 $5,800 AR 2 $77,600 7.1% $18,500 $7,200 $11,300 AR 3 $95,000 6.7% $36,100 $7,700 $28,400 AR 4 $58,500 4.3% $10,800 $6,100 $4,600 AZ 1 $72,700 6.9% $11,500 $6,700 $4,700 AZ 2 $77,000 7.0% $14,000 $7,000 $7,000 AZ 3 $53,400 4.0% $8,900 $6,000 $2,900 AZ 4 $71,800 8.0% $10,700 $6,500 $4,100 AZ 5 $104,700 12.3% $13,500 $7,300 $6,100 AZ 6 $148,300 15.3% $26,600 $7,700 $18,900 AZ 7 $52,100 4.0% $9,900 $5,800 $4,000 AZ 8 $83,600 9.7% $10,100 $6,600 $3,600 AZ 9 $97,300 9.4% $18,200 $7,200 $11,000 CA 1 $75,600 9.7% $18,300 $8,100 $10,200 CA 2 $149,600 18.8% $58,500 $9,200 $49,300 CA 3 $81,800 12.9% $17,800 $8,600 $9,200 CA 4 $112,200 18.0% $24,500 $8,900 $15,600 CA 5 $100,200 16.5% $25,000 $8,800 $16,200 CA 6 $74,600 10.9% $17,800 $8,500 $9,300 CA 7 $94,900 15.0% $19,800 $8,800 $11,100 CA 8 $61,800 10.2% $13,600 $8,500 $5,100 CA 9 $78,900 13.8% $18,800 $9,000 $9,900 CA 10 $74,800 11.0% $17,600 $8,600 $9,000 CA 11 $152,800 22.3% $42,600 $9,300 $33,300 CA 12 $207,300 16.8% $94,800 $10,400 $84,500 CA 13 $128,800 17.9% $40,800 $9,300 $31,500 CA 14 $176,600 20.7% $59,600 $10,300 $49,300 CA 15 $154,600 21.9% $36,000 $9,500 $26,500 CA 16 $52,100 5.9% $14,400 $8,000 $6,400 CA 17 $188,400 17.8% $48,000 $9,500 $38,400 CA 18 $354,500 26.4% $132,400 $10,000 $122,500 CA 19 $126,000 18.1% $35,400 $9,500 $26,000 CA 20 $93,300 14.0% $28,400 $9,000 $19,400 CA 21 $47,600 4.7% $14,900 $8,300 $6,600 CA 22 $78,200 10.7% $22,100 $8,400 $13,700 CA 23 $70,600 10.7% $16,600 $8,800 $7,800 CA 24 $105,400 15.2% $34,500 $8,700 $25,800 CA 25 $86,800 18.8% $19,600 $9,200 $10,400 CA 26 $104,500 17.3% $29,100 $9,000 $20,200 CA 27 $108,100 16.7% $32,600 $9,100 $23,500 CA 28 $115,700 16.4% $41,300 $9,100 $32,200 CA 29 $55,900 10.1% $14,100 $8,700 $5,500 CA 30 $128,000 20.3% $39,700 $9,100 $30,500 CA 31 $71,900 13.7% $18,700 $9,000 $9,700 CA 32 $66,900 12.6% $16,900 $9,000 $8,000 CA 33 $268,600 26.7% $92,400 $9,800 $82,600 CA 34 $64,600 8.2% $24,600 $8,600 $16,000 CA 35 $58,000 11.6% $13,400 $9,000 $4,500 CA 36 $70,000 13.2% $18,500 $8,500 $9,900 CA 37 $117,800 15.2% $46,300 $8,800 $37,400 CA 38 $71,300 15.6% $15,500 $9,100 $6,400 CA 39 $101,000 18.1% $24,800 $9,200 $15,600 CA 40 $48,900 7.5% $14,200 $8,800 $5,400 CA 41 $61,400 11.5% $13,900 $8,700 $5,200 CA 42 $85,000 18.4% $18,200 $9,200 $9,000 CA 43 $71,100 13.3% $18,500 $8,700 $9,800 CA 44 $52,800 11.2% $13,600 $8,600 $5,000 CA 45 $141,300 22.8% $33,400 $9,200 $24,100 CA 46 $59,100 9.0% $18,100 $8,700 $9,400 CA 47 $83,400 15.5% $21,300 $9,000 $12,300 CA 48 $155,800 20.6% $50,200 $9,100 $41,000 CA 49 $152,200 21.8% $45,400 $9,200 $36,300 CA 50 $90,200 16.4% $20,200 $8,900 $11,200 CA 51 $50,900 6.0% $12,300 $8,400 $3,800 CA 52 $149,900 20.1% $39,900 $9,200 $30,800 CA 53 $86,800 15.4% $19,600 $9,000 $10,600 CO 1 $119,600 13.1% $26,100 $8,400 $17,700 CO 2 $125,500 14.2% $22,700 $8,400 $14,300 CO 3 $87,200 7.2% $24,900 $7,500 $17,400 CO 4 $102,100 12.7% $15,700 $8,100 $7,500 CO 5 $82,300 8.7% $12,600 $7,300 $5,300 CO 6 $102,300 13.0% $16,400 $8,100 $8,300 CO 7 $85,700 10.9% $13,300 $7,800 $5,600 CT 1 $90,300 9.2% $19,100 $8,900 $10,100 CT 2 $97,000 9.0% $20,500 $9,000 $11,500 CT 3 $87,200 9.8% $19,000 $9,100 $10,000 CT 4 $225,500 19.4% $75,900 $9,700 $66,200 CT 5 $97,300 9.7% $24,900 $9,100 $15,800 DC At-Large $136,100 20.4% $33,000 $8,700 $24,300 DE At-Large $85,000 9.3% $17,700 $7,700 $10,000 FL 1 $88,300 5.8% $11,100 $6,200 $4,900 FL 2 $74,900 4.8% $8,600 $6,100 $2,500 FL 3 $74,700 4.8% $8,900 $6,300 $2,600 FL 4 $118,200 9.3% $12,900 $7,200 $5,600 FL 5 $51,500 3.9% $8,700 $5,200 $3,500 FL 6 $76,200 5.6% $9,800 $6,400 $3,400 FL 7 $95,400 6.9% $10,000 $6,600 $3,400 FL 8 $95,900 6.3% $15,200 $6,500 $8,700 FL 9 $62,900 5.5% $8,600 $6,500 $2,100 FL 10 $81,400 6.5% $11,000 $6,700 $4,200 FL 11 $69,300 4.8% $8,600 $6,100 $2,500 FL 12 $86,800 6.1% $9,800 $6,800 $3,100 FL 13 $97,600 7.1% $14,200 $6,800 $7,400 FL 14 $104,900 7.5% $14,200 $7,400 $6,800 FL 15 $70,800 5.2% $8,400 $5,900 $2,500 FL 16 $116,300 9.5% $16,600 $7,200 $9,400 FL 17 $80,400 6.1% $11,000 $6,500 $4,500 FL 18 $145,100 10.8% $24,100 $7,600 $16,500 FL 19 $172,500 11.4% $27,800 $7,500 $20,300 FL 20 $55,700 7.2% $9,500 $7,100 $2,400 FL 21 $175,000 11.0% $33,800 $7,500 $26,200 FL 22 $166,900 13.0% $23,700 $8,000 $15,800 FL 23 $127,300 11.0% $18,200 $8,000 $10,300 FL 24 $65,300 6.7% $14,400 $7,800 $6,600 FL 25 $70,600 7.0% $12,000 $8,100 $3,900 FL 26 $70,600 8.3% $13,600 $8,200 $5,400 FL 27 $221,000 12.1% $35,600 $8,500 $27,000 GA 1 $73,800 8.8% $15,500 $7,600 $7,900 GA 2 $52,700 6.9% $12,500 $6,600 $5,900 GA 3 $78,000 11.5% $13,900 $7,400 $6,500 GA 4 $57,700 11.4% $10,400 $7,400 $3,100 GA 5 $105,900 15.6% $27,300 $8,300 $19,000 GA 6 $157,100 18.9% $25,600 $8,800 $16,800 GA 7 $89,800 12.5% $15,800 $8,400 $7,400 GA 8 $63,800 7.8% $12,500 $6,800 $5,600 GA 9 $77,800 9.2% $14,400 $7,600 $6,800 GA 10 $79,200 11.5% $14,700 $7,800 $6,900 GA 11 $120,300 14.8% $25,000 $8,400 $16,600 GA 12 $62,600 7.9% $11,700 $6,900 $4,800 GA 13 $58,300 12.7% $10,000 $7,100 $2,900 GA 14 $64,900 6.7% $12,200 $7,300 $4,900 HI 1 $85,900 12.6% $19,100 $8,000 $11,100 HI 2 $77,500 10.9% $18,400 $7,800 $10,500 IA 1 $79,900 5.6% $16,100 $7,400 $8,700 IA 2 $79,200 5.8% $17,500 $7,800 $9,800 IA 3 $93,600 7.9% $19,200 $8,300 $10,900 IA 4 $78,600 5.6% $14,400 $7,000 $7,400 ID 1 $85,100 8.7% $14,900 $7,600 $7,300 ID 2 $84,000 7.9% $20,500 $7,800 $12,700 IL 1 $73,900 9.3% $13,500 $7,800 $5,700 IL 2 $57,500 8.3% $10,600 $7,600 $3,000 IL 3 $86,500 8.5% $18,200 $8,700 $9,500 IL 4 $61,700 5.8% $15,500 $8,600 $6,800 IL 5 $141,300 14.2% $34,700 $9,200 $25,500 IL 6 $144,700 14.7% $27,200 $9,100 $18,100 IL 7 $122,200 12.1% $35,200 $8,800 $26,400 IL 8 $77,200 7.9% $14,100 $8,700 $5,400 IL 9 $142,000 14.2% $31,700 $9,000 $22,700 IL 10 $147,400 12.2% $42,300 $9,300 $33,000 IL 11 $86,600 9.1% $16,200 $8,700 $7,500 IL 12 $68,000 4.1% $12,700 $7,500 $5,200 IL 13 $74,500 4.4% $16,000 $7,700 $8,300 IL 14 $108,500 11.1% $17,900 $9,000 $8,800 IL 15 $72,500 3.4% $13,200 $7,300 $5,900 IL 16 $74,300 4.7% $13,600 $8,000 $5,700 IL 17 $61,300 3.0% $12,500 $7,100 $5,400 IL 18 $89,100 5.6% $17,900 $8,100 $9,800 IN 1 $74,300 6.0% $15,000 $7,700 $7,300 IN 2 $72,500 4.1% $26,800 $7,700 $19,100 IN 3 $74,600 4.2% $26,000 $7,800 $18,200 IN 4 $72,300 4.9% $14,100 $7,500 $6,700 IN 5 $119,100 10.1% $27,000 $8,500 $18,500 IN 6 $68,700 3.7% $15,800 $7,600 $8,200 IN 7 $58,300 5.3% $13,900 $6,600 $7,300 IN 8 $70,100 3.1% $19,100 $7,400 $11,700 IN 9 $73,900 4.9% $16,400 $7,800 $8,700 KS 1 $67,300 4.5% $14,300 $7,400 $6,900 KS 2 $70,200 4.9% $15,200 $7,700 $7,600 KS 3 $115,800 10.7% $27,200 $8,700 $18,500 KS 4 $75,100 5.9% $21,400 $7,800 $13,600 KY 1 $60,400 3.5% $15,000 $7,200 $7,800 KY 2 $66,100 4.6% $15,900 $7,700 $8,200 KY 3 $77,400 7.8% $19,700 $8,000 $11,700 KY 4 $85,800 6.8% $20,300 $8,500 $11,800 KY 5 $53,300 2.3% $14,700 $7,200 $7,500 KY 6 $75,500 6.3% $20,100 $8,100 $11,900 LA 1 $88,400 6.9% $18,600 $7,400 $11,200 LA 2 $56,000 6.2% $11,400 $6,300 $5,000 LA 3 $71,200 4.8% $14,200 $6,600 $7,600 LA 4 $68,200 5.7% $12,700 $6,400 $6,300 LA 5 $60,500 4.6% $12,100 $6,200 $5,900 LA 6 $85,100 7.6% $14,700 $7,100 $7,600 MA 1 $77,000 6.8% $17,400 $8,100 $9,300 MA 2 $100,800 9.4% $24,600 $8,500 $16,100 MA 3 $101,500 10.4% $22,300 $8,900 $13,400 MA 4 $173,900 15.8% $43,000 $9,300 $33,800 MA 5 $160,200 15.7% $34,900 $9,200 $25,700 MA 6 $127,700 14.9% $24,100 $9,100 $15,000 MA 7 $104,300 9.7% $32,000 $8,500 $23,500 MA 8 $129,100 14.5% $26,800 $9,000 $17,800 MA 9 $100,200 11.9% $20,000 $8,600 $11,400 MD 1 $90,000 14.5% $18,100 $8,500 $9,600 MD 2 $72,100 15.7% $14,500 $8,300 $6,200 MD 3 $109,200 20.9% $22,900 $8,800 $14,100 MD 4 $79,100 24.2% $14,100 $8,400 $5,800 MD 5 $88,200 26.5% $14,300 $8,700 $5,700 MD 6 $97,600 16.9% $21,000 $8,800 $12,200 MD 7 $93,700 17.2% $21,500 $8,600 $13,000 MD 8 $138,800 22.6% $30,700 $9,000 $21,700 ME 1 $88,600 7.9% $24,500 $8,500 $15,900 ME 2 $64,100 3.3% $18,500 $7,900 $10,600 MI 1 $71,000 4.1% $18,600 $7,700 $10,900 MI 2 $72,200 5.1% $16,600 $8,300 $8,400 MI 3 $86,900 6.2% $21,200 $8,400 $12,800 MI 4 $67,900 3.5% $14,500 $7,500 $6,900 MI 5 $59,200 3.6% $12,600 $7,400 $5,200 MI 6 $78,600 5.2% $19,600 $8,100 $11,600 MI 7 $73,900 4.8% $14,100 $8,000 $6,100 MI 8 $95,900 7.8% $17,300 $8,600 $8,800 MI 9 $83,100 7.3% $20,100 $8,200 $12,000 MI 10 $77,300 5.7% $13,000 $8,000 $5,000 MI 11 $120,200 9.9% $23,100 $8,700 $14,300 MI 12 $78,600 6.5% $17,800 $8,400 $9,400 MI 13 $45,200 3.8% $11,800 $6,800 $5,000 MI 14 $76,400 8.0% $19,200 $8,100 $11,100 MN 1 $78,900 5.8% $17,500 $7,700 $9,800 MN 2 $98,100 10.3% $19,200 $8,400 $10,800 MN 3 $133,000 14.4% $36,600 $8,900 $27,700 MN 4 $95,400 10.2% $24,900 $8,600 $16,300 MN 5 $92,500 10.3% $28,500 $8,600 $19,800 MN 6 $90,700 8.8% $20,300 $8,400 $12,000 MN 7 $73,500 4.8% $16,600 $7,400 $9,200 MN 8 $72,600 5.7% $16,700 $7,900 $8,800 MO 1 $62,500 6.6% $14,000 $7,400 $6,600 MO 2 $136,200 12.1% $24,300 $8,600 $15,700 MO 3 $77,100 5.9% $13,900 $7,800 $6,000 MO 4 $69,100 4.3% $15,600 $7,400 $8,200 MO 5 $68,400 5.9% $16,700 $7,800 $8,900 MO 6 $80,100 6.0% $17,300 $8,000 $9,300 MO 7 $68,400 4.6% $19,200 $7,200 $12,000 MO 8 $59,400 3.3% $13,600 $6,800 $6,800 MS 1 $63,300 6.5% $11,300 $6,600 $4,700 MS 2 $49,300 5.9% $8,400 $5,600 $2,700 MS 3 $73,600 7.9% $14,900 $6,900 $8,000 MS 4 $65,000 5.2% $12,700 $6,700 $6,000 MT At-Large $82,700 8.0% $21,300 $7,900 $13,400 NC 1 $58,800 5.1% $12,200 $6,300 $5,800 NC 2 $117,600 12.0% $21,000 $8,400 $12,600 NC 3 $68,500 5.4% $14,500 $7,100 $7,400 NC 4 $106,500 11.8% $20,300 $8,200 $12,200 NC 5 $66,200 5.4% $14,400 $7,400 $7,000 NC 6 $79,100 7.7% $19,100 $7,500 $11,600 NC 7 $81,700 7.2% $17,500 $7,500 $10,000 NC 8 $68,400 6.1% $13,900 $7,400 $6,600 NC 9 $111,400 11.3% $23,700 $8,200 $15,400 NC 10 $79,300 6.5% $18,100 $7,800 $10,300 NC 11 $74,800 6.8% $16,400 $7,300 $9,100 NC 12 $96,600 10.8% $23,100 $8,000 $15,100 NC 13 $66,600 4.9% $14,500 $7,100 $7,300 ND At-Large $92,800 4.6% $15,500 $6,300 $9,100 NE 1 $82,800 6.0% $12,900 $8,000 $4,900 NE 2 $101,300 8.0% $16,700 $8,800 $7,900 NE 3 $70,400 4.2% $10,500 $6,600 $3,800 NH 1 $107,600 7.7% $15,100 $8,300 $6,800 NH 2 $104,200 7.3% $16,300 $8,400 $7,900 NJ 1 $84,100 10.5% $18,700 $9,100 $9,600 NJ 2 $78,900 9.4% $18,500 $8,500 $10,000 NJ 3 $94,300 13.1% $18,900 $8,700 $10,200 NJ 4 $123,900 16.6% $31,000 $9,100 $21,800 NJ 5 $143,300 18.6% $38,000 $9,500 $28,500 NJ 6 $97,300 12.4% $23,400 $9,300 $14,200 NJ 7 $172,800 17.9% $47,600 $9,400 $38,200 NJ 8 $85,700 8.0% $30,200 $9,000 $21,300 NJ 9 $84,800 10.6% $29,800 $9,200 $20,700 NJ 10 $71,500 10.3% $25,100 $9,400 $15,700 NJ 11 $160,200 19.8% $38,300 $9,500 $28,800 NJ 12 $114,400 13.6% $30,100 $9,200 $20,900 NM 1 $72,200 7.1% $13,500 $7,600 $5,900 NM 2 $57,600 3.9% $11,400 $6,400 $5,000 NM 3 $68,500 6.5% $14,100 $7,200 $6,800 NV 1 $60,700 4.3% $13,000 $5,600 $7,400 NV 2 $108,900 8.1% $20,000 $6,600 $13,400 NV 3 $125,300 11.9% $16,400 $6,700 $9,800 NV 4 $72,400 7.7% $8,000 $6,100 $1,900 NY 1 $122,900 16.3% $37,000 $9,300 $27,600 NY 2 $88,900 15.3% $20,200 $9,600 $10,600 NY 3 $177,100 20.9% $50,300 $9,500 $40,700 NY 4 $116,200 18.7% $29,400 $9,600 $19,900 NY 5 $56,700 11.6% $15,700 $9,000 $6,700 NY 6 $64,900 7.9% $21,700 $9,000 $12,700 NY 7 $91,100 7.1% $61,200 $9,000 $52,200 NY 8 $70,600 9.5% $25,200 $8,900 $16,300 NY 9 $81,100 9.5% $37,800 $9,000 $28,800 NY 10 $270,900 15.3% $172,600 $10,700 $161,800 NY 11 $87,800 12.1% $34,500 $9,100 $25,400 NY 12 $276,800 16.2% $172,100 $11,100 $161,000 NY 13 $54,100 4.4% $27,400 $8,700 $18,700 NY 14 $55,100 5.5% $18,200 $8,800 $9,300 NY 15 $35,300 2.6% $11,000 $8,300 $2,700 NY 16 $151,500 15.2% $64,600 $9,600 $55,000 NY 17 $143,300 18.2% $45,600 $9,400 $36,100 NY 18 $109,900 13.4% $33,400 $9,400 $24,000 NY 19 $85,700 7.7% $26,300 $8,900 $17,400 NY 20 $98,800 7.4% $40,800 $8,900 $31,900 NY 21 $69,200 3.9% $18,500 $8,300 $10,200 NY 22 $68,500 3.5% $18,600 $8,200 $10,400 NY 23 $67,400 3.6% $20,300 $8,200 $12,100 NY 24 $75,600 5.0% $20,100 $8,600 $11,500 NY 25 $78,500 6.2% $22,300 $8,600 $13,600 NY 26 $68,400 4.5% $19,800 $8,300 $11,600 NY 27 $85,800 5.7% $23,400 $8,600 $14,900 OH 1 $92,500 6.5% $24,300 $8,100 $16,200 OH 2 $91,500 6.1% $25,000 $8,200 $16,800 OH 3 $59,300 5.0% $15,800 $7,300 $8,500 OH 4 $65,900 3.3% $15,300 $6,900 $8,400 OH 5 $77,300 4.4% $17,600 $7,600 $10,000 OH 6 $66,300 2.5% $13,700 $6,700 $7,000 OH 7 $70,700 3.9% $14,300 $7,300 $6,900 OH 8 $74,000 4.4% $14,100 $7,500 $6,600 OH 9 $61,700 3.7% $17,100 $7,500 $9,600 OH 10 $72,000 5.1% $15,400 $7,800 $7,600 OH 11 $72,200 5.9% $23,900 $7,900 $15,900 OH 12 $104,400 8.7% $25,000 $8,600 $16,500 OH 13 $58,000 2.8% $14,900 $6,900 $8,000 OH 14 $98,800 6.8% $24,000 $8,200 $15,800 OH 15 $84,200 6.6% $18,700 $8,300 $10,400 OH 16 $85,300 5.9% $16,300 $8,000 $8,300 OK 1 $84,900 8.1% $16,800 $7,700 $9,100 OK 2 $57,400 4.6% $9,100 $6,100 $3,000 OK 3 $69,600 6.2% $10,700 $6,600 $4,100 OK 4 $70,100 6.0% $11,200 $6,800 $4,400 OK 5 $83,500 7.4% $17,700 $7,500 $10,200 OR 1 $102,900 14.5% $24,300 $9,000 $15,400 OR 2 $77,900 10.4% $20,800 $8,200 $12,500 OR 3 $88,000 14.3% $22,600 $9,000 $13,600 OR 4 $73,100 9.2% $20,900 $8,200 $12,600 OR 5 $90,600 13.4% $23,000 $8,700 $14,300 PA 1 $120,100 11.7% $21,100 $8,700 $12,400 PA 2 $52,300 5.7% $11,800 $8,100 $3,700 PA 3 $83,300 10.0% $22,100 $8,300 $13,800 PA 4 $136,100 13.2% $25,700 $8,600 $17,100 PA 5 $113,600 12.0% $24,500 $8,500 $16,000 PA 6 $124,900 11.7% $24,600 $8,700 $15,900 PA 7 $82,000 6.9% $16,200 $8,300 $7,900 PA 8 $67,500 4.2% $14,400 $8,000 $6,400 PA 9 $71,900 4.3% $14,100 $7,800 $6,300 PA 10 $81,000 6.3% $17,600 $8,500 $9,200 PA 11 $81,800 7.1% $15,800 $7,700 $8,100 PA 12 $71,400 3.7% $15,100 $7,600 $7,600 PA 13 $67,800 3.7% $14,300 $7,400 $6,900 PA 14 $82,100 4.1% $16,800 $7,900 $8,900 PA 15 $67,200 2.4% $14,200 $7,200 $7,100 PA 16 $72,100 3.6% $17,600 $7,700 $9,800 PA 17 $102,000 6.7% $22,700 $8,400 $14,200 PA 18 $81,100 5.1% $21,100 $8,200 $12,900 RI 1 $86,800 8.1% $22,200 $8,500 $13,600 RI 2 $83,500 8.2% $18,000 $8,500 $9,500 SC 1 $109,200 11.9% $23,200 $8,100 $15,100 SC 2 $78,100 8.1% $14,600 $7,600 $7,100 SC 3 $67,200 5.7% $14,600 $7,400 $7,200 SC 4 $80,700 7.7% $17,700 $7,900 $9,800 SC 5 $74,100 7.2% $14,200 $7,600 $6,600 SC 6 $54,000 5.1% $12,300 $6,900 $5,400 SC 7 $65,900 5.6% $14,400 $7,100 $7,200 SD At-Large $88,400 4.4% $10,500 $6,400 $4,200 TN 1 $65,000 3.1% $7,300 $5,600 $1,700 TN 2 $91,200 5.0% $9,800 $5,900 $3,900 TN 3 $79,500 4.6% $10,000 $6,100 $4,000 TN 4 $70,400 4.2% $6,800 $5,400 $1,400 TN 5 $106,700 8.1% $13,600 $6,600 $6,900 TN 6 $78,400 4.8% $7,100 $5,600 $1,500 TN 7 $104,200 7.5% $11,700 $6,700 $5,100 TN 8 $94,600 7.3% $10,300 $6,900 $3,400 TN 9 $51,100 5.7% $7,100 $5,700 $1,300 TX 1 $73,800 5.2% $9,300 $6,600 $2,600 TX 2 $112,000 10.1% $13,500 $8,200 $5,400 TX 3 $136,600 12.6% $13,500 $8,600 $5,000 TX 4 $81,800 7.2% $10,400 $7,500 $3,000 TX 5 $70,700 6.7% $10,900 $7,700 $3,200 TX 6 $77,900 8.8% $9,800 $7,600 $2,200 TX 7 $173,800 11.4% $22,300 $8,600 $13,700 TX 8 $108,300 9.8% $13,000 $8,400 $4,600 TX 9 $50,800 5.5% $9,600 $7,200 $2,400 TX 10 $112,700 9.8% $14,200 $8,400 $5,800 TX 11 $102,700 5.5% $11,000 $7,100 $3,900 TX 12 $100,000 9.3% $14,400 $7,900 $6,500 TX 13 $75,200 4.9% $8,900 $6,500 $2,300 TX 14 $83,700 7.7% $10,400 $7,700 $2,700 TX 15 $56,200 3.7% $9,700 $7,900 $1,800 TX 16 $59,900 3.5% $10,800 $7,900 $2,900 TX 17 $78,000 5.9% $11,900 $7,600 $4,300 TX 18 $75,800 7.2% $12,400 $7,600 $4,800 TX 19 $74,900 4.8% $9,000 $6,600 $2,400 TX 20 $59,100 4.4% $9,600 $7,400 $2,200 TX 21 $135,600 11.2% $16,400 $8,300 $8,100 TX 22 $112,500 11.0% $12,800 $8,700 $4,100 TX 23 $76,100 5.9% $11,600 $7,900 $3,700 TX 24 $125,900 10.3% $15,100 $8,300 $6,700 TX 25 $152,200 11.8% $18,700 $8,500 $10,200 TX 26 $117,600 12.3% $13,100 $8,500 $4,600 TX 27 $71,000 4.9% $9,500 $7,100 $2,400 TX 28 $54,400 3.3% $8,700 $7,200 $1,500 TX 29 $46,500 4.2% $8,600 $7,200 $1,400 TX 30 $74,300 6.8% $14,700 $7,000 $7,700 TX 31 $96,400 8.2% $11,700 $8,100 $3,500 TX 32 $167,300 12.3% $23,700 $8,500 $15,100 TX 33 $44,700 3.1% $8,200 $6,100 $2,100 TX 34 $51,100 2.5% $8,100 $6,600 $1,500 TX 35 $62,100 4.7% $10,600 $7,500 $3,100 TX 36 $76,200 6.4% $9,400 $7,500 $2,000 UT 1 $96,400 12.8% $21,900 $8,400 $13,500 UT 2 $86,600 12.1% $18,800 $8,200 $10,600 UT 3 $107,600 16.8% $21,900 $8,600 $13,300 UT 4 $86,700 13.9% $13,700 $8,300 $5,400 VA 1 $95,900 15.1% $14,500 $8,400 $6,100 VA 2 $88,100 10.7% $18,400 $7,900 $10,500 VA 3 $63,300 9.4% $11,700 $7,200 $4,500 VA 4 $78,800 10.9% $19,700 $7,500 $12,100 VA 5 $85,900 8.8% $23,500 $8,000 $15,500 VA 6 $72,700 6.7% $15,500 $7,500 $8,000 VA 7 $96,900 12.1% $17,000 $8,000 $9,000 VA 8 $137,600 21.6% $25,700 $9,100 $16,600 VA 9 $62,600 3.8% $15,400 $7,400 $8,000 VA 10 $158,400 22.8% $27,100 $9,200 $17,800 VA 11 $120,700 20.3% $20,200 $9,000 $11,200 VT At-Large $81,100 5.8% $27,600 $8,500 $19,200 WA 1 $174,700 16.7% $14,200 $8,500 $5,600 WA 2 $93,200 10.8% $9,800 $7,400 $2,400 WA 3 $91,500 9.5% $12,300 $7,400 $4,900 WA 4 $71,500 5.5% $8,000 $6,500 $1,500 WA 5 $81,100 6.1% $10,100 $6,900 $3,200 WA 6 $94,600 10.1% $10,500 $7,400 $3,100 WA 7 $159,000 17.3% $14,300 $8,500 $5,800 WA 8 $121,100 14.9% $12,100 $8,400 $3,700 WA 9 $134,300 14.0% $13,700 $8,400 $5,300 WA 10 $82,200 9.2% $9,400 $7,400 $2,000 WI 1 $83,700 6.6% $17,900 $8,300 $9,700 WI 2 $95,200 8.1% $20,500 $8,600 $11,900 WI 3 $73,200 4.4% $16,500 $7,700 $8,800 WI 4 $63,800 5.2% $21,700 $8,100 $13,600 WI 5 $99,600 8.5% $20,400 $8,300 $12,100 WI 6 $83,900 5.5% $21,300 $7,900 $13,400 WI 7 $76,300 5.0% $16,300 $7,800 $8,500 WI 8 $83,100 4.8% $20,900 $7,900 $13,000 WV 1 $70,000 3.2% $20,400 $7,900 $12,500 WV 2 $68,000 4.5% $15,600 $7,800 $7,700 WV 3 $58,000 2.2% $18,100 $7,500 $10,600 WY At-Large $105,700 5.2% $19,700 $6,000 $13,700 Source: IRS, SOI Income Tax Stats, Data by Congressional District, Tax Year 2022. Calculations performed by CRS. Notes: Dollar amounts reflect changes in taxable income, not changes in tax liability. Income categories reflect an adjusted gross income (AGI) concept. Calculations exclude taxpayers with negative incomes. Dollar amounts rounded to the nearest hundred. District boundaries are based on those used for the 117th Congress. More detail on the SALT deduction is available in CRS Report RL32781, Federal Deductibility of State and Local Taxes, by Grant A. Driessen. Real property taxes are taxes on property that is permanently affixed to land. Throughout this report, the tax savings attributable to the SALT deduction is also referred to as the benefit from the deduction. |
Total Taxes |
Amt. Above SALT Cap |
|||||||||||||||||||||||||||||||||||||||||||||||||||||||||||||||||||||||||||||||||||||||||||||||||||||||||||||||||||||||||||||||||||||||||||||||||||||||||||||||||||||||||||||||||||||||||||||||||||||||||||||||||||||||||||||||||||||||||||||||||||||||||||||||||||||||||||||||||||||||||||||||||||||||||||||||||||||||||||||||||||||||||||||||||||||||||||||||||||||||||||||||||||||||||||||||||||||||||||||||||||||||||||||||||||||||||||||||||||||||||||||||||||||||||||||||||||||||||||||||||||||||||||||||||||||||||||||||||||||||||||||||||||||||||||||||||||||||||||||||||||||||||||||||||||||||||||||||||||||||||||||||||||||||||||||||||||||||||||||||||||||||||||||||||||||||||||||||||||||||||||||||||||||||||||||||||||||||||||||||||||||||||||||||||||||||||||||||||||||||||||||||||||||||||||||||||||||||||||||||||||||||||||||||||||||||||||||||||||||||||||||||||||||||||||||||||||||||||||||||||||||||||||||||||||||||||||||||||||||||||||||||||||||||||||||||||||||||||||||||||||||||||||||||||||||||||||||
|
A |
$500K |
$750K |
3.0% |
0.5% |
$18,750 |
$8,750 |
1.0% |
2.0% |
$20,000 |
$10,000 |
|||||||||||||||||||||||||||||||||||||||||||||||||||||||||||||||||||||||||||||||||||||||||||||||||||||||||||||||||||||||||||||||||||||||||||||||||||||||||||||||||||||||||||||||||||||||||||||||||||||||||||||||||||||||||||||||||||||||||||||||||||||||||||||||||||||||||||||||||||||||||||||||||||||||||||||||||||||||||||||||||||||||||||||||||||||||||||||||||||||||||||||||||||||||||||||||||||||||||||||||||||||||||||||||||||||||||||||||||||||||||||||||||||||||||||||||||||||||||||||||||||||||||||||||||||||||||||||||||||||||||||||||||||||||||||||||||||||||||||||||||||||||||||||||||||||||||||||||||||||||||||||||||||||||||||||||||||||||||||||||||||||||||||||||||||||||||||||||||||||||||||||||||||||||||||||||||||||||||||||||||||||||||||||||||||||||||||||||||||||||||||||||||||||||||||||||||||||||||||||||||||||||||||||||||||||||||||||||||||||||||||||||||||||||||||||||||||||||||||||||||||||||||||||||||||||||||||||||||||||||||||||||||||||||||||||||||||||||||||||||||||||||||||||||||||||||||||||
|
B |
$500K |
$50K |
3.0% |
0.5% |
$15,250 |
$5,250 |
1.0% |
2.0% |
$6,000 |
$0 |
|||||||||||||||||||||||||||||||||||||||||||||||||||||||||||||||||||||||||||||||||||||||||||||||||||||||||||||||||||||||||||||||||||||||||||||||||||||||||||||||||||||||||||||||||||||||||||||||||||||||||||||||||||||||||||||||||||||||||||||||||||||||||||||||||||||||||||||||||||||||||||||||||||||||||||||||||||||||||||||||||||||||||||||||||||||||||||||||||||||||||||||||||||||||||||||||||||||||||||||||||||||||||||||||||||||||||||||||||||||||||||||||||||||||||||||||||||||||||||||||||||||||||||||||||||||||||||||||||||||||||||||||||||||||||||||||||||||||||||||||||||||||||||||||||||||||||||||||||||||||||||||||||||||||||||||||||||||||||||||||||||||||||||||||||||||||||||||||||||||||||||||||||||||||||||||||||||||||||||||||||||||||||||||||||||||||||||||||||||||||||||||||||||||||||||||||||||||||||||||||||||||||||||||||||||||||||||||||||||||||||||||||||||||||||||||||||||||||||||||||||||||||||||||||||||||||||||||||||||||||||||||||||||||||||||||||||||||||||||||||||||||||||||||||||||||||||||||
|
C |
$100K |
$750K |
3.0% |
0.5% |
$6,750 |
$0 |
1.0% |
2.0% |
$16,000 |
$6,000 |
|||||||||||||||||||||||||||||||||||||||||||||||||||||||||||||||||||||||||||||||||||||||||||||||||||||||||||||||||||||||||||||||||||||||||||||||||||||||||||||||||||||||||||||||||||||||||||||||||||||||||||||||||||||||||||||||||||||||||||||||||||||||||||||||||||||||||||||||||||||||||||||||||||||||||||||||||||||||||||||||||||||||||||||||||||||||||||||||||||||||||||||||||||||||||||||||||||||||||||||||||||||||||||||||||||||||||||||||||||||||||||||||||||||||||||||||||||||||||||||||||||||||||||||||||||||||||||||||||||||||||||||||||||||||||||||||||||||||||||||||||||||||||||||||||||||||||||||||||||||||||||||||||||||||||||||||||||||||||||||||||||||||||||||||||||||||||||||||||||||||||||||||||||||||||||||||||||||||||||||||||||||||||||||||||||||||||||||||||||||||||||||||||||||||||||||||||||||||||||||||||||||||||||||||||||||||||||||||||||||||||||||||||||||||||||||||||||||||||||||||||||||||||||||||||||||||||||||||||||||||||||||||||||||||||||||||||||||||||||||||||||||||||||||||||||||||||||||
|
D |
$100K |
$50K |
3.0% |
0.5% |
$3,250 |
$0 |
1.0% |
2.0% |
$2,000 |
$0 |
|||||||||||||||||||||||||||||||||||||||||||||||||||||||||||||||||||||||||||||||||||||||||||||||||||||||||||||||||||||||||||||||||||||||||||||||||||||||||||||||||||||||||||||||||||||||||||||||||||||||||||||||||||||||||||||||||||||||||||||||||||||||||||||||||||||||||||||||||||||||||||||||||||||||||||||||||||||||||||||||||||||||||||||||||||||||||||||||||||||||||||||||||||||||||||||||||||||||||||||||||||||||||||||||||||||||||||||||||||||||||||||||||||||||||||||||||||||||||||||||||||||||||||||||||||||||||||||||||||||||||||||||||||||||||||||||||||||||||||||||||||||||||||||||||||||||||||||||||||||||||||||||||||||||||||||||||||||||||||||||||||||||||||||||||||||||||||||||||||||||||||||||||||||||||||||||||||||||||||||||||||||||||||||||||||||||||||||||||||||||||||||||||||||||||||||||||||||||||||||||||||||||||||||||||||||||||||||||||||||||||||||||||||||||||||||||||||||||||||||||||||||||||||||||||||||||||||||||||||||||||||||||||||||||||||||||||||||||||||||||||||||||||||||||||||||||||||||
|
Tot. |
$44K |
$14K |
$44K |
$16K |
|||||||||||||||||||||||||||||||||||||||||||||||||||||||||||||||||||||||||||||||||||||||||||||||||||||||||||||||||||||||||||||||||||||||||||||||||||||||||||||||||||||||||||||||||||||||||||||||||||||||||||||||||||||||||||||||||||||||||||||||||||||||||||||||||||||||||||||||||||||||||||||||||||||||||||||||||||||||||||||||||||||||||||||||||||||||||||||||||||||||||||||||||||||||||||||||||||||||||||||||||||||||||||||||||||||||||||||||||||||||||||||||||||||||||||||||||||||||||||||||||||||||||||||||||||||||||||||||||||||||||||||||||||||||||||||||||||||||||||||||||||||||||||||||||||||||||||||||||||||||||||||||||||||||||||||||||||||||||||||||||||||||||||||||||||||||||||||||||||||||||||||||||||||||||||||||||||||||||||||||||||||||||||||||||||||||||||||||||||||||||||||||||||||||||||||||||||||||||||||||||||||||||||||||||||||||||||||||||||||||||||||||||||||||||||||||||||||||||||||||||||||||||||||||||||||||||||||||||||||||||||||||||||||||||||||||||||||||||||||||||||||||||||||||||||||||||||||||||||
Notes: Examples not intended to correlate to specific localities. Eff.=Effective; Inc.=Income; Prop.=Property; K=Thousand. General sales taxes and other taxes subject to the SALT cap are assumed to be set to zero.
State Responses to the SALT Cap
The state and local response to the SALT cap's effect has varied across municipalities. Certain governments in states with relatively high mean SALT deduction values (see Figure 1) have either enacted legislation that would appear to make tax changes to reduce the SALT cap's effect on their taxpayers or taken legal action against the federal government. Recent federal and legal responses to some of these actions suggest these efforts will likely be unsuccessful. State and local governments with relatively lower levels of SALT cap exposure have taken little to no action.
Following enactment of the TCJA, several state governments made changes to their tax codes with the potential to lower their residents' SALT cap exposure. Certain states enacted laws that provided taxpayers a credit against state taxes for charitable donations to state entities, which would then be eligible for the federal charitable deduction under Section 170 of the Internal Revenue Code. The IRS has since issued a final ruling limiting the availability of Section 170 charitable deductions in such a way that would render the new charitable activity ineligible.21 A legislative proposal that would overturn IRS regulations, S.J.Res. 50, was rejected by the Senate in October 2019.
Some states have tried to use a "pass-through work around" to reduce the SALT cap's impact on some of their taxpayers with pass-through business income. Many types of businesses that do not pay corporate income taxes (including S corporations and partnerships) pass through income to their owners, who pay taxes on that income at the individual level.22 The SALT cap does not limit SALT deductions associated with the carrying on of a trade or business.23 Hence, taxpayers whose SALT tax payments are associated with pass-through business income may not be subject to the SALT cap in the same manner as other individual income tax payments. Certain state governments have adjusted for this activity by enacting laws that levy or raise taxes on the pass-through business entity itself that are offset (holding total tax rates constant) by tax reductions or tax credits applied to individual income liability for pass-through business members subject to the tax increase. The IRS has not issued guidance on the viability of such legislation or its effect on SALT cap exposure.
Several states also took legal action related to the SALT cap following enactment of the TCJA, filing suit against the U.S. government in July 2018 and challenging the cap's constitutionality. 24 A September 2019 federal district court ruling upheld the SALT cap's constitutionality, asserting that it did not unconstitutionally penalize certain jurisdictions.25
Legislation in the 116th Congress
Legislation introduced in the 116th Congress would modify the SALT cap, including proposals that would (1) repeal the SALT cap entirely; (2) increase the SALT cap's value for all taxpayers; (3) increase the SALT cap's value for some taxpayers; (4) make the SALT cap permanent; and (5) repeal IRS regulations affecting SALT cap liability. Table 4 displays legislation in the 116th Congress that would directly modify the SALT cap.
|
Bill Number |
Latest Action (Date) |
Description of SALT cap effects |
|
Referred to H.Cmt. on Ways and Means (Jan. 2019) |
Repeals SALT cap |
|
|
Referred to H.Cmt. on Ways and Means (Jan. 2019) |
Repeals SALT cap |
|
|
Referred to H.Cmt. on Ways and Means (Jan. 2019) |
Repeals SALT cap |
|
|
Referred to H.Cmt. on Ways and Means (Feb. 2019) |
Repeals SALT cap retroactive to tax year 2019 |
|
|
Referred to S.Cmt. on Finance (Feb. 2019) |
Repeals SALT cap retroactive to tax year 2019 |
|
|
Referred to H.Cmt. on Ways and Means (Mar. 2019) |
Increases 2019 SALT cap to $30,000 for joint filers, $15,000 for single taxpayers; indexes future years to inflation |
|
|
Referred to S.Cmt. on Finance (Apr. 2019) |
Makes SALT cap permanent |
|
|
Referred to H.Cmt. on Ways and Means (May 2019) |
Increases SALT cap to an amount equal to the standard deduction |
|
|
Referred to H.Cmt. on Ways and Means (May 2019) |
Increases 2019 SALT cap to $30,000 for joint filers, $15,000 for single taxpayers, indexes future years to inflation |
|
|
Referred to H.Cmt. on Ways and Means (Jun. 2019) |
Repeals IRS regulation related to state and local tax credits |
|
|
Referred to H.Cmt. on Ways and Means (Jul. 2019) |
Repeals IRS regulation related to state and local tax credits |
|
|
Referred to H.Cmt. on Ways and Means (Sep. 2019) |
Repeals SALT cap |
|
|
Failed passage in Senate (Oct. 2019) |
Repeals IRS regulation related to state and local tax credits |
|
|
Referred to S.Cmt. on Finance (Oct. 2019) |
Increases the SALT cap to $20,000 for joint taxpayers and $10,000 for other taxpayers |
|
|
Passed House (Dec. 2019), referred to S.Cmt. on Finance (Jan. 2020) |
Doubles the SALT cap value for 2019, eliminates SALT cap in 2020 and 2021 |
Source: Congress.gov and CRS. List compiled in January 2020.
Notes: List does not include proposals with indirect SALT cap effects. Passage in either full chamber denoted in bold. H.Cmt. = House Committee; S.Cmt. = Senate Committee.
Author Contact Information
Footnotes
| 1. |
More detail on the SALT deduction is available in CRS Report RL32781, Federal Deductibility of State and Local Taxes, by Grant A. Driessen and Steven Maguire. |
|||||||||||||
| 2. |
For examples of how marginal tax rates changed as a result of P.L. 115-97, see CRS Insight IN11039, The Federal Income Tax: How Did P.L. 115-97 Change Marginal Income Tax Rates?, by Margot L. Crandall-Hollick. |
|||||||||||||
| 3. |
The Joint Committee on Taxation estimated that the share of taxpayers itemizing deductions fell from 26.8% in 2017 to 10.2% in 2019. See Joint Committee on Taxation, Estimates of Federal Tax Expenditures for Fiscal Years 2016-2020, January 2017, Table 2, JCX-3-17; and Joint Committee on Taxation, Estimates of Federal Tax Expenditures for Fiscal Years 2019-2023, Table 2, December 2019, JCX-55-19. |
|||||||||||||
| 4. |
For more information on the changes made through P.L. 115-97, see CRS Report R45092, The 2017 Tax Revision (P.L. 115-97): Comparison to 2017 Tax Law. |
|||||||||||||
| 5. | For more information on the changes made through P.L. 115-97, see CRS Report R45092, The 2017 Tax Revision (P.L. 115-97): Comparison to 2017 Tax Law. For more on the temporary components of the TCJA, see CRS Report R47846, Reference Table: Expiring Provisions in the "Tax Cuts and Jobs Act" (TCJA, P.L. 115-97).
| |||||||||||||
| 6. |
Joint Committee on Taxation, Estimates of Federal Tax Expenditures For Fiscal Years 2019-2023, December 2019, JCX-55-19. |
|||||||||||||
| 7. | For example, FY2025 encompasses October 1, 2024, through September 30, 2025. The SALT cap is in effect through December 31, 2025. Department of the Treasury, Internal Revenue Service (IRS), Statistics of Income Division, Individual Income Tax Returns, various years, Publication 1304, 2025. IRS, 2022 Statistics of Income, Historic Table 2, https://www.irs.gov/statistics/soi-tax-stats-historic-table-2; and U.S. Census Bureau, 2022 State & Local Government Finances, https://www.census.gov/data/datasets/2022/econ/local/public-use-datasets.html#; and CRS calculations. The total of $1.81 trillion is for state FY2022; state fiscal years are typically from July 1 through June 30 and thus do not align precisely with the 2022 federal tax year. Census Bureau, 2022 State & Local Government Finances. Joint Committee on Taxation (JCT), Estimates of Federal Tax Expenditures for Fiscal Years 2017-2021, May 2018, JCX-34-18; and U.S. Census Bureau, 2017 Annual Survey of State & Local Government Finances, https://www.census.gov/data/datasets/2017/econ/local/public-use-datasets.html. The sum of property, general sales, and individual income taxes does not represent the true tax base for the SALT deduction, as (1) taxpayers can only claim one of income or general sales taxes to deduct; (2) deductions for general sales taxes are claimed using a formula that does not match actual sales taxes paid; and (3) some taxes listed as corporate income may be eligible for the (individual) SALT deduction. These data cover the 2017 federal fiscal year, which does not align precisely with most state and local fiscal years. JCT, Estimates of Federal Tax Expenditures for Fiscal Years 2022-2026, December 2022, JCX-22-22, and U.S. Census Bureau, 2022 Annual Survey of State & Local Government Finances, 2025. | |||||||||||||
| 8. |
Treasury Inspector General for Tax Administration, "Review of the Issuance Process for Notice 2018-054," February 2019, p. 2. |
|||||||||||||
| 9. |
Actual amounts sourced from IRS, 2017 Statistics of Income, Historic Table 2; available at https://www.irs.gov/statistics/soi-tax-stats-historic-table-2. |
|||||||||||||
| 10. |
Joint Committee on Taxation, Background on the Itemized Deduction for State and Local Taxes, Table 4, June 2019, JCX-35-19. |
|||||||||||||
| 11. | Bradley Heim and Yulianti Abbas, "Does Federal Deductibility Affect State and Local Revenue Sources?" National Tax Journal, vo. 68, no. 1 (2015), p. 33. | |||||||||||||
| 12. | Research has demonstrated evidence of behavioral responses to changes in tax salience. See, for example, Amy Finkelstein, "E-Z Tax: Tax Salience and Tax Rates," Quarterly Journal of Economics, vol. 124, no. 3, (2009), p. 969. | |||||||||||||
| 13. |
For more on how features of the tax system affect tax salience, see William Congdon | |||||||||||||
| 14. |
See National Conference of State Legislatures, NCSL Fiscal Brief: State Balanced Budget Provisions, October 2010, | |||||||||||||
| 15. |
No assumptions are made concerning the presence and intensity of state and local government responses to the SALT cap. |
|||||||||||||
| 16. |
Sources: IRS, 2017 Statistics of Income, Historic Table 2, available at https://www.irs.gov/statistics/soi-tax-stats-historic-table-2; and United States Census Bureau, 2017 State & Local Government Finances, available at https://www.census.gov/data/datasets/2017/econ/local/public-use-datasets.html#. CRS calculations. |
|||||||||||||
| 17. |
IRS, 2017 Statistics of Income, Historic Table 2; and United States Census Bureau, 2017 State & Local Government Finances. |
|||||||||||||
| 18. |
Rates are calculated by dividing 2017 state and local general sales, individual income, and property tax collections by total adjusted gross income. Only income or general sales tax payments may be used in claiming the SALT deduction. Rates do not include corporate income, excise, or other taxes, because these taxes are not deductible as state and local taxes paid. In practice, some portion of the revenue in each state is paid by residents of other states, particularly sales tax revenue. |
|||||||||||||
| 19. |
Distributional effects discussed in this report reflect the tax and budgetary effects of the SALT cap only, and not those of the changes made in P.L. 115-97 as a whole. |
|||||||||||||
| 20. |
Joint Committee on Taxation, Background on the Itemized Deduction For State and Local Taxes, Table 4, June 2019, JCX-35-19. |
|||||||||||||
| 21. |
U.S. Department of Treasury, "Treasury Issues Final Regulations on Charitable Contributions and State and Local Tax Credits," press release, June 11, 2019, available at https://home.treasury.gov/news/press-releases/sm705. |
|||||||||||||
| 22. |
An S corporation is a corporation that elects to pass corporate income, losses, deductions, and credits through to their shareholders. C corporations, in contrast, form legal business entities that are taxed separately from their owners. |
|||||||||||||
| 23. |
The SALT cap would apply to state and local corporate income taxes which are paid by non-pass-through businesses. |
|||||||||||||
| 24. |
Jesse McKinley, "New York and New Jersey File Suit Against Trump Tax Plan," The New York Times, July 17, 2018, available at https://www.nytimes.com/2018/07/17/nyregion/salt-taxes-deduction-lawsuit-trump-cuomo.html. |
|||||||||||||
| 25. |
Ben Casselman, "Tax Law's Cap on State and Local Deductions Is Upheld In Court," The New York Times, September 30, 2019, available at https://www.nytimes.com/2019/09/30/business/economy/state-local-tax.html. |
Department of the Treasury, "Treasury Issues Final Regulations on Charitable Contributions and State and Local Tax Credits," press release, June 11, 2019, https://home.treasury.gov/news/press-releases/sm705.
Jesse McKinley, "New York and New Jersey File Suit Against Trump Tax Plan," The New York Times, July 17, 2018, https://www.nytimes.com/2018/07/17/nyregion/salt-taxes-deduction-lawsuit-trump-cuomo.html.
Ben Casselman, "Tax Law's Cap on State and Local Deductions Is Upheld by Court," The New York Times, September 30, 2019, https://www.nytimes.com/2019/09/30/business/economy/state-local-tax.html.
An S corporation is a corporation that elects to pass corporate income, losses, deductions, and credits through to its shareholders. C corporations, in contrast, form legal business entities that are taxed separately from their owners. The SALT cap applies to state and local corporate income taxes that are paid by non-pass-through businesses. Certain types of business entities, such as sole proprietorships and single-member LLCs, are generally excluded from eligibility for the pass-through workaround.
IRS, "Forthcoming regulations regarding the deductibility of payments by partnerships and S corporations for certain state and local income taxes," November 9, 2020, Notice 2020-75.
American Institute of Certified Public Accountants, "State Pass-Through Entity (PTE) Level Approach," May 1, 2024, https://us.aicpa.org/content/dam/aicpa/advocacy/tax/downloadabledocuments/56175896-pte-map.pdf.
No assumptions are made concerning the presence and intensity of state and local government responses to the SALT cap.
Final SALT deduction values will also include tax changes from other tax years and other relatively small factors that do not contribute to the SALT-eligible taxes total. This value also inherently does not capture any effects of the SALT cap on taxpayers who claimed the standard deduction in tax year 2022 but who would have itemized their deductions and claimed a SALT deduction if the SALT cap were not in effect for that tax year.
Final SALT deduction values will also include tax changes from other tax years and other relatively small factors that do not contribute to the SALT-eligible taxes total. This value also inherently does not capture any effects of the SALT cap on taxpayers who claimed the standard deduction in tax year 2022 but who would have itemized their deductions and claimed a SALT deduction if the SALT cap were not effective for that tax year.
Final SALT deduction values will also include tax changes from other tax years and other relatively small factors that do not contribute to the SALT-eligible taxes total. This value also inherently does not capture any effects of the SALT cap on taxpayers who claimed the standard deduction in tax year 2022 but who would have itemized their deductions and claimed a SALT deduction if the SALT cap were not effective for that tax year. For more on the TCJA's effect on itemized deductions, see CRS Insight IN12517, Selected Issues in Tax Reform: Itemized Deductions.