Federal Land Ownership: Overview and Data
Changes from February 21, 2020 to September 14, 2026
This page shows textual changes in the document between the two versions indicated in the dates above. Textual matter removed in the later version is indicated with red strikethrough and textual matter added in the later version is indicated with blue.
Federal Land Ownership: Overview and Data
Contents
-
Contents
Introduction - Historical Background
- Current Federal Land Management
- Agencies
- Bureau of Land Management
- Forest Service
-
- U.S. Forest Service
U.S. Fish and Wildlife Service - National Park Service
- Department of Defense
-
Federal Land Ownership,
2018 - 2024
Federal Land Ownership Changes, 1990-
2018 - 2024 Current Issues
- Extent of Ownership
- Western Land Concentration
- Maintaining Infrastructure and Lands
- Protection and Use
- Border Security
Figures
-
Figures
Figure 1. Western Federal Lands Managed byFiveFour Agencies -
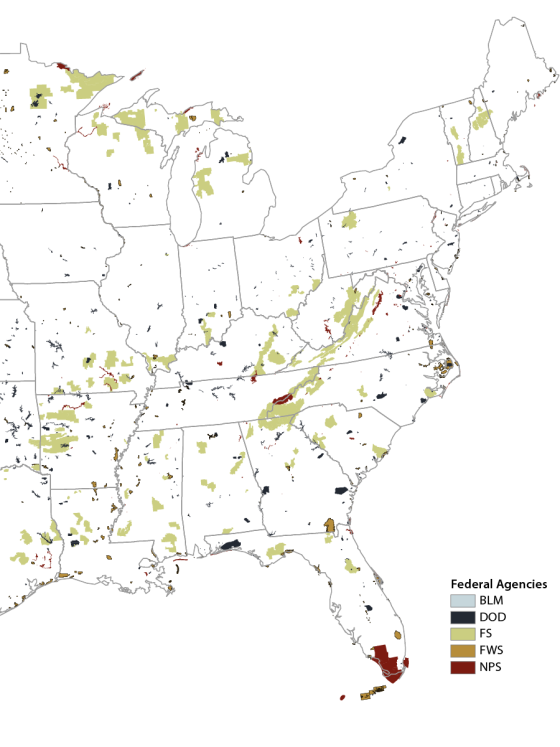
Figure 2. Eastern Federal Lands Managed by
FiveFour Agencies -
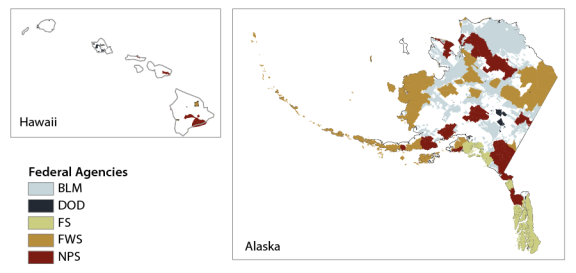
Figure 3. Federal Lands in Alaska
and Hawaii Managed by Five Agencies - Figure 4. Federal and Indian Lands Near the Southwestern Border
Tables
- , Hawaii, Guam, Puerto Rico, and the U.S. Virgin Islands Managed by Four Agencies
- Figure 4. Federal Lands Managed by Four Agencies Near the Southwestern Border
Tables
Table 1. Total Federal Land in the United States2018 - 2024
Table 2. Federal Acreage in Each State, by Agency,
2018 - 2024 Table 3. Change in Federal Acreage in the United States Since 1990, by Agency
- Table 4. Change in Federal Acreage in the United States Since 1990, by State
-
Table 5. Federal Acreage in the United States, by Agency and State or Region,
2018
2024 Summary
The federal government owns roughly 640 million acres, about 28% of the 2.27 billion acres of land in the United States. Four major federal land management agencies administer 606.58 million acres of this land (as of September 30, 20182024). They are the Bureau of Land Management (BLM), U.S. Fish and Wildlife Service (FWS), and National Park Service (NPS) in the Department of the Interior (DOI) and the U.S. Forest Service (FS) in the Department of Agriculture. A fifth agency, the Department of Defense (excluding the U.S. Army Corps of Engineers), administers 8.8 million acres in the United States (as of September 30, 2017), consisting of military bases, training ranges, and moreDOD, which is currently "using a secondary Department of War designation" under Executive Order 14347), administers 8.4 million acres in the United States. Together, the five agencies manage about 615.32 million acres, or 2796% of the U.S. land basefederal acreage. Many other agencies administer the remaining 4% of federal acreage.
lands.
The lands administered by the four major agencies are managed for many purposes, primarily related to preservation, recreation, and development of natural resources. Yet the agencies have distinct responsibilities. The BLM manages 244.4 million acres and the FS manages 192.9193.1 million acres under similar multiple-use, sustained-yield mandates that support a variety of activities and programs. The FWS manages 89.23 million acres of the U.S. total, primarily to conserve and protect animals and plants. In FY2018, the NPS managed 79.9The NPS manages 80.1 million acres in 417434 diverse units to conserve lands and resources and make them available for public use. The 8.84 million acres of DOD lands are managed primarily for military training and testing.
The amount and percentage of federally owned land in each state vary widely, ranging from 0.3% of land (in Connecticut and Iowa) to 80.179.8% of land (in Nevada). However, federalFederal land ownership is concentrated in Alaska (60.98%) and 11 coterminous western states (45.9%), in contrast with lands in the other states (4.1%). This western concentration has contributed to a higher degree of controversy over federal land ownership and use in that part of the country.
Throughout America's history, federalthe history of the United States, land laws have sought to dispose of some federal lands while keeping others in federal ownership. During the 19th century, many laws encouraged western settlement through federal land disposal. Mostly in the 20th century, emphasis shifted to retention of federal lands. Congress has provided the agencies with varying land acquisition and disposal authorities, ranging from restricted (narrow (the NPS) to broad (the BLM). As a result of acquisitions and disposals, from 1990 to 20182024, total federal land ownership by the five agencies declined by 31.57 million acres (4.9%), from 646.9 million acres to 615.32 million acres. Much of the decline is due to BLM land disposals in Alaska and reductions in DOD ownership in favor of other legal arrangements. By contrast, land ownership by the NPS, FWS, and FS increased over the 28-year periodsince 1990. Further, 1516 states had decreases of federal land during this period and the other states had varying increases.
while 34 states and the District of Columbia had increases.
Numerous issues affecting federal land management are beforecontinue to face Congress. One set of issues relates to the extent of federal ownership and whether to decrease, maintain, or increase the amount of federal holdings; the concentration of federal lands in the West; the suitability and use of acquisition and disposal authorities; and the amount, type, and location of use of acquisition funding. A second issue is the priority of acquiring new lands versus addressing the condition of current federal infrastructure. The $19.3845.16 billion maintenance backlog of the four major land management agencies in FY2025 is a factor in the debatefor congressional consideration. A third focus is the optimal balance between land protection and use (e.g., for energy development, livestock grazing, recreation, and other purposes), and. Part of this debate involves whether federal lands should be managed primarily to benefit the nation as a whole or to benefit the localities and states in which the federal lands are located. Fourth, border control on federal lands, particularly along the southwestern border, presents particularspecific challenges. This is due to the length of the border, differing agency missions, and divergent views on immigration and constructing border barriers.
Introduction
Today the
Introduction
The federal government owns and manages roughly 640 million acres of land in the United States,1 or roughly 28% of the 2.27 billion total land acres.1 Four2 As of September 30, 2024, four major federal land management agencies manage 606.5managed approximately 606.8 million acres of this land, or aboutroughly 95% of all federal land in the United States.3 These agencies are as follows: the Bureau of Land Management (BLM), 244.4 million acres; the U.S. Forest Service (FS), 192.9193.1 million acres; the U.S. Fish and Wildlife Service (FWS), 89.23 million acres; and the National Park Service (NPS), 79.980.1 million acres. Most of these lands are in the West, including AlaskaAlaska. A fifth agency, the Department of Defense (DOD) administers 8.8, which is currently "using a secondary Department of War designation" under Executive Order 14347, administered 8.4 million acres in the United States,2 about 1% of all federal land in the United States.4.3 Together, the five agencies manage about 615.32 million acres. in the United States.5 The remaining acreage, approximately 4% of all federal land in the United States, is managed by a variety of other government agencies.
The U.S. Constitution expressly vests Congress with authority over federal lands. Article IV, Section 3, clause 2, empowers Congress to dispose of and regulate all federal property. The U.S. Supreme Court has explained that this means Congress's power over federal lands is virtually unlimited.6 Ownership and use of federal lands have stirred controversy for decades.4 Conflicting public values concerning federal lands raise many questions and issues, including the extent to which the federal government should own land;
;, how to balance use and protection; of lands, and how to ensure the security of international borders along the federal lands of multiple agencies. Congress continues to examine these questions
Recent Congresses, including the 119th Congress, have considered directing the acquisition, disposal,10 or other treatment of federal lands in accordance with their policy determinations. Congress has examined these issues through legislative proposals, program oversight, and annual appropriations for the federal land management agencies.
Historical Background
11 Judicial challenges and legislative and executive efforts generally have not resulted in broad changes to the level of federal ownership. Historical Background Federal lands and resources have played a significant role in American history, adding to the strength and stature of the federal government, serving as an attraction and opportunity for settlement and economic development, and providing a source of revenue for schools, transportation, national defense, and other national, state, and local needs.
The formation of the U.S. federal government was particularly influenced by the struggle for control over what were then known as the "western" lands—the lands between the Appalachian Mountains and the Mississippi River that were claimed by the original colonies. The original states reluctantly ceded the lands to the developing new government. This cession, together with granting constitutional powers to the new federal government, including the authority to regulate federal property and to create new states, played a crucial role in transforming the weak central government under the Articles of Confederation into a stronger, centralized federal government under the U.S. Constitution.12
Subsequent federal land laws sought to reserve some federal lands for particular purposes (such as for national forests and national parks) and to sell or otherwise dispose of other lands to raise money or encourage transportation, development, and settlement. From the earliest days, these options took on East/West overtones, with easterners more likely to view thefederal lands as national public property, and westerners more likely to view the lands as necessary for local use and development.13 Most agreed, however, on measures that promoted settlement of the lands to pay soldiers, to reduce the national debt, and to strengthen the nation. This settlement trend accelerated with federal acquisition of additional territory through the Louisiana Purchase in 1803, the Oregon Compromise with England in 1846, and cession of lands by treaty after the Mexican War in 1848.5
14
In the mid-to-late 1800s, Congress enacted many laws to encourage and accelerate the settlement of the West by disposing of federal lands. Examples include the Homestead Act of 1862 and the Desert Lands Entry Act of 1877. Approximately 1.29 billion acres of public domain land was transferred out of federal ownership between 1781 and 20182024. The total included transfers of 816 million acres to private ownership (individuals, railroads, etc.), 328 million acres to states generally, and 143144 million acres in Alaska under state and Native selection laws.615 Most transfers to private ownership (97%) occurred before 1940; homestead entries, for example, peaked in 1910 at 18.3 million acres butand dropped below 200,000 acres annually after 1935, until being fully eliminated in 1986.7
16
Although several earlier laws had protected some lands and resources, such as salt deposits and certain timber for military use, new laws in the late 1800s reflected the growing concern that rapid development threatened some of the scenic treasures of the nation, as well as resources that would be needed for future use. A preservation and conservation movement evolved to ensure that certain lands and resources were left untouched or reserved for future use. For example, Yellowstone National Park was established in 1872 to preserve its resources in a natural condition, and to dedicate recreation opportunities for the public. It was the world's first national park,817 and like the other early parks, Yellowstone was protected by the U.S. Army—primarily from poachers of wildlife or timber. In 1891, concern over the effects of timber harvests on water supplies and downstream flooding led to the creation of forest reserves (renamed national forests in 1907).
18
Emphasis shifted during the 20th century from the disposal and conveyance of title to private citizens to the retention and management of the remaining federal lands. During debates on the Taylor Grazing Act of 1934,919 some western Members of Congress acknowledged the poor prospects for relinquishing federal lands to the states, but language included in the act left disposal as a possibility. It was not until the enactment of the Federal Land Policy and Management Act of 1976 (FLPMA) that Congress expressly declared that the remaining public domain lands generally would remain in federal ownership.1020 This declaration of permanent federal land ownership was a significant factor in what became known as the Sagebrush Rebellion, an effort that started in the late 1970s 1970s and 1980s to strengthen state or local control over federal land and management decisions. Recently, there has beenIn the second decade of the 21st century, there was renewed interest in some western states in assuming ownership of some federal lands within their borders. This21 That interest stemsstemmed in part from concerns about the extent, condition, and cost of federal land ownership and the type and amount of land uses and revenue derived from federal lands. Judicial challenges and legislative and executive efforts generally have not resulted in broad changes to the level of federal ownership. Current authorities for acquiring and disposing of federal lands are unique to each agency.11
Current Federal Land Management
The creation of national parks and forest reserves laid the foundation for the current federal agencies whose primary purposes are managing natural resources on federal lands—the BLM, FS, FWS, and NPS. These four agencies were created at different times, and their missions and purposes differ. As noted, DOD is the fifth-largest land management agency, withA fifth agency, the DOD, manages lands consisting of military bases, training ranges, and more. These five agencies, which together manage about 9695% of all federal land, are described below. Numerous other federal agencies—the U.S. Army Corps of Engineers, Bureau of Reclamation,12 Post Office, the22 U.S. Postal Service, National Aeronautics and Space Administration, the Department of Energy, and many more—each administer relatively small amounts of additional federal lands.
Agencies13
23 Bureau of Land Management
The BLM was formed in 1946 by combining two existing agencies.1424 One was the Grazing Service (first known as the DOI Grazing Division), established in 1934 to administer grazing on public rangelands. The other was the General Land Office, which had been created in 1812 to oversee disposal of the federal lands.15 The BLM currently administers25 As of September 30, 2024, the BLM administered 244.4 million acres, more federal lands in the United States than any other agency. BLM lands are heavily concentrated (more than 99%) in the 11 contiguous western states and Alaska.16
26
As defined in FLPMA,17 enacted in 1976,27 BLM management responsibilities are similar to those of the FS—sustained yields of multiple uses, including recreation, grazing, timber, energy and minerals, watershed, wildlife and fish habitat, and conservation. However, each agency historically has emphasized different uses. For instance, more rangelands are managed by the BLM, while most federal forests are managed by the FS. In addition, the BLM administers more than 700 million acres of federal subsurface mineral estate throughout the nation, including the subsurface of other federally owned lands and some privately owned surface lands.28
U.S. .18
Forest Service
The FS is the oldest of the four federal land management agencies. It was established in the Department of Agriculture (USDA) in 1905 and is charged with conducting forestry research, providing assistance to nonfederal forest owners, and managing the National Forest System (NFS).19 Today, the FS administers 192.929 As of September 30, 2024, the FS administered 193.1 million acres of land in the United States,2030 predominantly in the West, while also managing about three-fifths of all federal lands in the East (as shown in Table 5).
The first forest reserves—later renamed national forests—originally were authorized to protect the lands, preserve water flows, and provide timber. These purposes were expanded in the Multiple Use-Sustained Yield Act of 1960.2131 This act added recreation, livestock grazing, and wildlife and fish habitat as purposes of the national forests, with wilderness added in 1964.2232 The 1960 act directed that these multiple uses be managed in a "harmonious and coordinated" manner "in the combination that will best meet the needs of the American people."33 The act also directed the FS to manage renewable resources under the principle of sustained yield, meaning to achieve a high level of resource outputs in perpetuity without impairing the productivity of the lands.
34 U.S. Fish and Wildlife Service
The first national wildlife refuge was established by executive order in 1903, although it was not until 1966 that the refuges were aggregated into the National Wildlife Refuge System (NWRS) administered by the FWS.2335 The NWRS includes wildlife refuges, national monument areas, waterfowl production areas, and wildlife coordination units. Outside of the NWRS, the FWS administers lands for administrative sites, National Fish Hatcheries, and national monument areas. In total, as of September 30, 2024, the FWS administered 89.3, the FWS administers 89.2 million acres of federal land in the United States, of which 76.67 million acres (85.9%) arewere in Alaska.24
36
The NWRS's mission is to administer a network of lands and waters for the conservation, management, and restoration of fish, wildlife, and plants and their habitats.2537 Other uses (recreation, hunting, timber cutting, oil or gas drilling, etc.) may be permitted, to the extent that they are compatible with the NWRS mission and an individual unit's purpose.2638 However, wildlife-related activities (hunting, bird watching, hiking, education, etc.) are considered "priority uses" and are given priority consideration in refuge planning. It can be challenging to determine compatibility, but theThe relative clarity of the mission generally has minimized conflicts over refuge management and use, although there are exceptions.27
39 National Park Service
The NPS was created in 1916 to manage the growing number of park units established by Congress and monuments proclaimed by the President.28 By40 As of September 30, 20182024, the National Park System had grown to 417434 units with 79.980.1 million acres of federal land in the United States.41 About two-thirds of the lands (52.5 million acres, or 65. 6%) are in Alaska.29 NPS units have diverse titles—national park, national monument, national preserve, national historic site, national recreation area, national battlefield, and many more.30
42
The NPS has a dual mission—to preserve unique resources and to provide for their enjoyment by the public. Activities that harvest or remove resources from NPS lands generally are prohibited. Park units include spectacular natural areas, unique prehistoric sites, and special places inrelevant to American history, as well as recreational opportunities. The tension between providing recreation and preserving resources has caused many management challenges.
Department of Defense
43
The National Security Act of 1947 established a Department of National Defense (later renamed the Department of Defense, or DOD) by consolidating the previously separate Cabinet-level Department of War (renamed Department of the Army) and Department of the Navy and creating the Department of the Air Force.31 Responsibility(P.L. 80-253) established a Department of Defense and placed under its purview three "military departments," including the Department of the Army, the Department of the Navy, and the newly created Department of the Air Force.44 These military departments retained responsibility for managing the land on federal military reservations was retained by these departments, with some transfer of Army land to the Air Force upon its creation.
There are more than 4,775
As of September 30, 2024, there were more than 4,870 defense sites worldwide on a total of 26.98 million acres of land owned, leased, or otherwise possessed by the DOD.45 These sites include traditional military installations and naval port facilities as well as large tracts of land in sparsely populated areas that the DOD uses for training in land and aerial warfare or testing various weapons systems. TheDOD. Of the DOD sites, DOD owns 8.84 million acres in the United States, with individual parcel ownershipsizes ranging from 1 acre to more than a1.5 million acres.3246 Although management of military reservations remains the responsibility of each of the various military departments andor defense agencies, those secretaries and directors operate under the centralized direction of the Secretary of Defense. With regard to natural resource conservation, defense instruction provides that
in part that
a. The principal purpose of DODDoD lands, waters, airspace, and coastal resourcescoastal areas, and nearshore areas is to support mission-related activities. All DOD natural resources conservation program activities shall work to guarantee DOD continued access to its land, air, and water resources for realistic military training and testing and to sustain the long-term ecological integrity of the resource base and the ecosystem services it provides.... DOD shall manage its natural resources to facilitate testing and training, mission readiness, and range sustainability in a long-term, comprehensive, coordinated, and cost-effective manner.33
Federal Land Ownership, 2018
(1) All DoD natural resources programs should be integrated with the national defense strategy, mission activities, installation planning and programming, and other activities, to the extent practicable. (2) In accordance with Sections 670 through 670f of Title 16, United States Code (U.S.C.), also known and referred to in this issuance as the "Sikes Act," all DoD Components will manage natural resources to: (a) Guarantee DoD Components continued access to, with no net loss to the capability and capacity of, DoD lands, waters, airspace, coastal areas, and nearshore areas to perform mission activities. (b) Sustain the long-term ecological integrity and resilience of DoD lands, waters, airspace, coastal areas, and nearshore areas and ecosystems services.47 The DOD has authority under 10 U.S.C. §2667 to lease DOD property to third parties under certain circumstances. In certain circumstances, the DOD may use the General Services Administration (GSA) real property disposition process to dispose of certain property.48 Alternatively, Congress has in the past authorized a Base Realignment and Closure (BRAC) Commission, which has involved a unique DOD-led property disposition process that prioritizes community input in determining the follow-on use for surplus military property.49 In some instances, federal statutes may make a distinction between laws governing the use of land that the DOD obtained directly from the public domain compared with "acquired lands" that the DOD purchased or otherwise obtained from a previous nonfederal landowner.50The 615.3 million acres of federal land in the United States managed by the five major land management agencies represents about 27% of the total land base of 2.27 billion acres. Table 1 provides data on the total and further the national defense strategy.
3451 These tables reflect federal acreage as of September 30, 2018, except that DOD figures are current as of September 30, 20172024. The figures understate total federal land, since they do not include lands administered by other federal agencies, such as the Bureau of Reclamation and the Department of Energy. Table 1 also identifies the total acreage of each state and the percentage of land in each state administered by the five federal land agencies. These percentages point to significant variation in the federal presence within states. The figures range from 0.3% of land (in Connecticut and Iowa) to 80.179.8% of land (in Nevada). Figure 1, Figure 2, and Figure 3 show these federal lands. Figure 1 is a map of federal lands in the West; Figure 2 is a map of federal lands in the East; and Figure 3 is a map of federal lands in Alaska and Hawaii.
Although 15 states, Hawaii, Puerto Rico and the U.S. Virgin Islands, and Guam.
While 14 eastern or midwestern states and the District of Columbia each contain less than half a million acres of federal land,35 the 1152 11 of the contiguous western states and Alaska each have more than 10 million acres managed by these five agencies within their borders.53 This contrast is apartly the result of early treaties, land settlement laws and patterns, and laws requiring that states agree to surrender any claimclaims to federal lands within their border as a prerequisite for admission to the Union. Management of these lands is oftenborders as conditions of statehood.54 As noted, ownership and management of federal lands often has been controversial, especially in states where the federal government is a predominant or majority landholder and where competing andor conflicting uses of the lands are at issue.
may lead to frequent disputes.
Table 1. Total Federal Land in the United States Administered by Five Agencies, by State, 2018
2024
Total Federal |
Total Acreage |
Federal Acreage's | |
|
Alabama |
880,188 |
32,678,400 |
2.7% |
|
Alaska |
222,666,580 |
365,481,600 |
60.9% |
|
Arizona |
28,077,992 |
72,688,000 |
38.6% |
|
Arkansas |
3,159,486 |
33,599,360 |
9.4% |
|
California |
45,493,133 |
100,206,720 |
45.4% |
|
Colorado |
24,100,247 |
66,485,760 |
36.2% |
|
Connecticut |
9,110 |
3,135,360 |
0.3% |
|
Delaware |
29,918 |
1,265,920 |
2.4% |
|
District of Columbia |
9,649 |
39,040 |
24.7% |
|
Florida |
4,491,200 |
34,721,280 |
12.9% |
|
Georgia |
1,946,492 |
37,295,360 |
5.2% |
|
829,830 |
4,105,600 |
20.2% |
|
Idaho |
32,789,648 |
52,933,120 |
61.9% |
|
Illinois |
423,782 |
35,795,200 |
1.2% |
|
Indiana |
384,726 |
23,158,400 |
1.7% |
|
Iowa |
97,509 |
35,860,480 |
0.3% |
|
Kansas |
253,919 |
52,510,720 |
0.5% |
|
Kentucky |
1,100,160 |
25,512,320 |
4.3% |
|
Louisiana |
1,353,291 |
28,867,840 |
4.7% |
|
Maine |
301,481 |
19,847,680 |
1.5% |
|
Maryland |
205,362 |
6,319,360 |
3.2% |
|
Massachusetts |
62,680 |
5,034,880 |
1.2% |
|
Michigan |
3,637,599 |
36,492,160 |
10.0% |
|
Minnesota |
3,503,977 |
51,205,760 |
6.8% |
|
Mississippi |
1,552,634 |
30,222,720 |
5.1% |
|
Missouri |
1,702,983 |
44,248,320 |
3.8% |
|
Montana |
27,082,401 |
93,271,040 |
29.0% |
|
Nebraska |
546,852 |
49,031,680 |
1.1% |
|
Nevada |
56,262,610 |
70,264,320 |
80.1% |
|
New Hampshire |
805,472 |
5,768,960 |
14.0% |
|
New Jersey |
171,956 |
4,813,440 |
3.6% |
|
New Mexico |
24,665,774 |
77,766,400 |
31.7% |
|
New York |
230,992 |
30,680,960 |
0.8% |
|
North Carolina |
2,434,801 |
31,402,880 |
7.8% |
|
North Dakota |
1,733,641 |
44,452,480 |
3.9% |
|
Ohio |
305,502 |
26,222,080 |
1.2% |
|
Oklahoma |
683,289 |
44,087,680 |
1.5% |
|
Oregon |
32,244,257 |
61,598,720 |
52.3% |
|
Pennsylvania |
622,160 |
28,804,480 |
2.2% |
|
Rhode Island |
4,513 |
677,120 |
0.7% |
|
South Carolina |
875,316 |
19,374,080 |
4.5% |
|
South Dakota |
2,640,005 |
48,881,920 |
5.4% |
|
Tennessee |
1,281,362 |
26,727,680 |
4.8% |
|
Texas |
3,231,198 |
168,217,600 |
1.9% |
|
Utah |
33,267,621 |
52,696,960 |
63.1% |
|
Vermont |
465,888 |
5,936,640 |
7.8% |
|
Virginia |
2,373,616 |
25,496,320 |
9.3% |
|
Washington |
12,192,855 |
42,693,760 |
28.6% |
|
West Virginia |
1,134,138 |
15,410,560 |
7.4% |
|
Wisconsin |
1,854,085 |
35,011,200 |
5.3% |
|
Wyoming |
29,137,722 |
62,343,040 |
46.7% |
|
U.S. Total |
615,311,596 |
2,271,343,360 |
27.1% |
Alabama 875,707 32,678,400 2.7% Alaska 222,373,941 365,481,600 60.8% Arizona 27,961,796 72,688,000 38.5% Arkansas 3,174,549 33,599,360 9.4% California 45,391,499 100,206,720 45.3% Colorado 24,118,417 66,485,760 36.3% Connecticut 9,775 3,135,360 0.3% Delaware 29,934 1,265,920 2.4% D.C. 9,807 39,040 25.1% Florida 4,540,641 34,721,280 13.1% Georgia 1,974,694 37,295,360 5.3% 861,254 4,105,600 21.0% Idaho 32,785,766 52,933,120 61.9% Illinois 414,772 35,795,200 1.2% Indiana 383,751 23,158,400 1.7% Iowa 99,698 35,860,480 0.3% Kansas 254,412 52,510,720 0.5% Kentucky 1,022,623 25,512,320 4.0% Louisiana 1,391,067 28,867,840 4.8% Maine 305,213 19,847,680 1.5% Maryland 209,648 6,319,360 3.3% Massachusetts 62,956 5,034,880 1.3% Michigan 3,642,187 36,492,160 10.0% Minnesota 3,506,284 51,205,760 6.8% Mississippi 1,556,411 30,222,720 5.1% Missouri 1,704,258 44,248,320 3.9% Montana 27,168,417 93,271,040 29.1% Nebraska 558,783 49,031,680 1.1% Nevada 56,081,005 70,264,320 79.8% New Hampshire 806,343 5,768,960 14.0% New Jersey 183,084 4,813,440 3.8% New Mexico 24,581,379 77,766,400 31.6% New York 210,819 30,680,960 0.7% North Carolina 2,428,165 31,402,880 7.7% North Dakota 1,736,495 44,452,480 3.9% Ohio 305,753 26,222,080 1.2% Oklahoma 653,958 44,087,680 1.5% Oregon 32,226,209 61,598,720 52.3% Pennsylvania 608,796 28,804,480 2.1% Rhode Island 4,458 677,120 0.7% South Carolina 911,150 19,374,080 4.7% South Dakota 2,645,668 48,881,920 5.4% Tennessee 1,269,357 26,727,680 4.7% Texas 3,191,777 168,217,600 1.9% Utah 33,240,265 52,696,960 63.1% Vermont 474,866 5,936,640 8.0% Virginia 2,321,799 25,496,320 9.1% Washington 12,227,674 42,693,760 28.6% West Virginia 1,140,201 15,410,560 7.4% Wisconsin 1,855,622 35,011,200 5.3% Wyoming 29,710,191 62,343,040 47.7% U.S. Total 615,203,294 2,271,343,360 27.1%
Hawaiia
Sources: For federal lands, see sources listed in Table 2. Total acreage of states is from U.S. General Services Administration, Office of Governmentwide Policy, Federal Real Property Profile, as of September 30, 2004, Table 16, pp. 18-19.
Notes:: Figures understate federal lands in each state and the total in the United States. They include only land of the five largestfive land-managing agencies: BLM, FS, FWS, NPS, and DOD lands.the Bureau of Land Management (BLM), U.S. Forest Service (FS), U.S. Fish and Wildlife Service (FWS), National Park Service (NPS), and Department of Defense (DOD). (The DOD is currently "using a secondary Department of War designation" under Executive Order 14347.) Thus, the figures exclude federal lands managed by other agencies, such as the Bureau of Reclamation. They also exclude any land managed by the five agencies in the territories, DOD-managed acreage overseas, submerged lands in the outer continental shelf, and an estimated 662 million acres managed by FWSFWS-managed land within the U.S. Minor Outlying Islands, primarily marine areas in the Pacific Ocean.
The total federal acreage column does not add to the precise total shown due to small discrepancies in the sources used. This is also the case for some other tables in this report. Also, here and throughout the report, figures might not sum to the totals shown due to rounding.
a. This figure includes approximately 253,000 acres of submerged lands and waters within the Hawaiian Islands National Wildlife Refuge. Thus, the percentage shown overestimates the area that is federally owned.
Table 2. Federal Acreage in Each State, by Agency, 2024
State Bureau of Land Management U.S. Forest Service U.S. Fish and Wildlife Service National Park Service Department of Defense Alabama 3,137 673,400 34,041 17,540 147,589 Alaska 71,105,178 22,132,738 76,653,680 52,456,775 25,570 Arizona 12,057,980 11,183,887 1,683,554 2,658,489 377,886 Arkansas 2,732 2,593,690 392,286 100,723 85,118 California 14,989,808 20,838,146 311,107 7,655,258 1,597,180 Colorado 8,344,829 14,490,250 183,145 679,044 421,149 Connecticut 0 23 2,425 5,846 1,481 Delaware 0 0 25,543 890 3,501 D.C. 0 0 0 8,479 1,328 Florida 2,345 1,217,769 306,892 2,491,692 521,943 Georgia 0 868,513 489,401 41,231 575,549 0 0 310,218 379,534 171,502 Idaho 11,768,027 20,451,561 51,002 512,086 3,090 Illinois 20 304,723 90,726 39 19,264 Indiana 0 204,380 17,743 10,875 150,753 Iowa 0 0 75,803 2,670 21,225 Kansas 9 108,621 29,590 465 115,727 Kentucky 0 818,751 16,560 95,182 92,130 Louisiana 5,383 608,478 593,219 21,145 162,842 Maine 0 53,890 75,962 157,762 17,599 Maryland 572 0 53,624 41,878 113,574 Massachusetts 0 0 23,720 33,530 5,706 Michigan 610 2,879,011 118,132 632,443 11,991 Minnesota 1,296 2,832,995 529,986 139,900 2,107 Mississippi 5,123 1,190,990 211,668 105,754 42,876 Missouri 59 1,510,185 62,020 54,742 77,252 Montana 8,053,643 17,254,317 639,655 1,214,871 5,931 Nebraska 5,155 351,197 175,674 6,462 20,295 Nevada 47,225,132 5,761,289 2,225,565 797,690 71,329 New Hampshire 0 754,393 35,120 13,696 3,134 New Jersey 0 0 77,200 35,815 70,069 New Mexico 13,491,010 9,229,797 332,058 472,925 1,055,589 New York 0 16,389 29,679 34,115 130,636 North Carolina 0 1,258,940 425,520 368,087 375,618 North Dakota 58,674 1,103,162 492,461 71,359 10,839 Ohio 0 244,357 10,120 20,497 30,779 Oklahoma 1,377 399,772 109,011 10,011 133,787 Oregon 15,727,901 15,700,419 583,280 196,271 18,338 Pennsylvania 0 514,183 15,897 53,876 24,840 Rhode Island 0 0 2,435 8 2,015 South Carolina 0 639,394 133,990 32,556 105,210 South Dakota 275,738 2,006,708 207,116 148,022 8,084 Tennessee 0 725,299 54,962 360,616 128,480 Texas 11,947 756,953 608,020 1,204,923 609,934 Utah 22,759,900 8,193,219 110,567 2,098,111 78,468 Vermont 0 414,099 38,441 10,465 11,861 Virginia 805 1,674,033 133,527 307,533 205,901 Washington 437,317 9,356,329 171,935 1,834,687 427,406 West Virginia 0 1,047,859 22,265 67,217 2,860 Wisconsin 1,992 1,526,808 204,533 62,465 59,824 Wyoming 18,049,385 9,226,016 74,517 2,345,726 14,547 U.S. Total 244,387,084 193,116,933 89,255,595 80,071,977 8,371,705 0 28,929 25,219 26,859 171,524 Overseas 0 0 0 0 19,921 Agency Total 244,387,084 193,145,862 89,280,814 80,098,836 8,563,150 Sources: For the BLM: DOI, BLM, Public Land Statistics 2024, Table 1-4, column entitled "BLM Public Lands," https://www.blm.gov/sites/default/files/docs/2025-07/BLM-Public-Land-Statistics-2024.pdf. Data reflect BLM ownership as of September 30, 2024. For earlier fiscal years, sources included the pertinent volume of Public Land Statistics and data obtained by CRS from the BLM.
Hawaiia
Territoriesb
Table 2. Federal Acreage in Each State, by Agency, 2018
|
State |
BLM |
FS |
FWS |
NPS |
DOD |
|
Alabama |
3,011 |
670,889 |
32,585 |
17,540 |
156,163 |
|
Alaska |
71,397,880 |
22,138,560 |
76,649,320 |
52,455,308 |
25,512 |
|
Arizona |
12,120,512 |
11,179,113 |
1,683,512 |
2,658,112 |
436,743 |
|
Arkansas |
1,405 |
2,593,165 |
379,648 |
98,346 |
86,922 |
|
California |
15,088,090 |
20,791,505 |
296,899 |
7,612,898 |
1,703,741 |
|
Colorado |
8,352,437 |
14,487,064 |
174,983 |
665,260 |
420,503 |
|
Connecticut |
0 |
23 |
1,754 |
5,846 |
1,487 |
|
Delaware |
0 |
0 |
25,543 |
890 |
3,485 |
|
Dist. of Col. |
0 |
0 |
0 |
8,476 |
1,173 |
|
Florida |
2,239 |
1,203,418 |
293,636 |
2,469,173 |
522,734 |
|
Georgia |
0 |
867,580 |
488,648 |
39,935 |
550,329 |
|
0 |
0 |
309,594 |
358,160 |
162,076 |
|
Idaho |
11,776,995 |
20,447,859 |
49,733 |
511,963 |
3,098 |
|
Illinois |
20 |
304,538 |
90,000 |
12 |
29,212 |
|
Indiana |
0 |
204,318 |
16,868 |
10,769 |
152,771 |
|
Iowa |
0 |
0 |
73,427 |
2,708 |
21,374 |
|
Kansas |
1 |
108,621 |
29,509 |
462 |
115,326 |
|
Kentucky |
0 |
818,268 |
11,838 |
94,103 |
175,951 |
|
Louisiana |
2,043 |
608,546 |
582,342 |
17,690 |
142,670 |
|
Maine |
0 |
53,880 |
73,434 |
156,205 |
17,962 |
|
Maryland |
548 |
0 |
49,795 |
41,532 |
113,487 |
|
Massachusetts |
0 |
0 |
23,342 |
33,336 |
6,002 |
|
Michigan |
610 |
2,874,631 |
117,816 |
632,280 |
12,262 |
|
Minnesota |
1,101 |
2,844,937 |
516,150 |
139,789 |
2,000 |
|
Mississippi |
5,048 |
1,190,979 |
211,438 |
104,369 |
40,800 |
|
Missouri |
59 |
1,507,891 |
61,368 |
54,569 |
79,096 |
|
Montana |
8,022,852 |
17,186,331 |
653,097 |
1,214,193 |
5,928 |
|
Nebraska |
5,325 |
351,205 |
174,401 |
5,899 |
10,022 |
|
Nevada |
47,298,840 |
5,760,954 |
2,345,102 |
797,613 |
60,101 |
|
New Hampshire |
0 |
753,921 |
34,716 |
13,696 |
3,139 |
|
New Jersey |
0 |
0 |
73,785 |
35,683 |
62,488 |
|
New Mexico |
13,500,023 |
9,225,354 |
332,058 |
468,968 |
1,139,371 |
|
New York |
0 |
16,352 |
29,301 |
34,106 |
151,233 |
|
North Carolina |
0 |
1,256,493 |
423,879 |
366,889 |
387,540 |
|
North Dakota |
58,032 |
1,103,160 |
488,648 |
71,192 |
12,609 |
|
Ohio |
0 |
244,440 |
9,109 |
20,290 |
31,663 |
|
Oklahoma |
1,942 |
399,578 |
108,046 |
10,011 |
163,712 |
|
Oregon |
15,742,384 |
15,697,445 |
575,379 |
196,197 |
32,852 |
|
Pennsylvania |
0 |
513,891 |
12,614 |
53,460 |
42,195 |
|
Rhode Island |
0 |
0 |
2,415 |
5 |
2,093 |
|
South Carolina |
0 |
634,594 |
130,051 |
32,339 |
78,332 |
|
South Dakota |
275,336 |
2,006,214 |
206,930 |
148,010 |
3,515 |
|
Tennessee |
0 |
722,057 |
54,338 |
359,197 |
145,770 |
|
Texas |
12,188 |
757,036 |
574,956 |
1,206,489 |
680,529 |
|
Utah |
22,787,881 |
8,192,893 |
110,567 |
2,097,860 |
78,420 |
|
Vermont |
0 |
410,654 |
34,195 |
9,836 |
11,203 |
|
Virginia |
805 |
1,668,369 |
132,201 |
306,393 |
265,848 |
|
Washington |
437,342 |
9,335,431 |
163,791 |
1,834,616 |
421,675 |
|
West Virginia |
0 |
1,046,426 |
19,888 |
65,554 |
2,270 |
|
Wisconsin |
2,488 |
1,524,576 |
202,424 |
61,835 |
62,762 |
|
Wyoming |
17,493,875 |
9,215,971 |
70,930 |
2,345,619 |
11,327 |
|
U.S. Total |
244,391,312 |
192,919,130 |
89,205,999 |
79,945,679 |
8,849,476 |
|
Territories |
0 |
28,937 |
24,773 |
26,852 |
59,058 |
|
Overseas |
0 |
0 |
0 |
0 |
12,816 |
|
Agency Total |
244,391,312 |
192,948,059 |
89,230,772 |
79,972,531 |
8,921,349 |
Sources: For BLM, data provided to CRS by BLM on December 16, 2019. Data reflect BLM ownership as of September 30, 2018.
For FS: U.S. Dept. of Agriculture, Forest Service, Land Areas of the National Forest System—As of Sept 30, 2018, Tables 1 and 4, at https://www.fs.fed.us/land/staff/lar/LAR2018/lar2018index.html. Data reflect land within the National Forest System, including national forests, national grasslands, purchase units, land utilization projects, experimental areas, and other areas. Table I shows anthe agency total of 192,948,059. However,and Table 4 shows the individual state and territory acreages copied here from Table 4 appear to sum to 192,948,067. The reason for the discrepancy is not apparent. In this table, the agency total is reflected as the total reported in Table I, 192,948,059.
For FWS: U.S. Dept. of the Interior, Fish and Wildlife Service, 2018 Annual Lands Report Data Tables, as of September 30, 2018, Table 1A, at reflected here. For earlier fiscal years, sources included the pertinent volume of Land Areas of the National Forest System and data obtained by CRS from the FS.
For the FWS: DOI, FWS, Statistical Data Tables for Fish & Wildlife Service Lands (as of 9/30/2024), Table 1A, https://www.fws.gov/media/statistical-data-tables-fish-wildlife-service-lands-9302024https://www.fws.gov/refuges/land/PDF/2018_Annual_Report_of_Lands_Data_Tables.pdf. Data reflect federally owned land over which the FWS has sole or primary jurisdiction.
For NPS: U.S. Dept. of the Interior, National Park Service, Land Resources Division, Acreage by State, as of 9/30/2018, atTotals are summed from data in Table IA columns "Reserved from Public Domain; Primary Jurisdiction," "Acquired by Other Federal Agency; Primary Jurisdiction," "Purchased by FWS; Acres," and "Donated." For earlier fiscal years, sources include the pertinent edition of the Annual Lands Report Data Tables and data obtained by CRS from the FWS.
For the NPS: DOI, NPS, Land Resources Division, National Park Service—Acreage by State—09/30/2024, column entitled NPS Fee Acres, https://www.nps.gov/subjects/lwcf/upload/NPS-Acreage-9-30-2018.pdflwcf/acreagereports.htm. Data reflect federally owned lands managed by the NPS.
For DOD: U.S. Department of Defense, Office of the Deputy Assistant Secretary of Defense for Infrastructure, Base Structure Report, Fiscal Year 2018 Baseline (A Summary of the Real Property Inventory Data), as of September 30, 2017, VI. Total DOD Inventory, pp. DOD-29 to DOD-88, at For earlier fiscal years, sources included the pertinent edition of the NPS Acreage Reports and data obtained by CRS from the NPS.
For the DOD: DOD, Office of the Deputy Assistant Secretary of Defense for Infrastructure, Base Structure Report—FY25 Baseline (As of 30 Sept 2024), https://www.acq.osd.mil/eie/Downloads/BSI/Base%20Structure%20Report%20FY18.pdf. Hereinafter this source is referred to as the DOD FY2018 Baseline. Unlike the data for the other agencies, the DOD data is current as of September 30, 2017. The source excludes U.S. Army Corps of Engineers lands.
Notes: See notes for Table 1.
eie/imr/rpid/docs/Base-Structure-Report-FY25.xlsx. Totals reflect data presented in the "Acres Owned" columns in the "Federal DOD Main Report" tab and the "Federal Other Sites" tab. The U.S. Army Corps of Engineers (USACE) indicated to CRS that some (but not all) lands managed by USACE are reflected in the DOD estimate of 8.6 million, as shown in this table. However, USACE was not able to readily provide the precise extent of the overlap. Personal communication between CRS and USACE, Future Directions Branch, Headquarters, January 22, 2025. For earlier fiscal years, sources included the pertinent edition of the Base Structure Report and data obtained by CRS from the DOD. Notes: Acreage totals may not add to the precise totals shown due to small discrepancies in the sources used and rounding. The DOD is currently "using a secondary Department of War designation" under Executive Order 14347. See other notes for Table 1. a. This figure includes approximately 253,000 acres of submerged lands and waters within the Hawaiian Islands National Wildlife Refuge.
|
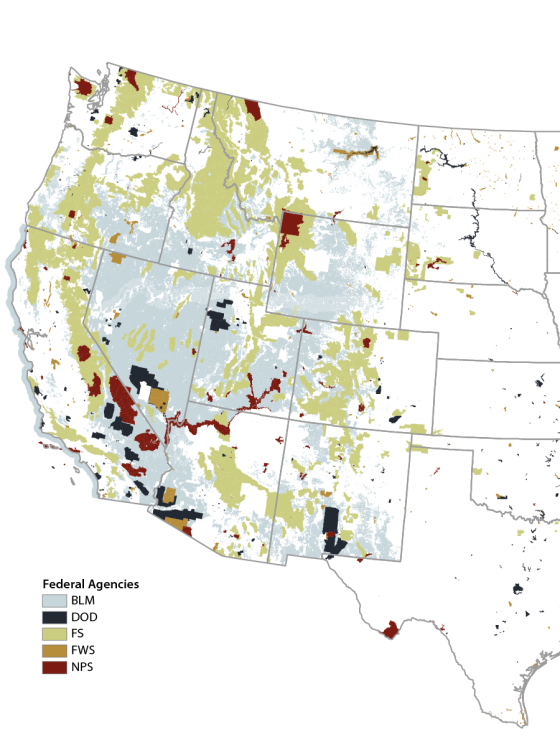 |
Source: Map boundaries and information generated by CRS using federal lands GIS data from the National Atlas, 2005, and an ESRI USA Base Map.
|
|
 |
|
Source: Map boundaries and information generated by CRS using federal lands GIS data from the National Atlas, 2005, and an ESRI USA Base Map. Note: Scale 1:13,293,047. Also, the map may reflect a broader definition of DOD land than shown in the data in Table 2. |
|
 |
|
Source: Map boundaries and information generated by CRS using federal lands GIS data from the National Atlas, 2005, and an ESRI USA Base Map. Note: Hawaii scale 1:8,000,000. Alaska scale 1:20,000,000. Also, the map may reflect a broader definition of DOD land than shown in the data in Table 2. |
Federal Land Ownership Changes, 1990-2018
Since 1990, total federal lands in the United States have generally declined. Many disposals of areas of federal lands have occurred. At the same time, the federal government has acquired many parcels of land, and there have been various new federal land designations, including wilderness areas and national park units. Through the numerous individual acquisitions and disposals since 1990, the total federal land ownership has declined by 31.5 million acres, or 4.9% of the total of the five agencies, as shown in Table 3.
Source: Created by CRS using data from the U.S. Geological Survey (USGS) Gap Analysis Project (GAP), 2024, Protected Areas Database of the United States (PAD-US) 4.1 and U.S. Census Bureau.
Source: Created by CRS using data from the U.S. Geological Survey (USGS) Gap Analysis Project (GAP), 2024, Protected Areas Database of the United States (PAD-US) 4.1 and U.S. Census Bureau. Note: Scale 1:17,000,000. BLM = Bureau of Land Management, FS = U.S. Forest Service, FWS = U.S. Fish and Wildlife Service, NPS = National Park Service. PAD-US, 2024 contains data for these land management agencies with differing dates of currency.
Source: Created by CRS using data from the U.S. Geological Survey (USGS) Gap Analysis Project (GAP), 2024, Protected Areas Database of the United States (PAD-US) 4.1 and U.S. Census Bureau. Note: Hawaii scale 1:7,500,000, Alaska scale 1:33,000,000, Guam scale 1:900,000, Puerto Rico and U.S. Virgin Islands scale 1:4,500,000. BLM = Bureau of Land Management, FS = U.S. Forest Service, FWS = U.S. Fish and Wildlife Service, NPS = National Park Service. PAD-US, 2024 contains data for these land management agencies with differing dates of currency. The total acreage decline reflects decreased acreage for two agencies but
b. The FS territories total of 28,929 reflects acreage in Puerto Rico (28,789 acres) and the U.S. Virgin Islands (140 acres). The FWS territories figure of 25,219 includes acreage in America Samoa (1,613 acres), Guam (1,218 acres), Puerto Rico (21,797 acres), and the U.S. Virgin Islands (590 acres). Acreage amounts for FWS-managed land in US territories do not include lands in the U.S. Minor Outlying Islands in the Atlantic and Pacific Oceans. The NPS territories figure of 26,859 reflects acreage in Guam (958 acres), Puerto Rico (53 acres), and the U.S. Virgin Islands (25,848 acres). The DOD territories figure of 171,524 includes acreage in Guam (62,128 acres), Puerto Rico (17,008 acres), the U.S. Virgin Islands (44 acres), Johnston Atoll (684 acres), the Northern Mariana Islands (89,059 acres), and Wake Island (2,600 acres).
Federal Land Ownership Changes, 1990-2024
Since 1990, the total acreage of federal land in the United States has declined by 31.7 million acres, or 4.9% of the total of the five agencies, because the acreage of disposed areas of federal lands has exceeded the area acquired.55 Table 3 shows and explains the changes in ownership among the five agencies.
The total acreage decline reflects decreased acreage for two agencies and increased acreage for three others. BLM ownership decreased by 27.6 million acres (10.2%), in large part due to the disposal of BLM land, under law, to the State of Alaska, Alaska Natives, and Alaska Native Corporations.
3656 DOD land ownership also declined, by 11.712.2 million acres (56.859.2%). This decline wasappears to be primarily due to changes in legal arrangements for managing military installations rather than changes in the sizes of the installations themselves. For instance, of the 26.98 million acres of defense sites (worldwide) in DOD's FY2018 Baseline report57—more than 9897.1% of which isare in the United States or territories—8.94 million acres (31.3%) were federally owned.58 million acres (33%) were federally owned,37 0.9 million acres (3%) were leased, and 17.1 million acres (63%) were managed through a legal interest that was "other" than owned or leased.38 By comparison, of the 28.4 million acres of defense sites (worldwide) in DOD's 2010 report, approximately 19.8 million (70%) were federally owned,39 0.5 million (2%) were leased, and 8.0 million (28%) were managed under another legal interest.
.59
In contrast, the NPS, FWS, and FS expanded their acreage during the period, with the NPS having the largest increase in both acreage and percentage growth─3.8—3.9 million acres (5.02%). In some cases, a decrease in one agency's acreage was tied to an increase in acreage owned by another agency.40
managed by another agency, through enactment of laws that transferred administrative jurisdiction over federal land from one agency to another.60 Table 3. Change in Federal Acreage in the United States Since 1990, by Agency
|
1990 |
2000 |
2010 |
2018 |
|
| |
|
BLM |
272,029,418 |
264,398,133 |
247,859,076 |
244,391,312 |
-27,638,106 |
-10.2% |
|
FS |
191,367,364 |
192,355,099 |
192,880,840 |
192,919,130 |
1,551,766 |
0.8% |
|
FWS |
86,822,107 |
88,225,669 |
88,948,699 |
89,205,999 |
2,383,892 |
2.7% |
|
NPS |
76,133,510 |
77,931,021 |
79,691,484 |
79,945,679 |
3,812,169 |
5.0% |
|
DOD |
20,501,315 |
24,052,268 |
19,421,540 |
8,849,476 |
-11,651,839 |
-56.8% |
|
U.S. Total |
646,853,714 |
646,962,190 |
628,801,839 |
615,311,596 |
-31,542,118 |
-4.9% |
Sources: See sources listed Table 2.
1990 2000 2010 2020 2024 BLM 272,029,418 264,398,133 247,859,076 244,378,573 244,387,084 -27,642,334 -10.2% FS 191,367,364 192,355,099 192,880,840 193,012,827 193,116,933 1,749,569 0.9% FWS 86,822,107 88,225,669 88,948,699 89,256,317 89,255,595 2,433,488 2.8% NPS 76,133,510 77,931,021 79,691,484 80,008,167 80,071,977 3,938,467 5.2% 20,501,315 24,052,268 19,421,540 8,630,393 8,371,705 -12,129,610 -59.2% U.S. Total 646,853,714 646,962,190 628,801,639 615,286,278 615,203,294 -31,650,420 -4.9%Notes: See notes for Table 1. Also, estimates generally reflect the end of the fiscal year for the years shown, (i.e., September 30). However, DOD figures for the years indicated were not readily available. Rather, the DOD figures for the four columns
Change1990-2024
% ChangeSince 1990
DODa
Sources: See sources listed Table 2.
Notes: Acreage totals may not add to the precise totals shown due to small discrepancies in the sources used and rounding. See other notes for Table 1. BLM = Bureau of Land Management, FS = U.S. Forest Service, FWS = U.S. Fish and Wildlife Service, NPS = National Park Service, and DOD = Department of Defense. DOD is currently "using a secondary Department of War designation" under Executive Order 14347. Also, estimates generally reflect the end of the fiscal year for the years shown (i.e., September 30).
a. The DOD data reflected in this table do not correspond to three of the years shown: 1990, 2000, and 2010. This is because reports for those years do not appear to be available and/or contained data from which it is challenging, if not impossible, to determine acres owned. For these reasons, the DOD figures for these years were derived respectively from the FY1989 Base Structure Report (published in February 1988), the FY1999 Base Structure Report (with data as of September 30, 1999),
the FY2010 Base Structure Report (with data as of September 30, 2009), and the FY2018and the FY2010 Base Structure Report (with data as of September 30, 2017).
2009).
The total federal acreage decline (shown in Table 3) is a composite of various decreases in acreage in 1516 states and increases in acreage in 3635 states (including the District of Columbia). A reduction in federal lands in Alaska was a major reason for the total Much of the decline in federal lands since 1990land ownership since 1990 occurred in Alaska. As shown in Table 4, federal land declined in Alaska by 23.03 million acres (9.45%) between 1990 and 20182024. As noted, this decline in Alaska is largely the result of the disposal of BLM land under Alaska-specific laws. Specifically, from 1990 to 2018, BLM land in Alaska declined by 21.1 million acres (22.8%).
BLM land in Alaska declined from 92.5 million acres in 1990 to 71.1 million acres in 2024, a 21.4 million acre (23.1%) decline.
Since 1990, federal land also has decreased in the 11 contiguous western states, by 10.7 million acres (3.0%)from 356.0 million in 1990 to 345.5 million in 2024, a 10.5 million acre (2.9%) decline. Reflected in the overall decline are reductions for 6 of the 11 states, with decreases of 6.34 million acres in Arizona, 3.79 million acres in Nevada,4161 and smaller decreases in four other states. FiveFrom 1990 to 2024, 5 of the 11 states each had increases ranging roughly from 0.2 million acres to 0.5 million acres, with the largest being 0.5 million acres in Colorado.
Outside Alaska and the other western states, federal land increased by 2.1 million acres (4.5%)from 45.2 million acres in 1990 to 47.3 million acres in 2024. This was a 2.1 million acre (4.7%) increase. This increase was not uniform, with declines in some states and varying increases (in acreages and percentage) in others.
Table 4. Change in Federal Acreage in the United States Since 1990, by State
1990 2000 2010 2020 2024 Alabama 944,505 979,907 871,232 873,019 875,707 -68,798 -7.3% Alaska 245,669,027 237,828,917 225,848,164 222,565,221 222,373,941 -23,295,086 -9.5% Arizona 34,399,867 33,421,887 30,741,287 28,032,427 27,961,796 -6,438,071 -18.7% Arkansas 3,147,518 3,418,455 3,161,978 3,164,472 3,174,549 27,031 0.9% California 46,182,591 47,490,824 47,797,533 45,375,956 45,391,499 -791,092 -1.7% Colorado 23,579,790 24,001,922 24,086,075 24,077,855 24,118,417 538,627 2.3% Connecticut 6,784 9,012 8,557 9,328 9,775 2,991 44.1% Delaware 27,731 28,397 28,574 29,918 29,934 2,203 7.9% D.C. 9,533 8,466 8,450 9,650 9,807 274 2.9% Florida 4,344,976 4,671,958 4,536,811 4,498,013 4,540,641 195,665 4.5% Georgia 1,921,674 1,933,464 1,956,720 1,977,442 1,974,694 53,020 2.8% Hawaii 715,215 682,650 833,786 832,492 861,254 146,039 20.4% Idaho 32,566,081 32,569,711 32,635,835 32,788,125 32,785,766 219,685 0.7% Illinois 353,061 403,835 406,734 416,306 414,772 61,711 17.5% Indiana 274,483 394,243 340,696 384,391 383,751 109,268 39.8% Iowa 33,247 83,134 122,602 98,221 99,698 66,451 199.9% Kansas 281,135 300,465 301,157 253,915 254,412 -26,723 -9.5% Kentucky 966,483 1,065,814 1,083,104 1,017,658 1,022,623 56,140 5.8% Louisiana 1,578,151 1,565,875 1,330,429 1,386,028 1,391,067 -187,084 -11.9% Maine 176,486 210,167 209,735 302,684 305,213 128,727 72.9% Maryland 173,707 190,783 195,986 208,121 209,648 35,941 20.7% Massachusetts 63,291 63,998 81,692 62,738 62,956 -335 -0.5% Michigan 3,649,258 3,692,271 3,637,965 3,639,118 3,642,187 -7,071 -0.2% Minnesota 3,545,702 3,581,741 3,469,211 3,509,410 3,506,284 -39,418 -1.1% Mississippi 1,478,726 1,544,501 1,523,574 1,556,068 1,556,411 77,685 5.3% Missouri 1,666,718 1,676,175 1,675,400 1,701,101 1,704,258 37,540 2.3% Montana 26,726,219 26,745,666 26,921,861 27,115,921 27,168,417 442,198 1.7% Nebraska 528,707 556,347 549,346 548,176 558,783 30,076 5.7% Nevada 60,012,488 60,180,297 56,961,778 56,231,079 56,081,005 -3,931,483 -6.6% New Hampshire 734,163 754,858 777,807 805,563 806,343 72,180 9.8% New Jersey 146,436 164,865 176,691 181,047 183,084 36,648 25.0% New Mexico 24,742,260 26,829,296 27,001,583 24,689,022 24,581,379 -160,881 -0.7% New York 215,441 229,097 211,422 215,459 210,819 -4,622 -2.1% North Carolina 2,289,509 2,415,560 2,426,699 2,422,686 2,428,165 138,656 6.1% North Dakota 1,727,541 1,729,430 1,735,755 1,732,776 1,736,495 8,954 0.5% Ohio 234,396 289,566 298,500 305,967 305,753 71,357 30.4% Oklahoma 505,898 696,377 703,336 653,488 653,958 148,060 29.3% Oregon 32,062,004 32,703,212 32,665,430 32,212,852 32,226,209 164,205 0.5% Pennsylvania 611,249 598,165 616,895 607,709 608,796 -2,453 -0.4% Rhode Island 3,110 4,867 5,248 4,523 4,458 1,348 43.3% South Carolina 891,182 872,173 898,637 905,095 911,150 19,968 2.2% South Dakota 2,626,594 2,642,646 2,646,241 2,642,904 2,645,668 19,074 0.7% Tennessee 980,416 1,251,514 1,273,974 1,282,422 1,269,357 288,941 29.5% Texas 2,651,675 2,855,997 2,977,950 3,223,919 3,191,777 540,102 20.4% Utah 33,582,578 34,982,884 35,033,603 33,266,796 33,240,265 -342,313 -1.0% Vermont 346,518 428,314 453,871 465,927 474,866 128,348 37.0% Virginia 2,319,524 2,381,575 2,358,071 2,358,610 2,321,799 2,275 0.1% Washington 11,983,984 12,646,137 12,173,813 12,198,126 12,227,674 243,690 2.0% West Virginia 1,062,500 1,096,956 1,130,951 1,135,390 1,140,201 77,701 7.3% Wisconsin 1,980,460 2,006,778 1,865,374 1,853,739 1,855,622 -124,838 -6.3% Wyoming 30,133,121 30,081,046 30,043,513 29,457,403 29,710,191 -422,930 -1.4% U.S. Total 646,853,714 646,962,190 628,801,639 615,286,278 615,203,294 -31,650,420 -4.9% Certain issues have recurred throughout the history of federal land ownership. One is the optimal extent of ownership. Some advocate disposing of federal lands to state or private ownership; others favor retaining currently owned lands; still others promote land acquisition by the federal government, including through increased or more stable funding sources. Another focus is on the condition of federal lands and related infrastructure, and how to balance the restoration and maintenance of current assets with the acquisition of additional lands. Some assert that lands and infrastructure have deteriorated and that agency activities and funding should focus on restoration and maintenance, whereas others advocate expanding federal protection to additional lands. Debates also encompass the extent to which federal lands should be developed, preserved, and open to recreation and whether federal lands should be managed primarily to produce national benefits or benefits primarily for the localities and states in which the lands are located. In addition, border security, along and near the southwestern border in particular, raises questions related to management of, and access to, certain federal lands. These questions stem, in part, from the differing roles of the Department of Homeland Security (DHS) and the federal land management agencies. As noted above, the optimal extent of federal land ownership is an enduring issue for Congress. Current debates encompass the extent to which the federal government should dispose of, retain, or acquire lands in general and in particular areas. Advocates of retention of federal lands, and federal acquisition of additional lands, assert a variety of benefits to the public of federal land ownership. They include protection and preservation of unique natural and other resources, open space, and public access, especially for recreation. Some support land protection from development.62
Change1990-2024
% ChangeSince 1990
Sources: See sources listed in Table 2.
Notes: DOD = Department of Defense. The DOD is currently "using a secondary Department of War designation" under Executive Order 14347. The DOD data reflected in this table do not correspond to three of the years shown: 1990, 2000, and 2010. This is because reports for those years do not appear to be available and/or contained data from which it is especially challenging if not impossible to determine acres owned. For these reasons, the DOD figures for these years were derived respectively from the FY1989 Base Structure Report (published in February 1988), the FY1999 Base Structure Report (with data as of September 30, 1999), and the FY2010 Base Structure Report (with data as of September 30, 2009). Also, acreage totals may not add to the precise totals shown due to small discrepancies in the sources used and rounding. See other notes for Table 1 and Table 3.
Current Issues
Table 4. Change in Federal Acreage in the United States Since 1990, by State
|
1990 |
2000 |
2010 |
2018 |
|
| |
|
Alabama |
944,505 |
979,907 |
871,232 |
880,188 |
-64,317 |
-6.8% |
|
Alaska |
245,669,027 |
237,828,917 |
225,848,164 |
222,666,580 |
-23,002,447 |
-9.4% |
|
Arizona |
34,399,867 |
33,421,887 |
30,741,287 |
28,077,992 |
-6,321,875 |
-18.4% |
|
Arkansas |
3,147,518 |
3,418,455 |
3,161,978 |
3,159,486 |
11,968 |
0.4% |
|
California |
46,182,591 |
47,490,824 |
47,797,533 |
45,493,133 |
-689,458 |
-1.5% |
|
Colorado |
23,579,790 |
24,001,922 |
24,086,075 |
24,100,247 |
520,457 |
2.2% |
|
Connecticut |
6,784 |
9,012 |
8,557 |
9,110 |
2,326 |
34.3% |
|
Delaware |
27,731 |
28,397 |
28,574 |
29,918 |
2,187 |
7.9% |
|
Dist. of Col. |
9,533 |
8,466 |
8,450 |
9,649 |
116 |
1.2% |
|
Florida |
4,344,976 |
4,671,958 |
4,536,811 |
4,491,200 |
146,224 |
3.4% |
|
Georgia |
1,921,674 |
1,933,464 |
1,956,720 |
1,946,492 |
24,818 |
1.3% |
|
Hawaii |
715,215 |
682,650 |
833,786 |
829,830 |
114,615 |
16.0% |
|
Idaho |
32,566,081 |
32,569,711 |
32,635,835 |
32,789,648 |
223,567 |
0.7% |
|
Illinois |
353,061 |
403,835 |
406,734 |
423,782 |
70,721 |
20.0% |
|
Indiana |
274,483 |
394,243 |
340,696 |
384,726 |
110,243 |
40.2% |
|
Iowa |
33,247 |
83,134 |
122,602 |
97,509 |
64,262 |
193.3% |
|
Kansas |
281,135 |
300,465 |
301,157 |
253,919 |
-27,216 |
-9.7% |
|
Kentucky |
966,483 |
1,065,814 |
1,083,104 |
1,100,160 |
133,677 |
13.8% |
|
Louisiana |
1,578,151 |
1,565,875 |
1,330,429 |
1,353,291 |
-224,860 |
-14.2% |
|
Maine |
176,486 |
210,167 |
209,735 |
301,481 |
124,995 |
70.8% |
|
Maryland |
173,707 |
190,783 |
195,986 |
205,362 |
31,655 |
18.2% |
|
Massachusetts |
63,291 |
63,998 |
81,692 |
62,680 |
-611 |
-1.0% |
|
Michigan |
3,649,258 |
3,692,271 |
3,637,965 |
3,637,599 |
-11,659 |
-0.3% |
|
Minnesota |
3,545,702 |
3,581,741 |
3,469,211 |
3,503,977 |
-41,725 |
-1.2% |
|
Mississippi |
1,478,726 |
1,544,501 |
1,523,574 |
1,552,634 |
73,908 |
5.0% |
|
Missouri |
1,666,718 |
1,676,175 |
1,675,400 |
1,702,983 |
36,265 |
2.2% |
|
Montana |
26,726,219 |
26,745,666 |
26,921,861 |
27,082,401 |
356,182 |
1.3% |
|
Nebraska |
528,707 |
556,347 |
549,346 |
546,852 |
18,145 |
3.4% |
|
Nevada |
60,012,488 |
60,180,297 |
56,961,778 |
56,262,610 |
-3,749,878 |
-6.2% |
|
New Hampshire |
734,163 |
754,858 |
777,807 |
805,472 |
71,309 |
9.7% |
|
New Jersey |
146,436 |
164,865 |
176,691 |
171,956 |
25,520 |
17.4% |
|
New Mexico |
24,742,260 |
26,829,296 |
27,001,583 |
24,665,774 |
-76,486 |
-0.3% |
|
New York |
215,441 |
229,097 |
211,422 |
230,992 |
15,551 |
7.2% |
|
North Carolina |
2,289,509 |
2,415,560 |
2,426,699 |
2,434,801 |
145,292 |
6.3% |
|
North Dakota |
1,727,541 |
1,729,430 |
1,735,755 |
1,733,641 |
6,100 |
0.4% |
|
Ohio |
234,396 |
289,566 |
298,500 |
305,502 |
71,106 |
30.3% |
|
Oklahoma |
505,898 |
696,377 |
703,336 |
683,289 |
177,391 |
35.1% |
|
Oregon |
32,062,004 |
32,703,212 |
32,665,430 |
32,244,257 |
182,253 |
0.6% |
|
Pennsylvania |
611,249 |
598,165 |
616,895 |
622,160 |
10,911 |
1.8% |
|
Rhode Island |
3,110 |
4,867 |
5,248 |
4,513 |
1,403 |
45.1% |
|
South Carolina |
891,182 |
872,173 |
898,637 |
875,316 |
-15,866 |
-1.8% |
|
South Dakota |
2,626,594 |
2,642,646 |
2,646,241 |
2,640,005 |
13,411 |
0.5% |
|
Tennessee |
980,416 |
1,251,514 |
1,273,974 |
1,281,362 |
300,946 |
30.7% |
|
Texas |
2,651,675 |
2,855,997 |
2,977,950 |
3,231,198 |
579,523 |
21.9% |
|
Utah |
33,582,578 |
34,982,884 |
35,033,603 |
33,267,621 |
-314,957 |
-0.9% |
|
Vermont |
346,518 |
428,314 |
453,871 |
465,888 |
119,370 |
34.4% |
|
Virginia |
2,319,524 |
2,381,575 |
2,358,071 |
2,373,616 |
54,092 |
2.3% |
|
Washington |
11,983,984 |
12,646,137 |
12,173,813 |
12,192,855 |
208,871 |
1.7% |
|
West Virginia |
1,062,500 |
1,096,956 |
1,130,951 |
1,134,138 |
71,638 |
6.7% |
|
Wisconsin |
1,980,460 |
2,006,778 |
1,865,374 |
1,854,085 |
-126,375 |
-6.4% |
|
Wyoming |
30,133,121 |
30,081,046 |
30,043,513 |
29,137,722 |
-995,399 |
-3.3% |
|
U.S. Total |
646,853,714 |
646,962,190 |
628,801,639 |
615,311,596 |
-31,542,118 |
-4.9% |
Current Issues
Since the cession to the federal government of the western lands by several of the original 13 states, many federal land issues have recurred. The extent of ownership continues to be debated. Some advocate disposing of federal lands to state or private ownership; others favor retaining currently owned lands; still others promote land acquisition by the federal government, including through increased or more stable funding sources. Another focus is on the condition of federal lands and related infrastructure. Some assert that lands and infrastructure have deteriorated and that agency activities and funding should focus on restoration and maintenance, whereas others advocate expanding federal protection to additional lands. Debates also encompass the extent to which federal lands should be developed, preserved, and open to recreation and whether federal lands should be managed primarily to produce national benefits or benefits primarily for the localities and states in which the lands are located. Finally, border security, along and near the southwestern border in particular, raises questions related to management of, and access to, federal lands. These questions stem, in part, from the differing roles of the Department of Homeland Security (DHS) and the federal land management agencies.42
Extent of Ownership
The optimal extent of federal land ownership is an enduring issue for Congress. Current debates encompass the extent to which the federal government should dispose of, retain, or acquire lands in general and in particular areas. Advocates of retention of federal lands, and federal acquisition of additional lands, assert a variety of benefits to the public of federal land ownership. They include protection and preservation of unique natural and other resources; open space; and public access, especially for recreation. Some support land protection from development.
Disposal advocates have expressed concerns about the efficacy and efficiency of federal land management, accessibility of federal lands for certain types of recreation, and limitations on development of federal lands. Some support selling federal land for financial reasons, such as to help lower federal expenditures, reduce the deficit, or balance the budget. Others assert that limited federal resources constrain agencies' abilities to protect and manage the lands and resources. Other concerns involve the potential influence of federal land protection on private property, development, and local economic activity. Some seek disposal to states or private landowners to foster state, local, and private control over lands and resources.
or private landowners to foster state, local, and private control over lands and resources.63
Other issues center on the suitability of authorities for acquiring and disposing of lands and their use the use of such authorities in particular areas. Congress has provided to the federal agencies varying authorities for acquiring and disposing of land.4364 With regard to acquisition, the BLM has relatively broad authority, the FWS has various authorities, and the FS authority is mostly limited to lands within or contiguous to the boundaries of a national forest. The DOD also has authority for acquisitions.4465 By contrast, the NPS has no general authority to acquire land to create new park units. Condemnation for acquiring land is feasible, but,The five agencies have authority to acquire land by condemnation, but with the exception of DOD, rarely is used by these agencies. Its potential use has been controversial in some cases. this authority has been used rarely by these agencies in recent decades.
The primary funding mechanism for federal land acquisition, for the four major federal land management agencies, has been appropriations from the Land and Water Conservation Fund (LWCF).4566 For the FWS, the Migratory Bird Conservation Fund (provides an additional source of mandatory spending for land acquisition. This fund is supported by sales of Duck Stamps and import taxes on arms and ammunition) provides an additional source of mandatory spending for land acquisition..67 Funding for acquisitions by DOD isthe DOD has been provided in DOD appropriations laws. There continue to be different views as to acquisition funding, including the appropriate amount, type (discretionary and/or mandatory), and location of use.
With regard to disposal, the NPS and FWS have no general authority to dispose of the lands they administer, and the FS disposal authorities are restricted. The BLM has broader authority under provisions of FLPMA and other laws, such as the Recreation and Public Purposes Act.68 .46 DOD lands that are excess to military needs generally can be disposed of under the surplus property process administered by the General Services Administration (GSA). While surplus DOD real property is routinely disposed of by the GSA, legislationLegislation authorizing base realignment and closure (BRAC) rounds typically has authorized the Secretary of Defense to exercise GSA's disposal authorityGSA to delegate its disposal authority to the Secretary of Defense during BRAC rounds.47
69
It is not uncommon for Congress to enact legislation providing for the acquisition or disposal of particular lands where an agency lacks such authority or providing particular procedures for specified land transactionsauthority, directing agencies to use existing authority, or modifying the terms and conditions of existing authorities for particular parcels of land. Further, recent Congresses have considered measures to establish or amend broader authorities for acquiring or disposing of land.
70 Western Land Concentration
The concentration of federal lands in the West has contributed to a higher degree of controversy over federal land ownership in that part of the country. For instance71 In particular, the dominance of BLM and FS lands in the western states has led to various efforts to divest the federal government of significant amounts of land. In recent years, some western states, among others, have considered measures to provide for or express support for the transfer of federal lands to states, to establish task forces or commissions to examine federal land transfer issues, and to assert management authority over federal lands. An earlier collection of efforts from the late 1970s and early 1980s, known as the Sagebrush Rebellion, also sought to foster divestiture of federal lands. However, that effort was not successful in achieving this end through legal challenges in the federal courts and efforts to persuade the Reagan Administration and Congress to transfer the lands to state or private ownershipAs noted, the Sagebrush Rebellion in the 1970s and 1980s sought to foster divestiture of federal lands. However, that effort was not successful in achieving this end, either through legal challenges in the federal courts or through efforts to persuade the Reagan Administration and Congress to transfer the lands to state or private ownership. In more recent years, some western states, among others, have considered measures to provide for or express support for the transfer of federal lands to states, to establish task forces or commissions to examine federal land transfer issues, and to assert management authority over federal lands. Some supporters of continued or expanded federal land ownership have asserted that state and local resource constraints, other economic considerations, or environmental or recreational priorities weigh against state challenges to federal land ownership. In recent years, some states have considered measures to express support for federal lands or to limit the sale of federal lands in the state.48
72
As shown in Table 1 and Table 2, the 11 contiguous western states and Alaska have extensive areas of federal lands. Table 5 summarizes the data in Table 1 to clarify the difference in the extent of federal ownership in the United States between western and other states. As can be seen in Table 5, 60.98% of the land in Alaska is federally owned, which includes 85.9% of the total FWS lands and 65.65% of the total NPS lands. In contrast, only 0.3% of DOD-owned lands are in Alaska. Of the land in the 11 contiguous western states, 45.9% is federally owned, which includes 73.4% of total FS lands and 70.68% of total BLM lands. In the rest of the country, the federal government owns 4.1% of the lands. The FS manages the largest portion of this land in other states—61.8%—and the BLM manages the least—0.8%. Slightly more than half (51.1%) of the DOD lands are in the other states, with slightly less than half (4948.6%) in the 11 western states.
The remaining lands (0.3%) are in Alaska.
Table 5. Federal Acreage in the United States, by Agency and State or Region, 2024
Alaska Total BLM 71,105,178 172,904,932 376,974 244,387,084 FS 22,132,738 141,685,230 29,298,965 193,116,933 FWS 76,653,680 6,366,385 6,235,527 89,255,595 NPS 52,456,775 20,465,158 7,150,045 80,071,977 DOD 25,570 4,070,913 4,275,223 8,371,705 Total 222,373,941 345,492,617 47,336,734 615,203,294 Acreage of States 365,481,600 752,947,840 1,152,913,920 2,271,343,360 Percentage Federal 60.8% 45.9% 4.1% 27.1%
11 WesternStatesa
OtherStates
Table 5. Federal Acreage in the United States, by Agency and State or Region, 2018
|
Alaska |
|
|
U.S. Total |
|
|
BLM |
71,397,880 |
172,621,231 |
372,201 |
244,391,312 |
|
FS |
22,138,560 |
141,519,920 |
29,260,650 |
192,919,130 |
|
FWS |
76,649,320 |
6,456,051 |
6,100,632 |
89,205,999 |
|
NPS |
52,455,308 |
20,403,299 |
7,087,074 |
79,945,679 |
|
DOD |
25,512 |
4,313,759 |
4,510,205 |
8,849,476 |
|
U.S. Total |
222,666,580 |
345,314,260 |
47,330,762 |
615,311,596 |
|
Acreage of States |
365,481,600 |
752,947,840 |
1,152,913,920 |
2,271,343,360 |
|
Percentage Federal |
60.9% |
45.9% |
4.1% |
27.1% |
Sources: For federal lands, see sources listed in Table 2. Total acreage of states is from U.S. General Services Administration, Office of Governmentwide Policy, Federal Real Property Profile, as of September 30, 2004, Table 16, pp. 18-19.
Notes: Acreage totals may not add to the precise totals shown due to small discrepancies in the sources used and rounding. See other notes for Table 1. BLM = Bureau of Land Management, FS = U.S. Forest Service, FWS = U.S. Fish and Wildlife Service, NPS = National Park Service, and DOD = Department of Defense. The DOD is currently "using a secondary Department of War designation" under Executive Order 14347.
Notes: See notes for Table 1. As mentioned, the U.S. total shown is not the precise sum of the figures in the first three columns due to small discrepancies in the sources used and rounding.
a. The 11 western states are Arizona, California, Colorado, Idaho, Montana, Nevada, New Mexico, Oregon, Utah, Washington, and Wyoming.
Maintaining Infrastructure and Lands
Debate continues over how to balance the acquisition of new assets and lands with the maintenance of the agencies' existing infrastructure and the care of current federal lands. Some assert that addressing the condition of infrastructure and lands in current federal ownership is paramount. They support ecological restoration as a focus of agency activities and funding and an emphasis on managing current federal lands for continued productivity and public benefit. They oppose new land acquisitions and unit designations until the backlog of maintenance activities has been eliminated or greatly reduced and the condition of current range, forest, and other federal lands is significantly improved. Others contend that expanding federal protection to additional lands is essential to provide new areas for public use, protect important natural and cultural resources, and respond to changing land and resource conditions.
73
The ecological condition of current federal lands has long been a focus of attention. For example, the poor condition of public rangelands due to overgrazing was the rationale for enacting the Taylor Grazing Act of 1934 and the creation ofcreating the BLM.4974 Today, debates on the health and productivity of federal lands center on rangelands, forests, riparian areas, and other resources. These lands and resources might be affected in some areas by various land uses, such as livestock grazing, recreation, and energy development, and rights-of-way. Many other variables might impact the health of federal lands and resources, including wildfires, community expansion, invasive weeds, and drought.75
The deferred maintenance of federal infrastructure also has been a focus of Congress and the Administrationexecutive branch for many years. Deferred maintenance, often called the maintenance backlog, is defined as maintenance that was not done when scheduled or planned.76 The agencies assert that continuing to defer maintenance of facilities accelerates their rate of deterioration, increases their repair costs, and decreases their value.
77
Congressional and administrative attention has centered on the NPS backlog. The DOI estimated deferred maintenance for the NPS for FY2018 at $11.92 billion.FY2025 at $24.24 billion.78 Of the total deferred maintenance, 57% was for roads, bridges, and trails; 19% was for buildings; 6% was for irrigation, dams, and other water structures; and 18% was for other structures (e.g., recreation sites).5038.9% was for transportation assets, 29.8% was for assets related to recreational and visitor experience, 17.0% was for water infrastructure and utilities, 11.5% was for operational buildings, and 2.7% was for other structures. The DOI estimates of the NPS backlog have increased overall since FY1999, from $4.25 billion in that year.5179 It is unclear what portion of the change is due to the addition of maintenance work that was not done on time or, the availability of more precise estimates of the backlog, or inflation and market trends (e.g., construction-related), among other factors. The NPS, as well as the other land management agencies, increased efforts to define and quantify maintenance needs over the past two decades.
While attention has focused on the NPS backlog, the other federal land management agencies also have maintenance backlogs. The FS estimated its backlog for FY2018 at $5.20FY2025 at $10.81 billion.5280 Of the total deferred maintenance, 6155.3% was for roads,5381 24.6% was for buildings, and the remaining 1520.1% was for a variety of other assets (e.g., trails, fences, and bridges). For FY2018, bridges and water systems). For FY2025, the DOI estimated the FWS backlog at $1.30 billion and the BLM backlog at $0.96 billion.54 The four agencies together had a combined FY2018 backlog estimated at $19.38 billion.
BLM backlog at $6.60 billion, with 85.2% for transportation assets and the remainder for various other assets.82 The DOI estimated the FWS backlog at $3.51 billion, with 31.7% for roads, bridges, and trails and the remainder split roughly equally among three other asset classes (buildings, water management, and other structures).83 The four agencies together had a combined FY2025 backlog estimated at $45.16 billion.
The agency backlogs have been attributed to decades of funding shortfalls.,84 and changes in agency methodologies for defining deferred maintenance, among other factors.85 However, it is unclear how much total funding has been provided for the maintenance backlog over the years. Annual presidential budget requests and appropriations laws typically have not identified funds from all sources that may be used to address the maintenance backlog. Among other sources, the land management agencies receive annual discretionary appropriations for deferred maintenance. In addition, for each of FY2021-FY2025, a major source of funding for the four agencies (and the Bureau of Indian Education) was provided under provisions of the Great American Outdoors Act (P.L. 116-152).86 That law provided $1.9 billion annually in mandatory appropriations for agency deferred maintenance. Much of the funding is in the process of being allocated, so its full effect is not known. Opinions differ over the level of funds needed to address deferred maintenance, the extent to which funding should be discretionary or mandatory, whether to use funds from other programs and/or new sources, and how to prioritize funds for maintenance needs.
Protection and Use
The extent to which federal lands should be opened to development, available for recreation, and/or preserved has been controversial. Differences of opinion exist on the amount of traditional commercial development that should be allowed, particularly involving energy development, livestock grazing, and timber harvesting. Whether and where to restrict recreation, generally and for high-impact usestypes of recreation, such as motorized off-road vehicles, also ishas been a focus. How much land to dedicate to enhanced protection, what type of protection to provide, and who should protect federal lands are continuing questions. Another area under consideration involves how to balance the protection of wild horses and burros on federal lands with protection of the range and other land uses.87
Debates also encompass whether federal lands should be managed primarily to emphasize benefits nationally or for the localities and states where the lands are located. National benefits can include using lands to produce wood products for housing or to extract energy from traditional (oil, gas, coal) and alternative/renewable sources (wind, solar, geothermal, biomass). Other national benefits might encompass clean water for downstream uses;, biodiversity for ecological resilience and adaptability;, and wild animals and wild places for human enjoyment. Local benefits can include economic activities, such as livestock grazing, timber for sawmills, ski areas, tourism, and other types of development. Local benefits could also be scenic vistas and areas for recreation—picnicking, sightseeing, backpacking, four-wheeling, snowmobiling, hunting and fishing, and much more.
more.
Federally recognized Tribes also may have a stake in the management of federal lands, which frequently encompass areas of historic, cultural, or religious importance to Tribes and their members. Some Tribes may view the maintenance of sacred sites and continued access to culturally important vistas or natural resources as essential; others may prioritize the opportunities for economic growth or self-sufficiency that may come from development.88
Other issues of debate include who decides the national-local balance, in control of federal lands and how those decisions are made. Some would like to see more local control of land and a reduced federal role, while othersstakeholders favor more local input and control by those in the areas where federal lands are located, to foster local needs and uses. Others seek to maintain or enhance the federal role in land management to representon the grounds that this better represents the interests and needs of all citizens.
Border Security55
Border security presents special challenges on federal lands, given the extensive federal lands along the southwestern border with Mexico and the northern border with Canada. The federal lands on the borders tend to be geographically remote and include mountains, deserts, and other inhospitable terrain with limited law enforcement coverage. Moreover, theThe lands are managed by different federal agencies, under various laws, and for many purposes.
The southwestern border with Mexico has been a particular focus. There are various estimates and depictions of federal lands on or near the border. For instance, by one estimate, six different agencies manage 621.5 (linear) miles of federal lands along the southwestern border.56 Second, a depiction of federal (and Indian)89 Figure 4 depicts federal lands located within 50 and 100 miles from the U.S.-Mexican border is shown in Table 4. Third, according to the House Committee on Natural Resources, there are about 26.7 million acres of federal lands within 100 miles of the border (and an additional 3.5 million acres of Indian lands).57 Nearly half of the federal lands (12.3 million acres) are managed by the BLM, and the remainder are managed by DOD (5.8 million acres), FS (3.8 million acres), NPS (2.4 million acres), FWS (2.2 million acres), and other federal agencies (0.2 million acres).
that are managed by the four main federal land management agencies.
The extent to which federal and other lands along the southwestern border should be used for the construction of barriers to deter illegal immigration and other illegal activity is under currentcontinues to be under debate. Efforts to build borderbarriers and other infrastructure to reduce illicit activity at the border, such as illegal entry and drug and contraband smuggling, are a priority for the Trump Administration as well as for some Members of Congress and portions of the public.90 By contrast, some Members of Congress and segments of the public oppose barrier construction as potentially costly, possibly damaging to lands and resources, and unlikely to be a major deterrent to illegal activity, among other reasons.58
91
Within DHS, the U.S. Border Patrol (USBP) takes the lead role inhas responsibility for staffing and securing the international borders, but more than 40% of the southwestern border abuts federal and tribal lands overseen by the FS and the four DOI agencies (including the Bureau of Indian Affairs) that also have law enforcement responsibilities.5992 The Trump Administration has taken actions to foster the U.S. military's involvement on border lands in the interest of security.93 Differences in missions and jurisdictional complexity among these agencies may hindercomplicate border control. To facilitate control efforts, three federal agencies—DHS, the Department of Agriculture (for the FS), and DOI—have signed memoranda of understanding (MOUs) on border security. These MOUs govern information sharing, budgeting, operational planning, USBP access to federal lands, and interoperable radio communications, among other issues.60
In general, federal efforts to secure the border are subject to the National Environmental Policy Act of 1969 (NEPA), which requires agencies to evaluate the potential environmental impacts of proposed programs, projects, and actions before decisions are made to implement them.61 Implementing regulations require agencies to integrate NEPA project evaluations with other planning and regulatory compliance requirements to ensure that planning and decisions reflect environmental considerations.62 Federal law confers the DHS Secretary with broad authority to construct barriers and roads along U.S. borders to deter illegal crossings. The Secretary may waive application of NEPA and other laws that the Secretary determines may impede the expeditious construction of these barriers and roads.63 In the past, Congress has introduced legislation to broaden DHS's authority to be exempt from NEPA, land management statutes, and other environmental laws on the grounds that these laws (and related litigation) may impede DHS from taking actions on federal lands to secure the border. Some have opposed such legislation on the grounds that it would remove important protections for sensitive and critical habitats and resources and that the current authority is already sufficiently broad.
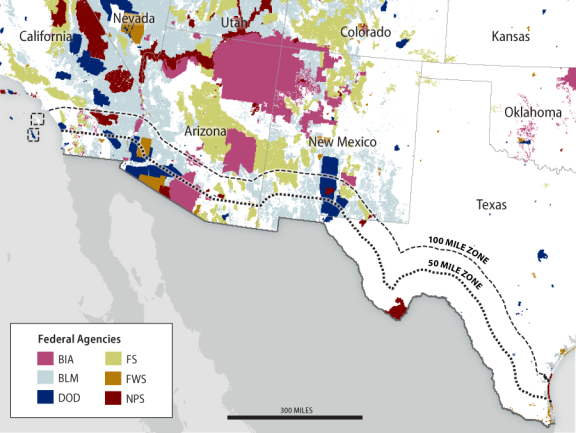
Author Contact Information
Footnotes
| 1. |
| ||||||||||||||||||||||||||
| 2. |
Acreage figures for the four land management agencies are current as of September 30, 2018; the Department of Defense (DOD) figure is current as of September 30, 2017 (the most recent available). The DOD figure excludes land managed by the U.S. Army Corps of Engineers. |
||||||||||||||||||||||||||
| 3. |
In addition, Forest Service (FS), Fish and Wildlife Service (FWS), National Park Service (NPS), and DOD manage varying acreages in the U.S. territories; FWS manages additional acres of marine refuges and national monuments; and DOD manages additional acres overseas. |
||||||||||||||||||||||||||
| 4. |
In this report, the term federal land is used to refer to any land owned (fee simple title) and managed by the federal government, regardless of its mode of acquisition or managing agency; it excludes lands administered by a federal agency under easements, leases, contracts, or other arrangements. Public land is used to refer to lands managed by the Bureau of Land Management (BLM) as defined in 43 U.S.C. §1702(e). |
||||||||||||||||||||||||||
| 5. | at times have signed memoranda of understanding (MOUs).94 Another focus has been on the environmental effects of illegal immigration, barrier construction, and border security enforcement on federal lands along the borders.95
Source: Created by CRS using data from the U.S. Geological Survey (USGS) Gap Analysis Project (GAP), 2024, Protected Areas Database of the United States (PAD-US) 4.1; U.S. Census Bureau; the U.S. Department of State (2017); and ERSI. Notes: Scale 1:15,000,000. BLM = Bureau of Land Management, FS = U.S. Forest Service, FWS = U.S. Fish and Wildlife Service, and NPS = National Park Service. Federal lands not administered by BLM, FS, FWS, and NPS were not included. PAD-US, 2024, contains data for these land management agencies with differing dates of currency. Acreage figures in this report for the five agencies reflect data as of September 30, 2024. That was the most recent time all of the five agencies covered herein had published data by state during the preparation of this report. Also, in this report, the term federal land is used to refer to any land owned (fee simple title) and managed by the federal government, regardless of its mode of acquisition or managing agency. It excludes lands administered by a federal agency under easements, leases, contracts, or other arrangements. Public land is used to refer to lands managed by the BLM as defined in 43 U.S.C. §1702(e). Executive Order 14347 of September 5, 2025, "Restoring the United States Department of War," 90 Federal Register 43893, September 10, 2025, https://www.federalregister.gov/documents/2025/09/10/2025-17508/restoring-the-united-states-department-of-war. The Department of Defense (DOD) is included in this report because of the relatively large amount of land it manages and the availability of acreage statistics by state over the time period covered by this report. It is not necessarily the fifth-largest land manager currently, however. For instance, as of September 30, 2024, DOD acreage totaled 8.4 million, according to DOD, FY2025 Base Structure Report, September 30, 2024, https://www.acq.osd.mil/eie/imr/rpid/docs/Base-Structure-Report-FY25.xlsx. As of the same date, the U.S. Army Corps of Engineers (USACE) reported acreage of 12.0 million acres. See U.S. Army, Fiscal Year 2024 Untied States Army Corps of Engineers Agency Financial Report, p. 12, https://www.publications.usace.army.mil/Portals/76/FY%2024%20Civil%20Works%20Annual%20Financial%20Report.pdf. Moreover, there appears to be some overlap of acreage in the DOD and USACE FY2024 data, according to the USACE, although USACE was not able to clarify the precise extent of any overlap. Personal communication between CRS and USACE, Future Directions Branch, Headquarters, January 22, 2025. In addition, the U.S. Forest Service (FS), U.S. Fish and Wildlife Service (FWS), National Park Service (NPS), and DOD manage varying acreages in the U.S. territories. Also, the FWS manages additional acres of marine refuges and national monuments and DOD manages additional acres overseas. Kleppe v. New Mexico, 426 U. S. 529, 539 (1976), quoting United States v. San Francisco, 310 U. S. 16, 29 (1940). For a range of perspectives, see John Ruple, "Western Public Land Law and the Evolving Management Landscape," pp. 20-36, in Erika Allen Wolters and Brent S. Steel, eds, The Environmental Politics and Policy of Western Public Lands (Oregon State University Press, 2020); Holly Fretwell and Shawn Regan, "Divided Lands: State vs. Federal Management in the West," Property and Environment Research Center (PERC) Public Lands Report, March 2015, https://www.perc.org/wp-content/uploads/2015/03/150303_PERC_DividedLands.pdf; and Lisa W. Foderaro, "America Needs More Public Lands, Not Less," Trust For Public Land, 2025, https://www.tpl.org/wp-content/uploads/2025/04/TPL-Special-Report_We-Need-More-Public-Lands-Not-Less_Final.pdf. In 2012, for example, Utah's state legislature enacted the Transfer of Public Lands Act, which sought to require the United States, on or before December 31, 2014, to (1) extinguish its title to public lands within the state that did not fall within a list of exceptions; and (2) transfer title to those lands to the State of Utah. Utah Code Ann. §63L-6-103. No such transfer took place. In 2024, Utah attempted to bring the matter directly to the U.S. Supreme Court, requesting leave to file a bill of complaint asking whether a policy of "perpetual federal retention of unappropriated public lands in Utah is unconstitutional." The United States opposed the filing, and in January 2025, the Court denied Utah leave to file its bill of complaint, effectively choosing not to entertain the question. Utah's actions echoed a movement in several western states a few decades earlier that came to be known as the Sagebrush Rebellion. In the 1970s and 1980s, various states enacted statutes attempting to lay claim to federal lands. See Ariz. Rev. Stat. Ann. §§37-901 (1980); Ch. 633, 1979 Nev. Stats. 13; N.M. Stat. Ann.§19-15-9 (1980); Utah Code Ann. §65-11-1-9 (1980); Wash. Rev. Code §79.80.020 (1980); Wvo. Stat. §36-12-10 (1980). Private entities supportive of the movement used judicial challenges to try to overcome congressional withdrawal of certain public lands for conservation purposes. E.g., Sagebrush Rebellion, Inc. v. Hodel, 790 F.2d 760, 761 (9th Cir. 1986). For additional historical context on actions of states to foster control of federal lands within state borders, see CRS Report R44267, State Management of Federal Lands: Frequently Asked Questions, by Carol Hardy Vincent. For an example of judicial review in the context of withdrawing federal lands for particular purposes, see CRS Report R49048, Presidential Authority Under the Antiquities Act, by Cassandra J. Barnum. For example, actions of Presidents to reduce or expand the size of national monuments occasionally have been the subject of lawsuits. As examples, see Hopi Tribe v. Trump, No. 17-cv-02590 (D.D.C. filed Dec. 4, 2017), consolidating three cases challenging President Trump's modification of the Bears Ears National Monument; and Garfield County v. Biden, No. 22-cv-0059 (D. Utah filed Aug. 15, 2023), challenging President Biden's expansion of the Bears Ears National Monument. Current authorities for acquiring and disposing of federal lands are unique to each agency. For a description of these authorities, see CRS Report RL34273, Federal Land Ownership: Acquisition and Disposal Authorities, by Carol Hardy Vincent et al. For the BLM, see also CRS Report R48079, Land Disposal Authorities and Processes of the Bureau of Land Management, coordinated by Carol Hardy Vincent. As examples, see provisions of P.L. 111-11, Omnibus Public Land Management Act of 2009; P.L. 113-291, Carl Levin and Howard P. "Buck" McKeon National Defense Authorization Act for Fiscal Year 2015; P.L. 118-234, Expanding Public Lands Outdoor Recreation Experiences Act (EXPLORE Act); P.L. 119-74, Division C, Department of the Interior, Environment, and Related Agencies Appropriations Act, 2026; and U.S. Congress, House Committee on Natural Resources, Subcommittee on Federal Lands, The State of Our Nation's Federal Forests and Outlook for the 2026 Wildfire Year, 119th Cong,, 2nd sess., June 4, 2026, https://naturalresources.house.gov/calendar/eventsingle.aspx?EventID=418807. Paul Gates, History of Public Land Law Development (Government Publishing Office, 1968), pp. 1-3, pp. 49-57. Gates, History of Public Land Law Development, p. 28. | ||||||||||||||||||||||||||
| 6. | DOI, BLM, Public Land Statistics, 2024, Table 1-2, https://www.blm.gov/sites/default/files/docs/2025-07/BLM-Public-Land-Statistics-2024.pdf. | ||||||||||||||||||||||||||
| 7. |
| ||||||||||||||||||||||||||
Act of March 1, 1872; 16 U.S.C. §21 | |||||||||||||||||||||||||||
| 9. |
43 U.S.C. §§315, et seq. |
||||||||||||||||||||||||||
| 10. | The Act of March 4, 1907 (34 Stat. 1269) essentially provided that forest reserves would be thereafter known as national forests. See the editorial notes to 16 U.S.C. §488. For additional information on establishment and modification of the National Forest System, see CRS Report R43872, National Forest System Management: Overview and Issues for Congress, by Anne A. Riddle, especially pp. 2-3. 43 U.S.C. §§315 et seq. | ||||||||||||||||||||||||||
|
For a description of these authorities, see CRS Report RL34273, Federal Land Ownership: Acquisition and Disposal Authorities, by Carol Hardy Vincent et al. |
|||||||||||||||||||||||||||
| 12. |
For an overview of some efforts and issues relating to state management of federal lands during that period, see CRS Report R44267, State Management of Federal Lands: Frequently Asked Questions, by Carol Hardy Vincent. | ||||||||||||||||||||||||||
| 13. | , according to the agency. See DOI, Reclamation, "About Us—Fact Sheet" (last updated December 10, 2025), https://www.usbr.gov/main/about/fact.html.
| ||||||||||||||||||||||||||
| 24.
|
| Paul W. Gates, History of Public Land Law Development, written for the Public Land Law Review Commission (Washington, DC: GPO, Nov. 1968), pp. 610-622. | |||||||||||||||||||||||||
The General Land Office administered the forest reserves prior to the creation of the FS in 1905. | |||||||||||||||||||||||||||
The 11 western states are Arizona, California, Colorado, Idaho, Montana, Nevada, New Mexico, Oregon, Utah, Washington, and Wyoming. Data on BLM acreage by state | |||||||||||||||||||||||||||
FLPMA is sometimes called the BLM "Organic Act," because it consolidated and articulated the agency's management responsibilities.
DOI, BLM, Public Land Statistics, 2024, Table 1-3, https://www.blm.gov/sites/default/files/docs/2025-07/BLM-Public-Land-Statistics-2024.pdf. Figures represent acreage as of September 30, 2024. Not all of the more than 700 million acres contain extractable mineral and energy resources. For brief information related to federal subsurface estate, see CRS Report R48130, Energy Production on Federal Lands: Leasing and Authorization, by Adam Vann, pp. 1-2, and Andrew C. Mergen, "Surface Tension: The Problem of Federal/Private Split Estate Lands," Land & Water Law Review, vol. 33, issue 2, art. 3 (1998). | |||||||||||||||||||||||||||
| 18. |
Not all of the more than 700 million acres contain extractable mineral and energy resources. |
||||||||||||||||||||||||||
| 19. | In 1891, Congress had authorized the President to establish forest reserves from the public domain lands administered by the | ||||||||||||||||||||||||||
| 20. |
| ||||||||||||||||||||||||||
| 21. |
16 U.S.C. §§528-531. |
||||||||||||||||||||||||||
| 22. | For information on FS areas in FY2025, see USDA, FS, Land Areas of the National Forest System—As of Sept 30, 2025, https://usfs-public.app.box.com/s/rhq1lm3rq3wauhtz6yulanuzoijaaqsw/file/2146439917355.
16 U.S.C. §§528-531. The Wilderness Act of 1964, 16 U.S.C. §§1131-1136. 16 U.S.C. §531(a). For information on the National Forest System, see CRS Report R43872, National Forest System Management: Overview and Issues for Congress, by Anne A. Riddle. National Wildlife Refuge System Administration Act of 1966, 16 U.S.C. §§668dd-668ee. | ||||||||||||||||||||||||||
| 23. |
National Wildlife Refuge System Administration Act of 1966, 16 U.S.C. §§668dd-668ee. |
||||||||||||||||||||||||||
| 24. |
| ||||||||||||||||||||||||||
| 25. |
16 U.S.C. §668dd(a)(2). |
||||||||||||||||||||||||||
| 26. | For information on FWS areas in FY2025, see DOI, FWS, Statistical Data Tables for Fish & Wildlife Service Lands (as of 9/30/25), https://www.fws.gov/media/statistical-data-tables-fish-wildlife-service-lands-9302025.
16 U.S.C. §668dd(a)(2). | ||||||||||||||||||||||||||
| 27. | On some FWS lands, there are preexisting property rights, particularly of subsurface resources | ||||||||||||||||||||||||||
| 28. | For additional information on FWS-managed lands, see CRS Report R48381, National Wildlife Refuge System (NWRS): Overview and Issues for Congress, by Eric P. Nardi.
| ||||||||||||||||||||||||||
| 29. | For additional information on the types of units within the National Park System, see CRS Report R41816, National Park System: What Do the Different Park Titles Signify?, by Laura B. Comay. As noted, DOD is "using a secondary Department of War designation," under Executive Order 14347 dated September 5, 2025. See National Security Act of 1947, Section 2, as amended, https://www.govinfo.gov/content/pkg/COMPS-1493/pdf/COMPS-1493.pdf. This provision is codified at 50 U.S.C. §3002. | ||||||||||||||||||||||||||
| 30. |
See CRS Report R41816, National Park System: What Do the Different Park Titles Signify?, by Laura B. Comay. |
||||||||||||||||||||||||||
| 31. |
Act of July 26, 1947; 50 U.S.C. §3001 et seq. (2012). |
||||||||||||||||||||||||||
| 32. |
| ||||||||||||||||||||||||||
| 33. |
Department of Defense Instruction 4715.03 of March 18, 2011, p. 2. |
||||||||||||||||||||||||||
| 34. | DOD, Office of the Deputy Assistant Secretary of Defense for Infrastructure, Base Structure Report, Fiscal Year 2025 Baseline (A Summary of the Real Property Inventory Data), as of September 30, 2024, https://www.acq.osd.mil/eie/imr/rpid/docs/Base-Structure-Report-FY25.xlsx. Also, the DOD managed an additional 171,524 acres in the U.S. territories and 19,921 acres overseas as of that date. USACE indicated to CRS that some (but not all) lands managed by USACE are reflected in the DOD estimate of 8.4 million acres in the United States. However, USACE was not able to readily provide the precise extent of the overlap. Personal communication between CRS and USACE, Future Directions Branch, Headquarters, January 22, 2025. DOD, DoD Instruction 4715.03, Natural Resources Management, July 22, 2024, change 1 effective September 9, 2025, https://www.esd.whs.mil/Portals/54/Documents/DD/issuances/dodi/471503p.pdf. GSA, "Real Property Disposition," https://www.gsa.gov/real-estate/real-property-disposition. For additional information about DOD's excess lands, see CRS Report R48547, Excess Military Infrastructure and the Base Realignment and Closure (BRAC) Process, by Andrew Tilghman. See, for example, Title 30 U.S.C. Chapter 7, Lease of Mineral Deposits within Acquired Lands. | ||||||||||||||||||||||||||
| 35. |
This includes 14 states and the District of Columbia. When referring to acreage figures in this report, states is often used to include the District of Columbia in addition to the 50 states. |
||||||||||||||||||||||||||
| 36. |
Other actions and factors contributed to the decline in BLM lands. For example, a reduction of about 1 million acres (primarily in the eastern states) resulted from a revision in the way the BLM reported acreage withdrawn or reserved for another federal agency or purpose. |
||||||||||||||||||||||||||
| 37. |
The 8.9 million figure used here includes lands worldwide, whereas the 8.8 million figure shown for 2018 elsewhere in this report reflects land in the United States only. |
||||||||||||||||||||||||||
| 38. |
Acreage figures are taken from the DOD FY2018 Baseline, pp. DOD-15 to DOD-16. That document indicates, on p. DOD-5, that total acreage figures include "government owned land, public land, public land withdrawn for military use, licensed and permitted land," and other types of arrangements. |
||||||||||||||||||||||||||
| 39. | In Focus IF11772, Payments in Lieu of Taxes (PILT): Section 6902 Payments, by Carol Hardy Vincent and Eric P. Nardi; and CRS Report R46260, The Payments in Lieu of Taxes (PILT) Program: An Overview, by Carol Hardy Vincent and Eric P. Nardi.
For example, legislation providing statehood to several western states conditioned that statehood on the states' agreement to disclaim "all right and title to the unappropriated public lands lying within" their territories, which remained under the control of the United States. E.g., 13 Stat. 30, §4, 38th Cong. (1864) (Nevada Enabling Act); 28 Stat. 107, §3, 53rd Cong. (1894) (Utah Enabling Act). Congress also has made various designations on federal lands, such as wilderness and national park. Other actions and factors contributed to the decline in BLM lands. For example, a reduction of about 1 million acres (primarily in the eastern states) resulted from a revision in the way the BLM reported acreage withdrawn or reserved for another federal agency or purpose. This figure is derived from the DOD, Office of the Deputy Assistant Secretary of Defense for Infrastructure, Base Structure Report, Fiscal Year 2025 Baseline (A Summary of the Real Property Inventory Data), as of September 30, 2024, https://www.acq.osd.mil/eie/imr/rpid/docs/Base-Structure-Report-FY25.xlsx. The 26.8 million acre figure used here includes lands worldwide, whereas the 8.8 million acre figure shown for FY2024 elsewhere in this report reflects land in the United States only. | ||||||||||||||||||||||||||
For instance, a decrease in BLM acreage and an increase in NPS acreage was the result of enactment of the California Desert Protection Act of 1994 (P.L. 103-433). Among other provisions, the law established one new national park unit and expanded two other park units on land that was owned by the BLM, and transferred ownership of the lands to the NPS. The BLM estimated the total transfer of BLM land to the NPS for the three areas at 2.9 million acres. | |||||||||||||||||||||||||||
| 41. | See DOI, BLM, "California Desert Protection Act Celebrates 15 Years," press release, October 30, 2009, https://www.blm.gov/press-release/california-desert-protection-act-celebrates-15-years.
| ||||||||||||||||||||||||||
| 42. |
Additional discussion of federal land management issues is contained in CRS Report R43429, Federal Lands and Related Resources: Overview and Selected Issues for the 116th Congress, coordinated by Katie Hoover. |
||||||||||||||||||||||||||
| 43. |
For illustrative perspectives supporting keeping lands in federal ownership, see Steven Davis, In Defense of Public Lands: The Case against Privatization and Transfer (Temple University Press, 2018); Sarah Bardeen, "America's Public Lands: A Bipartisan Political Success Story," Public Policy Institute of California, May 16, 2022, https://www.ppic.org/blog/americas-public-lands-a-bipartisan-political-success-story/; and Scott Lehmann, "Privatizing Public Lands: A Bad Idea," UC Law Environmental Journal, vol. 3, no. 2 (Winter 1996), pp. 231-245, https://repository.uclawsf.edu/cgi/viewcontent.cgi?article=1477&context=hastings_environmental_law_journal. For illustrative perspectives supporting removing lands from federal ownership, see Randal O'Toole, "Interior Department and Public Lands," CATO Institute, 2017, https://www.cato.org/cato-handbook-policymakers/cato-handbook-policy-makers-8th-edition-2017/51-interior-department-public-lands; and Paul M. Jakus et al., "Western Public Lands and the Fiscal Implications of a Transfer to States," Land Economics, vol. 93, no. 3 (August 2017), pp. 371-389. http://www.jstor.org/stable/26449071. | ||||||||||||||||||||||||||
See 10 U.S.C. §2663. | |||||||||||||||||||||||||||
For information on the Land and Water Conservation Fund, see CRS Report | |||||||||||||||||||||||||||
| 46. |
43 U.S.C. §1713. |
||||||||||||||||||||||||||
| 47. | For information on land acquisition by FWS, including through the Migratory Bird Conservation Fund, see CRS Report R48381, National Wildlife Refuge System (NWRS): Overview and Issues for Congress, by Eric P. Nardi, pp. 12-14. For FLPMA provisions on disposal, see 43 U.S.C. §1713. For provisions of the Recreation and Public Purposes Act, see 43 U.S.C. §§869 et seq. For an overview of BLM disposal requirements and processes, see CRS Report R48079, Land Disposal Authorities and Processes of the Bureau of Land Management, coordinated by Carol Hardy Vincent. | ||||||||||||||||||||||||||
| 48. | R48547, Excess Military Infrastructure and the Base Realignment and Closure (BRAC) Process, by Andrew Tilghman.
For additional information on, and examples of, congressional action on measures to acquire or dispose of land, or to establish or modify current acquisition and disposal authorities, see CRS Report RL34273, Federal Land Ownership: Acquisition and Disposal Authorities, coordinated by Carol Hardy Vincent, especially pp. 2-3. For information on these debates, see Paul W. Gates, "Public Land Issues in the United States," Western Historical Quarterly, vol. 2, no. 4, (October 1971), pp. 363-376; Char Miller, Public Lands, Public Debates: A Century of Controversy (Oregon State University Press, 2012); and Christopher A. Simon, et al., "Western Rebellion: Who Owns the West?" in The Environmental Politics and Policy of Western Public Lands, eds., Erika Allen Wolters and Brent S. Steel (Oregon State University Press, 2020), https://open.oregonstate.education/environmentalpolitics/chapter/western-rebellion/. | ||||||||||||||||||||||||||
| 49. |
For information and perspectives regarding how to balance acquiring new assets and maintaining current assets, see CRS Report RS20158, National Park System: Establishing New Units, by Laura B. Comay; Tate Watkins and Jack Smith, "The Future of the Great American Outdoors," PERC, December 16, 2020, https://perc.org/2020/12/16/the-future-of-the-great-american-outdoors/; and Michael Kellett, "A Modest Proposal: We Need More National Parks," Sierra: The Magazine of the Sierra Club, August 17, 2021, https://www.sierraclub.org/sierra/modest-proposal-we-need-more-national-parks. | ||||||||||||||||||||||||||
|
This information was provided to CRS by the DOI Budget Office on March 25, 2019. DOI estimates are based on DOI financial reports and may differ from figures reported by the agencies independently. As one example, DOI financial reports reflect agency-owned assets only, whereas figures reported by individual DOI agencies sometimes include other types of assets (e.g., leased assets). |
|||||||||||||||||||||||||||
| 51. |
FY1999 is the first year for which an estimate is readily available. |
||||||||||||||||||||||||||
| 52. |
This information was provided to CRS by the Forest Service, Office of Legislative Affairs, on February 12, 2019. |
||||||||||||||||||||||||||
| 53. |
This estimate of the deferred maintenance for roads reflects passenger-car roads only. |
||||||||||||||||||||||||||
| 54. |
This information was provided to CRS by the DOI Budget Office on March 25, 2019. |
||||||||||||||||||||||||||
| 55. |
For additional information, see CRS Report R42138, Border Security: Immigration Enforcement Between Ports of Entry, coordinated by Audrey Singer. |
||||||||||||||||||||||||||
| 56. |
The estimate of 621.5 linear miles was prepared by CRS. It excludes 71.9 miles of land managed by the Bureau of Indian Affairs, for a total of 693.4 miles of federal and Indian lands on the border. For additional information, see CRS In Focus IF10832, Federal and Indian Lands on the U.S.-Mexico Border, by Carol Hardy Vincent and James C. Uzel. |
||||||||||||||||||||||||||
| 57. |
See the map on the website of the House Committee on Natural Resources at https://republicans-naturalresources.house.gov/info/borderoverview.htm. |
||||||||||||||||||||||||||
| 58. |
For an overview of funding appropriated for border barrier constructions, see CRS Report R45888, DHS Border Barrier Funding, by William L. Painter and Audrey Singer. For a discussion of Department of Defense funding of border barrier construction see CRS Report R45937, Military Funding for Southwest Border Barriers, by Christopher T. Mann. |
||||||||||||||||||||||||||
| 59. |
U.S. Government Accountability Office, Border Security: Additional Actions Needed to Better Ensure a Coordinated Federal Response to Illegal Activity on Federal Lands, GAO-11-177, November 2010, p. 4. |
||||||||||||||||||||||||||
| 60. |
For example, in 2006, DOI, DHS, and USDA entered into a memorandum of understanding entitled Cooperative National Security and Counterterrorism Efforts on Federals Lands along the United States' Borders. These departments have entered into additional memoranda of understanding addressing issues such as "road maintenance, secure radio communication, environmental coordination, and sharing of geospatial information, among others." U.S. Congress, House Committee on Natural Resources, Subcommittee on Oversight and Investigations, The Consequences of Federal Land Management Along the U.S. Border to Rural Communities and National Security, testimony of U.S. Department of the Interior's Interagency Borderlands Coordinator, Jon Andrew, 114th Cong., 2nd sess., April 28, 2016. |
||||||||||||||||||||||||||
| 61. |
P.L. 91-190; 42 U.S.C. §§4321-4347. |
||||||||||||||||||||||||||
| 62. |
For more information on DHS compliance with NEPA, see https://www.dhs.gov/national-environmental-policy-act-nepa-department-homeland-security-implementing-procedures. The U.S. Border Patrol is a component within DHS's U.S. Customs and Border Protection (CBP). For more information on CBP's compliance with NEPA, see https://www.cbp.gov/about/environmental-management-sustainability/nepa. |
||||||||||||||||||||||||||
| 63. |
Illegal Immigration Reform and Immigrant Responsibility Act, P.L. 104-208, div. C, §102(a)-(c), as amended by the REAL ID Act of 2005, P.L. 109-13, div. B, §102; the Secure Fence Act of 2006, P.L. 109-367, §3; and the Consolidated Appropriations Act, 2008 P.L. 110-161, div. E, §564(a). See also CRS Report R43975, Barriers Along the U.S. Borders: Key Authorities and Requirements, by Michael John Garcia, which discusses DHS's border infrastructure deployment authority and identifies laws waived for several border construction projects. |
For information on public land health, see BLM, "Rangeland Heath," https://www.blm.gov/programs/natural-resources/rangelands-and-grazing/rangeland-health, accessed August 17, 2026; BLM, "A Critical Call to Restore Our Public Lands," November 2024, https://www.blm.gov/sites/default/files/docs/2024-11/Restoration%20Blueprint%20508_0.pdf; and Environmental Protection Agency, "Extent and Distribution: What Are the Trends in the Extent and Distribution of the Nation's Ecological Systems?, https://www.epa.gov/report-environment/extent-and-distribution, accessed August 17, 2026.
This definition is derived from the "FASAB Handbook of Federal Accounting Standards and Other Pronouncements, as Amended, as of June 30, 2025," available on the website of the Federal Accounting Standards Advisory Board at https://files.fasab.gov/pdffiles/2025_FASAB_Handbook.pdf.
For information on deferred maintenance on federal lands, including factors potentially impacting such deferred maintenance, see CRS Report R43997, Deferred Maintenance of Federal Land Management Agencies: FY2013-FY2022 Estimates and Issues, by Carol Hardy Vincent; CRS Report R48136, National Park Service Deferred Maintenance: Overview and Issues, by Laura B. Comay; CRS Insight IN12729, Legacy Restoration Fund for Deferred Maintenance: 119th Congress Reauthorization Bills, by Laura B. Comay and Carol Hardy Vincent; and Government Accountability Office, Deferred Maintenance: Agencies Generally Followed Leading Practices in Selections but Faced Challenges, GAO-24-106495, January 2024, https://www.gao.gov/assets/d24106495.pdf.
DOI, NPS, Budget Justifications and Performance Information, Fiscal Year 2027, pp. 179-180, https://www.doi.gov/sites/default/files/documents/2026-04/fy2027greenbooknps_0.pdf.
FY1999 is the first year for which an estimate is readily available.
USDA, Forest Service, Fiscal Year 2025, Quarter 2 Deferred Maintenance Needs, https://www.fs.usda.gov/sites/default/files/fy25-q2-deferred-maint-report.pdf.
This estimate of the deferred maintenance for roads reflects passenger-car roads.
DOI, BLM, Budget Justifications and Performance Information, Fiscal Year 2027, p. 114 (pdf), https://www.doi.gov/sites/default/files/documents/2026-04/fy2027greenbookblm0.pdf.
DOI, FWS, Budget Justifications and Performance Information, Fiscal Year 2027, p. 69, https://www.doi.gov/sites/default/files/documents/2026-04/fy2027greenbookfws_0.pdf.
DOI, Deferred Maintenance & Repair, "What is Deferred Maintenance and Repair?," https://www.doi.gov/deferred-maintenance-and-repair.
Factors potentially contributing to the overall increase in the deferred maintenance of federal land management agencies are discussed in CRS products including the following: CRS Report R43997, Deferred Maintenance of Federal Land Management Agencies: FY2013-FY2022 Estimates and Issues, by Carol Hardy Vincent and CRS Report R48136, National Park Service Deferred Maintenance: Overview and Issues, by Laura B. Comay.
For information on deferred maintenance funding under the Great American Outdoors Act, see CRS In Focus IF12888, The Great American Outdoors Act (GAOA): Frequently Asked Questions, by Carol Hardy Vincent and Laura B. Comay.
For a variety of perspectives on protection and use of federal lands, see, for example, The Nature Conservancy, "Protect Public Lands: Defend Our Natural Treasures," April 26, 2026, https://www.nature.org/en-us/about-us/who-we-are/how-we-work/policy/america-public-lands/; Gary D. Libecap, "The Land of Many Opportunity Costs," Cato Institute, Regulation, Fall 2018, https://www.cato.org/regulation/fall-2018/land-many-opportunity-costs; U.S. Department of Energy, "New Interagency Study Finds Further Expansion of Renewable Energy Production on Federal Lands Could Power Millions More American Homes by 2035," January 14, 2025, https://www.energy.gov/articles/new-interagency-study-finds-further-expansion-renewable-energy-production-federal-lands; Sarah Gibbens, "Activists Fear a New Threat to Biodiversity—Renewable Energy," National Geographic, May 22, 2022, https://www.nationalgeographic.com/environment/article/activists-fear-biodiversity-threat-from-renewable-energy; Dylan Soares, "Public Comment: Conservation Requires Better Wild Horse and Burro Management," PERC, July 9, 2026, https://perc.org/2026/07/09/public-comment-conservation-requires-better-wild-horse-and-burro-management/; and Sierra Club, "Wild Horse and Burro Policy," https://www.sierraclub.org/policy/wildlife/feral-animals.
CRS Report R47563, Tribal Co-management of Federal Lands: Overview and Selected Issues for Congress, by Mariel J. Murray; CRS Report R48093, Federal-Tribal Consultation: Background and Issues for Congress, coordinated by Mariel J. Murray; and CRS Report R48934, Introduction to Tribal Forestry, by Mariel J. Murray and Anne A. Riddle.
The estimate of 621.5 linear miles was prepared by CRS in 2018 based on a 2016 database. It excludes 71.9 miles of land managed by the Bureau of Indian Affairs, for a total of 693.4 miles of federal and Indian lands on the border. For additional information, see CRS In Focus IF10832, Federal and Indian Lands on the U.S.-Mexico Border, by Carol Hardy Vincent and James C. Uzel.
Executive Office of the President, Presidential Proclamation 10886 of January 20, 2025, "Declaring a National Emergency at the Southern Border of the United States," 90 Federal Register 8327, January 29, 2025.
For information on funding appropriated for border barrier constructions, see CRS Report R47979, DHS Border Barrier Funding Developments: FY2021-FY2024, by William L. Painter. For a discussion of military funding of border security measures, see CRS Legal Sidebar LSB11278, Diverting Military Construction Funds During a National Emergency: Legal Framework, by Jennifer K. Elsea.
U.S. Government Accountability Office, (GAO), Border Security: Additional Actions Needed to Better Ensure a Coordinated Federal Response to Illegal Activity on Federal Lands, GAO-11-177, November 2010, p. 4.
White House, "Military Mission for Sealing the Southern Border of the United States and Repelling Invasions," Presidential Memorandum/NSPM-4, April 11, 2025, https://www.whitehouse.gov/presidential-actions/2025/04/military-mission-for-sealing-the-southern-border-of-the-united-states-and-repelling-invasions/; and U.S. Northern Command, "DoW Support to U.S. Border Security, National Defense Areas," https://www.northcom.mil/BorderSecurity/#national-defense-areas.
For example, in 2006, DOI, DHS, and USDA entered into a memorandum of understanding entitled Cooperative National Security and Counterterrorism Efforts on Federals Lands Along the United States' Borders. These departments have entered into additional memoranda of understanding addressing issues such as "road maintenance, secure radio communication, environmental coordination, and sharing of geospatial information, among others." Testimony of Jon Andrew, Interagency Borderlands Coordinator, DOI, in U.S. Congress, House Committee on Natural Resources, Subcommittee on Oversight and Investigations, The Consequences of Federal Land Management Along the U.S. Border to Rural Communities and National Security, hearings, 114th Cong., 2nd sess., April 28, 2016.
GAO, Southwest Border: Additional Actions Needed to Address Cultural and Natural Resource Impacts from Barrier Construction, GAO-23-105443, September 2023, including pp. 22-30; and House Committee on Natural Resources (majority), Subcommittee on Federal Lands, Field Oversight Hearing on "Biden's Border Crisis: The Consequences of Failing to Secure Federal Border Lands," hearing memorandum, February 8, 2024, pp. 6-9, https://naturalresources.house.gov/uploadedfiles/hearing_memo_updated_--_sub_on_fl_ov_field_hrg_02.08.24.pdf.