Solar Energy: Frequently Asked Questions
Changes from January 27, 2020 to January 5, 2023
This page shows textual changes in the document between the two versions indicated in the dates above. Textual matter removed in the later version is indicated with red strikethrough and textual matter added in the later version is indicated with blue.
Contents
- How Does Solar Energy Work?
- Solar Photovoltaic (PV)
- Concentrating Solar Power
- How Much Electricity Comes From Solar Energy?
- How Much Does a Solar PV System Cost?
- How Does Solar Energy Impact Electricity Costs for Consumers?
- Comparing Electricity Costs
- Is Solar Energy Reliable?
- What Federal Tax Incentives Support Solar Energy Development?
- Tax Incentives for Businesses
- Tax Incentives for Individuals
- How Much Do Solar Tax Incentives Cost?
- What State Policies Support Solar Energy Development?
- How Are U.S. Tariffs Affecting Domestic Solar Manufacturing?
- What U.S. Jobs Are Supported by the Solar Industry?
- What Land Requirements Does Solar Energy Have?
- What Are Potential Impacts of Solar Energy Development on Agriculture?
Figures
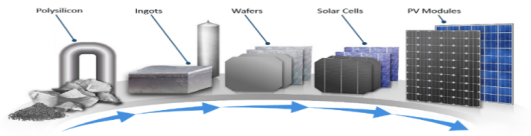
- Figure 1. Crystalline-Silicon Photovoltaic (PV) Manufacturing Process
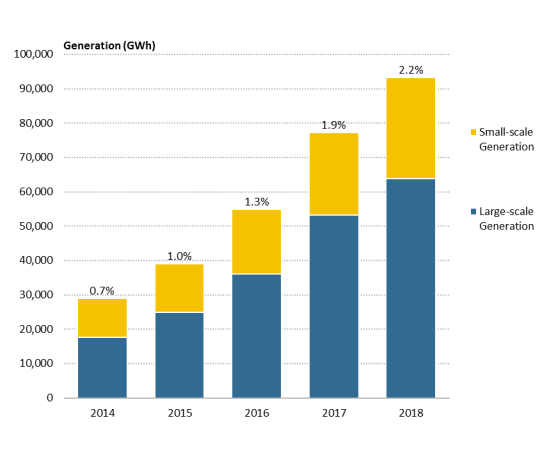
- Figure 2. U.S. Electricity Generation from Solar Energy, 2014-2018
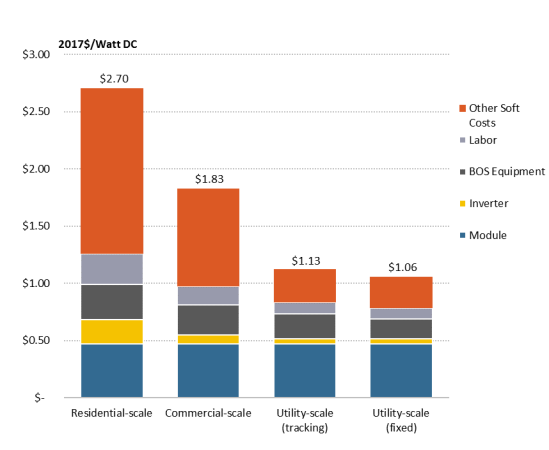
- Figure 3. Q1 2018 Average U.S. Solar PV System Costs
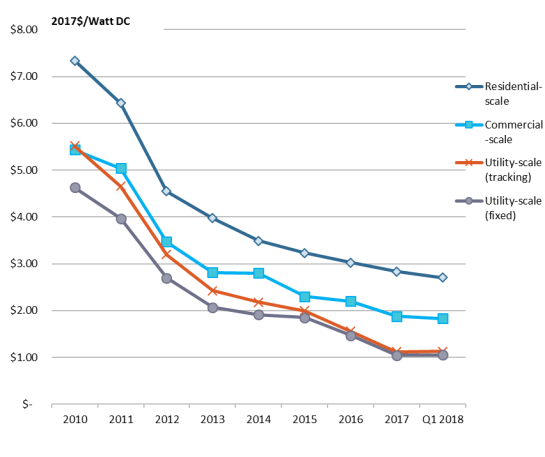
- Figure 4. Solar PV Total System Costs, 2010-Q1 2018
- Figure 5. U.S. Cell and Module Production
- Figure 6. Domestic Solar Industry Employment
Summary
Solar Energy: Frequently Asked Questions
January 5, 2023
Use of solar energy for electricity generation is growing in the United States and globally. In the United States, solar energy overall accounted for 2.23.9% of total electricity generation in 2018, up from 0.7% in 2014.
This report addresses a dozen frequently asked questions that may be of interest to lawmakers as the growing use of solar energy potentially affects a variety of areas of congressional interest. 2021,
Ashley J. Lawson,
compared to 0.7% in 2014.
Coordinator Analyst in Energy Policy
Overview and Cost Considerations
The first set of questions looks at different technologies that use solar energy to generate
Molly F. Sherlock
electricity and their costs and prevalence over time. Costs for all components of solar
Specialist in Public Finance
photovoltaic (PV) systems, —including cells, modules (also referred to as panels), inverters, and
other related equipment, —have generally declined in recent years. Assessing solar energy costs
Manpreet Singh
for consumers is challenging because there are many local factors to consider. Another question
Analyst in Industrial
considers whether using solar energy is a reliable form of electricity generation given its variable nature.
Organization and Business
nature.
Federal and State Policy Incentives
Morgan Smith Analyst in Energy Policy
The second set of questions discusses federal and state policies aimed at promoting deployment
of solar energy in the United States. At the federal level, tax incentives reduce the after-tax cost of investing in solar property, thereby encouraging taxpayers to invest in more solar property
Lisa S. Benson
than they would have absent tax incentives. Federal tax incentives include an investment tax
Analyst in Agricultural Policy
credit for businesses, eligibility for accelerated depreciation for businesses, and a residential
energy efficient property tax credit for individuals. At the state level, renewable portfolio standards (or, more broadly, electricity portfolio standards) require some electric utilities to
procure a specified amount of electricity from designated, eligible sources. Twenty-nineThirty states, three U.S. territories, and the District of Columbia are implementing electricity portfolio standards. All of these policies include solar energy as an eligible source. Utility-scale solar systems typically benefitbenefits from electricity portfolio standards, while commercial- and residential-scale systems typically benefit from a different state policy called net metering. Net metering allows individual electricity consumers to receive payment for the electricity produced by systems installed on their property (or, in some cases, systems not installed on their property but with which consumers have a contractual arrangement).
Domestic Manufacturing and Jobs Another set of questions considers the U.S. manufacturing base for solar products and U.S. tariffs, which have been applied over the years on imports of solar equipment. The results on the nation'’s solar manufacturing industry have been mixed. Different parts of the solar PV supply chain have responded differently to the tariffs. For some components, such as the assembly of solar modulespanels, domestic production has increased since the imposition of tariffs. By one count, about 20 factories assembled PV modules in the United States in 2018. For other components, such as solar cell production, tariffs have not had this effect. At present, there is one major domestic producer of crystalline-silicon solar cells; several producers of solar cells have closed U.S. plants since 2012. A related question discusses the number of U.S. jobs supported by the domestic solar industry, which employed more than 240,000 full-time equivalent workers in 2018. Of these positions, 64% involved two solar sectors, the installation of solar systems and project development.
. In 2020, the industry counted 231,574 jobs in the electricity generation sector (over two-thirds of which were in installation and development) and about 31,050 workers in the manufacturing sector.
Land and Agricultural Considerations The final questions address some potential environmental considerations associated with the use of solar energy, such as land use. Standard metrics for measuring land use impacts for different energy technologies do not exist. When considering total land area occupied, solar typically requires more land to produce the same amount of electricity than many other sources. Other aspects of land requirements affect comparisons among energy sources, including technology developments over time, land cover change, and time-to-recovery. Possiblethe time it takes land to revert to its previous condition after a solar energy system is decommissioned. Dual-use solar power, in which panels are installed in such a way that allows simultaneous use of the land for another purpose, is a potential solution to some land use concerns. Examples of dual-use solar power includes rooftop solar, aquavoltaics and floatovoltaics (solar panels associated with bodies of water), and agrivoltaics (solar panels associated with agricultural activities). Possible effects on agricultural production are also discussed. Some farmers view solar energy favorably as an income supplement, but others raise concerns about long-term damage to soil health and agricultural productivity.
Congressional Research Service
link to page 4 link to page 4 link to page 6 link to page 6 link to page 7 link to page 11 link to page 11 link to page 12 link to page 13 link to page 15 link to page 15 link to page 16 link to page 16 link to page 18 link to page 18 link to page 20 link to page 20 link to page 20 link to page 25 link to page 27 link to page 29 link to page 31 link to page 32 link to page 5 link to page 7 link to page 9 link to page 10 link to page 21 link to page 26 link to page 27 link to page 32 link to page 35 Solar Energy: Frequently Asked Questions
Contents
How Does Solar Energy Work? ....................................................................................................... 1
Solar Photovoltaic (PV) ............................................................................................................ 1 Concentrating Solar Power ....................................................................................................... 3
How Much Electricity Comes from Solar Energy? ......................................................................... 3 How Much Does a Solar PV System Cost? ..................................................................................... 4 How Does Solar Energy Impact Electricity Costs for Consumers? ................................................ 8
Utility-Scale Solar ..................................................................................................................... 8 Distributed Solar ....................................................................................................................... 9
Is Solar Energy Reliable? .............................................................................................................. 10 What Federal Tax Incentives Support Solar Energy Development? ............................................. 12
Solar Manufacturing ................................................................................................................ 12 Solar Deployment.................................................................................................................... 13
Tax Incentives for Businesses and Tax-Exempt Entities .................................................. 13 Tax Incentives for Individuals........................................................................................... 15
How Much Do Solar Tax Incentives Cost? ................................................................................... 15 What State Policies Support Solar Energy Development? ............................................................ 17 How Are Tariffs and Trade Restrictions Affecting Solar Imports and Domestic Solar
Manufacturing? .......................................................................................................................... 17
What U.S. Jobs Are Supported by the Solar Industry? .................................................................. 22 How Much Land Is Needed for Solar Energy? ............................................................................. 24 What Are the Potential Impacts of Solar Energy Development on Land? .................................... 26 What Is Dual-Use Solar Power? .................................................................................................... 28 What Are Potential Impacts of Solar Energy Development on Agriculture? ................................ 29
Figures Figure 1. Crystalline-Silicon Photovoltaic (PV) Manufacturing Process ........................................ 2 Figure 2. U.S. Electricity Generation from Solar Energy, 2014-2021............................................. 4 Figure 3. Q1 2022 Benchmark U.S. Solar PV System Costs .......................................................... 6 Figure 4. Solar PV System Costs by Size and Component, 2010-2020 .......................................... 7 Figure 5. Upstream CS PV Value Chain ........................................................................................ 18 Figure 6. U.S. Solar Employment Breakdown by Sector 2020 ..................................................... 23 Figure 7. Domestic PV Manufacturing.......................................................................................... 24 Figure 8. Diagram of a Floating Solar Photovoltaic System ......................................................... 29
Contacts Author Information ........................................................................................................................ 32
Congressional Research Service
link to page 5 Solar Energy: Frequently Asked Questions
productivity. Some researchers are investigating options for dual-use solar PV systems known as agrivoltaics, in which the same land could be used for simultaneous crop production and electricity generation.
How Does Solar Energy Work?1
How Does Solar Energy Work?1 The energy in sunlight can be converted into electricity in either of two ways: by using solar photovoltaic cells or by concentrating solar energy to produce heat for electricity generation. Solar energy can also be used to heat water for direct use, but this report focuses only on electricity generation applications.
2 Solar Photovoltaic (PV)
Sunlight can interact with certain materials to directly produce electricity in a process known as the photovoltaic (PV) effect. Silicon (more specifically, crystalline-silicon, or c-Si) is the most commonly used material today, but other materials (e.g., cadmium telluride) also can can also be used. Research is ongoing into alternative materials and designs that might be more efficient or less expensive than c-Si.2
3
To construct a PV cell to generate electricity, PV material is manufactured into ingots, which are then cut into wafers (Figure 1). Wafers are typically 15 centimeters (cm) wide along each side and around one-hundredth of a centimeter thick, although exact dimensions may vary by manufacturing process.34 Wafers are processed into cells, which are then assembled into modules, also called panels. A modulepanel typically consists of 60 to 72 cells mounted on a plastic backing within a frame. ModulesPanels are typically installed in groups, known as arrays, with the number of modulespanels in the array depending upon the available space and the desired generation capacity of the project.4
(i.e., panels).
A PV system includes modulespanels and a variety of structural and electronic components, known as balance of system (BOS) equipment, to tie the system together.56 Structural BOS equipment includes brackets, on which the modulespanels are mounted. For ground-mounted systems, these brackets can be either fixed or able to rotate during the day to face the sun. Mounting systems that can rotate are known as tracking systems. ModulesPanels mounted on tracking systems tend to generate more electricity than modulespanels on fixed-mount systems, all else being equal, because the tracking systems can optimize the amount of sunlight hitting the modulepanel over the course of a day.67 One key piece of BOS equipment is an inverter, an electronic device that converts the electricity generated by PV modulespanels into a form that is usable in the U.S. electric system. Other electronic BOS equipment includes charge controllers, circuit breakers, meters, and switch gear. Some PV systems also include integrated energy storage systems such as batteries.7
8
PV systems can be divided into three categories, based primarily on capacity.8
- 9
Utility-scale systems (i.e., solar farms) may range in capacity from a few
megawatts (MW) to a few hundred MW. They are typically owned and operated like other central power plants. Utility-scale projects are typically connected to the electricity transmission system (i.e., the network of high-voltage lines that move electricity over long distances
. - ).
Commercial-scale systems typically range in capacity from a few kilowatts (kW;
1,000 kW = 1 MW) to a few hundred kW. They may be installed on the ground or on rooftops, and are typically owned or hosted by commercial, industrial, or institutional entities. Some may be connected to the transmission system, and some may be connected to the electricity distribution system, the network of low-voltage lines that deliver electricity directly to most consumers.
Residential-scale6 Balance of system (BOS) equipment is sometimes called balance of plant (BOP) equipment. 7 Generally, tracking systems can be installed only on ground-mounted systems. In other words, rooftop systems do not typically include tracking systems. 8 For a discussion of energy storage systems, see CRS Report R45980, Electricity Storage: Applications, Issues, and Technologies, by Richard J. Campbell. 9 This report provides illustrative capacity thresholds because the industry does not have established capacity thresholds. For example, some analysis defines 1 MW as the minimum size for utility-scale projects, while other analysis uses 5 MW. Also, the industry has not reached consensus on whether capacity is the best metric for categorizing projects. This report uses capacity for consistency with the data shown throughout. Other analyses may define utility-scale projects based on agreements for how the electricity will be purchased (e.g., power purchase agreement versus net metering). Another option is to use total project cost as the defining characteristic. See Mark Bolinger and Joachim Seel, September 2018. Congressional Research Service 2 link to page 7 Solar Energy: Frequently Asked Questions Residential-scale systems typically have generation capacity of a few kW. Mostsystemstypically have generation capacity of a few kW. Mostresidential-scale projects are installed on rooftops and connected to the distribution system.
Another way to categorize PV systems is by ownership model. Systems connected to the transmission system (typically utility-scale) are generally owned by utilities or independent power producers, as is the case for other central power plants. Smaller systems may use other ownership models, depending on what applicable state laws allow.
- Customer-owned systems are owned directly by the electricity consumer benefiting from the system. The consumer might buy the system outright or finance it in the same way as for other property improvements (e.g., loan).
-
Third-party ownership (i.e., solar leasing) is an ownership model in which an
electric consumer, such as a homeowner, allows a company to build a solar system on the consumer
'’s property. The company owns and maintains the solar system while the consumer uses the electricity produced by the system. The consumer pays back the cost of the system to the company through either lease payments or a power purchase agreement. -
Community solar (i.e., solar gardens) is an ownership model in which multiple
electricity consumers may purchase or lease shares of a solar system through a subscription. Subscribers can benefit from the project by receiving electricity, financial payments, or both. Community solar systems are usually not installed on a subscriber
'’s property, and the systems may be owned by a utility or another type of entity.
Concentrating Solar Power
Concentrating solar power (CSP) technologies collect and concentrate energy from sunlight to heat certain fluids (liquids or gases). CSP plants use these heated fluids to produce electricity, either by creating steam to drive a steam turbine or by directly running a generator. CSP plants can be designed with thermal energy storage systems.9, which allow the plant to produce electricity when the sun is not shining.10 At least one CSP plant with storage operating in the United States is capable of generating electricity 24 hours a day.10
11 Most U.S. and international solar energy development focuses on PV technology.
How Much Electricity Comes Fromfrom Solar Energy?11
12 Electricity generation from solar energy has grown in recent years, as shown inin Figure 2. Solar energy overall (PV and CSP combined) accounted for 0.7% of total U.S. electricity generation in 2014 and 2.22014, rising to 3.9% of the total in 20182021, according to data from the U.S. Energy Information Administration (EIA).1213 Most generation (9698% in 20182021) from solar energy comes from PV 10 For an overview, see DOE, Concentrating Solar Power Thermal Storage System Basics, August 21, 2013. 11 One example is reported in Thomas W. Overton, “Top Plant: Crescent Dunes Solar Energy Project, Tonopah, Nevada,” Power Magazine, December 1, 2016, https://www.powermag.com/crescent-dunes-solar-energy-project-tonopah-nevada-2/.
12 Ashley Lawson, Analyst in Energy Policy, was the author of this section. 13 CRS analysis of data from EIA, “Electricity Data Browser,” accessed July 11, 2022, https://www.eia.gov/electricity/data/browser/. EIA began collecting data on generation from small-scale solar PV sources, defined by EIA as installations with capacity less than 1 MW, in 2014. The EIA statistics reported in this report include solar sources above and below this threshold.
Congressional Research Service
3
link to page 9
Solar Energy: Frequently Asked Questions
) from solar energy comes from PV systems. Large-scale systems, defined by EIA as those greater than 1 MW, accounted for 61% of overall generation from solar energy in 2014, the first year for which EIA reported generation data for different size categories. By 20182021, the share from large-scale systems had increased to 68%.
How Much Does a Solar PV System Cost?13
14 Costs for solar PV systems vary by size, as shown in Figure 3. The figure shows an estimate of average cost of installing a average U.S. solar PV system costs per unit of capacity, as of the first quarter of 2018 (Q1 20182022 (Q1 2022), based on an analysis by the Department of Energy'’s National Renewable Energy Laboratory (NREL). Costs for any individual project could differ based on project-specific circumstances. NREL’s estimated costs are not the price customers pay for systems (i.e., the 14 Ashley Lawson, Analyst in Energy Policy, was the author of this section.
Congressional Research Service
4
link to page 9 Solar Energy: Frequently Asked Questions
estimates do not account for tax credits, other incentives, or financing costs). circumstances. Two general findings from NREL'’s analysis are supported by numerous other studies, namely that larger projects tend to be cheaper on a per-unit basis, and that costs for projects of all sizes have declined in recent years.
Utility-scale systems have the lowest per-unit costs, ranging from an average of $1.06at $0.99 per watt of direct current (hereinafter, W) to $1.13/W in 2018, depending on whether projects were mounted on fixed brackets or tracking systems, respectively.14 Commercial-scale systems cost $1.83/W on average in Q1 2018, and residential-scale systems cost $2.70/W on average. The total system cost differences shown inin Q1 2022.15 Benchmark commercial-scale systems cost $1.84/W or $1.94/W in Q1 2022, depending on if they were installed on commercial rooftops or the ground, respectively. Benchmark residential-scale systems cost $2.95/W in Q1 2022. Adding storage increased the per-unit costs for systems of all sizes. The total system cost differences shown in Figure 3 are driven primarily by higher "“soft costs."” These costs include, for example, costs associated with permitting, interconnecting with the grid, and installer overhead costs. The soft costs are much higher for smaller-scale systems, per watt, than for utility-scale systems.
|
 |
Source: Vignesh Ramasamy et al., U.S. Solar Photovoltaic System and Energy Storage Cost Benchmarks, with Minimum Sustainable Price Analysis: Q1 2022, NREL, September 2022. Notes: DC = direct current; BOS = balance of system; 2021$ = 2021 dol ars. Labels show total system costs. Costs are for solar PV systems without energy storage. Prices that customers pay for systems may be different than estimated costs, especial y if tax credits or other policy incentives are available.
PV system costs declined from 2010 to 2020, as shown by data from a 2021 NREL analysis of systems of different size and components (Figure 4).
Congressional Research Service
6
Solar Energy: Frequently Asked Questions
Figure 4. Solar PV System Costs by Size and Component, 2010-2020
2019$ per Watt DC
Source: NREL, “Documenting a Decade of Cost Declines for PV Systems,” February 2021. Notes: DC = direct current; 2019$ = 2019 dol ars. PII = permitting, inspection, and interconnection; BOS = balance of system. Prices that customers pay for systems may be different than estimated costs, especial y if tax credits or other policy incentives are available. NREL changed its modeling approach before its analysis of calendar year 2020 data. The dark blue bars indicate how this methodological change affected cost estimates.
Congressional Research Service
7
link to page 10 link to page 9 link to page 13 Solar Energy: Frequently Asked Questions
|
PV system costs have declined, as shown by data from the NREL analysis shown in Figure 4. NREL reported costs from 2010 to Q1 2018. NREL credits cost declines over this time period to cost declines in all system components (i.e., modules, inverters, BOS equipment, labor, and other soft costs).15
PV module costs increased between 2017 and 2018 as a result of tariffs discussed in the section "How Are U.S. Tariffs Affecting Domestic Solar Manufacturing?," offsetting cost declines in other system components, according to the NREL report.
How Does Solar Energy Impact Electricity Costs for Consumers?16 Utility-scale solar and distributed solar (commercial or residential) have different cost impacts for consumers. At a high level, utility-scale cost impacts can be considered in the same way as other power plants and affect all consumers within a utility service territory equally. In contrast, distributed solar cost impacts are more similar to energy efficiency improvements in that they primarily affect costs for the consumer using the distributed solar resource.17
Utility-Scale Solar In parts of the country, new utility-scale solar PV systems are among the least-cost Consumers?16
Generalizing the cost impacts to consumers for solar systems is challenging because costs for these systems vary across the United States. Additionally, solar system costs are declining in both absolute terms (as discussed in the previous section) and relative to other sources of electric power. In parts of the country, new solar systems are sometimes among the least cost-options for generating electricity.18 This was not generally the case a few years ago but has been driven by the cost declines for solar shown in Figure 4.
One way to compare costs for different power plants is the levelized cost of electricity (LCOE, also called levelized cost of energy). LCOE is a measure of the cost of generating electricity from a given type of power plant over its lifetime. It can also be thought of as the amount of revenue a power plant would require to fully cover its costs. LCOE estimates attempt an “apples-to-apples” comparison among generation options, typically accounting for all construction and installation costs (such as those shown in Figure 3), plus operation, maintenance, and fuel costs over the lifetime of power plants. LCOE estimates may include financing costs as well. They typically account for the amount of electricity power plants are expected to generate over their lifetimes. LCOE estimates are normalized per unit of electricity (e.g., dollars per megawatt-hour) and expressed in net present value terms. LCOE estimates do not reflect all costs associated with building new power plants. In particular, indirect costs are not included in LCOE. Indirect costs might include transmission system expansions or network upgrades that might be required to bring new power plants online. Additionally, LCOE estimates do not include operational constraints such as reliability requirements that may be especially important considerations for solar, given its unique nature (see additional discussion in “Is Solar Energy Reliable?”). LCOE estimates sometimes include the effect of tax credits or other policy incentives.
Several organizations estimate LCOE. One commonly cited estimate is from the energy firm Lazard. As of 2021, Lazard estimates that new U.S. utility-scale solar has LCOE ranging from $28 to $41 per MWh (before accounting for tax credits).19 For comparison, Lazard estimates the next lowest-cost LCOE for new power plants is for land-based wind, ranging from $26/MWh to
16 Ashley Lawson, Analyst in Energy Policy, was the author of this section. 17 As is also true for energy efficiency, some community-level cost impacts (increase or decreases) could occur when an individual consumer adds distributed solar generation. These impacts are negligible at low levels of solar penetration but can be meaningful when high levels of distributed solar generation are developed in an area. Additional discussion of these potential cost impacts is available in CRS Report R46010, Net Metering: In Brief, by Ashley J. Lawson.
18 The costs for developing utility-scale solar vary across the country depending upon solar resource quality, land and labor costs, and other factors. State policies can also influence costs as well. For example, state renewable portfolio standards (discussed in this report) can effectively lower the cost of developing solar by providing policy certainty and an additional revenue stream to utility-scale projects. On the other hand, state or local permitting or siting restrictions can create hurdles to project development, effectively increasing costs. For example, multiple counties in Ohio have banned most utility-scale solar (and wind) energy development under authority of a state law passed in 2021. John Fitzgerald Weaver, “Ten Ohio Counties Have Banned Large Scale Wind and Solar,” PV Magazine, August 24, 2022. 19 Lazard, Lazard’s Levelized Cost of Energy Analysis, Version 15.0, October 2021.
Congressional Research Service
8
Solar Energy: Frequently Asked Questions
$50/MWh. Lazard estimates that the lower end of the range for solar (and wind) is less expensive than generating electricity from existing nuclear ($29/MWh) or coal ($42/MWh) power plants.
All else being equal, generation from power plants with lower LCOE should lead to lower electricity prices. For solar, LCOE estimates suggest that an increased use of solar energy would lower electricity prices because of solar’s lower LCOE.20 This has been observed for wholesale electricity prices, though the effect is modest under current deployment rates. Wholesale electricity prices have declined in recent years but largely because of lower U.S. natural gas prices.21 In states with carbon pricing policies in place, solar energy development could reduce the potential for cost increases arising from the carbon price.22
The downward pressure that utility-scale solar energy puts on electricity prices has a limit. At some level of solar penetration (5% or so, based on observations in California), adding more solar has a diminishing effect on electricity prices.23 This is largely because solar panels produce energy when the sun is shining, which is not necessarily when more electricity generation is needed. An area with a relatively high penetration of solar might have excess generation during mid-day, and adding more solar capacity would not change electricity supply or demand (or prices) then. The electricity grid sometimes needs upgrades or expansions to access utility-scale solar, which can potentially put upward pressure on electricity prices.
Distributed Solar What consumers pay for electricity is influenced by the rate they pay—that is, how many cents per kilowatt-hour (kWh) of usage—and how much they use. Utility-scale solar can affect electricity rates, while distributed solar primarily affects how much electricity consumers buy from the grid.
Distributed solar can be installed at the point of use, namely a home, business, or other building. In these cases, the onsite solar panels generate electricity that is used in the building, reducing the need to buy electricity from the local utility. Some consumers may be eligible for net metering arrangements with their utilities, which compensate them for any excess electricity their panels produce (i.e., electricity the customers do not use themselves).24 Net metering compensation reduces bills above and beyond the effect of buying less electricity.
Community solar (sometimes called solar gardens) is another form of distributed solar. The U.S. Department of Energy (DOE) defines community solar as “any solar project or purchasing program, within a geographic area, in which the benefits of a solar project flow to multiple 20 Policy incentives, such as federal tax credits, can lower utilities’ costs for procuring electricity from solar PV systems beyond what is reflecting in the LCOE estimates provided in this report. Policy incentives may have the effect of making solar energy a more attractive investment option beyond what favorable LCOE comparisons would suggest.
21 Researchers at Lawrence Berkeley National Lab estimated that wind and solar contributed less than $3/MWh to the observed decline in electricity prices between 2008 and 2017, compared to $7-$53/MWh contributed by natural gas. Andrew D. Mills et al., “The Impact of Wind, Solar, and Other Factors on the Decline in Wholesale Power Prices in the United States,” Applied Energy, vol. 238 (February 1, 2021), p. 116266. 22 As of the cover date of this report, carbon pricing policies are in effect in California and in the states participating in the Regional Greenhouse Gas Initiative (RGGI), a cap-and-trade program that covers carbon dioxide emissions from electric power. The number of RGGI states has changed in recent years. For more details on the RGGI program and its participating states, see https://www.rggi.org/. In addition, Washington State established cap-and-trade program that is scheduled to start in 2023 (https://ecology.wa.gov/Air-Climate/Climate-Commitment-Act/Cap-and-invest).
23 Andrew D. Mills et al., Solar-to-Grid: Trends in System Impacts, Reliability, and Market Value in the United States with Data Through 2019, Lawrence Berkeley National Lab, February 2021.
24 For an overview of net metering policies, see CRS Report R46010, Net Metering: In Brief, by Ashley J. Lawson.
Congressional Research Service
9
Solar Energy: Frequently Asked Questions
customers such as individuals, businesses, nonprofits, and other groups.”25 Typically, a consumer can subscribe to a community solar project (through upfront payments or ongoing subscription fees) for a share of the project’s output. The local utility lowers the consumer’s bill based upon the amount of electricity generated and the consumer’s share of the project. Community solar projects are not necessarily installed at the point of use, making them an option for the estimated 49% of households that do not live in buildings suitable for rooftop solar.26 In general, state laws set community solar rules, and not all states allow them.27 As of the end of 2020, about 72% of community solar capacity was installed in four states: Minnesota, Florida, Massachusetts, and New York.28 The Biden Administration set a goal of expanding community solar capacity from 3 gigawatts (GW) in 2020 to 20 GW in 2025.29
Like utility-scale solar, grid upgrades are sometimes required to support new distributed solar installations. In many cases, individual consumers may be required to pay for any upgrades, and those added costs can discourage development. Some states are exploring options to address these situations.30
This was not generally the case a few years ago.
Policies aimed at promoting solar energy make an assessment of costs more complex. For example, tax incentives, as discussed in the section "What Federal Tax Incentives Support Solar Energy Development?," can reduce the ownership costs for businesses or individuals that purchase solar energy systems. Some of those costs are then transferred to taxpayers. The following discussion focuses on electricity costs only from a consumer's point of view.
Consumers' electricity costs can be measured in two ways. The first way is the electricity rate, typically expressed in cents per kilowatt-hour (cents/kWh). The second way is the electricity bill, typically the total costs for electricity that consumers pay each month expressed in dollars. In most cases, an electricity bill reflects the costs to produce electricity (typically, the applicable electricity rate times the amount of electricity consumed), the costs to deliver electricity to the consumer, and any other fees as determined by state or local regulators (e.g., contributions to funds that provide bill relief to low-income households). Electricity rates can go down while bills go up, and vice versa.
Multiple factors can determine how solar energy might affect what consumers pay for electricity. Many of these factors vary based on local circumstances. They can also change over time as the profile of electricity sources changes.
Comparing Electricity Costs
One way to compare electricity costs is by estimating the lifetime costs of energy systems. Lifetime costs include the initial construction and installation cost plus operation and maintenance (O&M) costs, fuel costs, and other costs. Electricity rates are strongly influenced by total lifetime costs for all the electricity generators serving a given area. Lifetime costs for solar energy have historically been higher than for many other sources, but that is changing in many parts of the United States.17 For example, one commonly used measure of lifetime costs is the levelized cost of electricity (LCOE), usually expressed in dollars per megawatt-hour of generation ($/MWh) and averaged over the lifetime of a project. LCOE estimates attempt "apples-to-apples" comparisons among technologies because the estimates account for how much electricity a given power plant is expected to produce over its lifetime.18 According to widely cited estimates from one consulting firm, 2019 LCOE for new utility-scale solar systems ranged from $32/MWh to $42/MWh. By comparison, LCOE for new wind generation was $28/MWh-$54/MWh and for natural gas combined cycle generation was $44/MWh-$68/MWh.19
Another factor in consumers' bills is the extent to which electricity from solar energy displaces electricity generation from existing sources. If existing power plants are called upon to produce less electricity than planned when they were first built due to the availability of power from less expensive sources, the owners still need to pay the construction cost of their unneeded capacity. Such costs are known as stranded costs. Depending on each state's regulatory framework, stranded costs might be borne by power plant owners or be passed through to consumers in electric bills.
To the extent that solar systems require new transmission lines to deliver electricity to consumers, the cost of building those lines may result in higher electricity bills. Utility-scale solar, which is frequently located in rural areas distant from consumers, may have higher associated cost impacts on bills than, for example, residential-scale solar, depending upon project details. On the other hand, installation of solar systems can sometimes avoid upgrades to transmission systems, resulting in potentially lower costs for consumers. In other cases, though, solar systems necessitate upgrades to local distribution systems, which might increase costs for customers. In states with carbon pricing policies in place, increased solar energy deployment could reduce the bill impacts associated with the carbon price.
Generating solar energy has approximately zero marginal cost. Marginal costs reflect the variable costs of producing incremental amounts of electricity from an existing source. Marginal costs are typically dominated by fuel costs, which are not relevant for solar energy. When solar energy is present in an area, fewer fuel-consuming electricity sources are required, which tends to drive down marginal costs for the regional electricity system overall. This effect may diminish as the number of solar electricity generators increases in an area, because nearby solar PV systems tend to maximize their electricity production at the same time (usually midday). If all of the midday electricity demand were to be met by solar PV, there would no incremental cost benefit to adding more solar PV systems to the region.20
The rate and bill impacts discussed above would apply to all electricity consumers within a region in which solar energy development is taking place. Consumers that install rooftop solar systems or participate in community solar projects ("solar customers") could have different bill impacts. Most states allow solar customers to be financially compensated for the electricity generated by the projects they host. The most common type of policy for this compensation is net metering, though some states have established net metering alternatives. Depending on a consumer's electricity demand and the size of the solar energy project, solar consumers participating in net metering or related policies could reduce their electricity bills to zero.21
Is Solar Energy Reliable?22
Is Solar Energy Reliable?31 One potential reliability concern for solar energy is due to its variable nature, dependent on the availability of sunlight.2332 For example, solar PV systems cannot produce electricity at night, and their output can vary during the day depending on local weather conditions (e.g., cloudiness). The physical requirements of the electricity system are such that the supply and demand of electricity must equal each other at all times. Currently, to ensure reliability, other sources of electricity generation are used when solar energy is not available. Expanding other types of electricity system infrastructure, such as transmission lines or energy storage assets, could also address this limitationlimitation and expand the use of solar energy into less sunny times of day. Alternatively, policies and regulatory frameworks that incent greater electricity consumption during daytime hours and less at night (i.e., load shifting) could reduce the reliability impact ofhelp address solar energy'’s variability.
Another potential reliability concern for solar energy arises from the mismatch between the hours of the day when generation from solar energy peaks (typically midday) and when electricity
25 DOE, “Community Solar Basics,” accessed September 15, 2022. 26 Residential buildings are considered unsuitable for solar if they (1) are rented, (2) are at least four stories tall, or (3) have roofs too small for a 1.5 kilowatt PV system. David Feldman et al., Shared Solar: Current Landscape, Market Potenial, and the Impact of Federal Securities Regulation, NREL, April 2015.
27 As of February 2021, 23 states and the District of Columbia had adopted community solar policies, and three additional states had adopted policies providing community solar as an option. DSIRE Insight, “Community Solar Policy Update: States Exploring Low-Income Access and New Program Models,” February 25, 2021. Even in states without community solar policies, publicly owned utilities (which are generally self-regulated and not subject to state jurisdiction) may implement community solar programs.
28 Jenny Heeter, Kaifeng Xu, and Gabriel Chan, Sharing the Sun: Community Solar Deployment, Subscription Savings, and Energy Burden Reduction, NREL, July 2021.
29 DOE, “About the National Community Solar Partnership,” accessed September 15, 2021, https://www.energy.gov/communitysolar/about-national-community-solar-partnership.
30 For a discussion of grid upgrade costs and state responses, see Erica McConnell and Laura Beaton, Sharing the Burden and the Benefits: The Quandary of Allocation DER Interconnection Costs, Interstate Renewable Energy Council, December 20, 2017.
31 Ashley Lawson, Analyst in Energy Policy, was the author of this section. 32 For further discussion see CRS In Focus IF11257, Variable Renewable Energy: An Introduction, by Ashley J. Lawson.
Congressional Research Service
10
Solar Energy: Frequently Asked Questions
of the day when generation from solar energy peaks (typically midday) and when electricity demand peaks (typically several hours later). To maintain reliability, some sources of electricity have to quickly increase their output to account for the simultaneous drop-off in output from solar generators and increase in demand. As more solar systems are installed, the need for other sources that can quickly change output levels typically increases. This situation is often referred to as the "“duck curve"” because the shape of the plot showing the difference between demand and output from solar generators resembles a duck.2433 Not all electricity generators are capable of quickly changing their output, and their deployment may not match the levels of deployment of solar generators. Load shifting, operational changes to non-solar sources, and deployment of more flexible resources (e.g., energy storage) are all possible ways to address the duck curve. Some analysis suggests that electric vehicle deployment might also act as a form of load shifting and address the duck curve, at least if vehicle charging occurs when output from solar sources is high.25
34
A third potential reliability concern comes from the fact that solar PV produces direct current (DC) electricity. Conventional generators produce alternating current (AC) electricity, and the grid is optimized for AC. An inverter is an electrical device that converts DC to AC; grid-connected solar PV systems require an inverter. For this reason, solar is sometimes referred to as an "“inverter-based resource."26”35 Generators that produce AC also inherently contribute to grid reliability by providing what are known as "“essential reliability services"” or "“ancillary services."27 ”36 Most of these services arise from the way generators physically respond to changes in the balance of electricity supply and demand over fractions of seconds. Inverter-based resources do not inherently provide these services, although inverters can be designed (and are being deployed) to provide some of these services.
The electric power industry and its federal and state regulators have been studying ways to protect system reliability from the unique nature of inverter-based resources since at least 2008. Additionally, Congress has funded a variety of research programs related to electric reliability.28 37 No widespread reliability issues due to solar appear to have occurred to date, though some local reliability issues have been reported.29
38
33 This mismatch and potential reliability concern have been recognized since at least 2008, but the term “duck curve” was popularized by a 2013 analysis by the California Independent System Operator (CAISO). NREL, Ten Years of Analyzing the Duck Chart, February 26, 2018.
34 Julia Pyper, “Electric Ridesharing Benefits the Grid, and EVgo Has the Data to Prove It,” Greentech Media, May 9, 2019, https://www.greentechmedia.com/articles/read/electric-ridesharing-benefit-the-grid-evgo.
35 Batteries and wind turbines are also inverter-based resources. Wind turbines do produce AC, but the quality is insufficient for the grid, so electricity from wind turbines is typically first converted to DC, then converted back to AC and delivered to the grid.
36 Essential reliability services include inertia, frequency response, and voltage control. For more information about these services, and the physical factors underlying them, see Federal Energy Regulatory Commission, Reliability Primer, 2016.
37 Some examples are provided in CRS Report R45764, Maintaining Electric Reliability with Wind and Solar Sources: Background and Issues for Congress, by Ashley J. Lawson.
38 For example, in 2016, a solar farm in Southern California stopped production after a wildfire caused a disturbance at another part of the electricity transmission system. Analysis of the event showed that the inverter’s design was responsible for the loss of power. Changes made since the event are meant to prevent similar occurrences in the future, but the event highlights how system operators are still evolving in their approach to maintaining reliability as solar energy is deployed to a larger extent. See North American Electric Reliability Corporation, 1,200 MW Fault Induced Solar Photovoltaic Resource Interruption Disturbance Report, June 2017.
Congressional Research Service
11
Solar Energy: Frequently Asked Questions
What Federal Tax Incentives Support Solar Energy Development?30
39 Various provisions in the Internal Revenue Code (IRC) support investment in solar energy equipment. These provisions reduce the after-tax cost of investing in solar property, thereby encouraging taxpayers to invest in more solar property than they would have absent tax incentives. Tax incentives for solar energy property were first enacted in 1978. Several incentives for solar are currently part of the tax code.31 Historically, the value of tax incentives for solar has fluctuated, although the current tax credit rates were established in 2005.32 Under current law, solar tax incentives are scheduled to phase down in the coming years from their 2019 rates.
Tax Incentives for Businesses
. P.L. 117-169, commonly referred to as the Inflation Reduction Act of 2022 (IRA), modified, expanded, and extended existing tax provisions supporting solar investment and deployment.40 The IRA provided additional funding for solar manufacturing tax credits while also creating a new tax credit for solar component manufacturing. Tax credits for solar manufacturing are broadly intended to increase the availability of domestically made components.41 Domestic manufacturing as a policy objective is also supported by domestic content elements in tax incentives supporting deployment.
Solar Manufacturing The IRA included two tax provisions designed to support solar (and other forms of energy) manufacturing. First, the IRA provided $10 billion in advanced energy manufacturing tax credit allocations under IRC Section 48C. The Internal Revenue Service (IRS) is to establish a program to allocate these credits.42 The IRS previously allocated $2.3 billion in advanced energy manufacturing tax credits that were provided in the American Recovery and Reinvestment Act of 2009 (P.L. 111-5). Many of the earlier advanced energy manufacturing tax credits were allocated for solar-related activities, including solar PV components and materials, CSP technologies, and related equipment such as inverters.43
Taxpayers can request tax credit allocation under the IRA for investments in projects that reequip, expand, or establish certain advanced energy manufacturing facilities.44 This includes manufacturing facilities designed to generate energy from the sun, as well as electric grid modernization equipment and components to support the transmission of intermittent sources of renewable energy.45 The base rate for the credit allocated under the IRA is 6%, with a 30% credit rate allowed for projects that pay prevailing wages and meet registered apprenticeship requirements. Of the $10 billion for allocations provided in the IRA, at least $4 billion are to be
39 Molly F. Sherlock, Specialist in Public Finance, was the author of this section. 40 Tax incentives for solar energy property were first enacted in 1978. Subsequently, tax incentives for solar have been extended and modified, most recently in the IRA. For a legislative history of the solar investment tax credit, see CRS In Focus IF10479, The Energy Credit or Energy Investment Tax Credit (ITC), by Molly F. Sherlock. For a legislative history of the tax credit for individuals purchasing residential solar, see Appendix B in CRS Report R42089, Residential Energy Tax Credits: Overview and Analysis, by Margot L. Crandall-Hollick and Molly F. Sherlock.
41 Marie Sapirie, “Powering Up Advanced Manufacturing,” Tax Notes Federal, September 26, 2022, pp. 1967-1969. 42 The IRS is directed to establish a program to certify projects and allocate credits by February 12, 2023. 43 Taxpayers receiving allocations were publicly disclosed. Recipients of first round allocations were disclosed in January 2010. See The White House, “Fact Sheet: $2.3 Billion in New Clean Energy Manufacturing Tax Credits,” press release, January 8, 2010, https://obamawhitehouse.archives.gov/the-press-office/fact-sheet-23-billion-new-clean-energy-manufacturing-tax-credits.
44 Tax-exempt organizations, including state and local governments and electric cooperatives, may be able to receive credit amounts as direct payments.
45 Selection criteria for projects are to include commercial viability; potential for domestic job creation; impact on air pollution or greenhouse gas emissions; potential for technological innovation and commercial deployment; levelized cost for energy generation, storage, or conservation; and the project’s expected time frame. Applicants accepting certifications for credits will have two years to provide evidence that the requirements of the certification have been met and to place property in service.
Congressional Research Service
12
link to page 5 Solar Energy: Frequently Asked Questions
allocated to projects in energy communities and not located in census tracts in which projects having received prior allocations under Section 48C are located.46
The second provision is a new tax credit for solar component manufacturing.47 Beginning in 2023 and through 2032, taxpayers may be able to claim tax credits for the production and sale of qualifying solar components.48 The amount of the credit is generally determined based on the particular component produced. (See Figure 1 for an overview of the solar manufacturing process.) Credit amounts for solar components are (1) for a thin-film PV cell or crystalline PV cell, 4 cents per direct current watt of capacity; (2) for PV wafers, $12 per square meter; (3) for solar grade polysilicon, $3 per kilogram; (4) for polymeric backsheet, 40 cents per square meter; and (5) for solar modules (i.e., panels), 7 cents per direct current watt of capacity.
Solar Deployment
Tax Incentives for Businesses and Tax-Exempt Entities
Tax incentives for some energy sources, including solar, were expanded and extended in the IRA.49 Investments in certain renewable energy property, including solar, qualify for an investment tax credit (ITC).3350 The amount of the credit is determined as a percentage of the taxpayer'taxpayer’s basis in eligible property. (Generally (generally, the basis is the cost of acquiring or constructing eligible property). The credit rate for solar was 30% through 2019, 26% in 2020 and 22% in 2021. Solar energy has a permanent 10% ITC that is to go into effect in 2022. The expiration dates for the ITC are commence construction deadlines.34 For example, solar property that was under construction by the end of 2019 may qualify for the 30% tax credit, even if the property is not placed in service (or ready for use) until a later date.
Special provisions in the tax code allow solar energy property to be depreciated over a shorter period of time than would normally be the case.35 Specifically, solar energy property is classified as five-year property in the Modified Accelerated Cost Recovery System (MACRS).36 The depreciable basis (the amount that is recovered through depreciation deductions over time) of solar energy property is reduced by 50% of any ITC claimed. Thus, if a 30% ITC was claimed on a $1 million investment in solar energy property, $850,000 would be depreciated under the schedule for five-year MACRS property. Accelerating depreciation reduces the after-tax cost of investing in solar energy property.
.) For solar energy property placed in service after December 31, 2021, the base credit amount is 6%. This base amount is multiplied by five (i.e., increased to 30%) for projects that satisfy prevailing wage and apprenticeship requirements or have a maximum net output of less than one MW of electrical or thermal energy.51
Taxpayers may qualify for additional credit amounts for projects that include domestically produced property or are located in qualifying geographic areas. Specifically:
A domestic content bonus credit is available for projects that certify that certain
steel, iron, and manufactured products used in the facility were domestically produced.52 The bonus credit amount is two percentage points, increased to 10 percentage points for projects that meet wage and apprenticeship requirements.
46 An energy community is defined as being a brownfield site; an area that has or had certain amounts of direct employment or local tax revenue related to oil, gas, or coal activities and has an unemployment rate at or above the national average; or a census tract or any adjoining tract in which a coal mine closed after December 31, 1999, or in which a coal-fired electric power plant was retired after December 31, 2009.
47 IRC §45X. 48 Tax-exempt organizations, including state and local governments and electric cooperatives, may be able to receive credit amounts as direct payments. Taxpayers who are not tax-exempt entities are allowed to elect direct pay for the advanced manufacturing production credit for the first five years starting with the year a facility is placed in service. The credit phases out for components sold after December 31, 2029. Components sold in 2030 will be eligible for 75% of the full credit amount. Components sold in 2031 and 2032 will be eligible for 50% and 25% of the full credit amount, respectively. No credits will be available for components sold after December 31, 2032.
49 For an overview of tax provisions in the IRA, see CRS Report R47202, Tax Provisions in the Inflation Reduction Act of 2022 (H.R. 5376), coordinated by Molly F. Sherlock. For an overview of climate-related provisions in the IRA, see CRS Report R47262, Inflation Reduction Act of 2022 (IRA): Provisions Related to Climate Change, coordinated by Jane A. Leggett and Jonathan L. Ramseur.
50 IRC §48. 51 Solar energy property qualifies for the 30% credit automatically if construction begins before 60 days after the Secretary of the Treasury publishes guidance on the wage and registered apprenticeship requirements.
52 CRS Insight IN11983, Proposed Tax Preference for Domestic Content in Energy Infrastructure, by Christopher D.
Congressional Research Service
13
link to page 16 Solar Energy: Frequently Asked Questions
Projects located in energy communities may qualify for an increased credit
amount of two percentage points, increased to 10 percentage points for projects that meet wage and apprenticeship requirements.53
The IRS has been directed to establish a program to allocate 1.8 gigawatts for
“environmental justice solar and wind capacity” credits in each of calendar years 2023 and 2024.54 Taxpayers receiving capacity allocations may be entitled to tax credits in addition to otherwise allowed ITCs. Specifically, projects located in low-income communities or on Indian land receiving allocations can claim a 10 percentage point bonus ITC. Projects that are part of low-income residential building projects or qualified low-income economic benefit projects can claim a 20 percentage point bonus ITC.
Starting in 2023, tax-exempt organizations, including state and local government and electric cooperatives, may be able to receive credit amounts as direct payments. In other words, entities that do not pay taxes may be able to receive the credit amount as payments. In 2024, the amount of the credit that can be received as direct pay will be limited to 90% for large facilities not meeting domestic content requirements. The Treasury Secretary can waive this limit if materials are not available domestically or if including domestic materials would increase the facility’s construction cost by more than 25%. A taxpayer can elect a one-time transfer of all or a portion of the tax credit. This option may be attractive to taxpayers with limited tax liability, as the taxpayer may be able to transfer his or her credit in exchange for a payment.
Taxpayers may claim the production tax credit (PTC) for electricity produced using qualifying solar energy property that was placed in service after 2021 if an ITC was not claimed for that same property. The PTC can be claimed for electricity produced at a qualifying facility during its first 10 years in operation. The credit amount is 1.3 cents per kWh (in 1993 dollars) adjusted annually for inflation. In 2022, the PTC was 2.6 cents per kWh for solar projects that qualify for this amount. Similar to the ITC, larger projects must pay prevailing wages and meet registered apprenticeship requirements to claim this credit amount, with the credit amount one-fifth of this value otherwise. Similar to the ITC, there are bonus amounts that can be added to the PTC for projects meeting domestic content requirements and facilities located in energy communities.
Beginning in 2024, solar energy facilities may be eligible for new clean electricity tax credits. Taxpayers can claim these credits either for investment in zero-emissions electricity generation facilities or for the production of zero-emissions electricity at qualifying facilities. Similar to the ITC and PTC above, limited credits are available for larger facilities that do not pay prevailing wages or meet registered apprenticeship requirements, and bonus credit amounts are available for projects in energy communities or facilities that meet domestic content requirements. After 2024, there is an annual allocation of 1.8 gigawatts in environmental justice solar and wind capacity credits, similar to what is available in 2023 and 2024. The clean electricity credits are scheduled to phase out when emissions reduction target levels are achieved or after 2032 (the later of the two).55
Watson and Molly F. Sherlock.
53 See footnote 46 for the energy community definition. 54 Qualifying solar facilities include those with a nameplate capacity of 5 MW or less. Qualifying property can include energy storage property installed in connection with the solar property and interconnection property.
55 The emissions target phaseout is scheduled to begin after the calendar year in which greenhouse gas emissions from the electric power sector are equal to or less than 25% of 2022 electric power sector emissions. Once phaseout begins, the full credit amount will remain available for facilities that begin construction the following year. The credit amount
Congressional Research Service
14
Solar Energy: Frequently Asked Questions
Special provisions in the tax code allow solar energy property to be depreciated over a shorter period of time than would normally be the case.56 Specifically, solar energy property is classified as five-year property in the Modified Accelerated Cost Recovery System (MACRS).57 Temporarily, through 2022, certain investments in solar energy property are eligible for 100% bonus depreciation.3758 This eligibility means that for these investments, the expense can be deducted immediately (i.e., expensed). Bonus depreciation is scheduled to phase down after 2022. It is scheduled to decrease to 80% in 2023, 60% in 2024, 40% in 2025, and 20% in 2026, before being 0% in 2027. Bonus depreciation may be claimed for new as well as used property. Regulated public utilities cannot claim bonus depreciation. Tax-exempt organizations, such as electric cooperatives, also cannot claim bonus depreciation, and typically are limited in their ability to benefit from tax incentives more broadly.
. Tax Incentives for Individuals
Individuals purchasing solar energy property may qualify for the residential energy-efficient property credit.3859 Through 20192032, the tax credit for individuals is 30% of the cost of solar electric property installed on the taxpayer'’s residence.3960 The tax credit rate is scheduled to be 26% in 20202033 and 22% in 20212034, with the credit expiring after 2021.402034.61 The tax credit is nonrefundable, meaning that the amount of the credit a taxpayer can claim in the tax year is limited to the taxpayer'taxpayer’s income tax liability. However, unused tax credits can be carried forward to the following tax year.
How Much Do Solar Tax Incentives Cost?
62 Tax expenditure estimates are one source of information on the "cost"“cost” of solar tax incentives. Tax expenditures are, by definition, the amount of forgone revenue associated with special provisions in the tax code, such as tax credits and accelerated cost recovery. For FY2019FY2021, the Joint Committee on Taxation (JCT) estimates that the amount of forgone revenue associated with the business ITC for solar was $37.4 billion.41 63 The amount of forgone revenue associated with the residential energy-efficient property credit for FY2019FY2021 was an estimated $2.0 billion. This figure, however, includes all eligible technologies.42 While most of this was due to solar energy property, JCT does not estimate the forgone revenue associated with solar separate from other eligible technologies. 1.0 billion, although
for facilities beginning construction in the second year will be 75% of the full credit amount. This will be reduced to 50% for facilities beginning construction in the third year and zero afterward.
56 Generally, assets used in the production of electricity are recovered over a 20-year period. See IRS Publication 946 (2018), “How to Depreciate Property,” available at https://www.irs.gov/publications/p946. 57 IRC §168(e)(3)(B). The depreciable basis (the amount that is recovered through depreciation deductions over time) of solar energy property is reduced by 50% of any ITC claimed. Thus, if a 30% ITC was claimed on a $1 million investment in solar energy property, $850,000 would be depreciated under the schedule for five-year MACRS property. Accelerating depreciation reduces the after-tax cost of investing in solar energy property.
58 The 2017 tax revision (P.L. 115-97, commonly referred to as the Tax Cuts and Jobs Act) included a temporary 100% bonus depreciation for qualified assets bought and placed in service between September 28, 2017, and December 31, 2022. This provision is not unique to solar, but it nonetheless reduces the after-tax cost of making investments in solar energy property. For more information on bonus depreciation generally, see CRS Report RL31852, The Section 179 and Section 168(k) Expensing Allowances: Current Law and Economic Effects, by Gary Guenther.
59 IRC §25D. 60 A taxpayer’s residence includes any dwelling unit used as a residence by the taxpayer. It is not limited to property installed on the taxpayer’s primary residence, so tax credits can be claimed for solar energy property installed on second or vacation homes.
61 The tax credit for solar panels was reduced to 26% in 2020 and 2021 before being increased back to 30% in the IRA. 62 Molly F. Sherlock, Specialist in Public Finance, was the author of this section. 63 JCT, Estimates of Federal Tax Expenditures for Fiscal Years 2020–2024, JCX-23-20, November 5, 2020, p. 25.
Congressional Research Service
15
Solar Energy: Frequently Asked Questions
the Taxpayer Certainty and Disaster Tax Relief Act of 2020 (Division EE of P.L. 116-260) later extended this provision, with the extension estimated to reduce federal revenue by $0.3 billion in FY2021.64 The figures for the residential tax credits includes all eligible technologies and are not strictly for solar.65 The revenue loss for five-year MACRS for all eligible energy property (primarily wind and solar, but other technologies are eligible) is estimated at less than $50 million in FY2021in FY2018. Because bonus depreciation is not a solar- or even energy-specific provision, a tax expenditure estimate for bonus depreciation for solar is not available.
Internal Revenue Service (IRS)
IRS data also provide information on individual claims of tax credits for solar electric property.43 In 2017, individuals filed 381,24266 In 2019, an estimated 517,664 individuals filed tax returns that claimed the residential energy-efficient property credit for solar electric property.4467 The total cost of solar electric property for which tax credits were claimed was $5.510.4 billion, generating approximately $1.6 billion in individual income tax credits.45
3.1 billion in individual income tax credits.68
The IRA’s expanded and modified tax credits for clean energy are expected to reduce federal revenues, with the JCT estimating the budgetary effect for the FY2022-FY2031 period.69 The JCT’s estimates apply to all technologies eligible for a provision and are not specific to solar. The IRA’s modification and extension of the ITC is estimated to reduce federal revenues by $14.0 billion, while the new clean electricity ITC is expected to reduce federal revenues by an additional $50.9 billion. Extending the five-year cost recovery period in the IRA, which includes solar and other technologies, is estimated to reduce federal revenue by $0.6 billion. The extension and modification of the residential energy efficient property, which can be claimed for residential solar panel installations, is expected to reduce federal revenue by $22.0 billion over the 10-year budget window. As discussed above, taxpayers investing in or engaged in solar manufacturing may also be able to claim federal tax credits for these activities. The estimated reduction in federal tax revenues due to the advanced energy manufacturing tax credit in the IRA is $6.3 billion, while the reduction in revenue due to the advanced manufacturing production credit is $30.6 billion.
64 The business ITC was also extended in P.L. 116-260, but there was not estimated to be a FY2021 fiscal impact for that extension. See JCT, Estimated Budget Effects of the Revenue Provisions Contained in Rules Committee Print 116-68, the “Consolidated Appropriations Act, 2021,” JCX-24-20, December 21, 2020. 65 Taxpayers can also claim the residential energy-efficient property credit for solar water heating, small wind energy, geothermal heat pump, and fuel cell property. While most of this was due to solar energy property, JCT does not estimate the forgone revenue associated with solar separate from other eligible technologies.
66 Data from the IRS Statistics of Income files are not directly comparable to JCT’s tax expenditure estimates. Tax expenditures are estimates of the forgone revenue associated with a tax provision in a given fiscal year. The IRS Statistics of Income data are estimates based on tax returns filed for a given calendar year.
67 Internal Revenue Service, Individual Income Tax Returns Line Item Estimates, 2019, Publication 4801 (Rev. 12-2021), 2019, pp. 128-129, https://www.irs.gov/pub/irs-pdf/p4801.pdf.
68 Ibid. 69 All estimates in this paragraph are 10-year estimates, as provided in JCT, Estimated Budget Effects of the Revenue Provisions of Title I – Committee on Finance, of an Amendment in the Nature of Substitute to H.R. 5376, “An Act to Provide for Reconciliation Pursuant to Title II of S. Con. Res. 14,” as Passed by the Senate on August 7, 2022, and Scheduled for Consideration by the House of Representatives on August 12, 2022, JCX-18-22, August 9, 2022.
Congressional Research Service
16
link to page 11 link to page 11 link to page 21 Solar Energy: Frequently Asked Questions
What State Policies Support Solar Energy Development?46
70 Per the Federal Power Act, states have jurisdiction over most aspects of electricity generation and distribution.4771 Consequently, many policies that affect the development of solar energy are implemented by states. This section discusses one common state policy, a renewable portfolio standard. Other state policies designed to accelerate the deployment of solar energy include net metering (mentioned in the section "“How Does Solar Energy Impact Electricity Costs for Consumers?")”), state tax credits, and allowing third-party ownership (i.e., solar leasing).48
72
Renewable portfolio standards (or, more broadly, electricity portfolio standards), as typically implemented, set requirements on utilities to procure a minimum share of their electricity sales from specified renewable sources such as solar.4973 Many factors influence solar energy development, but renewable portfolio standards are widely credited as being a key factor in the United States historically, as they have provided a policy-driven source of demand for renewable electricity generation. Twenty-nineThirty states, three U.S. territories, and the District of Columbia are implementing mandatory electricity portfolio standards, and an additional eight states and one territory have voluntary standards. Of these, nine jurisdictions have targets of 100% clean energy.74 Jurisdictions differ in their definitions of eligible clean energy sources, but solar is eligible in all cases.50 Nineteen of these policies include specific requirements or extra incentives for solar.75
How Are Tariffs and Trade Restrictions Affecting Solar Imports and Domestic Solar Manufacturing?76 While several different semiconducting materials may be used in panels, crystalline silicon (CS) was used in over 95% of solar panels produced globally in 2020. The remainder of panels were thin-film panels, which are typically less effective at converting incoming sunlight into electricity.
The CS PV supply chain consists of four primary manufacturing stages: (1) production of bulk polysilicon, (2) manufacture of thin sheets of CS known as wafers, (3) manufacture of solar cells, and (4) assembly of solar panels. In 2020, China accounted for over 70% of global production of each stage (Figure 5). The United States currently has manufacturing operations in the final stage, CS panel assembly, where imported cells are wired together and framed. While the U.S. assembly represents 3% of global CS PV panel assembly in 2020, U.S. CS PV panel production
70 Ashley Lawson, Analyst in Energy Policy, was the author of this section. 71 16 U.S.C. §824. For discussion of the Federal Power Act, see CRS In Focus IF11411, The Legal Framework of the Federal Power Act, by Adam Vann.
72 For more information of state solar energy policies, including details by state, see North Carolina Clean Energy Technology Center, Database of State Incentives for Renewables & Efficiency (DSIRE), https://www.dsireusa.org/.
73 Renewable portfolio standard policy design is discussed further in CRS Report R45913, Electricity Portfolio Standards: Background, Design Elements, and Policy Considerations, by Ashley J. Lawson.
74 DSIRE, Renewable & Clean Energy Standards, September 2020, https://ncsolarcen-prod.s3.amazonaws.com/wp-content/uploads/2020/09/RPS-CES-Sept2020.pdf.
75 Galen Barbose, U.S. Renewable Portfolio Standards: 2021 Status Update: Early Release, Lawrence Berkeley National Laboratory, February 2021, p. 10.
76 Manpreet Singh, Analyst in Industrial Organization and Business, was the author of this section.
Congressional Research Service
17
Solar Energy: Frequently Asked Questions
accounted for about 10% of apparent U.S. consumption of CS PV panels, highlighting the inability of current domestic production to satisfy U.S. demand.77
Figure 5. Upstream CS PV Value Chain
Share of Global Production by Geographic Area, 2020
Source: Figure created by CRS from G. Masson and I. Kaizuka, Trends in Photovoltaic Applications 2021, International Energy Agency, pp. 44-46.
The United States has applied tariffs on imports of certain solar energy equipment since 2012.78
The Obama Administration imposed double- and triple-digit antidumping and
countervailing duty tariffs on U.S. imports of CS PV cells and panels from China in 2012 and 2015 and on imports from Taiwan in 2015. These tariffs were extended in 2019 (China) and 2020 (China and Taiwan) until the next five-year review.79
In 2018, the Trump Administration—acting under Section 201 of the Trade Act
of 197480—responded to an industry petition by imposing tariffs of 30% on imports of CS PV cells exceeding a 2.5 GW annual tariff-free quota and on all
77 International Energy Agency (IEA), Photovoltaic Power Systems Program (PVPS), Trends 2018 in Photovoltaic Applications, December 3, 2018, p. 56. Apparent consumption accounts for total production plus imports minus exports. U.S. International Trade Commission (USITC), Crystalline Silicon Photovoltaic Cells, Whether or Not Partially or Fully Assembled Into Other Products, Investigation no. TA-201-75, December 2021.
78 See CRS Report R47093, U.S. Solar Photovoltaic Manufacturing, by Manpreet Singh. 79 The USITC conducts sunset reviews every five years to determine whether to extend antidumping and countervailing duties. For more information, see section 751(c) of the Tariff Act of 1930, 19 U.S.C. §1675(c).
80 Section 201 of the Trade Act of 1974 (19 U.S.C. §2251) provides temporary relief for a U.S. industry from import competition. See CRS In Focus IF10786, Safeguards: Section 201 of the Trade Act of 1974, by Vivian C. Jones.
Congressional Research Service
18
Solar Energy: Frequently Asked Questions
CS PV panels.81 For imports from China and Taiwan, the Section 201 tariffs were additional to antidumping and countervailing duties. The tariff rates and scope of coverage have subsequently been adjusted several times.82 On February 4, 2022, President Biden extended the Section 201 tariffs on CS PV cell and panel imports for another four years at a 14.75% rate and doubled the amount of CS PV cells exempt from tariffs to 5 GW annually.83
In 2018, the Trump Administration placed a 25% duty on steel and a 10% duty on
aluminum imported from most countries. These duties affect BOS equipment—such as PV brackets, panel frames, cabling, power electronics housing, batteries, and wiring84—and are projected to add 2%-5% to PV system costs.85
Additional tariffs on a long list of Chinese products, including inverters and other
solar equipment, were imposed at a 10% rate in September 2018. The rate was raised to 25% in May 2019.86
CS PV panel imports from China declined after antidumping and countervailing duties were imposed in 2012. Since 2018—the start of the Section 201 tariffs—the volume of CS PV panel imports increased from about 5 GW in 2018 to 19 GW in 2020, led by imports from Malaysia, Vietnam, and Thailand. In April 2022, in response to an industry petition, the Department of Commerce initiated an inquiry into whether Chinese manufacturers are circumventing duties by sending nearly finished products from China to Malaysia, Vietnam, and Thailand for minor processing before shipping them to the United States.87
In June 2022, President Biden used emergency authorities to suspend duties on imports of solar cells and panels from Cambodia, Malaysia, Thailand, and Vietnam for 24 months to support U.S. solar deployment efforts.88 In December 2022, the Commerce Department released an affirmative preliminary decision finding that four companies were circumventing duties through these four countries. The Commerce Department issued a country-wide circumvention finding for each of
81 The solar tariff excludes countries that are part of the Generalized System of Preferences list so long as these countries account for less than 3% individually, or 9% collectively, of U.S. imports of solar cells in any given year. A few countries have been removed from the list. For example, Turkey and India were taken off in spring 2019.
82 The U.S. Trade Representative announced certain exemptions in June 2019 for particular types of panels including bifacial panels that generate electricity on both sides.
83 The tariff rate is to decrease 0.25 percentage points annually through 2026. Executive Office of the President (Biden), “To Continue Facilitating Positive Adjustment to Competition from Imports of Certain Crystalline Silicon Photovoltaic Cells (Whether or Not Partially or Fully Assembled into Other Products),” 87 Federal Register 7357, February 4, 2022.
84 Section 232 of the Trade Expansion Act of 1962 (19 U.S.C. §1862, as amended) permits the President to levy tariffs and quotas on imports found to threaten or impair U.S. national security. Excluded from the Section 232 tariffs are several countries, including Canada, Mexico, and the European Union.
85 David Feldman, Jack Hoskins, and Robert Margolis, Q4 2017/Q1 2018 Solar Industry Update, NREL, May 2018, p. 5.
86 Section 301 of the Trade Act of 1974 (19 U.S.C. §2411-2420) allows the Office of the United States Trade Representative (USTR), at the direction of the President, to impose import restrictions if USTR determines that a foreign country’s acts, policies, or practices are unreasonable and discriminatory. See CRS Report R45529, Trump Administration Tariff Actions: Frequently Asked Questions, coordinated by Brock R. Williams.
87 CRS Insight IN11946, Circumvention Inquiry into Solar Imports, coordinated by Liana Wong. 88 The White House, “Declaration of Emergency and Authorization for Temporary Extensions of Time and Duty-Free Importation of Solar Cells and Modules from Southeast Asia,” press release, June 6, 2022, https://www.whitehouse.gov/briefing-room/statements-releases/2022/06/06/declaration-of-emergency-and-authorization-for-temporary-extensions-of-time-and-duty-free-importation-of-solar-cells-and-modules-from-southeast-asia/.
Congressional Research Service
19
Solar Energy: Frequently Asked Questions
the four countries, and companies operating there will be required to present evidence that they are not circumventing to avoid the application of duties when exporting solar cells and panels to the United States. A final determination is expected to be released by May 2023. As a result of the presidential proclamation issued in June 2022, no duties are to be collected on solar imports from these four countries until June 2024 so long as the imported products are consumed in the United States within six months of entry.89
The tariff effects have not been felt evenly across the four main manufacturing stages:
1. Polysilicon refinement. The solar industry consumes over 90% of the global
output of polysilicon.90 While the United States and China produced similar shares of global polysilicon output in 2011,91 production in China expanded to 76% of global output in 2020, while U.S. production declined to 5%.92 Domestic production declined largely due to antidumping and countervailing duties imposed by China on solar-grade polysilicon imports from the United States since 2014 (extended in 2020 for five years).93 As the majority of polysilicon consumers (i.e., CS PV wafer producers) are located in China, accounting for 96% of global CS PV wafer production in 2020, U.S. producers have faced challenges in competing in the global polysilicon market. Additionally, production expansion in China lowered the global market price of polysilicon, making many polysilicon producers globally less profitable and forcing them to exit the market or reduce production. Nearly two-thirds of polysilicon production in China in 2020 came from plants in the Xinjiang region, where some producers have come under scrutiny for alleged use of forced labor.94 Under P.L. 117-78, enacted in December 2021, all products mined or manufactured in China’s Xinjiang Uyghur Autonomous Region are presumed to be produced using forced labor and therefore banned from U.S. entry unless proven otherwise.95 The act identifies polysilicon as a high-priority sector for enforcement and became effective on June 21, 2022.
2. CS wafer production. In 2020, 96% of global wafer production occurred in
China, with the two largest companies, Longi and Zhonghuan, accounting for nearly two-thirds of total global output.96 Companies that formerly made CS PV
89 U.S. Department of Commerce, “Department of Commerce Issues Preliminary Determination of Circumvention Inquiries of Solar Cells and Modules Produced in China,” press release, December 2, 2022, https://www.commerce.gov/news/press-releases/2022/12/department-commerce-issues-preliminary-determination-circumvention.
90 G. Masson and I. Kaizuka, Trends in Photovoltaic Applications 2021, IEA, p. 42. 91 Ranmali De Silva, “PV production 2013: an all-Asian affair,” Bloomberg New Energy Finance, April 16, 2014, p. 3. 92 Masson and Kaizuka, Trends in Photovoltaic Applications 2021, p. 44. 93 See Global Trade Alert, “China: Extension of Definitive Antidumping Duties on Solar-Grade Polysilicon from the United States and the Republic of Korea,” at https://www.globaltradealert.org/intervention/16490/anti-dumping/china-imposition-of-antidumping-duties-on-solar-grade-polysilicon-from-us-and-the-republic-of-korea. A Chinese Ministry of Commerce announcement (in Chinese) describing the extended countervailing duties is at http://www.mofcom.gov.cn/article/b/e/202001/20200102931616.shtml, and an announcement describing the extended antidumping duties is at http://www.mofcom.gov.cn/article/b/e/202001/20200102931610.shtml.
94 IEA-PVPS, National Survey Report of PV Power Applications in China 2020, 2020, p. 23, at https://iea-pvps.org/wp-content/uploads/2021/09/NSR_China_2020.pdf.
95 Effective June 21, 2022, under Section 307 of the Tariff Act of 1930, 19 U.S.C. §1307. For more information, see CRS In Focus IF10281, China Primer: Uyghurs, by Thomas Lum and Michael A. Weber.
96 Masson and Kaizuka, Trends in Photovoltaic Applications 2021, p. 45.
Congressional Research Service
20
Solar Energy: Frequently Asked Questions
ingots and wafers in the United States—including SunEdison, SolarWorld, and Panasonic—ceased production between 2013 and 2017.97 According to the DOE, the only capacity for wafer production in the United States as of February 2022 was a 20 MW plant in Massachusetts owned by Cubic PV.98
3. CS PV cell fabrication. In 2020, 83% of global cell production occurred in
China led by seven companies, many of which also assembled panels.99 No CS PV cells have been produced in the United States since 2021.100 Companies that previously made CS cells in the United States—Panasonic, SunPower, and Yingli—shut down production between 2019 and 2020. U.S. cell producers contended that they did not benefit from Section 201 tariffs imposed in 2018 on CS cell and panel imports because nearly all cells were allowed into the country duty-free each year under the 2.5 GW quota during the four-year period after the tariffs began in 2018. President Biden’s February 2022 order extending the tariffs for another four years doubled the quota of annual imports not subjected to duties to 5 GW.
In 2021, South Korea was the largest source of cell imports into the United States, according to data from the U.S. Census Bureau. Two South Korean manufacturers, LG and Hanwha Q Cells, import cells for use in their panel assembly factories in Alabama and Georgia, respectively. Malaysia and Vietnam have also become sources of imports.
4. CS PV panel assembly. According to the U.S. International Trade Commission,
domestic capacity for CS PV panel assembly increased to 3.8 GW during the Section 201 tariff period largely due to the opening of new panel manufacturing plants by Hanwha in Georgia, LG Electronics in Alabama, and Jinko Solar Industries in Florida.101 LG Electronics announced in February 2022 that it would exit the solar panel business by June 2022, citing supply chain constraints.102 Domestic producers cite multiple factors for the relatively limited CS PV panel manufacturing growth since 2018, as compared to increased domestic demand over the same period. These cited factors include the exclusion of bifacial panels from tariffs at different times within the tariff period, stockpiling of imports, and circumvention of duties by China.103 PV panel prices globally have declined steeply over the past decade. While panel prices in the U.S. market have fallen as
97 Brittany L. Smith and Robert Margolis, Expanding the Photovoltaic Supply Chain in the United States: Opportunities and Challenges, NREL, July 2019, p. 6.
98 DOE, Office of Energy Efficiency & Renewable Energy, Solar Energy Technologies Office, “Solar Manufacturing,” at https://www.energy.gov/eere/solar/solar-manufacturing.
99 IEA-PVPS, National Survey Report of PV Power Applications in China 2020, pp. 23-24. 100 David Feldman and Robert Margolis, H2 2020: Solar Industry Update, NREL, April 6, 2021, p. 43, at https://www.nrel.gov/docs/fy21osti/79758.pdf.
101 USITC, Crystalline Silicon Photovoltaic Cells, p. 20. 102 LG, “LG to Exit Global Solar Panel Business,” press release, February 23, 2022, at https://www.lg.com/us/press-release/lg-to-exit-global-solar-panel-business.
103 World Trade Organization member developing countries with less than a 3% share of solar cell and panel imports to the United States are exempt from the Section 201 tariffs. Suniva and Auxin Solar claim that imports from Cambodia, excluded from tariffs, have rapidly risen since 2019 due to Chinese companies using the country as an export platform. USITC, Crystalline Silicon Photovoltaic Cells, p. 27.
Congressional Research Service
21
Solar Energy: Frequently Asked Questions
well, they remained 61% higher on average than the global average selling price in 2018 despite the tariffs on imported cells and panels, according to NREL.104
Since 2019, inverters made in China have faced a 25% U.S. tariff. To avoid the tariff, two large suppliers of inverters to the U.S. market are reportedly planning to shift production from China to other locations.105 According to the Solar Energy Industries Association, U.S. inverter production is declining, primarily due to the closure of two major U.S. facilities at the end of 2016.106 Other components needed for solar panel assembly, such as backsheets and junction boxes, are also among the products that face a 25% tariff if imported from China.107
Thin-film panels accounted for 16% of solar deployments in the United States in 2020, a higher market share than global deployment, which was less than 5%.108 Thin-film panels are comparatively simple to manufacture relative to CS PV panels. A single company can typically produce thin-film panels, because these panels do not require the four discrete manufacturing stages for CS PV panels.109 The leading producer of thin-film panels globally is U.S.-based First Solar, and the primary market for thin-film PV installations is the utility sector.
What U.S. Jobs Are Supported by the Solar Industry?110 In 2020, solar PV provided the largest share (about 28%) of jobs in the U.S. electric power generation sector, at 231,574 jobs,111 despite solar’s limited role in total electricity generation.112
104 David Feldman and Robert Margolis, Q4/Q1 2019 Solar Industry Update, NREL, May 2019, p. 60. 105 Every major inverter manufacturer makes its solar inverters outside the United States, primarily in China. According to Wood Mackenzie, California-based Enphase and Israeli-based SolarEdge supplied 89% of the U.S. market for inverters last year. SolarEdge makes its products in China and operates an inverter factory in Hungary. It also has plans for a new manufacturing site in Vietnam. Enphase expects to move some inverter manufacturing from China to Mexico. Separately, China’s Huawei, which makes solar inverters and accounted for more than one-fifth of the global market in 2018, has ceased U.S. sales, according to press reports, after about a dozen Members of Congress called for its inverters to be banned from the U.S. electricity network. Wood Mackenzie says Huawei represented around 4% of the U.S. market.
106 Solar Energy Industries Association (SEIA)/Wood Mackenzie, U.S. Solar Market Insight, 2017 Year in Review, March 2018, pp. 57-58.
107 Backsheets are intended to electrically insulate the panel and protect it from moisture, wind, and ultraviolet light damage, and a PV junction box housing electrical connections is an enclosure usually installed on the backside of a solar panel. The majority of junction boxes are made in China.
108 David Feldman, Kevin Wu, Robert Margolis, H1 2021: Solar Industry Update, NREL, June 22, 2021, p. 26, at https://www.nrel.gov/docs/fy21osti/80427.pdf.
109 Gregory M. Wilson et al., “The 2020 Photovoltaic Technologies Roadmap,” Journal of Physics D: Applied Physics, vol. 53, no. 493001 (2020), p. 11.
110 Manpreet Singh, Analyst in Industrial Organization and Business, was the author of this section. 111 The federal government does not collect data on employment in the solar energy industry as a discrete sector. Instead, employees are included in a variety of manufacturing, service, and power generation sectors such as those defined by various NAICS codes. Solar employment figure of 231,474 from SEIA pertains to individuals spending 50% or more of their labor hours on solar goods or services. SEIA et al., National Solar Jobs Census 2020, p. 8. Jobs for all sources of electric power generation in the United States totaled 833,573 in 2020 from DOE, 2021 United States Energy Employment Report, DOE/SP-0001, 2021.
112 Estimation includes both small-scale and utility-scale solar PV systems. EIA, Electricity Generation, Capacity, and Sales in the United States, March 18, 2021, at https://www.eia.gov/energyexplained/electricity/electricity-in-the-us-generation-capacity-and-sales.php#:~:text=In%202020%2C%20net%20generation%20of,solar%20photovoltaic%20(PV)%20systems.
Congressional Research Service
22
link to page 26 link to page 7 link to page 27
Solar Energy: Frequently Asked Questions
Over two-thirds of the solar-related jobs counted in a solar industry employment survey conducted in 2020 were in installation and development (Figure 6), which has been a consistent pattern since 2015. Over half of all installation employment was related to residential-scale projects—though these small-scale projects provide less than half of solar electricity generation (Figure 2)—because they tend to be more labor intensive than utility-scale and commercial projects.113 Because most jobs are in installation and development, circumstances affecting demand for residential solar deployment can adversely affect total solar industry employment. These installation and development jobs tend to be located in states that have higher levels of solar deployment. California, Texas, and Florida had the highest cumulative solar capacity installed as of 2021 and rank in the top four states, along with New York, for the greatest number of solar jobs.114
Figure 6. U.S. Solar Employment Breakdown by Sector 2020
Source: Figure created by CRS using data from Solar Energy Industries Association, Solar Foundation, and Interstate Renewable Energy Council, National Solar Jobs Census 2020, May 2021. Notes: Solar job figures shown here account for employment positions in which more than 50% of working hours are spent on solar-related work.
Direct employment in U.S. solar manufacturing, including for both CS PV and thin-film technologies, was about 31,050 workers in 2020, accounting for about 14% of total employment related to the solar energy sector. According to the U.S. International Trade Commission, production of CS PV panels represented about 2,500 jobs in 2020.115 States with the largest manufacturing facilities, such as Ohio and Georgia, primarily rely on out-of-state solar demand. Smaller facilities tend to cluster in states or locations with relatively higher solar deployment, such as in New York and California.116 Figure 7 shows locations of domestic PV component manufacturing as of 2021.
113 DOE, 2021 United States Energy Employment Report, DOE/SP-0001, 2021, p. 51. 114 SEIA, “Top 10 Solar States,” at https://www.seia.org/research-resources/top-10-solar-states-0; and SEIA et al., National Solar Jobs Census 2020, p. 14.
115 USITC, Crystalline Silicon Photovoltaic Cells, p. 21. 116 SEIA et al., National Solar Jobs Census 2020, p. 15.
Congressional Research Service
23
link to page 31
Solar Energy: Frequently Asked Questions
Figure 7. Domestic PV Manufacturing
January 2022
Source: National Renewable Energy Laboratory (NREL), January 2022. During 2022, NREL switched to providing this data in an active format, available at NREL, “What is Solar Manufacturing?,” at https://www.energy.gov/eere/solar/solar-manufacturing.
Notes: Figure includes active manufacturing sites and shows nameplate annual capacity or potential annual output. Facilities may not have produced the amounts shown. No manufacturing capacity was located in Alaska and Hawaii as of January 2022. Polysilicon manufacturing capacity is measured in megatonnes (MT) of polysilicon production per year.
How Much Land Is Needed for Solar Energy?117 Land is required for the extraction, production, and consumption of energy and for the generation, transmission, and distribution of electricity.118 There is not a generally accepted standard metric or methodology for a comparison of land use across energy technologies or across installations of even a single technology such as solar PV.119 Determining how much land is needed depends on
117 Morgan Smith, Analyst in Energy Policy, was the author of this section. 118 With the development of some energy technologies—including hydroelectric power, offshore wind, aquaculture, and floating solar—“land” use can also include water. For additional information on water use and mitigations, see the section “What Is Dual-Use Solar Power?” 119 Llorenç Milà i Canals et al., “Key Elements in a Framework for Land Use Impact Assessment Within LCA,” International Journal of Life Cycle Assessment, vol. 12, no. 1 (2007), pp. 5-15.
Congressional Research Service
24
link to page 29 link to page 29 Solar Energy: Frequently Asked Questions
the purpose that is being evaluated and what assumptions or boundaries are included. For example, an analysis of electricity demand could calculate how much land is needed to support an MW of electricity generation capacity. Another study might calculate how much revenue can be produced per square meter either from electricity sales or from land leasing. One might examine the magnitude of land quality impacts including habitat changes, soil quality impacts, or water quality impacts.120 Additionally, one could determine emissions offsets by calculating the greenhouse gas emissions or particulate emissions per square meter. Power density is a metric that accounts for land use, is broadly useful for evaluating solar energy, and can compare solar energy with other technologies. Power density can be expressed as a unit of power per unit of area (e.g., watts of electricity per square meter, We/m2).
The calculation of power density is not a straightforward process—especially if the goal is to compare solar energy with other energy technologies—and results can depend on the methodology used and on the assumptions or boundaries included. For example, when comparing renewable to nonrenewable energy technologies, renewables generally have lower power density—meaning they require more land to produce the same amount of electricity as nonrenewable sources.121 However, renewable sources can use the same land area year after year, while some nonrenewable sources such as fossil-fuel-based sources consume new land over time. This complexity suggests the need to consider additional metrics such as a “time to land use equivalency,” which would account for the additional land use over time.122
Additional factors that can affect the calculations of power density include whether to consider the area needed for electricity generation only or also the land areas used for electricity transmission or waste disposal. Calculations could also include inputs such as land used for upstream and downstream process steps (e.g., extraction of fuels or resources used for electricity generation)—which could be critical for comparisons between solar energy and other energy sources.
Others factors might be relevant for the comparison of solar energy between different locations or over time. These include how much solar energy is incident on the area, how much land is needed for just the solar panels compared to total site land area, the efficiency of the panels, and other technology factors such as whether or not the panels track the sun’s movements or if the panels are bifacial and can absorb sunlight from both sides.123 Calculations can also change with time as technology innovation leads to increased energy efficiency.
One example of a calculation power density for solar PV comes from a review of 54 studies that examined the power density of electric power production in the United States.124 It found that solar energy has a lower power density than natural gas, nuclear, oil, and coal but a higher power density than wind, hydropower, biomass, and most geothermal. The review accounted for energy
120 The question of how much impact solar energy development has on the land is a particularly challenging one. For more information on these considerations see “What Are the Potential Impacts of Solar Energy Development on Land?”
121 John van Zalk and Paul Behrens, “The Spatial Extent of Renewable and Non-Renewable Power Generation: A Review and Meta-Analysis of Power Densities and Their Application in the U.S.,” Energy Policy, vol. 123 (2018), pp. 83-91.
122 Anne M. Trainor, Robert I. McDonald, and Joseph Fargione, “Energy Sprawl Is the Largest Driver of Land Use Change in United States,” PLoS One, 11 (9), September 8, 2016. 123 Robert M. Horner and Corrie E. Clark, “Characterizing Variability and Reducing Uncertainty in Estimates of Solar Land Use Energy Intensity,” Renewable and Sustainable Energy Reviews, vol. 23 (July 2013), pp. 129- 137.
124 Van Zalk and Behrens, “The Spatial Extent of Renewable and Non-Renewable Power Generation.” The review considered nine energy sources: biomass, coal, geothermal, hydro, natural gas, nuclear, oil, solar, and wind.
Congressional Research Service
25
Solar Energy: Frequently Asked Questions
conversion efficiencies, capacity factors, and infrastructure area, including infrastructure associated with energy production (e.g., mines).125 The review did not control for time, reporting that the earliest study included in the analysis was from 1974; however, the review concluded that, of the nine energy types evaluated, only solar had a statistically significant increase in power density over time.126 Published values for power density for solar systems range from 1.5 to 19.6 We/m2.127 Generally, solar thermal and utility-scale PV were found to require more land area to produce the same amount of electricity than residential PV and CSP. While the technology for residential PV and utility-scale PV is similar, sloped rooftops may allow more sunlight to reach otherwise flat panels for residential systems, and the spacing of panels at utility-scale facilities (regardless of tilt)—to provide for maintenance and to avoid shading—may lead to lower power densities.128
What Are the Potential Impacts of Solar Energy Development on Land?129 The impacts of solar energy development on land and land cover can be measured by comparison to the previous state of the land before an energy project was developed.130 Short-term impacts include preventing the use of land for other applications, emissions from decaying biomass cleared from the land, and emissions from soil disturbance. Long-term impacts can include pollution of the soil from metals (potentially exacerbated during a solar array’s decommissioning), altering erosion of soil and increased runoff, impacts on biodiversity including reduced habitat, soil compaction, and materials remaining after decommissioning. Some of these long-term impacts could affect land reuse131 or increase time-to-recovery, which refers to how long it takes after decommissioning (or disturbance) for the used land to revert to its previous use and/or condition.132 Some of these impacts result in externalities, environmental costs, and others costs related to land use reversion that are considerations for project developers
125 Conversion efficiency is a measure of how much usable energy results from the technology compared to the input energy. Capacity factor is the ratio of electricity generated during a period of time to the maximum possible electricity that could be generated during the same period of time.
126 Van Zalk and Behrens reported p-values and considered a p-value less than 0.05 to be significant. For solar energy, the p-value was found to be 0.001. According to the review, solar energy power density increased by an average of 0.42 We/m2 per year. Wind had an average increase of 0.17 We/m2 per year but a p-value of 0.17, indicating it was not statistically significant.
127 Van Zalk and Behrens, “The Spatial Extent of Renewable and Non-Renewable Power Generation.” 128 P. Denholm and R. Margolis, The Regional Per-Capita Solar Electric Footprint for the United States, NREL, Technical Report, NREL/TP-670-42463, December 2007, pp. 5-6, https://www.nrel.gov/docs/fy08osti/42463.pdf.
129 Morgan Smith, Analyst in Energy Policy, was the author of this section. 130 Land use refers to activities that take place on land, such as growing food. Land cover refers to the physical characteristics of the land surface, such as grassland or concrete. D. G. Brown et al., “Ch. 13: Land Use and Land Cover Change,” in Climate Change Impacts in the United States: The Third National Climate Assessment, J. M. Melillo, Terese (T. C.) Richmond, and G. W. Yohe, Eds., U.S. Global Change Research Program, 2014, pp. 318-332, https://nca2014.globalchange.gov/report/sectors/land-use-and-land-cover-change.
131 Argonne National Laboratory, “Solar Energy Development Environmental Considerations,” https://solareis.anl.gov/guide/environment/; D. Turney and V. Fthenakis, “Environmental Impacts from the Installation and Operation of Large-Scale Solar Power Plants,” Renew. Sustain. Energy Rev., vol. 15 (2011), pp. 3261-3270.
132 Some argue that uses where the land can recover quickly should not be counted the same as use that delays full recovery for decades or centuries. Additional work is needed to determine appropriate land use metrics for comparisons between the different impact types. DOE, “Chapter 10: Concepts in Integrated Analysis,” Quadrennial Technology Review (2015), https://www.energy.gov/quadrennial-technology-review-2015, pp. 388, 407.
Congressional Research Service
26
link to page 32 Solar Energy: Frequently Asked Questions
and governmental entities when regulating or evaluating the development of solar energy projects. Conversely, compared to other energy sources used to generate electricity, studies have concluded that solar power’s impacts on a number of land use impacts are neutral or beneficial (for example chemical exposure, habitat and climate change impacts, soil erosion during construction, and surface water runoff quality).133
Project site selection also affects potential land impacts. Preferred locations for solar power include areas with high solar intensity/solar incidence, flat land with minimal site preparation needed, land in proximity to electricity demand and to electricity transmission lines, and land with physical access such as roads for installation and maintenance.134 These site selection preferences result in some projects preferentially targeting land types including forests, grasslands, deserts, and farmland.135 Farmers may install PV arrays to supplement income or to ensure reliable electrical supply for their farming operations via on-site energy sources. Forest land or desert land might be preferred for development because of lower costs of acquisition or lack of existing developments.
The use of these types of land for solar projects can be controversial and often faces opposition.136 Opposition to the use of farmland for solar projects argues that it may remove valuable arable land from food production (thus disrupting global food supplies and local farm economies), interfere with scenic views, or disrupt the rural character of the region, as discussed in the section “What Are Potential Impacts of Solar Energy Development on Agriculture?”137 Opposition to the use of forest, grassland, and desert is primarily based on ecological and environmental considerations such as impacts on water systems (retention, filtration, and contamination) and animal habitats, though it can also include impacts on sightlines/view impacts and adjacent property values.138
There are mitigations that can help address both the land use impacts and the challenges related to land use opposition. One approach to mitigation is using already-disturbed land for solar 133 One study identified 32 environmental effect categories covering human health impacts, wildlife and habitat impacts, and land use and geohydrological impacts. Of those, solar power had comparatively beneficial impacts in 22 categories, neutral impacts in 4 categories, and detrimental impacts in 0 categories, and there were insufficient data to determine the relative impacts in the other 6 categories. Turney and Fthenakis, “Environmental Impacts.”
134 I. Guaita-Pradas et al., “Analyzing Territory for the Sustainable Development of Solar Photovoltaic Power Using GIS Databases,” Environmental Monitoring and Assessment, vol. 191 (2019), p. 764; Thomas Daniels and Hannah Wagner, “Regulating Utility-Scale Solar Projects on Agricultural Land,” Kleinman Center for Energy Policy, August 2022; Alison Davis, “Solar Farming Considerations,” University of Kentucky Agricultural Economics, May 28, 2021, https://agecon.ca.uky.edu/solar-farming-considerations; Ben Lumby, “Utility-Scale Solar Photovoltaic Power Plants: A Project Developer’s Guide,” International Finance Corporation, June, 2015; Dirk-Jan van de Ven et al., “The Potential Land Requirements and Related Land Use Change Emissions of Solar Energy,” Scientific Reports, vol. 11 (2021), p. 2907.
135 Turney and Fthenakis, “Environmental Impacts;” Elnaz Adeh et al., “Solar PV Power Potential Is Greatest over Croplands,” Scientific Reports, vol. 9 (2019), p. 11442.
136 Lawrence Susskind et al., “Sources of Opposition to Renewable Energy Projects in the United States,” Energy Policy, vol. 165 (2022); Alex Brown, “Locals Worry Wind and Solar Will Gobble Up Forests and Farms,” Stateline, an initiative of the Pew Charitable Trusts, April 30, 2021, https://www.pewtrusts.org/en/research-and-analysis/blogs/stateline/2021/04/30/locals-worry-wind-and-solar-will-gobble-up-forests-and-farms; Samantha Gross, “Renewables, Land Use, and Local Opposition in the United States,” Brookings Institution, January 2020, https://www.brookings.edu/wp-content/uploads/2020/01/FP_20200113_renewables_land_use_local_opposition_gross.pdf.
137 Mike Carroll, “Considerations for Transferring Agricultural Land to Solar Panel Energy Production,” North Carolina State University, Cooperative Extension, 2022, https://craven.ces.ncsu.edu/considerations-for-transferring-agricultural-land-to-solar-panel-energy-production/.
138 Susskind et al., “Sources of Opposition.”
Congressional Research Service
27
link to page 32 link to page 16 Solar Energy: Frequently Asked Questions
power.139 Land that has already been affected by human development will experience lesser or no additional impacts compared to a project on undeveloped land. Additionally, land that has already been developed to some degree may have lower infrastructure costs. These disturbed lands or land cover types can include airport land, landfills, former industrial sites such as sand and gravel pits, and former mine lands. The 117th Congress enacted legislation that provides incentives for developing solar on some of these types of lands.140 A second approach to mitigation is dual-use solar: incorporating solar power such that it allows for a second, simultaneous use of the land. Dual use is explained next.
What Is Dual-Use Solar Power?141 Dual uses of land for solar power include widely implemented uses such as rooftop installations and parking lot covers but also include developing applications such as agrivoltaics and aquavoltaics.
Agrivoltaics is the co-location of solar and farming or grazing such that they will not impede either application. As discussed in the section “What Are Potential Impacts of Solar Energy Development on Agriculture?,” not all uses of agricultural land for solar are dual use.
Agrivoltaics require additional design considerations—such as the spacing, height, and orientation considerations mentioned above—which can increase costs. Some designs require deeper foundations or more steel for the elevated panel structures. Additionally, not all crops or animals are compatible with the panel structures or would benefit from shading, and not all climate or weather conditions produce increased crop yields.
Aquavoltaics is the co-location of solar power and water.142 This can include solar panels mounted over bodies of water including canals, water treatment ponds, hydroelectric reservoirs, and irrigation reservoirs; over aquaculture farms including in rivers, lakes, or tanks; or “floatovoltaics” or “floating solar”—floating solar panels on pontoons on the surface of the water or just under the water’s surface (see Figure 8). The solar panel shade reduces evaporation from the water, reducing loss from the reservoirs or canals or decreasing makeup water costs for the aquaculture applications.143 The shade can also reduce biofouling or the growth of unwanted species—such as algae in aquaculture or aquatic weeds in canals or reservoirs. The panels may have improved energy conversion efficiency from reduced temperatures, with submerged floatovoltaics seeing the largest increases.144 The power generated can also supply the energy needs of the aquaculture farms such as for aerating the water or pumping. Solar panels over 139 Jordan Macknick et al., “Solar Development on Contaminated and Disturbed Lands,” NREL, December 2013, https://www.nrel.gov/docs/fy14osti/58485.pdf.
140 Federal policy encourages solar energy development in certain disturbed lands—for example, by providing a bonus tax credit to projects located on brownfield sites and other “energy communities.” See section “Solar Deployment” in this report.
141 Morgan Smith, Analyst in Energy Policy, was the author of this section. 142 Adam Pringle, R. M. Handler, and J. M. Pearce, “Aquavoltaics: Synergies for Dual Use of Water Area for Solar Photovoltaic Electricity Generation and Aquaculture,” Renewable and Sustainable Energy Reviews, vol. 80, December 2017.
143 Some aquaculture sites, such as shrimp farms, already include greenhouse-like structures to reduce contamination of the water. They can be adapted with solar panels. Brandi McKuin, et al., “Energy and Water Co-benefits from Covering Canals with Solar Panels,” Nature Sustainability, vol. 4, March 18, 2021.
144 Submerged floatovoltaics get additional efficiency benefits from reduced temperatures, more consistent temperatures, the prevention of dust buildup on their surfaces, and anti-reflectivity. Water on the surface of the panel has a reduced index of refraction difference between the panel and water compared to the typical configuration of a panel and the air, which reduces how much light reflects off the surface. Pringle, Handler, and Pearce, “Aquavoltaics.”
Congressional Research Service
28
link to page 7
Solar Energy: Frequently Asked Questions
canals, particularly those used for irrigation, can provide electricity for pumping or other irrigation needs within the canals or in adjacent farmland.
Figure 8. Diagram of a Floating Solar Photovoltaic System
Source: Sika Gadzanku et al., “Benefits and Critical Knowledge Gaps in Determining the Role of Floating Photovoltaics in the Energy-Water-Food Nexus,” Sustainability (2021). Notes: Figure available via Creative Commons Attribution 4.0 International.
As with agrivoltaics, researchers are still determining the costs and benefits of aquavoltaic applications. The added costs and challenges are related to additional panel infrastructure and maintenance, and the impacts on the primary water uses might render some aquavoltaic applications as non-viable either economically or ecologically.
What Are Potential Impacts of Solar Energy Development on Agriculture?145 As solar energy deployment has increased (see Figure 2), agricultural land has become increasingly desirable for siting utility-scale solar PV systems (i.e., solar farms) for electrical generation. One concern that some raise about solar farm development is that siting solar arrays on agricultural lands can displace agricultural production.146Additionally, leasing land for utility-
145 Lisa Benson, Analyst in Agricultural Policy, was the author of this section. 146 It takes about 32 acres of solar PV panels to meet the demands of 1,000 homes. See Land-Use Requirements for Solar Power Plants in the U.S., NREL/TP-6A20-56290, June, 2013. Under a DOE scenario, U.S. solar PV deployment is predicted to grow to an estimated 1,618 GW by 2050, requiring an estimated 6.6 million acres of land, approximately equivalent to the size of Massachusetts. See Megan Day, Land Use Planning for Large-Scale Solar, NREL/PR-7A40-72470. September 27, 2018.
Congressional Research Service
29
link to page 31 link to page 31 Solar Energy: Frequently Asked Questions
scale solar often provides greater revenue than leasing for food production,147 so it can drive up land rents and land prices. Finally, in some cases it may be prohibitively expensive to restore the land to agricultural production after the termination of the project.148
While some individual farm operations develop PV arrays through their own investments in solar technologies as an income supplement or as an on-site energy source for their farming operations, private solar development companies have increasingly turned to long-term leasing arrangements with farmers to site PV arrays. Farmers benefit from the lease and solar developers get access to land on which to site these installations. Prime agricultural lands often represent very large tracts of land in potentially suitable locations. As important as large tracts of acreage may be, other variables determine whether a particular site is appropriate for a PV array. The terrain, local weather factors, proximity to grid connections, local transmission capacity, proximity to main roads, conservation and environmental impact issues, local/regional land use regulations, and flood risks all contribute to the suitability of a specific tract of agricultural land for a solar development company.
In potential lease arrangements, farmers are often interested in whether or not the PV array will curtail, if not completely end, their ability to continue farming. Typically, contractors constructing solar farms will strip the topsoil and then mount the PV panels on concrete footings. Not only does this remove the land from agricultural production during the period of the lease; it can become prohibitively expensive to restore the land to production after a lease terminates. The concern that the agricultural land can be permanently lost to production even after a lease ends is a factor when considering whether to maximize energy capacity on land at the expense of agricultural production. Suitable land where solar generation can be maximized will tend to be highly compensated relative to the potential return generated by the agricultural operation, which may pose a threat to retaining even highly productive agricultural land. Alternatively, while marginally productive agricultural acreage may be tilled, its yield potential is often quite low, and the environmental costs can be high (e.g., erodible soils). This type of acreage may be suitable for maximization of solar generation without posing a significant threat to overall agricultural production.
Under an alternative type of lease arrangement, solar energy development might occur without the loss of agricultural production. Under this arrangement, agricultural production may be possible under and around the solar systems. (See discussion in the section “What Is Dual-Use Solar Power?”149) The University of Massachusetts Amherst is researching agrivoltaic systems where PV arrays are raised high enough off the ground and spaced in a way that crops can grow and some livestock can graze around and beneath them while still allowing for economically viable solar development.150 In addition, researchers have found that co-locating solar PV arrays with some crops can be beneficial to them, particularly crops that are shade tolerant such as
147 Xander Peters, “Solar Energy Is a New Cash Crop for Farmers—When the Price Is Right,” Christian Science Monitor, October 4, 2021, https://www.csmonitor.com/Environment/2021/1004/Solar-energy-is-a-new-cash-crop-for-farmers-when-the-price-is-right.
148 A typical lease from a solar development company may have a term of 30-35 years. Mike Carroll, “Can Solar Energy Production Be Converted to Farmland?,” North Carolina State University, Cooperative Extension, September 9, 2022, https://craven.ces.ncsu.edu/2021/10/can-solar-energy-production-be-converted-to-farmland; Daniels and Wagner, “Regulating Utility-Scale Solar Projects on Agricultural Land.” 149 Cheryl Herrick, “Grazing and Solar Energy in Vermont’s Working Landscape,” press release, University of Vermont’s Center for Sustainable Agriculture, October 19, 2020. 150 Dwayne Breger, “UMass Amherst Study Will Assess Impact of Dual-Use Solar-Agriculture Installations in Massachusetts,” press release, University of Massachusetts Amherst, December 2, 2020.
Congressional Research Service
30
Solar Energy: Frequently Asked Questions
lettuce.151 For instance, the arrays can provide shade for the plants, which can maximize the benefits that plants receive from their water use while also reducing heat stress. In turn, the crops underneath the PV arrays engage in transpirational cooling, which reduces the temperature underneath the arrays and can lead to greater efficiency of the arrays.152
Fear of a decline in agricultural production may be an important factor for some critics of solar development, particularly where the value of the land for solar exceeds its current value for agriculture. Research examining the impact on agricultural yields of solar development could prove important to informing future investment in solar generation.153 State and federal grants to support development of dual-use agrivoltaic systems, such as the Solar Massachusetts Renewable Target, could help offset any reductions in agricultural production due to solar panel installations.154 The AgriSolar Clearinghouse compiles resources on these topics for researchers and project developers.155
Because U.S. agricultural land often enjoys favorable property tax treatment, different states/regions may establish regulations governing the use of agricultural lands for nonagricultural purposes. Local and regional planning commissions can constrain solar development and may require various permits and clearances that could challenge the longer-term economic feasibility of solar development, regardless of the suitability of the land for solar deployment. For example, Ohio specifically allows local regulators to bar utility-scale solar development or to designate prohibited areas, while Florida expressly permits solar development in county agricultural zoning districts. Most states leave zoning and permitting up to local commissions or governments, which may ban it, allow it, or allow it with exceptions or exemptions.156 Successfully co-locating agricultural production with solar development could reduce some of the land use planning constraints—or outright prohibitions—that may apply to productive agricultural lands that are targeted for solar development.
151 Greg A. Barron-Gafford et al., “Agrivoltaics Provide Mutual Benefits Across the Food-Energy-Water Nexus in Drylands,” Nature Sustainability, vol. 2 (September 2, 2019), pp. 848-855. 152 Transpiration occurs in plants when they experience warm conditions and dissipate heat through their leaves. To learn more, see Hua Lin et al., “Stronger Cooling Effects of Transpiration and Leaf Physical Traits of Plants from a Hot Dry Habitat Than from a Hot Wet Habitat,” Functional Ecology, vol. 31 (May 26, 2017).
153 Some research has shown that varieties of lettuce, tomatoes, pasture grass, and biogas maize produce greater yields in the shade than under full sunlight. See Adeh et al., “Solar PV Power Potential Is Greatest over Croplands.”
154 This program aims to create a long-term solar incentive program in the commonwealth. See Commonwealth of Massachusetts, “Solar Massachusetts Renewable Target (SMART),” https://www.mass.gov/solar-massachusetts-renewable-target-smart.
155 National Center for Appropriate Technology, “AgriSolar Clearinghouse,” 2022, https://www.agrisolarclearinghouse.org/.
156 Daniels and Wagner, “Regulating Utility-Scale Solar Projects on Agricultural Land.”
Congressional Research Service
31
Solar Energy: Frequently Asked Questions
Author Information
Ashley J. Lawson, Coordinator
Morgan Smith
Analyst in Energy Policy
Analyst in Energy Policy
Molly F. Sherlock
Lisa S. Benson
Specialist in Public Finance
Analyst in Agricultural Policy
Manpreet Singh
Analyst in Industrial Organization and Business
Disclaimer
This document was prepared by the Congressional Research Service (CRS). CRS serves as nonpartisan shared staff to congressional committees and Members of Congress. It operates solely at the behest of and under the direction of Congress. Information in a CRS Report should not be relied upon for purposes other than public understanding of information that has been provided by CRS to Members of Congress in connection with CRS’s institutional role. CRS Reports, as a work of the United States Government, are not subject to copyright protection in the United States. Any CRS Report may be reproduced and distributed in its entirety without permission from CRS. However, as a CRS Report may include copyrighted images or material from a third party, you may need to obtain the permission of the copyright holder if you wish to copy or otherwise use copyrighted material.
Congressional Research Service
R46196 · VERSION 3 · UPDATED
32 requirements or extra incentives for solar.51
How Are U.S. Tariffs Affecting Domestic Solar Manufacturing?52
The United States has applied tariffs on imports of solar energy equipment since 2012. The different types of equipment comprising a solar PV system are discussed in the section "How Does Solar Energy Work?"
- The Obama Administration imposed double- and triple-digit antidumping and countervailing duty tariffs on U.S. imports of solar cells and modules from China in 2012 and 2015 and on imports from Taiwan in 2015.53
- The Trump Administration imposed a tariff, which started at 30% in 2018 and declines by 5% yearly until reaching 15% in 2021, on photovoltaic solar cells and modules from most countries. The tariff includes some exemptions, such as an annual 2.5 gigawatt (GW) tariff-free quota for solar cells as long as the final module assembly takes place in the United States. Several dozen developing countries are excluded from the tariff as long as their import levels stay small,54 and certain technologies, such as thin-film solar PV products or smaller crystalline silicon PV cells, are not subject to the tariff.55 This tariff is scheduled to expire in February 2022, but it may be extended, at the President's discretion, for up to four additional years. It is assessed on top of the previously existing tariffs on Chinese and Taiwanese producers, leading to tariff rates as high as 239% on some PV products made in China.56
- In 2018, the Trump Administration placed a 25% duty on steel and a 10% duty on aluminum imported from most countries. These duties affect BOS equipment, such as PV brackets, module frames, cabling, power electronics housing, batteries, and wiring,57 and are projected to add 2% - 5% to PV system costs.58
- Additional tariffs on a long list of Chinese products, including inverters and other solar equipment, were imposed at a 10% rate in September 2018. The rate was raised to 25% in May 2019.59
The tariff effects have not been felt evenly across the solar industry's manufacturing segments (i.e., polysilicon production, ingot and wafer production, solar cell production, and module assembly). To date the tariffs have not encouraged expansion of U.S. manufacturing in the more technologically advanced segment of the PV manufacturing supply chain, namely the production of crystalline-silicon solar cells. However, U.S. production of solar modules, into which cells are assembled, rose in 2018, and a few companies, including one Chinese manufacturer, have opened solar module assembly plants in the United States. The increased domestic production of modules draws on imported parts and components, reflecting the industry's global supply chain.
U.S. solar tariffs have negatively affected the one segment of the PV supply chain in which the United States traditionally has been the most competitive, the production of polysilicon, the key raw material used in the manufacture of the vast majority of solar cells. China retaliated against the Obama Administration tariffs by imposing double-digit tariffs on polysilicon shipped from the United States to China, which had been a significant export market for U.S. producers. These tariffs have had an adverse effect on U.S. production of polysilicon, which shrank 40% between 2015 and 2018.60 The U.S. share of global polysilicon production is also down, falling to 11% of the global total in 2017 from 29% in 2010.61 The production of wafers made from polysilicon, which in turn are cut to make individual cells, has largely been discontinued in the United States,62 with China accounting for more than 80% of global wafer production in 2017.63
Solar cell production has significant economies of scale, so manufacturers generally centralize production in large plants. As shown in Figure 5, annual domestic U.S. PV cell production shrank to 124 megawatts (MW) in 2018, the lowest level since 2010.64 Domestic manufacturers of PV modules import nearly all of their solar cells, which represent a substantial portion of the cost and value of a finished module (27% in Q4 2018, according to Wood Mackenzie, an energy consultancy).65 China accounted for more than two-thirds of the world's solar cell production in 2017.66
Annual U.S. Production in Megawatts (MW) |
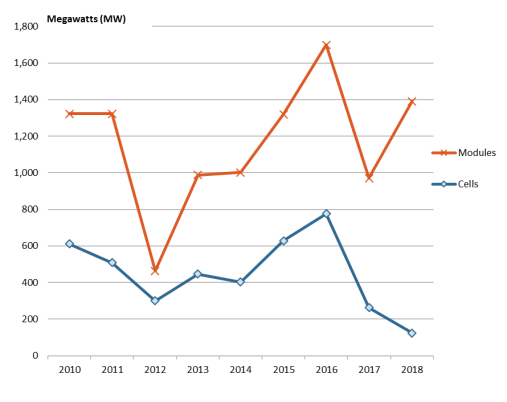 |
|
Despite the various trade actions in 2018, solar cell prices in the United States declined from 20 cents per watt at the beginning of that year to 10 cents per watt at year-end 2018, which represented a 50% decrease in cost.67 Meanwhile, figures from the United States International Trade Commission (ITC) show U.S. imports of solar cells more than doubled by value from 2016 to 2018. This trend continued despite the additional tariffs on solar cells and modules that took effect in 2018, with U.S. imports of solar cells rising 32% during the first seven months of 2019 compared to the same period in 2018.68
One possible reason for the rise in cell imports is that the Trump Administration's solar tariff allows up to 2.5 GW of unassembled solar cells to be imported into the United States duty-free each year the tariff is in effect. These can then be assembled into solar modules in the United States.69 From February 2018 to the end of 2018, about a quarter, or 650 MW, of the duty-free tariff rate quota was filled. The low fill rate during the first year may be because there was not enough module assembly capacity in the United States to use those cells, and because some PV cells were stockpiled prior to the imposition of the tariff. If the 2.5 GW quota is reached in any year, foreign-made cells will be subject to U.S. tariffs for the balance of that year.
The uncertainty surrounding the tariffs limits the incentive to expand solar cell production in the United States. For example, the Trump Administration's solar tariff is initially set to last four years, with the tariff rate declining by five percentage points in each year the tariff is in effect.70 The other tariffs may be discontinued at the President's discretion. A new cell factory would need a large capital investment and about two years to construct. The possibility that some or all of the tariffs will be eliminated in the near future may discourage creation of new manufacturing capacity.71 At present, Panasonic is the only major domestic producer of crystalline-silicon solar cells, and several producers of solar cells have closed U.S. plants since 2012.72
Unlike cell production, domestic module assembly is growing. A count by the Solar Foundation, a trade group, indicates that approximately 20 factories assembled PV modules in the United States in 2018.73 Annual U.S. PV module production increased to 1.4 GW in 2018, up from 970 MW in 2017, but down from a record high of 1.7 GW in 2016, the year the federal investment tax credit had been set to expire (see Figure 5).74 It typically takes about six months to construct a new solar-module assembly facility and begin operation at scale. PV Magazine, an industry publication, reported that 3.9 GW of new module manufacturing capacity was under construction or had recently come online as of late 2018.75 Hanwha Q Cells, a South Korean company, and Jinko Solar, a Chinese company (the largest module producer in the world), have opened new module-assembly facilities in the United States.76 A Canadian company, Heliene, reopened a shuttered solar module facility in Minnesota.77 NREL reports that several additional solar companies expect to add another 4 GW of U.S. module assembly capacity.78
In 2017, China accounted for more than 70% of total global module production.79 One challenge for domestic producers is that U.S. module facilities are smaller than the most efficient plants in Asia, meaning they generally lack the economies of scale that are central in driving down unit costs. The two companies—SolarWorld and Suniva—that petitioned the Trump Administration to put tariffs on imported cells and modules have both ceased production.
Because U.S. tariffs are much higher on imports from China and Taiwan than on products of other countries, the tariffs have encouraged manufacturers of cells and modules to serve the U.S. market from other Asian countries. PV module shipments into the United States from Malaysia, South Korea, Vietnam, Mexico, and Thailand have largely replaced module imports from China, which shrank to less than 1% of total U.S. imports by 2018. These five countries accounted for nearly 85% of $2.8 billion in PV modules imported into the United States in 2018.80
Inverters made in China now face a 25% U.S. tariff. To avoid the U.S. tariff, two large suppliers of inverters to the U.S. market are reportedly planning to shift production from China to other locations.81 According to the Solar Energy Industries Association (SEIA), U.S. inverter production is declining, primarily due to the closure of two major U.S. facilities at the end of 2016.82 Backsheets and junction boxes are other examples of solar energy components needed for solar panel assembly, and they are also among the products that face a 25% tariff if they are imported from China.83
Module prices globally have declined steeply over the past decade. While prices in the U.S. market have fallen as well, despite the tariffs on imported cells and modules, they remained 61% higher, on average, than the global average selling price in 2018, according to NREL.84 One factor contributing to this price differential is the preference of U.S. purchasers for Tier 1 solar modules, which may be 10% to 30% more expensive and may be more reliable than Tier 2 and Tier 3 solar modules, although they may not necessarily be the best-performing modules on the market.85 Projects using Tier 1 modules may be easier to finance than those using modules not classified as Tier 1.
What U.S. Jobs Are Supported by the Solar Industry?86
The federal government does not collect data on employment in the solar energy industry. According to a report by the Solar Foundation, the industry provided 242,300 full-time equivalent jobs in 2018 (Figure 6).87 Of these positions, 85% involved work other than manufacturing, such as installation of solar systems and project management, wholesale trade and distribution, and operations and maintenance.
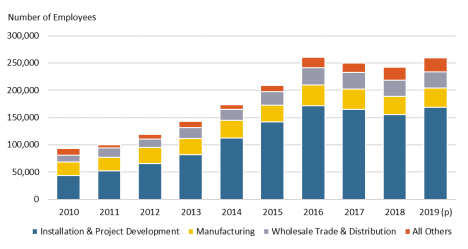
Most employment in the solar energy industry—64% in 2018—involves two solar sectors, the installation of solar systems and project development, whether on rooftops of individual homes or larger projects. Although the federal government does not track employment specific to the solar energy industry, the Bureau of Labor Statistics (BLS) publishes occupational data for solar PV installers. These data indicate that employment in PV installation may be significantly lower than the figures reported by SEIA for the combined solar installation and project development segment of the industry. BLS predicts the overall employee occupational count for solar PV installers of 9,700 workers in 2018 will rise by 63% to 15,800 jobs in 2028.88 BLS predicts that solar installation will be the fastest-growing occupation in the nation over the next decade. BLS reports the median pay for a PV installer in 2018 was $42,680 per year, or $20.52 per hour, about 13% above the national median for all workers.89
At the end of 2018, the number of solar jobs as reported by the Solar Foundation was approximately 7% lower than in 2016, with installation jobs accounting for most of the decline. The annual number of PV systems installed in the United States shrank 14% to about 327,000 in 2018 from approximately 380,000 in 2016.90
Direct employment in U.S. solar manufacturing was about 34,000 workers in November 2018, according to the Solar Foundation, accounting for about 14% of total employment related to the solar energy sector. The number of reported jobs dropped by 4,400 from November 2016. One reason for the decline may be that the tariffs raised the cost of foreign inputs that are assembled into solar systems in U.S. factories, making those factories' products more expensive.
Due to automation, a significant increase in employment in U.S. solar manufacturing is considered to be unlikely. One market research firm says module manufacturing accounted for about 1,200 U.S. jobs in 2018, but is projected to fall to just over a 1,000 workers by 2024.91 A review of publicly available information by CRS suggests that there are fewer than 2,000 workers involved in domestic polysilicon production. There is also limited employment related to the assembly of solar factory production equipment for wafers, cells, and modules in the United States because this equipment is made mainly in Europe and China.
What Land Requirements Does Solar Energy Have?92
Land is required for the extraction, production, and consumption of energy and for the generation, transmission, and distribution of electricity. There is not a generally accepted standard metric or methodology for a comparison of land use impacts across energy technologies.93 Different studies evaluate land use in different ways and may or may not account for upstream and downstream process steps associated with electricity generation (e.g., extraction of fuels or resources used for electricity generation), for the intensity of the impact of the activity on the occupied land, or for the time-to-recovery.94 Other factors that may not be incorporated into comparisons include location-dependent factors, such as solar incidence, or co-location of different activities with the energy generation, such as solar panels on rooftops.
Estimates of power density for different energy sources vary by methodology and technology type studied. Some estimates consider the area of the power plant only, while others include land areas used for fuel production, electricity transmission, waste disposal, or other factors. Estimates can change with time as technology innovation leads to increased energy efficiency; such is the case for solar energy, with newer and more efficient technologies leading to increased power density.
When considering total land area occupied, renewable energy sources generally require more land to produce the same amount of electricity than nonrenewable sources.95 One metric used in the energy sector that accounts for land use is power density, which can be expressed as a unit of power per unit of area (e.g., watts per square meter). A review of 54 studies which examined the power density of electric power production in the United States found that solar energy has a lower power density than natural gas, nuclear, oil, and coal, but solar energy has a higher power density than wind, hydro, biomass, and most geothermal.96 The review accounted for energy conversion efficiencies, capacity factors, and infrastructure area, including infrastructure associated with energy production (e.g., mines). The review did not control for time, reporting that the earliest study included in the analysis was from 1974; however, the review concluded that, of the nine energy types evaluated, only solar had a statistically significant relationship between power density and time.97 Published values for power density for solar systems range from 1.5 to 19.6 We/m2.98 Generally, solar thermal and utility-scale photovoltaic (PV) were found to require more land area to produce the same amount of electricity than residential PV and concentrated solar. While the technology for residential PV and utility-scale PV is similar, sloped rooftops may allow more sunlight to reach otherwise flat panels for residential systems, and the spacing of panels at utility-scale facilities (regardless of tilt) to provide for maintenance and to avoid shading may lead to lower power densities.99 Another review found that both location-dependent parameters and technology-dependent parameters affect the variability of land use energy intensity of solar electricity generation.100
In addition to power density, other factors may be relevant when evaluating energy sources and land use. Two examples are land use and land cover change, which account for the previous state of the land before an energy project was developed.101 In the case of solar, some solar energy systems may change land use and land cover to a smaller degree than others. For example, rooftop solar PV systems do not change how the underlying land is used or covered. Another factor is co-location of activities where land can be occupied but not used exclusively by its occupier. For example, farming and grazing can occur on land around wind turbines and underneath solar panels (this dual-use solar is referred to as "agrivoltaics"). Time-to-recovery is another factor to consider. Some technologies may impact land such that the land can recover to its previous state after use in a matter of months or a few years; other technologies may impact the land in such a way that it may take decades or centuries for the land to recover to its previous state. According to the Department of Energy, "further work is critically needed to determine appropriate land-use metrics for meaningful cross-comparisons."102
What Are Potential Impacts of Solar Energy Development on Agriculture?103
Agricultural land has become increasingly desirable for siting utility-scale solar PV systems (i.e., solar farms) for electrical generation. One concern that some raise about solar farm development is that siting solar arrays on agricultural lands can also displace agricultural production.104 With solar generation capacity in the United States increasing from less than 1 GW in 2010 to 50 GW in 2018, demand for large tracts of reliably sunlit, cleared, unobstructed acreage is also growing.105 California, North Carolina, Texas, and Florida had the largest U.S. cumulative solar capacity in the third quarter of 2019, with California the largest.106
While some individual farm operations develop PV arrays through their own investments in solar technologies as an income supplement or as an on-site energy source for their farming operations, private solar development companies have increasingly turned to long-term leasing arrangements with farmers to site PV arrays. Farmers benefit from the lease and solar developers get access to the scarce commodity of land. Prime agricultural lands often represent very large tracts of land in potentially suitable locations. As important as large tracts of acreage may be, other variables determine whether a satisfactory lease is negotiated. The quality of the terrain, local weather factors, proximity to grid connections, local transmission capacity, proximity to main roads, conservation and environmental impact issues, local/regional land use regulations, and flood risks all contribute to the suitability of particular agricultural acreage for a solar development company.
In potential lease arrangements, farmers are often interested in whether or not the PV array will curtail, if not completely end, their ability to continue farming. Typically, contractors constructing solar farms will strip the topsoil and then mount the PV modules on concrete footings. Not only does this remove the land from agricultural production during the period of the lease, it can become prohibitively expensive to restore the land to production after a lease terminates.107 The concern that the agricultural land can be permanently lost to production even after a lease ends is a factor when considering whether to maximize energy capacity on land at the expense of agricultural production. Suitable land where solar generation can be maximized will tend to be highly compensated relative to the potential of the agricultural operation. For example, while marginally productive acreage may be tilled, its yield potential is often quite low, and the environmental costs can be high (e.g., erodible soils). This type of acreage may be suitable for maximization of solar generation without significant threat to overall agricultural production.
Under other lease arrangements, solar energy development might occur without detriment to farming. While the land is attractive for siting solar PV arrays, it is also valuable as productive farmland. In these arrangements, vegetation growth may be possible under and around the solar system. The University of Massachusetts Crop Research and Education Center is exploring agrivoltaics, where modules are raised high enough off the ground and spaced in a way that crops can still grow around and beneath them, but also permit an economically viable solar development.108 Fear of a decline in agricultural production may be an important factor in some opposition to solar development, particularly where the value of the land for solar exceeds the current value for agriculture. Research examining the impact on agricultural yields of solar development could prove important to informing future investment in solar generation.109 State and federal grants to support development of dual-use agrivoltaic systems, such as the Solar Massachusetts Renewable Target (SMART), could help offset these systems' additional costs.110
Because U.S. agricultural land often enjoys favorable property tax treatment, different states/regions may establish regulations governing the use of agricultural lands for nonagricultural purposes. Local and regional planning commissions can constrain solar development, and may require various permits and clearances that could challenge the longer-term economic feasibility of the solar development, regardless of the suitability of the land for solar deployment. Successfully co-locating agricultural production with solar development could reduce some of the land use planning constraints—or outright prohibitions—that may come with productive agricultural lands proposed for solar development.
Author Contact Information
Footnotes
| 1. |
Ashley Lawson, Analyst in Energy Policy, and Michaela D. Platzer, Specialist in Industrial Organization and Business, authored this section. |
| 2. |
For further discussion on solar PV technologies, see National Renewable Energy Laboratory (NREL), Solar Photovoltaic Technology Basics, https://www.nrel.gov/research/re-photovoltaics.html. |
| 3. |
Michael Woodhouse et al., Crystalline Silicon Photovoltaic Module Manufacturing Costs and Sustainable Pricing: 1H 2018 Benchmark and Cost Reduction Road Map, NREL, February 2019. |
| 4. |
Capacity is a measure of the maximum potential output of an electricity generator, measured in watts (W). Actual output is typically less than the maximum potential. One estimate of utility-scale solar PV systems installed in the United States as of 2017 found that actual output ranged from 14.3% to 35.2% of the maximum potential output, depending on a variety of system-specific factors. Mark Bolinger and Joachim Seel, Utility-Scale Solar: Empirical Trends in Project Technology, Cost, Performance, and PPA Pricing in the United States - 2018 Edition, Lawrence Berkeley National Laboratory (LBNL), September 2018, p. 23. |
| 5. |
Balance of system (BOS) equipment is sometimes called balance of plant (BOP) equipment. |
| 6. |
Generally, tracking systems can be installed only on ground-mounted systems. In other words, rooftop systems do not typically include tracking systems. |
| 7. |
For a discussion of energy storage systems, see CRS Report R45980, Electricity Storage: Applications, Issues, and Technologies, by Richard J. Campbell. |
| 8. |
This report provides illustrative capacity thresholds because the industry does not have established capacity thresholds. For example, some analysis defines 1 MW as the minimum size for utility-scale projects, while other analysis uses 5 MW. Also, the industry has not reached consensus on whether capacity is the best metric for categorizing projects. This report uses capacity for consistency with the data shown throughout. Other analyses may define utility-scale projects based on agreements for how the electricity will be purchased (e.g., power purchase agreement versus net metering). Another option is to use total project cost as the defining characteristic. See Mark Bolinger and Joachim Seel, September 2018. |
| 9. |
For an overview, see DOE, Concentrating Solar Power Thermal Storage System Basics, August 21, 2013. |
| 10. |
|
| 11. |
Ashley Lawson, Analyst in Energy Policy, was the author of this section. |
| 12. |
|
| 13. |
Ashley Lawson, Analyst in Energy Policy, was the author of this section. |
| 14. |
Solar PV systems produce direct current (DC) electricity, which must be converted to alternating current (AC) electricity for use. Some power is lost during this conversion process, so the same system will have a different capacity rating (i.e., size) depending on whether it is reported as DC or AC. |
| 15. |
Labor costs for a project are different from total wages received by a worker. NREL identifies one factor for declining labor costs over this time period as more efficient PV modules. Increased efficiency means that fewer panels must be installed to generate the same amount of electricity. This lowers labor costs, on a per-watt installed basis, because fewer hours of labor are required. |
| 16. |
Ashley Lawson, Analyst in Energy Policy, was the author of this section. |
| 17. |
For example, see Mark Bolinger and Joachim Seel, September 2018, p. 41. |
| 18. |
The different organizations that produce LCOE estimates use different assumptions about future fuel costs, power plant production levels, maintenance costs and other factors, which can result in different LCOE estimates. LCOE has limitations in its applicability. For example, LCOE estimates typically do not account for transmission systems or other infrastructure that may be required to produce and deliver electricity. Consumer-facing prices, which can be very different from LCOE estimates, may be more relevant for some policy debates. |
| 19. |
Lazard, Lazard's Levelized Cost of Energy Analysis—Version 13.0, November 2019, https://www.lazard.com/media/451086/lazards-levelized-cost-of-energy-version-130-vf.pdf. While LCOE can be indicative of the relative cost competitiveness of technology types, every power plant's actual costs will depend upon local circumstances (e.g., regional differences in fuel costs, solar resource quality). |
| 20. |
See Joachim Seel, Andrew Mills, and Ryan Wiser, Impacts of High Variable Renewable Energy Futures on Wholesale Electricity Prices, and on Electric-Sector Decision Making, Lawrence Berkeley National Laboratory, May 2018. A few regions of the country are beginning to experience this reduction in the effect of solar on the region's marginal electricity costs, especially during midday periods. It is distinct from the "duck curve" situation described in the section "Is Solar Energy Reliable?," although many proposed options for addressing one would likely also address the other. |
| 21. |
Non-solar customers might experience bill impacts too, such as higher electricity rates resulting from lost utility revenue from solar customers. This cost shift and other issues are discussed in CRS Report R46010, Net Metering: In Brief, by Ashley J. Lawson. |
| 22. |
Ashley Lawson, Analyst in Energy Policy, was the author of this section. |
| 23. |
For further discussion see CRS In Focus IF11257, Variable Renewable Energy: An Introduction, by Ashley J. Lawson. |
| 24. |
This mismatch and potential reliability concern have been recognized since at least 2008, but the term "duck curve" was popularized by a 2013 analysis by the California Independent System Operator (CAISO). NREL, Ten Years of Analyzing the Duck Chart, February 26, 2018. |
| 25. |
Julia Pyper, "Electric Ridesharing Benefits the Grid, and EVgo Has the Data to Prove It," Greentech Media, May 9, 2019, https://www.greentechmedia.com/articles/read/electric-ridesharing-benefit-the-grid-evgo. |
| 26. |
Batteries and wind turbines are also inverter-based resources. Wind turbines do produce AC, but the quality is insufficient for the grid, so electricity from wind turbines is typically first converted to DC, then converted back to AC and delivered to the grid. |
| 27. |
Essential reliability services include inertia, frequency response, and voltage control. For more information about these services, and the physical factors underlying them, see Federal Energy Regulatory Commission, Reliability Primer, 2016. |
| 28. |
Some examples are provided in CRS Report R45764, Maintaining Electric Reliability with Wind and Solar Sources: Background and Issues for Congress, by Ashley J. Lawson. |
| 29. |
For example, in 2016, a solar farm in Southern California stopped production after a wildfire caused a disturbance at another part of the electricity transmission system. Analysis of the event showed that the inverter's design was responsible for the loss of power. Changes made since the event are meant to prevent similar occurrences in the future, but the event highlights how system operators are still evolving in their approach to maintaining reliability as solar energy is deployed to a larger extent. See North American Electric Reliability Corporation, 1,200 MW Fault Induced Solar Photovoltaic Resource Interruption Disturbance Report, June 2017. |
| 30. |
Molly F.Sherlock, Specialist in Public Finance, was the author of this section. |
| 31. |
The Energy Tax Act of 1978 (P.L. 95-618) included a temporary, refundable, 10% tax credit for solar energy property. As a refundable tax credit, the value of the tax credit could exceed a taxpayer's tax liability. To the extent that the tax credit exceeded tax liability, it would have been received as a refund (payment) from the Treasury. |
| 32. |
For a legislative history of the solar investment tax credit (ITC), see CRS In Focus IF10479, The Energy Credit: An Investment Tax Credit for Renewable Energy, by Molly F. Sherlock. For a legislative history of the tax credit for individuals, see Appendix B in CRS Report R42089, Residential Energy Tax Credits: Overview and Analysis, by Margot L. Crandall-Hollick and Molly F. Sherlock. |
| 33. |
Internal Revenue Code (IRC) §48. |
| 34. |
Taxpayers can establish start of construction by beginning physical work of a significant nature or by having incurred at least 5% of the property's total cost. Once construction begins, eligibility for tax credits requires that a taxpayer make continuous progress toward completion. For detailed information, see IRS Notice 2018-59, "Beginning of Construction for the Investment Tax Credit Under Section 48," available at https://www.irs.gov/pub/irs-drop/n-18-59.pdf. |
| 35. |
Generally, assets used in the production of electricity are recovered over a 20-year period. See IRS Publication 946 (2018), "How to Depreciate Property," available at https://www.irs.gov/publications/p946. |
| 36. |
IRC §168(e)(3)(B). |
| 37. |
The 2017 tax revision (P.L. 115-97, commonly referred to as the Tax Cuts and Jobs Act) included a temporary 100% bonus depreciation for qualified assets bought and placed in service between September 28, 2017, and December 31, 2022. This provision is not unique to solar, but it nonetheless reduces the after-tax cost of making investments in solar energy property. For more information on bonus depreciation generally, see CRS Report RL31852, The Section 179 and Section 168(k) Expensing Allowances: Current Law and Economic Effects, by Gary Guenther. |
| 38. |
IRC §25D. |
| 39. |
A taxpayer's residence includes any dwelling unit used as a residence by the taxpayer. It is not limited to property installed on the taxpayer's primary residence, so tax credits can be claimed for solar energy property installed on second or vacation homes. |
| 40. |
For more information, see CRS Report R42089, Residential Energy Tax Credits: Overview and Analysis, by Margot L. Crandall-Hollick and Molly F. Sherlock. |
| 41. |
Joint Committee on Taxation, Estimates of Federal Tax Expenditures for Fiscal Years 2019–2023, JCX-55-19, December 18, 2019, p. 21. Over the five-year period FY2019 to FY2023, JCT estimates that forgone revenue associated with the ITC for solar will be $20.8 billion. |
| 42. |
Taxpayers can also claim the residential energy-efficient property credit for solar water heating, small wind energy, geothermal heat pump, and fuel cell property. |
| 43. |
Data from the IRS Statistics of Income files are not directly comparable to JCT's tax expenditure estimates. Tax expenditures are estimates of the forgone revenue associated with a tax provision in a given fiscal year. The IRS Statistics of Income data are estimates based on tax returns filed for a given calendar year. |
| 44. |
Internal Revenue Service, Individual Income Tax Returns Line Item Estimates, 2017, Publication 4801 (Rev. 9-2019), 2018, pp. 132-133, https://www.irs.gov/statistics/soi-tax-stats-individual-income-tax-returns-line-item-estimates. |
| 45. |
Ibid. |
| 46. |
Ashley Lawson, Analyst in Energy Policy, was the author of this section. |
| 47. |
16 U.S.C. §824. |
| 48. |
|
| 49. |
Renewable portfolio standard policy design is discussed further in CRS Report R45913, Electricity Portfolio Standards: Background, Design Elements, and Policy Considerations, by Ashley J. Lawson. |
| 50. |
DSIRE, Renewable Portfolio Standard Policies, June 2019, http://ncsolarcen-prod.s3.amazonaws.com/wp-content/uploads/2019/07/RPS-CES-June2019.pdf. |
| 51. |
Galen Barbose, U.S. Renewable Portfolio Standards: 2019 Annual Status Report, Lawrence Berkeley National Laboratory, July 2019. |
| 52. |
Michaela D. Platzer, Specialist in Industrial Organization and Business, was the author of this section. |
| 53. |
See CRS Report R42509, U.S. Solar Photovoltaic Manufacturing: Industry Trends, Global Competition, Federal Support, by Michaela D. Platzer. |
| 54. |
The solar tariff excludes countries that are part of the Generalized System of Preferences (GSP) list as long as these individual countries account for less than 3%, or 9% collectively, of U.S. imports of solar cells in any given year. A few countries have been removed from the list; for example, Turkey and India were taken off in spring 2019. |
| 55. |
The U.S. Trade Representative recently announced that bifacial solar modules, which generate electricity on both sides, lost their exemption at the end of October 2019, a change that could benefit U.S.-based manufacturers such as First Solar and SunPower. |
| 56. |
Section 201 of the Trade Act of 1974 (19 U.S.C. §2251) provides temporary relief for a U.S. industry from import competition. See CRS In Focus IF10786, Safeguards: Section 201 of the Trade Act of 1974, by Vivian C. Jones. |
| 57. |
Section 232 of the Trade Expansion Act of 1962 (19 U.S.C. §1862, as amended) permits the President to levy tariffs and quotas on imports found to threaten or impair U.S. national security. Excluded from the Section 232 tariffs are several countries, including Canada, Mexico, and the European Union. |
| 58. |
David Feldman, Jack Hoskins, and Robert Margolis, Q4 2017/Q1 2018 Solar Industry Update, NREL, May 2018, p. 5. |
| 59. |
Section 301 of the Trade Act of 1974 (19 U.S.C. §2411-2420) allows the Office of the United States Trade Representative (USTR), at the direction of the President, to impose import restrictions if USTR determines that a foreign country's acts, policies, or practices are unreasonable and discriminatory. See CRS Report R45529, Trump Administration Tariff Actions (Sections 201, 232, and 301): Frequently Asked Questions, coordinated by Brock R. Williams. |
| 60. |
Solar Energy Industries Association (SEIA)/Wood Mackenzie Power & Renewables, U.S. Solar Market Insight, 2018 Year in Review, Full Report, March 2019, pp. 58-59. |
| 61. |
International Energy Agency Photovoltaic Power Systems Program (IEA-PVPS), Trends 2018 in Photovoltaic Applications, December 3, 2018, p. 55. |
| 62. |
According to NREL analysis, Panasonic, SolarWorld, and SunEdison had produced polysilicon ingots and wafers for the solar industry in the United States, but by 2017 each had halted all U.S. production of ingots and wafers. Robert Margolis, Daniel Feldman, and Daniel Boff, Q4 2016/Q1 2017 Solar Industry Update, NREL, April 25, 2017, p. 61. |
| 63. |
IEA-PVPS, Trends 2018 in Photovoltaic Applications, December 3, 2018, p. 56. |
| 64. |
Robert Margolis, David Feldman, and Daniel Boff, Q4 2016/Q1 2017 Solar Industry Update, NREL, April 25, 2017, p. 61, and SEIA/Wood Mackenzie, U.S. Solar Market Insight, 2018 Year in Review, March 2019, pp. 58-59. |
| 65. |
SEIA/Wood Mackenzie, March 2019, p. 60. |
| 66. |
IEA-PVPS, Trends 2018 in Photovoltaic Applications, December 3, 2018, p. 56. |
| 67. |
SEIA/Wood Mackenzie, U.S. Solar Market Insight, 2018 Year in Review, Full Report, March 2019, p. 60. |
| 68. |
CRS analysis of trade data by 10-digit Harmonized Tariff Schedule (HTS) uses codes 8541.40.6025 and 8541.40.6030 to compile solar cell data from the U.S. International Trade Commission's (ITC) dataweb. |
| 69. |
The quota does not have a country-by-country allocation; it is applied on a first-come, first-served basis. As of November 4, 2019, 63% of the quota was filled, according to U.S. Customs and Border Protection. The quota year is from February to February, not calendar or fiscal years. |
| 70. |
The solar tariff fell from 30% to 25% on February 7, 2019, declining 5% annually to 15% during the period from February 7, 2021 to February 6, 2022. |
| 71. |
Sunpreme announced plans to open a factory to produce bifacial cells and modules in Texas in 2019, but no other details about construction of the facility or when it will become operational are currently available. Also see, Julia Pyper, "Did Trump's Solar Tariffs Just Launch a US Manufacturing Renaissance?," GTM, January 24, 2018. |
| 72. |
United States International Trade Commission (USITC), Crystalline Silicon Photovoltaic Cells and Modules from China, Publication 4874, March 2019, p. III-2. |
| 73. |
The Solar Foundation, National Solar Jobs Census 2018, February 12, 2019, p. 39. |
| 74. |
Robert Margolis, David Feldman, and Daniel Boff, Q4 2016/Q1 2017 Solar Industry Update, NREL, April 25, 2017, p. 61; and SEIA/Wood Mackenzie, U.S. Solar Market Insight, 2018 Year in Review, March 2019, pp. 58-59. |
| 75. |
Christian Roselund and John Weaver, "2018 Solar Power Year in Review (Part 1)," PV Magazine, December 20, 2018. |
| 76. |
Besides Hanwha Q Cells' new manufacturing plant in Georgia, the company assembles modules in South Korea, Malaysia, and China. Jinko Solar, the first China-based solar manufacturer to locate a module assembly factory in the United States, also assembles solar modules in China and Malaysia. According to press reports, Jinko Solar has said that it will import cells from Malaysia, not China, for its factory in Florida. |
| 77. |
See Emma Foehringer Merchant, "The Status of US Solar Manufacturing, One Year After Tariffs," Green Tech Media, February 25, 2019. |
| 78. |
David Feldman and Robert Margolis, Solar Industry Update, Q4 2018/Q1 2019, NREL, May 2019, p. 56. |
| 79. |
IEA-PVPS, Trends 2018 in Photovoltaic Applications, December 3, 2018, p. 56. |
| 80. |
CRS analysis of trade data by 10-digit Harmonized Tariff Schedule (HTS) uses codes 8541.40.6015, 8541.40.6020, and 8541.40.6035, to compile module data from the ITC's dataweb. |
| 81. |
Every major inverter manufacturer makes its solar inverters outside the United States, primarily in China. According to Wood Mackenzie, California-based Enphase and Israeli-based SolarEdge supplied 89% of the U.S. market for inverters last year. SolarEdge makes its products in China and operates an inverter factory in Hungary. It also has plans for a new manufacturing site in Vietnam. Enphase expects to move some inverter manufacturing from China to Mexico. Separately, China's Huawei, which makes solar inverters and accounted for more than one-fifth of the global market in 2018, has ceased U.S. sales, according to press reports, after about a dozen Members of Congress called for its inverters to be banned from the U.S. electricity network. Wood Mackenzie says Huawei represented around 4% of the U.S. market. |
| 82. |
SEIA/Wood Mackenzie, U.S. Solar Market Insight, 2017 Year in Review, March 2018, pp. 57-58. |
| 83. |
Backsheets are intended to electrically insulate the module and protect it from moisture, wind, and ultraviolet light damage, and a PV junction box housing electrical connections is an enclosure usually installed on the backside of a solar module. The majority of junction boxes are made in China. |
| 84. |
David Feldman and Robert Margolis, Q4/Q1 2019 Solar Industry Update, NREL, May 2019, p. 60. |
| 85. |
Tier 1 solar module manufacturers include Sunpower, LG, and Jinko. The Tier 1 designation was developed by Bloomberg New Energy Finance as a guide to banks in lending for solar products. In general, Tier 1 modules are those produced by vertically integrated companies that have been in business for at least five years, have highly automated production facilities, and have received financing from multiple banks. See Bloomberg New Energy Finance, "BloombergNEF PV Module Tier 1 List Methodology," March 3, 2019. |
| 86. |
Michaela D. Platzer, Specialist in Industrial Organization and Business, was the author of this section. |
| 87. |
The Solar Foundation, National Solar Jobs Census 2018, February 12, 2019, p. 15. |
| 88. |
The Solar Foundation claims that BLS's Standard Occupational Classification (SOC) category for solar installers is incomplete because it defines solar PV installers too narrowly by omitting various workers from its figures, including installation company support staff, project development staff, or workers completing solar site prep work. The employment projection is from BLS's Employment Projections Program (EPP), "Fastest Growing Occupations, 2018 and Projected 2028," Table 1.3, September 4, 2019. |
| 89. |
Solar PV installer became a federal occupational category in 2010. BLS, Occupational Outlook Handbook, Solar Photovoltaic Installers (OES 47-2231), May 2018, https://www.bls.gov/ooh/construction-and-extraction/solar-photovoltaic-installers.htm. |
| 90. |
The Solar Energy Industry Association provided CRS with figures on the annual number of PV installations and cumulative PV installations in the United States by email on August 19, 2019. |
| 91. |
Victor Adeleke, Solar Panel Manufacturing in the United States, IBISWorld, March 2019, p. 36. |
| 92. |
Corrie Clark, Analyst in Energy Policy, was the author of this section. |
| 93. |
Llorenç Milà i Canals, Christian Bauer, and Jochen Depestele, et al., "Key Elements in a Framework for Land Use Impact Assessment Within LCA," The International Journal of Life Cycle Assessment, vol. 12, no. 1 (2007), pp. 5-15. |
| 94. |
"Time-to-recovery" refers to the concept that some uses of land require more time for the land to return to its previous state than other uses. Some argue that uses where the land can recover quickly should not be counted the same as use that delays full recovery for decades or centuries. Department of Energy, "Chapter 10: Concepts in Integrated Analysis," Quadrennial Technology Review, (2015), https://www.energy.gov/quadrennial-technology-review-2015, p. 388. |
| 95. |
John van Zalk and Paul Behrens, "The Spatial Extent of Renewable and Non-renewable Power Generation: A Review and Meta-analysis of Power Densities and Their Application in the U.S.," Energy Policy, vol. 123 (2018), pp. 83-91; hereinafter van Zalk and Behrens 2018. |
| 96. |
Van Zalk and Behrens 2018. The review considered nine energy sources: biomass, coal, geothermal, hydro, natural gas, nuclear, oil, solar, and wind. The review also accounted for energy conversion efficiencies, capacity factors, and infrastructure area, including infrastructure associated with energy production (e.g., mines). |
| 97. |
Van Zalk and Behrens 2008 reported p-values and considered a p-value less than 0.05 to be significant. For solar energy, the p-value was found to be 0.001. According to the review, solar energy power density increased by an average of 0.42 We/m2 per year. |
| 98. |
Van Zalk and Behrens 2008. We refers to the electrical power, in watts, produced by a generator. It is distinct from Wth which refers to the thermal power produced by a generator. |
| 99. |
P. Denholm and R. Margolis, The Regional Per-Capita Solar Electric Footprint for the United States, National Renewable Energy Laboratory, Technical Report, NREL/TP-670-42463, December 2007, pp. 5-6, https://www.nrel.gov/docs/fy08osti/42463.pdf. |
| 100. |
Land use energy intensity can be considered as the amount of land used for a defined amount of electricity generation. Such parameters include solar insolation (the amount of sunlight shining on any location), packing factor (the ratio of a solar array area to the actual land area), system efficiency, and capacity factor (the ratio of total energy generated during a period of time to the maximum possible electrical energy that could be generated during the same period of time). Robert M. Horner and Corrie E. Clark, "Characterizing variability and reducing uncertainty in estimates of solar land use energy intensity," Renewable and Sustainable Energy Reviews, vol. 23 (July 2013), pp. 129-137. |
| 101. |
"Land use" refers to activities that take place on the land such as growing food. "Land cover" refers to the physical characteristics of the land surface such as grassland or concrete. D.G. Brown, C. Polsky, and P. Bolstad, et al., "Ch. 13: Land Use and Land Cover Change," Climate Change Impacts in the United States: The Third National Climate Assessment, J. M. Melillo, Terese (T.C.) Richmond, and G. W. Yohe, Eds., U.S. Global Change Research Program, 2014, pp. 318-332, https://nca2014.globalchange.gov/report/sectors/land-use-and-land-cover-change. |
| 102. |
Department of Energy, Quadrennial Technology Review: An Assessment of Energy Technologies and Research Opportunities, September 2015, p. 407. |
| 103. |
Tadlock Cowan, Analyst in Natural Resources and Rural Development, was the author of this section. |
| 104. |
It takes about 32 acres of solar power panels to meet the demands of 1,000 homes. See Land-Use Requirements for Solar Power Plants in the U.S., NREL/TP-6A20-56290, June, 2013. Under a U.S. Department of Energy scenario, U.S. solar PV deployment is predicted to grow to an estimated 1,618 gigawatts by 2050, requiring an estimated 6.6 million acres of land, approximately equivalent to the size of Massachusetts. See Megan Day, Land Use Planning for Large-Scale Solar, NREL/PR-7A40-72470. September 27, 2018. |
| 105. |
U.S. Department of Energy, Electric Power Annual 2018, 2019. |
| 106. |
SEIA/Wood Mackenzie, Solar Market Insight 2019 Q4 Report, 2019. |
| 107. |
A typical lease from a solar development company may have a life of 30-35 years. |
| 108. |
|
| 109. |
Some research has shown that varieties of lettuce, tomatoes, pasture grass, and biogas maize produce greater yields in the shade than under full sunlight. See Adeh, Elanz H., Good, Stephen P, Calaf, M, Higgins, Chad W. "Solar PV power potential is greatest over cropland." Scientific Reports 9, August 7, 2019. |
| 110. |
The SMART program aims to create a long-term solar incentive program in the Commonwealth. https://www.mass.gov/solar-massachusetts-renewable-target-smart. |