Federal Regional Commissions and Authorities: Structural Features and Function
Changes from November 6, 2019 to April 29, 2021
This page shows textual changes in the document between the two versions indicated in the dates above. Textual matter removed in the later version is indicated with red strikethrough and textual matter added in the later version is indicated with blue.
Federal Regional Commissions and Authorities: Structural Features and Function
Contents
- Introduction
- Appalachian Regional Commission
- Structure and Activities
- Commission Structure
- Regional Development Plan
- Distressed Counties
- Legislative History
- Council of Appalachian Governors
- Appalachian Regional Development Act
- Major Amendments to the ARC Before 2008
- The Appalachian Regional Development Act Amendments of 2008
- Funding History
- Delta Regional Authority
- Overview of Structure and Activities
- Authority Structure
- DRA Strategic Planning
- Distress Designations
- States' Economic Development Assistance Program
- Legislative History
- Key Legislative Activity
- Funding History
- Denali Commission
- Overview of Structure and Activities
- Commission Structure
- Distressed Areas
- Recent Activities
- Legislative History
- Funding History
- Northern Border Regional Commission
- Overview of Structure and Activities
- Program Areas
- Strategic Plan
- Economic and Demographic Distress
- Legislative History
- Funding History
- Northern Great Plains Regional Authority
- Structure and Activities
- Authority Structure
- Activities and Administration
- Legislative History
- Funding History
- Southeast Crescent Regional Commission
- Overview of Structure and Activities
- Legislative History
- Funding History
- Southwest Border Regional Commission
- Overview of Structure and Activities
- Legislative History
- Funding History
- Concluding Notes
Figures
- Figure 1. Map of the Appalachian Regional Commission
- Figure 2. Map of the Delta Regional Authority
- Figure 3. Map of the Denali Commission
- Figure 4. Map of the Northern Border Regional Commission
- Figure 5. Map of the Northern Great Plains Regional Authority
- Figure 6. Map of the Southeast Crescent Regional Commission
- Figure 7. Map of the Southwest Border Regional Commission
- Figure A-1. Structure and Activities of the Commissions and Authorities
- Figure B-1. National Map of the Federal Regional Commissions and Authorities
Tables
- Table 1. ARC: Authorized and Appropriated Funding, FY2008-FY2019
- Table 2. DRA Allocations by State, FY2019
- Table 3. DRA: Authorized and Appropriated Funding, FY2008-FY2019
- Table 4. Denali Commission: Authorized and Appropriated Funding, FY2010-FY2019
- Table 5. NBRC Authorized and Appropriated Funding, FY2010-FY2019
- Table 6. SCRC Authorized and Appropriated Funding, FY2010-FY2019
- Table A-1. Federal Regional Commissions and Authorities
- Table C-1. ARC Counties by Designated Distress
- Table C-2. DRA Counties by State and Distress
- Table C-3. Denali Commission Distressed Communities List
- Table C-4. NBRC Counties by Distress Designation
- Table C-5. Statutory Jurisdiction of NGPRA
- Table C-6. Statutory Jurisdiction of SCRC
- Table C-7. Statutory Jurisdiction of SBRC
Summary
Federal Regional Commissions and Authorities: April 29, 2021
Structural Features and Function
Michael H. Cecire
This report describes the structure, activities, legislative history, and funding history of
Analyst in
seven federal regional commissions and authorities: the Appalachian Regional
Intergovernmental
Commission; the Delta Regional Authority; the Denali Commission; the Northern
Relations and Economic
Border Regional Commission; the Northern Great Plains Regional Authority; the
Development Policy
Southeast Crescent Regional Commission; and the Southwest Border Regional Commission.
All
Al seven regional commissions and authorities are broadly modeled after the Appalachian Regional Commission structure, which is composed of a federal co-chair appointed by the president with the advice and consent of the Senate, and the member state governors, of which one is appointed the state co-chair. This structure is broadly replicated in the other commissions and authorities, albeit with notable variations and exceptions to local contexts. In addition, the service areas for all al of the federal regional commissions and authorities are defined in statute and
thus can only be amended or modified through congressional action. While the service areas for the federal regional commissions and authorities have shifted over time, those jurisdictions have not changed radicallyradical y in their respective service lives.
Of the seven federal regional commissions and authorities, four could be considered active: the Appalachian Regional Commission; the Delta Regional Authority; the Denali Commission; and the Northern Border Regional Commission.
The four active regional commissions and authority received $15 million to $165 million in congressionalmil ion to $180 mil ion in appropriations in FY2019FY2021 for their various activities. Each of the four functioning regional commissions and authority engage in economic development to varying extents, and address multiple programmatic activities in their respective service areas. These activities may include, but are not limited to: basic infrastructure; energy; ecology/environment and natural resources; workforce/labor; and business development.
Though they are federally-federal y chartered, receive congressional appropriations for their administration and activities, and include an appointed federal representative in their respective leadership structures (the federal co-chair and his/her alternate, as applicable), the federal regional commissions and authorities are quasi-governmental partnerships between the federal government and the constituent state(s) of a given authority or commission. This partnership structure, which also typicallytypical y includes substantial input and efforts at the sub-state level, represents a
unique federal approach to economic development and a potentiallypotential y flexible mechanism for coordinating strategic economic development goals to local, state, and multi-state/regional priorities and contexts.
Congress has expressed interest in the federal regional commissions and authorities pursuant to its appropriations and oversight authority, as well wel as its interest in facilitating economic development programming. Given relevant congressional interest, the federal regional commissions and authorities provide a model of functioning economic
development approaches that are place-based, intergovernmental, and multifaceted in their programmatic orientation (e.g., infrastructure, energy, environment/ecology, workforce, business development).
Introduction
This report describes the structure, activities, legislative history, and funding history of seven federally-
Congressional Research Service
link to page 6 link to page 6 link to page 7 link to page 7 link to page 8 link to page 9 link to page 10 link to page 10 link to page 10 link to page 11 link to page 12 link to page 12 link to page 13 link to page 14 link to page 14 link to page 15 link to page 15 link to page 16 link to page 17 link to page 17 link to page 18 link to page 19 link to page 20 link to page 20 link to page 21 link to page 21 link to page 22 link to page 23 link to page 23 link to page 24 link to page 24 link to page 26 link to page 26 link to page 27 link to page 28 link to page 29 link to page 29 link to page 29 link to page 30 link to page 30 link to page 31 link to page 31 link to page 32 link to page 32 link to page 33 Federal Regional Commissions and Authorities: Structural Features and Function
Contents
Introduction ................................................................................................................... 1 Appalachian Regional Commission ................................................................................... 1
Structure and Activities .............................................................................................. 2
Commission Structure ........................................................................................... 2 Regional Development Plan ................................................................................... 3 Distressed Counties .............................................................................................. 4
Legislative History .................................................................................................... 5
Council of Appalachian Governors.......................................................................... 5 Appalachian Regional Development Act .................................................................. 5 Major Amendments to the ARC Before 2008 ............................................................ 6 The Appalachian Regional Development Act Amendments of 2008.............................. 7
Funding History ........................................................................................................ 7
Delta Regional Authority.................................................................................................. 8
Overview of Structure and Activities ............................................................................ 9
Authority Structure ............................................................................................... 9
DRA Strategic Planning ...................................................................................... 10 Distress Designations.......................................................................................... 10 States’ Economic Development Assistance Program ................................................ 11
Legislative History .................................................................................................. 12
Key Legislative Activity ...................................................................................... 12
Funding History ...................................................................................................... 13
Denali Commission ....................................................................................................... 14
Overview of Structure and Activities .......................................................................... 15
Commission Structure ......................................................................................... 15
Distressed Areas................................................................................................. 16 Recent Activities ................................................................................................ 16
Legislative History .................................................................................................. 17 Funding History ...................................................................................................... 18
Northern Border Regional Commission ............................................................................ 18
Overview of Structure and Activities .......................................................................... 19
Program Areas ................................................................................................... 19 Strategic Plan .................................................................................................... 21
Economic and Demographic Distress .................................................................... 21
Legislative History .................................................................................................. 22 Funding History ...................................................................................................... 23
Northern Great Plains Regional Authority ......................................................................... 24
Structure and Activities ............................................................................................ 24
Authority Structure ............................................................................................. 24 Activities and Administration ............................................................................... 25
Legislative History .................................................................................................. 25 Funding History ...................................................................................................... 26
Southeast Crescent Regional Commission......................................................................... 26
Overview of Structure and Activities .......................................................................... 27 Legislative History .................................................................................................. 27
Funding History ...................................................................................................... 28
Congressional Research Service
link to page 34 link to page 34 link to page 34 link to page 35 link to page 36 link to page 7 link to page 14 link to page 20 link to page 24 link to page 29 link to page 32 link to page 34 link to page 37 link to page 39 link to page 13 link to page 16 link to page 19 link to page 23 link to page 28 link to page 33 link to page 35 link to page 37 link to page 40 link to page 43 link to page 46 link to page 48 link to page 48 link to page 49 link to page 50 link to page 51 Federal Regional Commissions and Authorities: Structural Features and Function
Southwest Border Regional Commission .......................................................................... 29
Overview of Structure and Activities .......................................................................... 29 Legislative History .................................................................................................. 29 Funding History ...................................................................................................... 30
Concluding Notes ......................................................................................................... 31
Figures Figure 1. Map of the Appalachian Regional Commission ...................................................... 2 Figure 2. Map of the Delta Regional Authority .................................................................... 9 Figure 3. Map of the Denali Commission .......................................................................... 15 Figure 4. Map of the Northern Border Regional Commission ............................................... 19 Figure 5. Map of the Northern Great Plains Regional Authority ............................................ 24 Figure 6. Map of the Southeast Crescent Regional Commission ........................................... 27 Figure 7. Map of the Southwest Border Regional Commission ............................................. 29
Figure A-1. Structure and Activities of the Commissions and Authorities ............................... 32 Figure B-1. National Map of the Federal Regional Commissions and Authorities .................... 34
Tables Table 1. ARC: Authorized and Appropriated Funding, FY2010-FY2021 .................................. 8 Table 2. DRA Allocations by State, FY2021 ...................................................................... 11 Table 3. DRA: Authorized and Appropriated Funding, FY2010-FY2021................................ 14 Table 4. Denali Commission: Authorized and Appropriated Funding, FY2010-FY2021........... 18 Table 5. NBRC Authorized and Appropriated Funding, FY2010-FY2021 .............................. 23 Table 6. SCRC Authorized and Appropriated Funding, FY2010-FY2021 ............................... 28 Table 7. SBRC Authorized and Appropriated Funding, FY2010-FY2021 ............................... 30
Table A-1. Federal Regional Commissions and Authorities .................................................. 32 Table C-1. Historical Appropriations: Federal Regional Commissions (FY1986-FY2021) ........ 35 Table D-1. ARC Counties by Designated Distress .............................................................. 38 Table D-2. DRA Counties by State and Distress ................................................................. 41 Table D-3. Denali Commission Distressed Communities List............................................... 43 Table D-4. NBRC Counties by Distress Designation........................................................... 43 Table D-5. Statutory Jurisdiction of NGPRA ..................................................................... 44 Table D-6. Statutory Jurisdiction of SCRC ........................................................................ 45 Table D-7. Statutory Jurisdiction of SBRC ........................................................................ 46
Congressional Research Service
link to page 37 link to page 39 link to page 40 link to page 43 link to page 51 Federal Regional Commissions and Authorities: Structural Features and Function
Appendixes Appendix A. Basic Information at a Glance....................................................................... 32 Appendix B. Map of Federal Regional Commissions and Authorities .................................... 34 Appendix C. Historical Appropriations ............................................................................. 35 Appendix D. Service Areas of Federal Regional Commissions and Authorities ....................... 38
Contacts Author Information ....................................................................................................... 46
Congressional Research Service
link to page 37 link to page 37 link to page 39 Federal Regional Commissions and Authorities: Structural Features and Function
Introduction This report describes the structure, activities, legislative history, and funding history of seven federal y chartered regional commissions and authorities: the Appalachian Regional Commission (ARC); the Delta Regional Authority (DRA); the Denali Commission; the Northern Border Regional Commission (NBRC); the Northern Great Plains Regional Authority (NGPRA); the Southeast Crescent Regional Commission (SCRC); and the Southwest Border Regional
Commission (SBRC) (Table A-1). The federal regional commissions are also functioning examples of place-based and intergovernmental approaches to economic development, which
receive regular congressional interest.1
1
The federal regional commissions and authorities integrate federal and state economic development priorities alongside regional and local considerations (Figure A-1). As federally-federal y chartered agencies created by acts of Congress, the federal regional commissions and authorities depend on congressional appropriations for their activities and administration, and are subject to
congressional oversight.
Seven federal regional commissions and authorities were authorized by Congress to address instances of major economic distress in certain defined socio-economic regions, with all al but one (Alaska'’s Denali Commission) being multi-state regions (Figure B-1). The first such federal
regional commission, the Appalachian Regional Commission, was founded in 1965. The other commissions and authorities may have roots in the intervening decades, but were not founded until 1998 (Denali), 2000 (Delta Regional Authority), and 2002 (the Northern Great Plains Regional Authority). The most recent commissions—Northern Border Regional Commission, Southeast Crescent Regional Commission, and Southwest Border Regional Commission—were
authorized in 2008.
Four of the seven entities—the Appalachian Regional Commission, the Delta Regional Authority, the Denali Commission, and the Northern Border Regional Commission—are currently active
and receive regular annual appropriations.
Certain strategic emphases and programs have evolved over time in each of the functioning
federal regional commissions and authorities. However, their overarching missions to address economic distress have not changed, and their associated activities have broadly remained consistent to those goals as funding has allowedal owed. In practice, the functioning federal regional commissions and authorities engage in their respective economic development efforts through multiple program areas, which may include, but are not limited to basic infrastructure; energy;
ecology/environment and natural resources; workforce/labor; and business development.
Appalachian Regional Commission
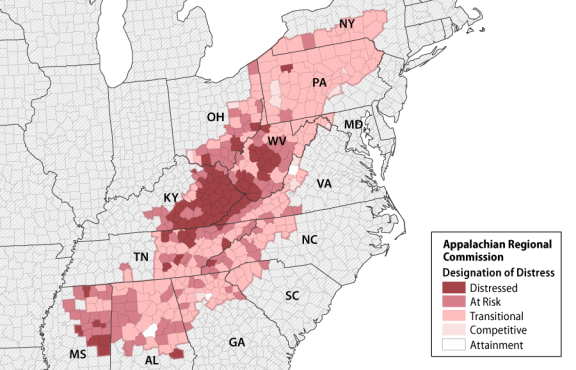
The Appalachian Regional Commission was established in 1965 to address economic distress in the Appalachian region.22 The ARC'’s jurisdiction spans 420 counties in Alabama, Georgia, Kentucky, Maryland, Mississippi, New York, North Carolina, Ohio, Pennsylvania, South
1 See, for example, recent congressional interest and legislative action on Opportunity Zones ( CRS Report R45152, Tax Incentives for Opportunity Zones, by Sean Lowry and Donald J. Marples) and New Market T ax Credits (CRS Report RL34402, New Markets Tax Credit: An Introduction, by Donald J. Marples and Sean Lowry), and previous federal and congressional action on “Promise Zones” (U.S. Department of Housing and Urban Development, Promise Zones Overview, https://www.hudexchange.info/programs/promise-zones/promise-zones-overview/); as well as various legislation relating to the federal regional commissions and authorities themselves. 2 40 U.S.C. §§14101-14704.
Congressional Research Service
1
link to page 7
Federal Regional Commissions and Authorities: Structural Features and Function
Kentucky, Maryland, Mississippi, New York, North Carolina, Ohio, Pennsylvania, South Carolina, Tennessee, Virginia, and West Virginia (Figure 1). The ARC was originallyoriginal y created to address severe economic disparities between Appalachia and that of the broader United States; recently, its mission has grown to include regional competitiveness in a global economic environment.
Structure and Activities
Commission Structure
According to the authorizing legislation, the Appalachian Regional Development Act of 1965, as amended,33 the ARC is a federally-federal y chartered, regional economic development entity led by a federal co-chair, whose term is open-ended, and the 13 participating state governors, of which one
serves as the state co-chair for a term of "“at least one year."4”4 The federal co-chair is appointed by the President with the advice and consent of the Senate. The authorizing act also allowsal ows for the appointment of federal and state alternates to the commission. The ARC is a federal-state partnership, with administrative costs shared equallyequal y by the federal government and member
states, while economic development activities are funded by congressional appropriations.
3 P.L. 89-4. 4 Appalachian Regional Commission, The ARC Code, https://www.arc.gov/publications/ARCCode.asp.
Congressional Research Service
2
Federal Regional Commissions and Authorities: Structural Features and Function
Regional Development Plan
Regional Development Plan
According to authorizing legislation and the ARC code,55 the ARC'’s programs abide by a Regional Development Plan (RDP), which includes documents prepared by the states and the commission. The RDP is comprised of the ARC'’s strategic plan, its bylaws, member state development plans, each participating state'’s annual strategy statement, the commission'’s annual
program budget, and the commission'’s internal implementation and performance management guidelines.
guidelines.
The RDP integrates local, state, and federal economic development priorities into a common
regional agenda. Through state plans and annual work statements, states establish goals, priorities, and agendas for fulfillingfulfil ing them. State planning typicallytypical y includes consulting with local development districts (LDDs), which are multicounty organizations that are associated with and financially
financial y supported by the ARC and advise on local priorities.6
6
There are 73 ARC-associated LDDs. They may be conduits for funding for other eligible organizations, and may also themselves be ARC grantees.77 State and local governments, governmental entities, and nonprofit organizations are eligible for ARC investments, including both federal- and also state-designated tribal entities. Notably, non-federallyfederal y recognized, state-
designated tribal entities are eligible to receive ARC funding, which is an exception to the general
rarity of federal funds being available to non-federallyfederal y recognized tribal entities.8
ARC'8
ARC’s strategic plan is a five-year document, reviewed annuallyannual y, and revised as necessary. The
current strategic plan, adopted in November 2015,99 prioritizes five investment goals:
1.1. entrepreneurial and business development;2.2. workforce development;3.3. infrastructure development;4.4. natural and cultural assets; and5.5. leadership and community capacity.
The ARC'’s investment activities are divided into 10 program areas:10
5 Appalachian Regional Commission, ARC Code, 2018, https://www.arc.gov/publications/ARCCodeContents.asp. 6 LDDs are not exclusive to the ARC. T he DRA and NBRC also make use of them, and other inactive commissions and authorities are authorized to organize and/or support them. Designated LDDs may also be organized as Economic Development Administration (EDA)-designated economic development districts (EDDs), which serve a similar purpose. T hey may also be co-located with Small Business Administration-affiliated small business development centers (SBDCs).
7 Appalachian Regional Commission, Local Development Districts, https://www.arc.gov/about/LocalDevelopmentDistricts.asp. 8 See U.S. Government Accountability Office, Indian Issues: Federal Funding for Non-Federally Recognized Tribes, 12-348, April 2012, https://www.gao.gov/assets/600/590102.pdf.
9 Appalachian Regional Commission, Investing in Appalachia’s Future: T he Appalachian Regional Commission’s Five-Year Strategic Plan for Capitalizing on Appalachia’s Opportunities, 2016 –2020, https://www.arc.gov/about/arc2016-2020strategicplan.asp.
10 Appalachian Regional Commission, Program Areas, https://www.arc.gov/program_areas/index.asp.
Congressional Research Service
3
Federal Regional Commissions and Authorities: Structural Features and Function
asset-based development;11
health;
community infrastructure;
leadership development and
education and training;
capacity building;
energy;
telecommunications;
entrepreneurship and
tourism development; and
business development;
transportation.
s investment activities are divided into 10 program areas:10
|
|
These program areas can be funded through five types of eligible activities:12
1.12 1. business development and entrepreneurship, through grants to help create and retain jobs in the region, including through targeted loan funds;2.2. education and training, for projects that"“develop, support, or expand education and training programs";3.”; 3. health care, through funding for"“equipment and demonstration projects"” and sometimes for facility construction and renovation, including hospital and community health services;4.4. physical infrastructure, including funds for basic infrastructure services such as water and sewer facilities, aswellwel as housing and telecommunications; and5.5. leadership development and civic capacity, such as community-based strategic plans, training for local leaders, and organizational support.
While most funds are used for economic development grants, approximately $50 millionmil ion is reserved for the Partnerships for Opportunity and Workforce and Economic Revitalization (POWER) Initiative.1313 The POWER Initiative began in 2015 to provide economic development
funding for addressing economic and labor dislocations caused by energy transition principallyprincipal y in
in coal communities in the Appalachian region.14
14 Distressed Counties
The ARC is statutorily obligated to designate counties according to levels of economic distress.15 15 Distress designations influence funding priority and determine grant match requirements. Using
an index-based classification system, the ARC compares each county within its jurisdiction with national averages based on three economic indicators:1616 (1) three-year average unemployment rates; (2) per capita market income; and (3) poverty rates. These factors are calculated into a
11 T he ARC defines asset-based development as “Appalachia’s [local] natural, cultural, structural, and leadership resources.” T his includes cultural assets, ecological assets, agriculture, and other preexisting industries and resources that may be leveraged for increased economic development. Appalachian Regional Commission, Asset-Based Developm ent, https://www.arc.gov/program_areas/index.asp?PROGRAM_AREA_ID=13. 12 Appalachian Regional Commission, About ARC Project Grants, https://www.arc.gov/funding/ARCProjectGrants.asp.
13 Appalachian Regional Commission, Partnerships for Opportunity and Workforce and Economic Revitalization (POWER) Initiative, https://www.arc.gov/funding/POWER.asp. 14 T he White House, Office of the Press Secretary, FACT SHEET: The Partnerships for Opportunity and Workforce and Econom ic Revitalization (POWER) Initiative, March 27, 2015, https://obamawhitehouse.archives.gov/the-press-office/2015/03/27/fact-sheet-partnerships-opportunity-and-workforce-and-economic-revitaliz.
15 42 U.S.C. §14526. 16 Appalachian Regional Commission, County Economic Status and Distressed Areas in Appalachia, https://www.arc.gov/appalachian_region/CountyEconomicStatusandDistressedAreasinAppalachia.asp .
Congressional Research Service
4
Federal Regional Commissions and Authorities: Structural Features and Function
rates; (2) per capita market income; and (3) poverty rates. These factors are calculated into a composite index value for each county, which are ranked and sorted into designated distress levels.1717 Each distress level corresponds to a given county'’s ranking relative to that of the United States as a whole. These designations are defined as follows by the ARC, starting from "worst" distress:18
- “worst”
distress:18
distressed counties, or those with values in the
"worst"“worst” 10% of U.S. counties; - at-risk, which rank between worst 10% and 25%;
- transitional, which rank between worst 25% and best 25%;
- competitive, which rank between
"best"“best” 25% and best 10%; and - attainment, or those which rank in the best 10%.
The designated level of distress is statutorily tied to allowableal owable funding levels by the ARC (funding allowanceal owance), the balance of which must be met through grant matches from other funding
sources (including potentiallypotential y other federal funds) unless a waiver or special dispensation is permitted: distressed (80% funding allowanceal owance, 20% grant match); at-risk (70%); transitional (50%); competitive (30%); and attainment (0% funding allowanceal owance). Exceptions can be made to grant match thresholds. Attainment counties may be able to receive funding for projects where sub-county areas are considered to be at higher levels of distress, and/or in those cases where the
inclusion of an attainment county in a multi-county project would benefit one or more non-attainment counties or areas. In addition, special allowancesal owances may reduce or discharge matches,
and match requirements may be met with other federal funds.
Legislative History
Council of Appalachian Governors
In 1960,1919 the Alabama, Georgia, Kentucky, Maryland, North Carolina, Pennsylvania, Tennessee, Virginia, and West Virginia governors formed the Council of Appalachian Governors to highlight Appalachia'Appalachia’s extended economic distress and to press for increased federal involvement. In 1963, President John F. Kennedy formed the President'’s Appalachian Regional Commission (PARC)
and charged it with developing an economic development program for the region. PARC'’s report, issued in 1964,20 called20 cal ed for the creation of an independent agency to coordinate federal and state efforts to address infrastructure, natural resources, and human capital issues in the region. The
PARC also included some Ohio counties as part of the Appalachian region.
Appalachian Regional Development Act
In 1965, President Lyndon Johnson signed the Appalachian Regional Development Act,2121 which created the ARC to address the PARC'’s recommendations, and added counties in New York and
Mississippi. The ARC was directed to administer or assist in the following initiatives:
17 Appalachian Regional Commission, Data Reports: County Economic Status, Fiscal Year 2020 , https://www.arc.gov/reports/custom_report.asp?REPORT_ID=76. 18 Appalachian Regional Commission, Distressed Designation and County Economic Status Classification System, FY 2007–FY 2020, https://www.arc.gov/research/SourceandMethodologyCount yEconomicStatusFY2007FY2020.asp.
19 Appalachian Regional Commission, ARC History, https://www.arc.gov/about/ARCHistory.asp. 20 Appalachian Regional Commission, Appalachia: A Report by the President’s Appalachian Regional Commission, 1964, April 1964, https://www.arc.gov/about/ARCAppalachiaAReportbythePresidentsAppalachianRegionalCommission1964.asp. 21 P.L. 89-4.
Congressional Research Service
5
Federal Regional Commissions and Authorities: Structural Features and Function
Mississippi. The ARC was directed to administer or assist in the following initiatives:
- The creation of the Appalachian Development Highway System;
- Establishing
"“Demonstration Health Facilities"” to fund health infrastructure; - Land stabilization, conservation, and erosion control programs;
- Timber development organizations, for purposes of forest management;
- Mining area restoration, for rehabilitating and/or revitalizing
- A water resources survey;
- Vocational education programs; and
- Sewage treatment infrastructure.
Major Amendments to the ARC Before 2008
Appalachian Regional Development Act Amendments of 1975
In 1975, the ARC'’s authorizing legislation was amended to require that state governors themselves serve as the state representatives on the commission, overriding original statutory language in which governors were permitted to appoint designated representatives.2222 The amendments also included provisions to expand public participation in ARC plans and programs.
They also required states to consult with local development districts and local governments and
authorized federal grants to the ARC to assist states in enhancing state development planning.
Appalachian Regional Development Reform Act of 1998
Legislative
Legislative reforms in 1998 introduced county-level designations of distress.2323 The legislation organized county-level distress into three bands, from "worst" to "best"“worst” to “best”: distressed counties;
competitive counties; and attainment counties. The act imposed limitations on funding for economicallyeconomical y strong counties: (1) "“competitive,"” which could only accept ARC funding for 30% of project costs (with the 70% balance being subject to grant match requirements); and (2) "
“attainment,"” which were generallygeneral y ineligible for funding, except through waivers or exceptions.
In addition, the act withdrew the ARC'’s legislative mandate for certain programs, including the land stabilization, conservation, and erosion control program; the timber development program; the mining area restoration program; the water resource development and utilization survey; the Appalachian airport safety improvements program (a program added in 1971); the sewage
treatment works program; and amendments to the Housing Act of 1954 from the original 1965 act.
act.
Appalachian Regional Development Act Amendments of 2002
Legislation in 2002 expanded the ARC'’s ability to support LDDs, introduced an emphasis on
ecological issues, and provided for a greater coordinating role by the ARC in federal economic development activities.2424 The amendments also provided new stipulations for the ARC'’s grant making, limiting the organization to funding 50% of project costs or 80% in designated distressed counties. The amendments also expanded the ARC'’s efforts in human capital development
projects, such as through various vocational, entrepreneurial, and skill skil training initiatives.
22 P.L. 94-188. 23 P.L. 105-393. 24 P.L. 107-149. Congressional Research Service 6 link to page 13 Federal Regional Commissions and Authorities: Structural Features and Function The Appalachian Regional Development Act Amendments of 2008
The Appalachian Regional Development Act Amendments of 2008 is the ARC'’s most recent substantive legislative development and reflects its current configuration.2525 The amendments included:
1.included: 1. various limitations2.2. the establishment of an economic and energy development initiative;3.3. the expansion of county designations to include an"“at-risk"” designation; and4.4. the expansion of the number of counties under the ARC'’s jurisdiction.
The 2008 amendments introduced funding limitations for ARC grant activities as a whole, as well wel as to specific programs. According to the 2008 legislation, "“the amount of the grant shall shal not exceed 50 percent of administrative expenses."” However, at the ARC'’s discretion, an LDD that included a "distressed"“distressed” county in its service area could provide for 75% of administrative
expenses of a relevant project, or 70% for "“at-risk"” counties. Eligible activities could only be funded by the ARC at a maximum of 50% of the project cost,2626 or 80% for distressed counties and 70% for "“at-risk"” counties. The act introduced special project categories, including (1) demonstration health projects; (2) assistance for proposed low- and middle-income housing projects; (3) the telecommunications and technology initiative; (4) the entrepreneurship initiative;
and (5) the regional skillsskil s partnership. FinallyFinal y, the "“economic and energy development initiative" ” provided for the ARC to fund activities supporting energy efficiency and renewable technologies. The legislation expanded distress designations to include an "“at-risk"” category, or counties "“most at risk of becoming economicallyeconomical y distressed."” This raised the number of distress levels to five.27 27 The legislation also expanded ARC'’s service area. Ten counties in four states were added to the
ARC, which represents the most recent expansion.
Funding History
The ARC is a federal-state partnership, with administrative costs shared equallyequal y by the federal government and states, while economic development activities are federallyfederal y funded. The ARC is also the highest-funded of the federal regional commissions and authorities. Its funding (Table 1)
has increased 126% from approximately $73 millionmil ion in FY2008 to $165 million in FY2019.
The ARC'180 mil ion in FY2021.
The ARC’s funding growth is attributable to incremental increases in appropriations along with an approximately $50 million mil ion increase in annual appropriated funds in FY2016 set aside to support the POWER Initiative.2828 The POWER Initiative was part of a wider federal effort under the Obama Administration to support coal communities affected by the decline of the coal
industry.29 The FY2018 White House budget proposed to shutter the ARC as well as the other wel as the other
25 P.L. 110-371. 26 Where allowable, non-appropriated funds—such as those from states or localities—or even other non-ARC federal funds may be used to fund the balance of the project costs. 27 T he five designations of distress are: distressed, at -risk, transitional, competitive, and attainment. The “transitional” designation is not defined in statute, unlike the other four categories, but it is utilized as part of the five -level distress criteria nonetheless.
28 P.L. 114-113. 29 For more information on the POWER Initiative, see CRS Report R46015, The POWER Initiative: Energy Transition as Econom ic Developm ent, by Michael H. Cecire.
Congressional Research Service
7
link to page 40 link to page 14 Federal Regional Commissions and Authorities: Structural Features and Function
federal regional commissions and authorities.30federal regional commissions and authorities.29 Congress did not adopt these provisions from the President'
President’s budget, and continued to fund the ARC and other commissions.
Table 1. ARC: Authorized and Appropriated Funding, FY2010-FY2021
$ in mil ions
FY10 FY11 FY12 FY13 FY14 FY15 FY16 FY17 FY18 FY19 FY20
FY21
Appropriated
76.0
68.4
68.3
68.3
80.3
90.0
146.0
152.0
155.0
165.0
175.0
180.0
Funding
Authorized
105.0
108.0
110.0
110.0
110.0
110.0
110.0
110.0
110.0
110.0
110.0
110.0
Funding
Sources: Authorized funding amounts compiled Table 1. ARC: Authorized and Appropriated Funding, FY2008-FY2019
$ in millions
|
FY08 |
FY09 |
FY10 |
FY11 |
FY12 |
FY13 |
FY14 |
FY15 |
FY16 |
FY17 |
FY18 |
FY19 |
|
|
Appropriated Funding |
73.0 |
75.0 |
76.0 |
68.4 |
68.3 |
68.3 |
80.3 |
90.0 |
146.0 |
152.0 |
155.0 |
165.0 |
|
Authorized Funding |
87.0 |
100.0 |
105.0 |
108.0 |
110.0 |
110.0 |
110.0 |
110.0 |
110.0 |
110.0 |
110.0 |
110.0 |
Sources: Authorized funding amounts compiled by CRS using data from P.L. 110-234, , P.L. 113-79, and , P.L. 115-334, and P.L. 116-159. Appropriated funding amounts compiled by CRS using data from: P.L. 111-85; ; P.L. 112-10; ; P.L. 112-74; ; P.L. 113-6; ; P.L. 113-76; ; P.L. 113-235; ; P.L. 114-113; ; P.L. 115-31; ; P.L. 115-141; and ; P.L. 115-244; P.L. 116-94; and P.L. 116-260. Note: For an expanded historical and comparative view of appropriations, see Table C-1.
P.L. 115-244.
Note: FY2008 marked the authorization of the NBRC, SCRC, and the SBRC; as such, FY2008 was selected as the starting point for displayed data for all commissions and authorities for the sake of consistency.
Delta Regional Authority
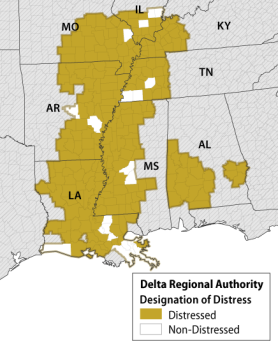
Delta Regional Authority The Delta Regional Authority was established in 2000 to address economic distress in the Mississippi River Delta region.3031 The DRA aims to "“improve regional economic opportunity by helping to create jobs, build communities, and improve the lives of the 10 million people"31mil ion people”32 in 252 designated counties and parishes in Alabama, Arkansas, IllinoisIl inois, Kentucky, Louisiana,
Mississippi, Missouri, and Tennessee (Figure 2).
30 Office of Management and Budget, Budget of the United States Government, Fiscal Year 2018 , Washington, DC, May 23, 2017, https://www.govinfo.gov/content/pkg/BUDGET -2018-BUD/pdf/BUDGET -2018-BUD.pdf.
31 P.L. 106-554. 32 Delta Regional Authority, About the Delta Regional Authority, https://dra.gov/about-dra/about-delta-regional-authority/.
Congressional Research Service
8
link to page 17
Federal Regional Commissions and Authorities: Structural Features and Function
Figure 2. Map of the Delta Regional Authority
Source: Compiled (Figure 2).
|
 |
|
Overview of Structure and Activities
Authority Structure
Like the ARC, the DRA is a federal-state partnership that shares administrative expenses equally, equal y, while activities are federallyfederal y funded. The DRA consists of a federal co-chair appointed by the President with the advice and consent of the Senate, and the eight state governors, of which one is state co-chair. The governors are permitted to appoint a designee to represent the state, who also generally
general y serves as the state alternate.32
33 Entities that are eligible to apply for DRA funding include:
1.1. state and local governments2.2. public bodies; and3. non-profit3. nonprofit entities.
These entities must apply for projects that operate in or are serving residents and communities within the 252 counties/parishes of the DRA'’s jurisdiction.
Unlike the other federal regional commissions and authorities, the DRA’s service area is defined not in any one piece of legislation but through multiple legislative developments (see “Legislative History”). In addition, there appears to be a mechanism for adding counties/parishes to the Authority administratively based
on bil text in the California Desert Protection Act of 1994 from the 103rd Congress (P.L. 103-
33 Delta Regional Authority, Board Members and Alternates, https://dra.gov/about-dra/board-members-and-alternates/.
Congressional Research Service
9
Federal Regional Commissions and Authorities: Structural Features and Function
433), which incorporated H.R. 4043, the Lower Mississippi Delta Initiatives Act of 1994 as Title
XI of the bil .34
DRA Strategic Planning
DRA Strategic Planning
Funding determinations are assessed according to the DRA'’s authorizing statute, its strategic plan, state priorities, and distress designation.3335 The DRA strategic plan articulates the authority's ’s
high-level economic development priorities. The current strategic plan—Moving the Delta Forward, Delta Regional Development Plan III—was released in April 2016 and is in effect
through 2021.34
36
The strategic plan lists three primary goals:
1.1. workforce competitiveness, to"“advance the productivity and economic competitiveness of the Delta workforce";2.”; 2. strengthened infrastructure, to"“strengthen the Delta'’s physical, digital, and capital connections to the global economy"”; and3.3. increased community capacity, to"“facilitate local capacity building"
”
State development plans are required by statute every five years to coincide with the strategic
plan, and reflect the economic development goals and priorities of member states and LDDs.3537 The DRA funds projects through 44 LDDs,3638 which are multicounty economic development organizations financiallyfinancial y supported by the DRA and advise on local priorities. LDDs "“provide technical assistance, application support and review, and other services"” to the DRA and entities applying for funding. LDDs receive administrative fees paid from awarded DRA funds, which are
calculated as 5% of the first $100,000 of an award, and 1% for all al dollars above that amount.
Distress Designations
The DRA determines a county or parish as distressed on an annual basis through the following criteria:
1.criteria: 1. an unemployment rate of 1% higher than the national2.2. a per capita income of 80% or less than the national per capita income.37
39
34 Of the 252 counties reported by the DRA to fall within its service area, 219 were incorporated through P.L. 100-460. Another 20 counties in Alabama were included in P.L. 106-554 (16 counties) and P.L. 107-171 (four counties). P.L. 110-234 added 10 Louisiana parishes and two Mississippi counties. By this count, one county appears to have been included administratively. 35 Delta Regional Authority, Eligibility & Funding Priorities, https://dra.gov/funding-programs-states-economic-development/states-economic-development -assistance-program/eligibility-funding-priorities/.
36 Delta Regional Authority, Moving the Delta Forward, Delta Regional Development Plan III, April 2016, https://dra.gov/images/uploads/content_files/DRA_RDP3-FINAL_APRIL2016.pdf. 37 Delta Regional Authority, Strategic Economic Development Plans: State Strategic Economic Development Plans, 2016, https://dra.gov/funding-programs/strategic-economic-development-plans-by-state/.
38 T he DRA lists 44 LDDs in good standing on its website, but notes in the 2018 States’ Economic Development Assistance Program (SEDAP) Manual that the DRA works with 45 LDDs. Delta Regional Authority, Local Developm ent Districts, https://dra.gov/funding-programs/local-development-districts/.
39 Delta Regional Authority, Distressed Counties and Parishes, https://dra.gov/funding-programs/states-economic-development -assistance-program/distressed-counties-and-parishes/.
Congressional Research Service
10
link to page 16 Federal Regional Commissions and Authorities: Structural Features and Function
The DRA designates counties as either distressed or not, and distressed counties received priority funding from DRA grant making activities. By statute, the DRA directs at least 75% of funds to distressed counties; half of those funds must target transportation and basic infrastructure. As of
FY2018, 234 of the DRA'’s 252 counties are considered distressed.
States'’ Economic Development Assistance Program
The principal investment tool used by the DRA is the States'’ Economic Development Assistance Program (SEDAP), which "“provides direct investment into community-based and regional
projects that address the DRA's congressionally’s congressional y mandated four funding priorities." 38
”40
The DRA'’s four funding priorities are:
1.1. (1) basic public infrastructure;2.2. (2) transportation infrastructure;3.3. (3) workforce development; and4.4. (4) business development (emphasizing entrepreneurship).
The DRA'’s SEDAP funding is made available to each state according to a four-factor, formula-derived allocational ocation that balances geographic breadth, population size, and economic distress
(Table 2).39
.41 The factors and their respective weights are calculated as follows:
- Equity Factor (equal funding among eight states), 50%;
- Distressed Population (DRA counties/parishes), 20%;
- Distressed County Area (DRA counties/parishes), 20%; and
- Population Factor (DRA counties/parishes), 10%.
Table 2. DRA Allocations by State, FY2019
FY2021
by order of funding al ocation
Share of Funding
Funding Allocation
Louisiana
20.16%
$2,994,043.31
Mississippi
15.42%
$2,290,216.42
Arkansas
14.62%
$2,170,906.27
Missouri
11.39%
$1,691,142.97
Tennessee
10.91%
$1,619,788.58
Alabama
10.28%
$1,526,997.65
Kentucky
9.10%
$1,351,133.61
Il inois
8.11%
$1,203,694.19
Total
100.00%
$14,847,923.00
Source: Data tabulated by CRS from the DRA website.
40 Delta Regional Authority, States’ Economic Development Assistance Program (SEDAP), https://dra.gov/funding-programs-states-economic-development/states-economic-development-assistance-program/. 41 Delta Regional Authority, State Funding Allocations, 2021, https://dra.gov/funding-programs/state-funding-allocations/.
Congressional Research Service
11
Federal Regional Commissions and Authorities: Structural Features and Function
DRA investments are awarded from state al ocationsby order of funding allocation
|
Share of Funding |
Funding Allocation |
|
|
Louisiana |
19.89% |
$ 2,465,089.46 |
|
Mississippi |
15.57% |
$ 1,930,011.64 |
|
Arkansas |
14.73% |
$ 1,825,801.93 |
|
Missouri |
11.45% |
$ 1,419,707.68 |
|
Tennessee |
10.59% |
$ 1,313,068.56 |
|
Alabama |
10.33% |
$ 1,280,015.55 |
|
Kentucky |
9.39% |
$ 1,163,634.96 |
|
Illinois |
8.05% |
$ 997,776.23 |
|
Total |
100.00% |
$ 12,395,106.00 |
Source: Data tabulated by CRS from the DRA website.
DRA investments are awarded from state allocations. SEDAP applications are accepted through LDDs, and projects are sorted into tiers of priority. While all al projects must be associated with one of the DRA'’s four funding priorities, additional prioritization determines the rank order of awards, which include county-level distress designations; adherence to at least one of the federal priority eligibility criteria (see below); adherence to at least one of the DRA Regional Development Plan goals (from the strategic plan); and adherence to at least one of the state's ’s
DRA priorities.40
42 The federal priority eligibility criteria are as follows:
Regional impact
Merging and consolidating
Multiple funding partners
public utilities
Emergency funding need
Broadband infrastructure
Registered apprenticeship
criteria are as follows:
|
|
Infrastructure
accredited rate study)
The DRA is also mandated to expend 50% of its appropriated SEDAP dollars on basic public and
transportation infrastructure projects, which lend additional weight to this particular criterion.41
43 Legislative History
In 1988, the Rural Development, Agriculture, and Related Agencies Appropriations Act for FY1989 (P.L. 100-460) appropriated $2 millionmil ion and included language that authorized the creation of the Lower Mississippi Delta Development Commission. The LMDDC was a DRA
predecessor tasked with studying economic issues in the Delta and developing a 10-year economic development plan. The LMDDC consisted of two commissioners appointed by the President as well wel as the governors of Arkansas, IllinoisIl inois, Kentucky, Louisiana, Mississippi, Missouri, and Tennessee. The commission was chaired by then-Governor WilliamWil iam J. Clinton of Arkansas, and the LMDDC released interim and final reports before completing its mandate in 1990. Later, in the White House, the Clinton Administration continued to show interest in an
expanded federal role in Mississippi Delta regional economic development.
Notably, P.L. 100-460’s $2 mil ion in appropriations were made available to “carry out H.R. 5378 and S. 2836, the Lower Mississippi Delta Development Act, as introduced in the House of Representatives on September 26, 1988, and in the Senate on September 27, 1988.” Using this language, those previously un-enacted bil s were “incorporated by reference” and enacted. P.L. 100-460 also provided a definition of the Lower Mississippi Delta region through the incorporation of H.R. 5378 and S. 2836. Key Legislative Activity
-
In 1994, Congress enacted the Lower Mississippi Delta Region Heritage Study
Act, which built on the LMDDC
'’s recommendations. In particular, the 1994 act 42 Delta Regional Authority, Eligibility & Funding Priorities, 2021, https://dra.gov/funding-programs-states-economic-development/states-economic-development -assistance-program/eligibility-funding-priorities/. 43 Delta Regional Authority, SEDAP Administrative Program Manual: FY2021, 2021, https://dra.gov/images/uploads/content_files/SEDAP-Manual-2021.pdf. Congressional Research Service 12 Federal Regional Commissions and Authorities: Structural Features and Functions recommendations. In particular, the 1994 actsaw the Department of the Interior conduct a study on key regional cultural, natural, and heritage sites and locations in the Mississippi Delta region. -
In 1999, the Delta Regional Authority Act of 1999 was introduced in the House
((H.R. 2911) and Senate (S. 1622) to establish the DRAbillbil was enacted, but they established the structure and mission later incorporated into the DRA.42
106th Congress
- 44
106th Congress
In 2000, the Consolidated Appropriations Act for FY2001 (P.L. 106-554
)) included language authorizing the creation of the DRA based on the seven participating states of the LMDDC, with the addition of Alabama and 16 of its counties.
107th Congress
-
107th Congress
The Farm Security and Rural Investment Act of 2002, or 2002 farm
bill (bil (P.L. 107-171), amended voting procedures for DRA states, provided new funds for Delta regional projects, and added four additional Alabama counties to the DRA.
110th Congress
-
110th Congress
The Food, Conservation, and Energy Act of 2008, or 2008 farm
bill (bil (P.L. 110-234234) reauthorized the DRA from FY2008 through FY2012 and expanded it to include Beauregard,Bienville,Bienvil e, Cameron, Claiborne, DeSoto, Jefferson Davis, Red River, St. Mary,Vermillion,Vermil ion, and Webster Parishes in Louisiana; and Jasper and Smith Counties in Mississippi.
113th Congress
-
113th Congress
The Agricultural Act of 2014, or 2014 farm
bill (bil (P.L. 113-79) reauthorized the DRA through FY2018.
115th Congress
-
115th Congress
The Agriculture Improvement Act of 2018, or 2018 farm
bill (bil (P.L. 115-334),), reauthorized the DRA from FY2019 to FY2023,4345 and emphasized Alabama's’s position as a"“full member"” of the DRA.
Funding History
Under "“farm bill"bil ” legislation, the DRA has consistently received funding authorizations of $30 million annuallymil ion annual y since it was first authorized. However, appropriations have fluctuated over the
years. Although the DRA was appropriated $20 millionmil ion in the same legislation authorizing its creation,4446 that amount was halved in 2002,4547 and continued a downward trend through its funding nadir of $5 million mil ion in FY2004. However, funding had increased by FY2006 to $12 million. Since FY2008, DRA's annual appropriations have increased from almost $12 millionmil ion. Since
44 T he two bills contained the general basic authority, structure, geography, and mission that was carried over into the DRA’s authorizing legislation. 45 See CRS In Focus IF11126, 2018 Farm Bill Primer: What Is the Farm Bill?, by Renée Johnson and Jim Monke. 46 P.L. 106-554. 47 P.L. 107-66.
Congressional Research Service
13
link to page 19 link to page 40 Federal Regional Commissions and Authorities: Structural Features and Function
FY2008, DRA’s annual appropriations have increased from almost $12 mil ion to the current
to the current level of $25 million 30 mil ion (Table 3).
|
FY08 |
FY09 |
FY10 |
FY11 |
FY12 |
FY13 |
FY14 |
FY15 |
FY16 |
FY17 |
FY18 |
FY19 |
|
|
Appropriated Funding |
11.69 |
13.00 |
13.00 |
11.70 |
11.68 |
11.68 |
12.00 |
12.00 |
25.00 |
25.00 |
25.00 |
25.00 |
|
Authorized Funding |
30.00 |
30.00 |
30.00 |
30.00 |
30.00 |
30.00 |
30.00 |
30.00 |
30.00 |
30.00 |
30.00 |
30.00 |
SourcesTable 3. DRA: Authorized and Appropriated Funding, FY2010-FY2021
$ in mil ions
FY10 FY11 FY12 FY13 FY14 FY15 FY16 FY17 FY18 FY19 FY20
FY21
Appropriated
13.00
11.70
11.68
11.68
12.00
12.00
25.00
25.00
25.00
25.00
25.00
25.00
Funding
Authorized
30.00
30.00
30.00
30.00
30.00
30.00
30.00
30.00
30.00
30.00
30.00
30.00
Funding
Sources: Appropriated funding amounts compiled by CRS using data from the following: P.L. 110-161; P.L. 111-8; P.L. 111-85; P.L. 112-10; P.L. 112-74; P.L. 112-75; P.L. 113-76; P.L. 113-235; P.L. 114-113; P.L. 115-31; P.L. 115-141; and P.L. 115-244.
fol owing: P.L. 111-85; P.L. 112-10; P.L. 112-74; P.L. 113-6; P.L. 113-76; P.L. 113-235; P.L. 114-113; P.L. 115-31; P.L. 115-141; P.L. 115-244; P.L. 116-94; and P.L. 116-260. Note: For an expanded historical and comparative view of appropriations, see Table C-1.
Denali Commission Denali Commission
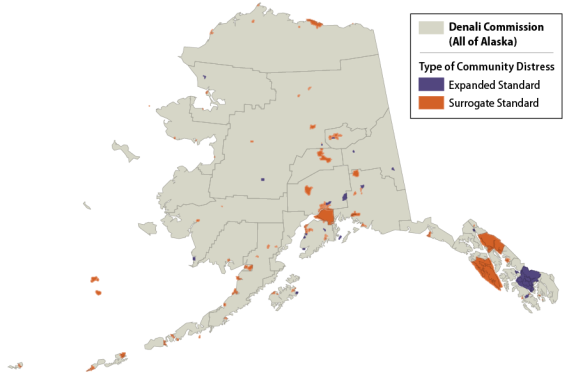
The Denali Commission was established in 1998 to support rural economic development in Alaska.4648 It is "“designed to provide critical utilities, infrastructure, and economic support
throughout Alaska."” The Denali Commission is unique as a single-state commission, and in its
reliance on federal funding for both administration and activities.
Overview of Structure and Activities
The commission'’s statutory mission includes providing workforce and other economic development assistance to distressed rural regions in Alaska. However, the commission no longer
engages in substantial activities in general economic development or transportation, which were once core elements of the Denali Commission'’s activities. Its recent activities are principally principal y
limited to coastal infrastructure protection and energy infrastructure and fuel storage projects.
Commission Structure
The Denali Commission'’s structure is unique as the only commission with a single-state mandate.
The commission is comprised of seven members (or a designated nominee), including the federal co-chair, appointed by the U.S. Secretary of Commerce; the Alaska governor, who is state co-chair (or his/her designated representative); the University of Alaska president; the Alaska Municipal League president; the Alaska Federation of Natives president; the Alaska State AFL-
CIO president; and the Associated General Contractors of Alaska president.47
49
These structural novelties offer a different model compared to the organization typified by the ARC and broadly adopted by the other functioning federal regional commissions and authorities. For example, the federal co-chair'’s appointment by the Secretary of Commerce, and not the
49 P.L. 105-277.
Congressional Research Service
15
Federal Regional Commissions and Authorities: Structural Features and Function
President with Senate confirmation, allows for a potentiallyal ows for a potential y more expeditious appointment of a
federal co-chair.
The Denali Commission is required by law to create an annual work plan, which solicits project
proposals, guides activities, and informs a five-year strategic plan.4850 The work plan is reviewed by the federal co-chair, the Secretary of Commerce, and the Office of Management and Budget, and is subject to a public comment period. The current FY2018-FY2022 strategic plan, released in October 2017, lists four strategic goals and objectives: (1) facilities management; (2) infrastructure protection from ecological change; (3) energy, including storage, production,
heating, and electricity; and (4) innovation and collaboration. The commission'’s recent activities
largely focus on energy and infrastructure protection.49
51 Distressed Areas
The Denali Commission'’s authorizing statute obligates the Commission to address economic distress in rural areas of Alaska.5052 As of 2018, the Commission utilizes two overlapping standards
to assess distress: a "“surrogate standard,"” adopted by the Commission in 2000, and an "“expanded standard."” These standards are applied to rural communities in Alaska and assessed by the Alaska Department of Labor and Workforce Development (DOL&WD), Research and Analysis Section. DOL&WD uses the most current population, employment, and earnings data available to identify
Alaska communities and Census Designated Places considered "“distressed."
”
Appeals can be made to community distress determinations, but only through a demonstration that DOL&WD data or analysis was erroneous, invalid, or outdated. New information "“must come from a verifiable source, and be robust and representative of the entire community and/or
population."” Appeals are accepted and adjudicated only for the same reporting year in question.
Recent Activities
The Denali Commission'’s scope is more constrained compared to the other federal regional commissions and authorities. The organization reports that due to funding constraints,5153 the commission reduced its involvement in what might be considered traditional economic
development and, instead, focused on rural fuel and energy infrastructure and coastal protection efforts.52
efforts.54
Since the Denali Commission'’s founding, bulk fuel safety and security, energy reliability and
security, transportation system improvements, and healthcare projects have commanded the vast majority of Commission projects.5355 Of these, only energy reliability and security and bulk fuel safety and security projects remain active and are still stil funded. Village Vil age infrastructure protection—a program launched in 2015 to address community infrastructure threatened by erosion, flooding
50 Denali Commission, Work Plans, https://www.denali.gov/work-plans/. 51 Denali Commission, Denali Commission Strategic Plan: FY2018-2022, October 4, 2017, https://www.denali.gov/wp-content/uploads/2018/03/Denali_Commission_FY2018_-_2022_Strategic_Plan_-_Final_Executed_document_-_10-4-17.pdf.
52 P.L. 105-277. 53 Denali Commission, Other Programs, https://www.denali.gov/programs/other-programs/ (accessed April 23, 2021). 54 Denali Commission, Denali Commission Strategic Plan: FY2018-2022, October 4, 2017, https://www.denali.gov/wp-content/uploads/2018/03/Denali_Commission_FY2018_-_2022_Strategic_Plan_-_Final_Executed_document_-_10-4-17.pdf.
55 Denali Commission, Denali Commission Investment Summary, May 2017, https://www.denali.gov/programs/.
Congressional Research Service
16
Federal Regional Commissions and Authorities: Structural Features and Function
program launched in 2015 to address community infrastructure threatened by erosion, flooding and permafrost degradation—is a program that is relatively new and still stil being funded.5456 By contrast, most "traditional"“traditional” economic development programs are no longer being funded,
including in housing, workforce development, and general economic development activities.55
57 Legislative History
106th Congress
-
106th Congress
In 1999, the Consolidated Appropriations Act, 2000 (P.L. 106-113) authorized the
commission to enter into contracts and cooperative agreements, award grants, and make payments
"“necessary to carry out the purposes of the commission."” The act also established the federal co-chair'’s compensation schedule, prohibited using more than 5% of appropriated funds for administrative expenses, and established"“demonstration health projects"” as authorized activities and authorized the Department of Health and Human Services to make grants to the commission to that effect.
108th Congress
-
108th Congress
The Consolidated Appropriations Act, 2004 (P.L. 108-199) created an Economic
Development Committee within the commission chaired by the Alaska Federation of Natives president, and included the Alaska
109th Congress
-
109th Congress
In 2005, the Safe, Accountable, Flexible, Efficient Transportation Equity Act: A
Legacy for Users, or SAFETEA-LU (P.L. 109-59), established the Denali Access
System Program among the commission
'’s authorized activities. The program was part of its surface transportation efforts, which were active from 2005 through 2009.58 112th Congress 2012’2009.56
112th Congress
2012's Moving Ahead for Progress in the21st21st Century Act, or MAP-21 (P.L. 112-141141), authorized the commission to accept funds from federal agencies,allowedal owed it to accept gifts or donations of"“service, property, or money"” on behalf of the U.S. government, and included guidance regarding gifts.
114th Congress
-
114th Congress
In 2016, the Water Infrastructure Improvements for the Nation Act, or the WIIN
Act (P.L. 114-322), reauthorized the Denali Commission through FY2021, and established a four-year term for the federal co-chair (with
allowances foral owances for 56 Denali Commission, Village Infrastructure Protection, https://www.denali.gov/programs/village-infrastructure-protection/. 57 Denali Commission, Denali Commission Investment Summary, May 2017, https://www.denali.gov/programs/. 58 U.S. Department of T ransportation, Federal Highway Administration, Fact Sheet on Highway Provisions: Denali Access System Program , https://www.fhwa.dot.gov/safetealu/factsheets/denali.htm. Congressional Research Service 17 link to page 23 link to page 40 link to page 24 Federal Regional Commissions and Authorities: Structural Features and Function reappointment), but provided that other members were appointed for life. The act alsoallowedal owed for the Secretary of Commerce to appoint an interim federal co-chair, and included clarifying language on the non-federal status of commission staff and ethical issues regarding conflicts of interest and disclosure.
Funding History
Under its authorizing statute, the Denali Commission received funding authorizations for $20 million mil ion for FY1999,5759 and "“such sums as necessary"” (SSAN) for FY2000 through FY2003.
Legislation passed in 2003 extended the commission'’s SSAN funding authorization through 2008.5860 Its authorization lapsed after 2008; reauthorizing legislation was introduced in 2007,5961 but was not enacted. The commission continued to receive annual appropriations for FY2009 and several years thereafter.6062 In 2016, legislation was enacted reauthorizing the Denali Commission
through FY2021 with a $15 million mil ion annual funding authorization (Table 4).61
.63
Table 4. Denali Commission:
Authorized and Appropriated Funding, FY2010-FY2021
$ in mil ions
FY10 FY11 FY12 FY13 FY14 FY15 FY16 FY17 FY18 FY19 FY20 FY21
Appropriated
11.97
10.7
10.68
10.68
10.00
10.00
11.00
15.00
30.00
15.00
15.00
15.00
Funding
Authorized
—
—
—
—
—
—
—
15.00
15.00
15.00
15.00
15.00
Funding
Sources: Appropriated funding amounts compiled by CRS using data from the fol owing: P.L. 111-85; P.L. 112-10; P.L. 112-74; P.L. 113-6; P.L. 113-76; P.L. 113-235; P.L. 114-113; P.L. 115-31; P.L. 115-141; P.L. 115-244; P.L. 116-94; and P.L. 116-260. Note: For an expanded historical and comparative view of appropriations, see Table C-1.
Authorized and Appropriated Funding, FY2010-FY2019
$ in millions
|
FY08 |
FY09 |
FY10 |
FY11 |
FY12 |
FY13 |
FY14 |
FY15 |
FY16 |
FY17 |
FY18 |
FY19 |
|
|
Appropriated Funding |
21.8 |
11.8 |
11.97 |
10.7 |
10.68 |
10.68 |
10.00 |
10.00 |
11.00 |
15.00 |
30.00 |
15.00 |
|
Authorized Funding |
SSAN |
— |
— |
— |
— |
— |
— |
— |
— |
15.00 |
15.00 |
15.00 |
Source: Appropriated funding amounts compiled by CRS using data from the following: P.L. 110-161; P.L. 111-8; P.L. 111-85; P.L. 112-10; P.L. 112-74; P.L. 112-75; P.L. 113-76; P.L. 113-235; P.L. 114-113; P.L. 115-31; and P.L. 115-14.
Northern Border Regional Commission
Northern Border Regional Commission The Northern Border Regional Commission (NBRC) was created by the Food, Conservation, and
Energy Act of 2008, otherwise known as the 2008 farm bill.62bil .64 The act also created the Southeast Crescent Regional Commission (SCRC) and the Southwest Border Regional Commission
(SBRC). All Al three commissions share common authorizing language modeled after the ARC.
The NBRC is the only one of the three new commissions that has been both reauthorized and received progressively increasing annual appropriations since it was established in 2008. The NBRC was founded to alleviateal eviate economic distress in the northern border areas of Maine, New
Hampshire, New York, and, as of 2018, the entire state of Vermont (Figure 4).
59 P.L. 105-277. 60 P.L. 108-7, §504. 61 S. 1368, 110th Cong. (2007). 62 P.L. 111-8. 63 P.L. 114-322. 64 P.L. 110-234.
Congressional Research Service
18
link to page 48
Federal Regional Commissions and Authorities: Structural Features and Function
(Figure 4).
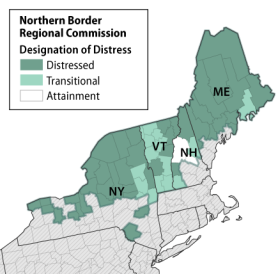
The stated mission of the NBRC is "“to catalyze regional, collaborative, and transformative
community economic development approaches that alleviateal eviate economic distress and position the region for economic growth."63”65 Eligible counties within the NBRC'’s jurisdiction may receive funding "“for community and economic development"” projects pursuant to regional, state, and
local planning and priorities (Table CD-4).
.
Overview of Structure and Activities
The NBRC is led by a federal co-chair, appointed by the President with the advice and consent of the Senate, and four state governors, of which one is appointed state co-chair. There is no term
limit for the federal co-chair. The state co-chair is limited to two consecutive terms, but may not serve a term of less than one year. Each of the four governors may appoint an alternate; each state also designates an NBRC program manager to handle the day-to-day operations of coordinating,
reviewing, and recommending economic development projects to the full membership.64
66
While program funding depends on congressional appropriations, administrative costs are shared equallyequal y between the federal government and the four states of the NBRC. Through commission
votes, applications are ranked by priority, and are approved in that order as grant funds allow.
Program Areas
All al ow.
Program Areas
Al projects are required to address at least one of the NBRC'’s four authorized program areas and its five-year strategic plan. The NBRC'’s four program areas are: (1) economic and infrastructure development (EID); (2) comprehensive planning for states; (3) local development districts; and
(4) the regional forest economy partnership.
Economic
65 Northern Border Regional Commission, About the NBRC, http://www.nbrc.gov/content/about. 66 Northern Border Regional Commission, About the NBRC, http://www.nbrc.gov/content/about.
Congressional Research Service
19
Federal Regional Commissions and Authorities: Structural Features and Function
Economic and Infrastructure Development (EID)
The NBRC’and Infrastructure Development (EID)
The NBRC's state EID investment program is the chief mechanism for investing in economic development programs in the participating states. The EID program prioritizes projects focusing on infrastructure, telecommunications, energy costs, business development, entrepreneurship, workforce development, leadership, and regional strategic planning.6567 The EID program provides
approximately $3.5 million mil ion to each state for such activities. Eligible applicants include public bodies, 501(c) organizations, Native American tribes, and the four state governments. EID
projects may require matching funds of up to 50% depending on the level of distress.
Comprehensive Planning
The NBRC may also assist states in developing comprehensive economic and infrastructure
development plans for their NBRC counties. These initiatives are undertaken in collaboration
with LDDs, localities, institutions of higher education, and other relevant stakeholders.66
68 Local Development Districts (LDD)
The NBRC uses 16 multicounty LDDs to advise on local priorities, identify opportunities, conduct outreach, and administer grants, from which the LDDs receive fees.6769 LDDs receive fees
according to a graduated schedule tied to total project funds. The rate is 5% for the first $100,000 awarded and 1% in excess of $100,000. Notably, this formula does not apply to Vermont-only projects. Vermont is the only state where grantees are not required to contract with an LDD for
the administration of grants, though this requirement may be waived.68
70
Regional Forest Economy Partnership (RFEP)
The RFEP is an NBRC program to address economic distress caused by the decline of the regional forest products industry.6971 The program provides funding to rural communities for "“economic diversity, independence, and innovation."” The NBRC received $7 million 3 mil ion in FY2018 and $4 mil ion and FY2019 to address the decline in the forest-based economies in the NBRC region.70
region.72 In FY2020, $4 mil ion was made available for the program.73
67 Northern Border Regional Commission, State Economic & Infrastructure Development Investment Program , http://www.nbrc.gov/content/economic-infrastructure-development-investments.
68 Northern Border Regional Commission, Comprehensive Planning Investments for States, http://www.nbrc.gov/content/planning-for-states. 69 Northern Border Regional Commission, Local Development Districts, http://www.nbrc.gov/content/local-development -districts.
70 Northern Border Regional Commission, Administration: General Grant Administration, http://www.nbrc.gov/content/administration. 71 Northern Border Regional Commission, Regional Forest Economy Partnership, http://www.nbrc.gov/content/Regional-Forest -Economy-Partnership.
72 Northern Border Regional Commission, Regional Forest Economy Partnership: Notice of Funding Opportunity, http://www.nbrc.gov/uploads/RegionalForestEconomyParternship(5).pdf.
73 Northern Border Regional Commission, Northern Border Regional Commission Announces 2020 Regional Forest Econom y Partnership Grant Round, July 1, 2020, https://www.nbrc.gov/articles/94.
Congressional Research Service
20
link to page 48 Federal Regional Commissions and Authorities: Structural Features and Function
Strategic Plan
The NBRC’Strategic Plan
The NBRC's activities are guided by a five-year strategic plan,7174 which is developed through "“extensive engagement with NBRC stakeholders"” alongside "“local, state, and regional economic
development strategies already in place."” The 2017-2021 strategic plan lists three goals:
1.1. modernizing infrastructure;2.2. creating and sustaining jobs; and3.3. anticipating and capitalizing72
75 The strategic plan also lists five-year performance goals, which are:
- 5,000 jobs created or retained;
- 10,000 households and businesses with access to improved infrastructure;
- 1,000 businesses representing 5,000 employees benefit from NBRC investments;
- 7,500 workers provided with
skills training; - skil s training; 250 communities and 1,000 leaders engaged in regional leadership, learning and/or innovation networks supported by the NBRC; and
-
3:1 NBRC investment leverage.
73
76 The strategic plan also takes stock of various socioeconomic trends in the northern border region, including (1) population shifts; (2) distressed communities; and (3) changing workforce needs.
Economic and Demographic Distress
The NBRC is unique in that it is statutorily obligated to assess distress according to economic as well wel as demographic factors (Table CD-4). These designations are made and refined annuallyannual y. The NBRC defines levels of "distress"“distress” for counties that "“have high rates of poverty, unemployment, or outmigration"” and "“are the most severely and persistently economic distressed and underdeveloped."74
underdeveloped.”77 The NBRC is required to allocateal ocate 50% of its total appropriations to projects in
distressed counties.75
78
The NBRC'’s county designations are as follows, in descending levels of distress:
-
Distressed counties (80% maximum funding
allowance); - al owance); Transitional counties (50%); and
- Attainment (0%).
74 Northern Border Regional Commission, 2017-2021 Strategic Plan, Concord, NH, 2017, http://www.nbrc.gov/content/strategic-plan.
75 Northern Border Regional Commission, Northern Border Regional Commission: 2017-2021 Strategic Plan, http://www.nbrc.gov/uploads/004%20RESOURCES/Five%20Yr%20Strat%20Plan/NBRC%20Strategic%20Plan%2C%20Full%20Study.pdf.
76 Northern Border Regional Commission, 2017-2021 Strategic Plan, Concord, NH, 2017, p. 6. 77 P.L. 110-234. 78 Northern Border Regional Commission, NBRC Annual Economic & Demographic Research for Fiscal Year 2021: T o Determine Categories of Distress within the NBRC Service Area, Concord, NH, March 2021, https://www.nbrc.gov/userfiles/files/Resource%20Guides/NBRC%20Annual%20Economic%20%26%20Demo graphic%20Research%20for%20Fiscal%20Year%202021_FINAL.pdf.
Congressional Research Service
21
Federal Regional Commissions and Authorities: Structural Features and Function
Transitional counties are defined as counties that do not exhibit the same levels of economic and demographic distress as a distressed county, but suffer from "“high rates of poverty, unemployment, or outmigration."” Attainment counties are not allowedal owed to be funded by the NBRC except for those projects that are located within an "“isolated area of distress,"” or have been
granted a waiver.76
79 Distress is calculated in tiers of primary and secondary distress categories and constituent factors:
- Primary Distress Categories
1.1. Percent of population below the poverty level2.2. Unemployment rate3.3. Percent change in population Secondary Distress Categories 1. Percent of population below the poverty level 2. Median household income 3.Percent change in population- Secondary Distress Categories
- 4. Percent of population below the poverty level
- 5. Median household income
6.Percent of secondary and/or seasonal homes
Each county is assessed by the primary and secondary distress categories and factors and
compared to the figures for the United States as a whole. Designations of county distress are
made by tallying tal ying those factors against the following criteria:
- Distressed counties are those with at least three factors from both primary and secondary distress categories and at least one from each category;
- Transitional counties are those with at least one factor from either category; and
- Attainment counties are those which show no measures of distress.
Legislative History
110th Congress
-
110th Congress
The NBRC was first proposed in the Northern Border Economic Development
Commission Act of 2007 (H.R. 1548), introduced on March 15, 2007. H.R. 1548
federally-federal y chartered, multi-state economic development organization—modeled after the ARC—covering designated northern border counties in Maine, New Hampshire, New York, and Vermont. Thebillbil would have authorized the appropriation of $40millionmil ion per year for FY2008 through FY2012 (H.R. 1548). Thebillbil received regional co-sponsorship from Members of Congress representing areas in the northern border region.77 - 80
The NBRC was reintroduced in the Regional Economic and Infrastructure
Development Act of 2007 (H.R. 3246
), which would have authorized the NBRC,), which would have authorized the NBRC, 79 Northern Border Regional Commission, NBRC Annual Economic & Demographic Research for Fiscal Year 2021: T o Determine Categories of Distress within the NBRC Service Area, Concord, NH, March 2021, https://www.nbrc.gov/userfiles/files/Resource%20Guides/NBRC%20Annual%20Economic%20%26%2 0Demographic%20Research%20for%20Fiscal%20Year%202021_FINAL.pdf. 80 T he bill was introduced by Rep. Hodes, Paul [D-NH-2] and co-sponsored by: Rep. Arcuri, Michael A. [D-NY-24]; Rep. Allen, T homas H. [D-ME-1]; Rep. McHugh, John M. [R-NY-23]; Rep. Michaud, Michael H. [D-ME-2]; Rep. Shea-Porter, Carol [D-NH-1]; and Rep. Welch, Peter [D-VT -At Large]. Congressional Research Service 22 link to page 28 link to page 28 Federal Regional Commissions and Authorities: Structural Features and Function the SCRC, and the SBRC, and reauthorized the DRA and the NGPRA (discussed in the next section) in a combinedbill.78bil .81 H.R. 3246 won a broader range of support, which included 18 co-sponsors in addition to the originalbillbil sponsor, and passed the House by a vote of 264-154 on October 4, 2007. -
Upon House passage, H.R. 3246 was referred to the Senate Committee on
Environment and Public Works. The Senate incorporated authorizations for the establishment of the NBRC, SCRC, and the SBRC in the 2008 farm bill.
7982 The 2008 farmbillbil authorized annual appropriations of $30millionmil ion for FY2008 through FY2012 forallal three new commissions.
115th Congress
-
115th Congress
The only major changes to the NBRC since its creation were made in the
Agriculture Improvement Act of 2018 (P.L. 115-334), or the 2018 farm
bill,bil , which authorized the state capacity building grant program. -
In addition, the 2018 farm
billbil expanded the NBRC to include the following counties: Belknap and Cheshire counties in New Hampshire; Genesee, Greene, Livingston, Montgomery, Niagara, Oneida, Orleans, Rensselaer, Saratoga, Schenectady, Sullivan, Washington, Warren, Wayne, and Yates counties in New York; and Addison, Bennington, Chittenden, Orange, Rutland, Washington, Windham, and Windsor counties in Vermont, making it the only state entirely within the NBRC.
Funding History
Since its creation, the NBRC has received consistent authorizations of appropriations (Table 5). The 2008 farm bill bil authorized the appropriation of $30 million mil ion for the NBRC for each of FY2008 through FY2013 (P.L. 110-234); the same in the 2014 farm bill bil for each of FY2014 through
FY2018 (P.L. 113-79); and $33 million mil ion for each of FY2019 through FY2023 (P.L. 115-334).
).
Due to its statutory linkages to the SCRC and SBRC, all al three commissions also share common authorizing legislation and identical funding authorizations. To date, the NBRC is the only commission of the three to receive substantial annual appropriations. Congress has funded the NBRC since FY2010 (Table 5). The NBRC'’s appropriated funding level has increased from $5 million in FY2014,80 to $7.5 million
mil ion in FY2014 to $7.5 mil ion in FY2016, $10 mil ion in FY2016,81 $10 million in FY2017,82 $15 million in FY2018,83 and $20 million in FY2019.84
|
FY08 |
FY09 |
FY10 |
FY11 |
FY12 |
FY13 |
FY14 |
FY15 |
FY16 |
FY17 |
FY18 |
FY19 |
|
|
Appropriated Funding |
— |
— |
1.5 |
1.5 |
1.5 |
1.5 |
5.0 |
5.0 |
7.5 |
10.0 |
15.0 |
20.0 |
|
Authorized Funding |
30.0 |
30.0 |
30.0 |
30.0 |
30.0 |
30.0 |
30.0 |
30.0 |
30.0 |
30.0 |
30.0 |
33.0 |
Sources: Authorized funding amounts compiled by CRS using data from P.L. 110-234, P.L. 113-79, and P.L. 115-334. Appropriated funding amounts compiled by CRS using data from the following: in FY2017, $15 mil ion in FY2018,
$20 mil ion in FY2019, $25 mil ion in FY2020, and $30 mil ion in FY2021.
Table 5. NBRC Authorized and Appropriated Funding, FY2010-FY2021
$ in mil ions
FY10
FY11
FY12
FY13
FY14
FY15
FY16
FY17
FY18
FY19
FY20
FY21
Appropriated
Funding
1.5
1.5
1.5
1.5
5.0
5.0
7.5
10.0
15.0
20.0
25.0
30.0
Authorized
30.0
30.0
30.0
30.0
30.0
30.0
30.0
30.0
30.0
33.0
33.0
33.0
Funding
81 T he Regional Economic and Infrastructure Development Act of 2007, H.R. 3246. 82 Food, Conservation, and Energy Act of 2008, P.L. 110-234.
Congressional Research Service
23
link to page 40
Federal Regional Commissions and Authorities: Structural Features and Function
Sources: Appropriated funding amounts compiled by CRS using data from the fol owing: P.L. 111-85; ; P.L. 112-10; 10; P.L. 112-74; ; P.L. 113-6; ; P.L. 113-76; ; P.L. 113-235; ; P.L. 114-113; ; P.L. 115-31; ; P.L. 115-141; P.L. 115-244; P.L. 116-94; and P.L. 115-244.
P.L. 116-260. Note: For an expanded historical and comparative view of appropriations, see Table C-1. Northern Great Plains Regional Authority
The Northern Great Plains Regional Authority was created by the 2002 farm bill.8583 The NGPRA was created to address economic distress in Iowa, Minnesota, Missouri (other than counties
included in the Delta Regional Authority), North Dakota, Nebraska, and South Dakota.
Figure 5. Map of the Northern Great Plains Regional Authority |
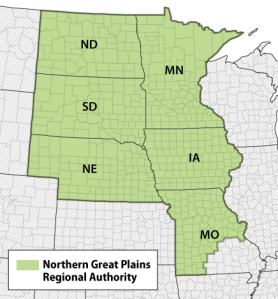 |
Source: Compiled Notes: Missouri |
The NGPRA appears to have been briefly active shortly after it was created, when it received its only annual appropriation from Congress. The NGPRA'’s funding authorization lapsed at the end
of FY2018; it was not reauthorized.
Structure and Activities
Authority Structure
The NGPRA featured broad similarities to the basic structure shared among most of the federal regional authorities and commissions, being a federal-state partnership led by a federal co-chair (appointed by the President, with the advice and consent of the Senate) and governors of the participating states, of which one was designated as the state co-chair.
Unique to the NGPRA were certain structural novelties reflective of regional socio-political features. The NGPRA also included a Native American tribal co-chair, who was the chairperson
83 P.L. 107-171.
Congressional Research Service
24
Federal Regional Commissions and Authorities: Structural Features and Function
of an Indian tribe in the region (or their designated representative), and appointed by the President, with the advice and consent of the Senate. The tribal co-chair served as the "“liaison between the governments of Indian tribes in the region and the [NGPRA]."” No term limit is established in statute; the only term-related proscription is that the state co-chair "shall “shal be elected
by the state members for a term of not less than 1 year."
”
Another novel feature among the federal regional commissions and authorities was also the NGPRA'NGPRA’s statutory reliance on a 501(c)(3) non-profitnonprofit corporation—Northern Great Plains, Inc.—in furtherance of its mission. While Northern Great Plains, Inc. was statutorily organized to
complement the NGPRA'’s activities, it effectively served as the sole manifestation of the NGPRA concept and rationale while it was active, given that the NGPRA was only once appropriated funds and never appeared to exist as an active organization. The Northern Great Plains, Inc. was active for several years, and reportedly received external funding,8684 but is
currently defunct.
Activities and Administration
Under its authorizing statute,8785 the federal government would initially fund all initial y fund al administrative costs in FY2002, which would decrease to 75% in FY2003, and 50% in FY2004. Also, the NGPRA would have designated levels of county economic distress; 75% of funds were reserved for the most distressed counties in each state, and 50% reserved for transportation, telecommunications, and basic infrastructure improvements. Accordingly, non-distressed
communities were eligible to receive no more than 25% of appropriated funds.
The NGPRA was also structured to include a network of designated, multi-county LDDs at the sub-state levels. As with its sister organizations, the LDDs would have served as nodes for project implementation and reporting, and as advisors to their respective states and the NGPRA as a whole.
Legislative History
103rd Congress
-
103rd Congress
The Northern Great Plains Rural Development Act (P.L. 103-318), which became
law in 1994, established the Northern Great Plains Rural Development Commission to study economic conditions and provide economic development planning for the Northern Great Plains region. The Commission was comprised of the governors (or designated representative) from the Northern Great Plains states of Iowa, Minnesota, North Dakota, Nebraska, and South Dakota (prior to
Missouri'Missouri’s inclusion), along with one member from each of those states appointed by the Secretary of Agriculture.
104th Congress
-
104th Congress
The Agricultural, Rural Development, Food and Drug Administration, and
Related Agencies Appropriations Act, 1995 (P.L. 103-330) provided $1,000,000 to carry out the Northern Great Plains Rural Development Act. The Commission
84 W.K. Kellogg Foundation, Grants: Northern Great Plains, Inc., https://www.wkkf.org/grants/grant/2007/09/the-meadowlark-project -a-leadership-laboratory-on-the-future-of-the-northern-great-plains-3004879.
85 P.L. 107-171.
Congressional Research Service
25
Federal Regional Commissions and Authorities: Structural Features and Function
produced a 10-year plan to address economic development and distress in the five states. After a legislative extension (P.L. 104-327), the report was submitted in 1997.
8886 The Northern Great Plains Initiative for Rural Development (NGPIRD), anon-profitnonprofit 501(c)(3), was established to implement theCommission'Commission’s advisories.
107th Congress
-
107th Congress
The Farm Security and Rural Investment Act of 2002, or 2002 farm
bill (bil (P.L. 107-171), authorized the NGPRA, which superseded the Commission. The statute also created Northern Great Plains, Inc., a 501(c)(3), as a resource for regional issues and international trade, which supplanted the NGPIRD with a broader remit that included research, education, training, and issues of international trade.
110th Congress
-
110th Congress
The Food, Conservation, and Energy Act of 2008, or 2008 farm
bill (bil (P.L. 110-246246), extended the NGPRA'’s authorization through FY2012. The legislation also expanded the authority to include areas of Missouri not covered by the DRA, and provided mechanisms to enable the NGPRA to begin operations even without the Senate confirmation of a federal co-chair, aswellwel as in the absence of a confirmed tribal co-chair. -
The Agricultural Act of 2014, or 2014 farm
bill (bil (P.L. 113-79), reauthorized the NGPRA and the DRA, and extended their authorizations from FY2012 to FY2018.
Funding History
The NGPRA was authorized to receive $30 million annually mil ion annual y from FY2002 to FY2018. It received
appropriations once for $1.5 millionmil ion in FY2004.8987 Its authorization of appropriations lapsed at the
end of FY2018.
Southeast Crescent Regional Commission
The Southeast Crescent Regional Commission (SCRC) was created by the 2008 farm bill,90 bil ,88 which also created the NBRC and the Southwest Border Regional Commission. All three Al three
commissions share common authorizing language modeled after the ARC.
The SCRC is not currently active. It has received regular appropriations of $250,000 annual y from FY2010 through FY2020, but it has not been able to form due to the absence of an
appointed federal co-chair. However, for FY2021, the SCRC was appropriated a substantial
increase of $1 mil ion.89
86 Federal Reserve Bank of Minneapolis, “Great P lains Commission Completes Work, Looks to Region’s Future,” Minneapolis, MN, April 1, 1997, https://www.minneapolisfed.org/publications/fedgazette/great-plains-commission-completes-work-looks-to-regions-future.
87 P.L. 108-199. 88 P.L. 110-234. 89 For more information, see CRS In Focus IF11744, Forming a Funded Federal Regional Commission, by Michael H. Cecire.
Congressional Research Service
26
link to page 32
Federal Regional Commissions and Authorities: Structural Features and Function
The SCRC is not currently active. The SCRC was created to address economic distress in areas of Virginia, North Carolina, South Carolina, Georgia, Alabama, Mississippi, and Florida (Figure 6) not served by the ARC or the
DRA (Table 13).
Figure 6. Map of the Southeast Crescent Regional Commission |
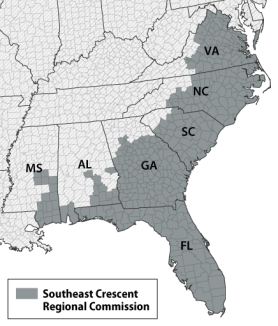 |
Source: Compiled Notes: The SCRC is statutorily defined as including those counties in the named states that are not already included in the ARC or the DRA. |
Overview of Structure and Activities
As authorized, the SCRC would share an organizing structure with the NBRC and the Southwest
Border Regional Commission, as all al three share common statutory authorizing language modeled
after the ARC.
As authorized, the SCRC would consist of a federal co-chair, appointed by the President with the advice and consent of the Senate, along with the participating state governors (or their designated representatives), of which one would be named by the state representatives as state co-chair. There is no term limit for the federal co-chair. However, the state co-chair is limited to two consecutive terms, but may not serve a term of less than one year. However, no federal co-chair
has been appointed since the SCRC was authorized; therefore, the commission cannot form and
begin operations.
Legislative History
The SCRC concept was first introduced by university researchers working on rural development issues in 1990 at Tuskegee University'’s Annual Professional Agricultural Worker'’s Conference
for 1862 and 1890 Land-Grant Universities.
In 1994, the Southern Rural Development Commission Act was introduced in the House Agricultural Committee, which would provide the statutory basis for a "“Southern Black Belt Commission."91
Congressional Research Service
27
link to page 28 link to page 40 Federal Regional Commissions and Authorities: Structural Features and Function
Commission.”90 While the concept was not reintroduced in Congress until the 2000s, various nongovernmental initiatives sustained discussion and interest in the concept in the intervening period. Supportive legislation was reintroduced in 2002, which touched off other accompanying legislative
legislative efforts until the SCRC was authorized in 2008.92
91 Funding History
Congress authorized $30 millionmil ion funding levels for each fiscal year from FY2008 to FY2018, and $33 mil ion $33 million in FY2019, and appropriated $250,000 in each fiscal year from FY2010 to FY2019 FY2020.
In FY2021, the SCRC was appropriated $1 mil ion for the first time (Table 5). Despite receiving regular appropriations since it was authorized in 2008, a review of government budgetary and fiscal sources yields no record of the SCRC receiving, obligating, or spending funds appropriated by Congress. In successive presidential administration budget requests (FY2013, FY2015-
FY2017), no funding was requested.93
92
In the U.S. Treasury 2018 Combined Statement of Receipts, Outlays, and Balances, Part III,9493 the SCRC does not appear, further indicating that the SCRC remains unfunded. Notably, the Commission for the Preservation of America'’s Heritage Abroad, which has periodicallyperiodical y shared a
common section with the SCRC in presidential budgets, is listed in the 2018 Combined
Statement, as it is elsewhere.
Despite recent appropriations, no federal co-chair has been appointed, and the SCRC cannot
form. According to statute, a federal co-chair is required for the formation of a commission
quorum and making decisions.94
Table 6. SCRC Authorized and Appropriated Funding, FY2010-FY2021
$ in mil ions
FY10
FY11
FY12 FY13 FY14 FY15 FY16 FY17 FY18 FY19 FY20 FY21
Appropriated
0.25
0.25
0.25
0.25
0.25
0.25
0.25
0.25
0.25
0.25
0.25
1.00
Funding
Authorized
30.00
30.00
30.00
30.00
30.00
30.00
30.00
30.00
30.00
33.00
33.00
33.00
Funding
Sources: Appropriated funding amounts compiled by CRS using data from the fol owing: P.L. 111-85; P.L. 112-10; P.L. 112-74; P.L. 113-6; P.L. 113-76; P.L. 113-235; P.L. 114-113; P.L. 115-31; P.L. 115-141; P.L. 115-244; P.L. 116-94; and P.L. 116-260. Note: For an expanded historical and comparative view of appropriations, see Table C-1.
90 H.R. 3901. 91 40 U.S.C. §15731. 92 In addition, in a review of the relevant SF 133 Reports on Budget Execution and Budgetary Resources, the SCRC is not listed by the Office of Management and Budget in its list of reported agencies, and subsequently offers no relevant funding reports on the SCRC. T he SF 133 Report on Budget Execution and Budgetary Resources fulfills the requirement in 31 U.S.C. §§1511-1514 that the President review federal expenditures at least four times a year.
93 U.S. T reasury 2018 Combined Statement of Receipts, Outlays, and Balances, P art III, https://fiscal.treasury.gov/reports-statements/combined-statement/current.html. 94 40 U.S.C. §15302.
Congressional Research Service
28
link to page 34
Federal Regional Commissions and Authorities: Structural Features and Function
Statement, as it is elsewhere.
|
FY08 |
FY09 |
FY10 |
FY11 |
FY12 |
FY13 |
FY14 |
FY15 |
FY16 |
FY17 |
FY18 |
FY19 |
|
|
Appropriated Funding |
— |
— |
0.25 |
0.25 |
0.25 |
0.25 |
0.25 |
0.25 |
0.25 |
0.25 |
0.25 |
0.25 |
|
Authorized Funding |
30.00 |
30.00 |
30.00 |
30.00 |
30.00 |
30.00 |
30.00 |
30.00 |
30.00 |
30.00 |
30.00 |
33.00 |
Sources: Appropriated funding amounts compiled by CRS using data from the following: P.L. 111-85; P.L. 112-10; P.L. 112-74; P.L. 113-6; P.L. 113-76; P.L. 113-235; P.L. 114-113; P.L. 115-31; P.L. 115-141; and P.L. 115-244.
Southwest Border Regional Commission
Southwest Border Regional Commission The Southwest Border Regional Commission (SBRC) was created with the enactment of the Food, Conservation, and Energy Act of 2008, or the 2008 farm bill (P.L. 110-234), which also created the NBRC and the SCRC. All Al three commissions share common statutory authorizing
language modeled after the ARC.
The SBRC was created to address economic distress in the southern border regions of Arizona, California, New Mexico, and Texas (Figure 7; Table 1515). The SBRC has not received an annual
appropriation since it was created and is not currently active.
Figure 7. Map of the Southwest Border Regional Commission |
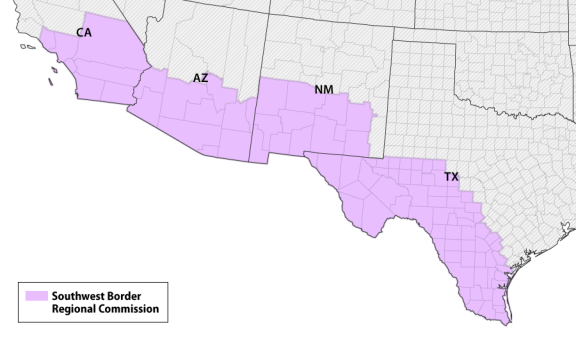 |
Source: Compiled |
Overview of Structure and Activities
As authorized, the SBRC would share an organizing structure with the NBRC and the SCRC, as all
al three commissions share common statutory authorizing language modeled after the ARC.
By statute, the SBRC consists of a federal co-chair, appointed by the President with the advice and consent of the Senate, along with the participating state governors (or their designated representatives), of which one would be named by the state representatives as state co-chair. As enacted in statute, there is no term limit for the federal co-chair. However, the state co-chair is limited to two consecutive terms, but may not serve a term of less than one year. However, as no federal co-chair has been appointed since the SCRC was authorized, it is not operational.
Legislative History
The concept of an economic development agency focusing on the southwest border region has existed at least since 1976, though the SBRC was established through more recent efforts.
-
Congressional Research Service
29
Federal Regional Commissions and Authorities: Structural Features and Function
Executive Order 13122 in 1999 created the Interagency Task Force on the
Economic Development of the Southwest Border,
9595 which examined issues of socioeconomic distress and economic development in the southwest border regions and advised on federal efforts to address them.
108th Congress
-
108th Congress
In February 2003, a
"“Southwest Regional Border Authority"” was proposed inS. 548S. 548. A companionbill,bil , H.R. 1071, was introduced in March 2003. The SBRC was reintroduced in the Regional Economic and Infrastructure Development Act of 2003 (H.R. 3196), which would have authorized the SBRC, the DRA, the NGPRA, and the SCRC.
109th Congress
-
109th Congress
In 2006, the proposed Southwest Regional Border Authority Act would have
created the
"“Southwest Regional Border Authority" (” (H.R. 5742S. 458S. 458 in 2003.
110th Congress
-
110th Congress
In 2007, SBRC was reintroduced in the Regional Economic and Infrastructure
Development Act of 2007 (H.R. 3246), which would have authorized the SBRC, the SCRC, and the NBRC, and reauthorized the DRA and the NGPRA in a combined
bill. - bil .
Upon House passage, the Senate incorporated authorizations for the
establishment of the NBRC, SCRC, and SBRC in the 2008 farm bill. The 2008 farm bill authorized annual appropriations of $30
millionmil ion for FY2008 through FY2012 forallal three of the new organizations.
Funding History
Congress authorized annual funding of $30 million mil ion for the SBRC from FY2008 to FY2018, and $33 mil ion for each of FY2019-FY2023.96 Until FY2020, the SBRC had$33 million in FY2019. The SBRC has never received annual appropriations and is not active.
For FY2021, however, the SBRC was appropriated $250,000 for the first time. Upon the appointment of a federal co-chair, the SBRC could convene and begin the
process of activation.97
Table 7. SBRC Authorized and Appropriated Funding, FY2010-FY2021
$ in mil ions
FY1
FY1
FY1
FY1
FY1
FY1
FY1
FY1
FY1
FY1
FY2
FY2
0
1
2
3
4
5
6
7
8
9
0
1
Appropriated
-
-
-
-
-
-
-
-
-
-
-
0.25
Funding
95 Executive Order 13122, “Interagency T ask Force on the Economic Development of the Southern Border,” 64 Federal Register 29201-29202, May 25, 1999.
96 40 U.S.C. §15751. 97 For more information, see CRS In Focus IF11744, Forming a Funded Federal Regional Commission, by Michael H. Cecire.
Congressional Research Service
30
link to page 40 Federal Regional Commissions and Authorities: Structural Features and Function
FY1
FY1
FY1
FY1
FY1
FY1
FY1
FY1
FY1
FY1
FY2
FY2
0
1
2
3
4
5
6
7
8
9
0
1
Authorized
Funding
30.00
30.00
30.00
30.00
30.00
30.00
30.00
30.00
30.00
33.00
33.00
33.00
Source: Appropriated funding amounts compiled by CRS using data from P.L. 116-260. Note: For an expanded historical and comparative view of appropriations, see Table C-1.
Concluding Notes Concluding Notes
Given their geographic reach, broad activities, and integrated intergovernmental structures, the federal regional commissions and authorities are a significant element of federal economic development efforts. At the same time, as organizations that are largely governed by the respective state-based commissioners, the federal regional commissions and authorities are not
typical federal agencies but federally-federal y chartered entities that integrate federal funding and direction
with state and local economic development priorities.
This structure provides Congress with a flexible platform for economic development efforts. The
intergovernmental structure allowsal ows for strategic-level economic development initiatives to be launched at the federal level and implemented across multi-state jurisdictions with extensive state
and local input, and more adaptable to regional needs.
The federal regional commissions and authorities reflect an emphasis by the federal government on place-based economic development strategies sensitive to regional and local contexts. However, the geographic specificity and varying functionality of the statutorily authorized federal regional commissions and authorities, both active and inactive, potentiallypotential y raise questions about
the efficacy and equity of federal economic development policies.
More in-depth analysis of these and other such issues related to the federal regional authorities and commissions, and their role as instruments for federal economic development efforts, is reserved for possible future companion products to this report.
Appendix A.
Congressional Research Service
31
Federal Regional Commissions and Authorities: Structural Features and Function
Appendix A. Basic Information at a Glance
Basic Information at a Glance
|
Number of States |
|
FY2019 Appropriations |
|
|
ARC |
1965 |
13 |
420, which includes the entire state of West Virginia |
$165.00 |
|
DRA |
2000 |
8 |
252 |
$30.00 |
|
Denali Commission |
1998 |
1 |
Entire state of Alaska |
$15.00 |
|
NBRC |
2008 |
4 |
60 |
$20.00 |
|
NGPRC |
2002 |
6 |
|
N/A |
|
SCRC |
2008 |
7 |
|
$0.25 |
|
SBRC |
2008 |
4 |
93 |
N/A |
Sources: Data compiled by CRS from relevant legislation and official sources of various federal regional commissions and authorities. Authorizing statutes include, in order of tabulation: P.L. 89-4; P.L. 106-554; ; P.L. 105-277; ; P.L. 110-234; ; P.L. 107-171; ; P.L. 110-234; and P.L. 110-234.
. Notes: The commissions and authorities in bold are considered to be active and functioning.
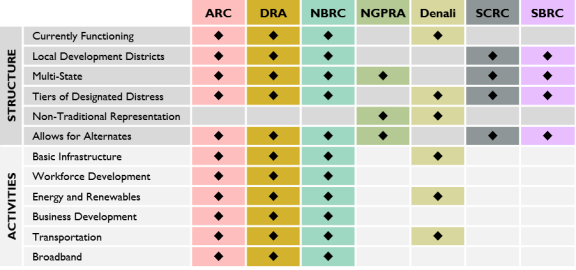
Congressional Research Service
32
Federal Regional Commissions and Authorities: Structural Features and Function
Contact Information Contact Information
(for active commissions and authorities)
Appalachian Regional Commission
Address:
Contact
Address/Phone/Website
Appalachian Regional Commission
1666 Connecticut Avenue, NW
Suite 700
Washington, DC 20009-1068
Phone:[phone number scrubbed]
Website: Phone:
(202) 884-7700
Website:
http://www.arc.gov
Address:
236 Sharkey Avenue
Suite 400
Clarksdale, MS 38614
Phone:[phone number scrubbed]
Phone: (662) 624-8600 Website: http://www.dra.gov
Address:
Denali Commission
510 L Street
Suite 410
Anchorage, AK 99501
Phone:[phone number scrubbed]
Phone: (907) 271-1414 Website: http://www.denali.gov
Northern Border Regional Commission
Address:
James Cleveland Federal Building, Suite 1201
53 Pleasant Street
Concord, NH 03301
Phone:[phone number scrubbed]
Phone: (603) 369-3001 Website: http://www.NBRC.gov
Appendix B.
Congressional Research Service
33
Appendix B. Map of Federal Regional Commissions and Authorities
Figure B-1. National Map of the Federal Regional Commissions and Authorities by county |
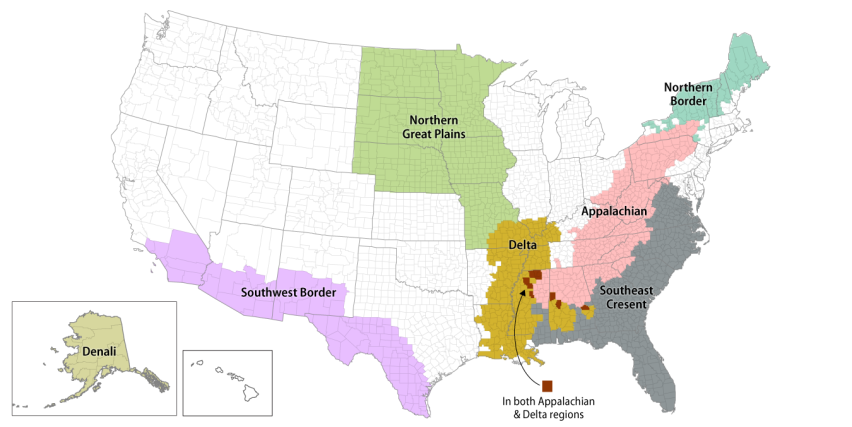 |
by county
Source: Compiled |
Appendix C.
Service Areas of Federal Regional Commissions and Authorities
Appalachian Regional Commission
Source: Information compiled by CRS from ARC data.
Delta Regional Authority
Table CSource: Information compiled by CRS from ARC data.
Delta Regional Authority
Table D-2. DRA Counties by State and Distress
as of FY2019
Distressed Counties
Non-Distressed Counties
Alabama
Barbour, Bul ock, Butler, Choctaw, Clarke, Conecuh, Dal as, Escambia,
Greene, Hale, Lowndes, Macon, Marengo, Monroe, Perry, Pickens, Russel , Sumter, as of FY2019
|
Distressed Counties |
Non-Distressed Counties |
|
|
Alabama |
Barbour, Bullock, Butler, Choctaw, Clarke, Conecuh, Dallas, Escambia, Greene, Hale, Lowndes, Macon, Marengo, Monroe, Perry, Pickens, Russell, Sumter, Washington, Wilcox |
|
|
Arkansas |
|
Arkansas, Pulaski |
|
Illinois |
Alexander, Franklin, Gallatin, Hardin, Jackson, Johnson, Massac, Perry, Pope, Pulaski, Randolph, Saline, Union |
Hamilton, White, Williamson |
|
Kentucky |
| |
|
Louisiana |
| Ascension, Cameron, East Baton Rouge, East Feliciana, Jefferson, Lafourche, Orleans, Plaquemines, St. Charles, West Baton Rouge |
|
Mississippi |
| Madison, Rankin |
|
Missouri |
|
Cape Girardeau |
|
Tennessee |
| Fayette, Madison, Shelby |
Source: Compiled by CRS from the Delta Regional Authority website.
Denali Commission
Table C
Congressional Research Service
R45997 · VERSION 3 · UPDATED
42
Denali Commission
Table D-3. Denali Commission Distressed Communities List
by standard of community distress, in alphabetical order
|
Surrogate Standard |
Surrogate Standard
Anchorage, Anderson, Aniak, |
|
Expanded Standard |
Wasil a, Whittier, Womens Bay, Yakutat
Expanded Standard
Buffalo Soapstone, Chenega, Chiniak, Clam Gulch, Delta Junction, Eureka Roadhouse, Gakona, |
Source: 2018 Distressed Communities Communities Report, Denali Commission.
Northern Border Regional Commission
Table CD-4. NBRC Counties by Distress Designation
by state in alphabetical order
Attainment
Transitional
Distressed
Maine
Hancock
Androscoggin, Aroostook, by state in alphabetical order
|
Attainment |
Transitional |
Distressed |
|
|
Maine |
Hancock |
| |
|
New Hampshire |
Grafton, Belknap |
Carroll, Cheshire |
Coos, Sullivan |
|
New York |
| Cayuga, Clinton, Essex, Franklin, | |
|
Vermont |
Addison, Bennington, Chittenden, Franklin, |
Caledonia, Essex, Orange, Orleans, Rutland |
Caledonia, Essex, Orange, Orleans, Rutland
Grand Isle, Lamoil e, Washington, Windham, Windsor
Source: Compiled and tabulated by CRS from NBRC data.
Notes: Vermont is the only NBRC state with all al counties within the NBRC jurisdiction.
Northern Great Plains Regional Authority
Table CD-5. Statutory Jurisdiction of NGPRA
states and counties
NGPRA Jurisdiction
Iowa
Entire State
Minnesota
Entire State
Missouri
Adair, states and counties
|
NGPRA Jurisdiction |
|
|
Iowa |
Entire State |
|
Minnesota |
Entire State |
|
|
|
Nebraska |
Entire State |
|
Entire State |
|
|
South Dakota |
Entire State |
Source: Tabulated by CRS with information from P.L. 107-171.
. Notes: Missouri jurisdiction represents all al those counties not currently included in the DRA.
Congressional Research Service R45997 · VERSION 3 · UPDATED 44 Southeast Crescent Regional Commission
Table CD-6. Statutory Jurisdiction of SCRC
states and counties
SCRC Jurisdiction
Alabama
Autauga, Baldwin, states and counties
|
SCRC Jurisdiction |
|
|
Alabama |
|
|
Georgia |
Appling, Atkinson, Bacon, Baker, |
|
Mississippi |
Clarke, Forrest, George, Greene, Hancock, Harrison, Jackson, Jones, Lamar, Lauderdale, Leake, Neshoba, Newton, Pearl River, Perry, Scott, Stone, Wayne |
|
North Carolina |
|
|
South Carolina |
|
|
Virginia |
|
|
Florida |
Entire State |
Source: Tabulated by CRS by cross-referencing relevant state counties against ARC and DRA jurisdictions.
Notes: With the exception of Florida, which has no coverage in another federally-federal y chartered regional commission or authority, SCRC jurisdiction encompasses all member encompasses al member state counties that are not part of the DRA and/or the ARC. In Virginia, independent cities (in bold) are considered counties for U.S. census purposes and are eligible eligible for independent inclusion. Virginia counties with an asterisk (*) are named as cities, but are actuallyactual y counties (e.g., James City County).
Southwest Border Regional Commission
Table CD-7. Statutory Jurisdiction of SBRC
states and counties
SBRC Jurisdiction
Arizona
Cochise, Gila, Graham, Greenlee, La Paz, Maricopa, Pima, states and counties
|
SBRC Jurisdiction |
|
|
Arizona |
Cochise, Gila, Graham, Greenlee, La Paz, Maricopa, Pima, Pinal, Santa Cruz, Yuma |
|
California |
|
|
New Mexico |
Ventura
New Mexico
Catron, Chaves, Dona Ana, Eddy, Grant, Hidalgo, Lincoln, |
|
Texas |
|
Source: Tabulated by CRS with information from P.L. 110-234.
Author Information
Michael H. Cecire
110-234.
Author Contact Information
Acknowledgments
Eugene Boyd'
Congressional Research Service
R45997 · VERSION 3 · UPDATED
46
Acknowledgments
Eugene Boyd’s previous work and expertise on the federal regional commissions and authorities were instrumental in the conceptualization and development of this report.
Disclaimer
This document was prepared by the Congressional Research Service (CRS). CRS serves as nonpartisan shared staff to congressional committees and Members of Congress. It operates solely at the behest of and under the direction of Congress. Information in a CRS Report should n ot be relied upon for purposes other
than public understanding of information that has been provided by CRS to Members of Congress in connection with CRS’s instit utional role. CRS Reports, as a work of the United States Government, are not subject to copyright protection in the United States. Any CRS Report may be reproduced and distributed in its entirety without permission from CRS. However, as a CRS Report may include copyrighted images or material from a third party, you may need to obtain the permission of the copyright holder if you wish to copy or otherwise use copyrighted material.
Congressional Research Service
R45997 · VERSION 3 · UPDATED
47 of this report.
Footnotes
| 1. |
See, for example, recent congressional interest and legislative action on Opportunity Zones (CRS Report R45152, Tax Incentives for Opportunity Zones: In Brief, by Sean Lowry and Donald J. Marples) and New Market Tax Credits (CRS Report RL34402, New Markets Tax Credit: An Introduction, by Donald J. Marples and Sean Lowry), and previous federal and congressional action on "Promise Zones" (U.S. Department of Housing and Urban Development, Promise Zones Overview, https://www.hudexchange.info/programs/promise-zones/promise-zones-overview/); as well as various legislation relating to the federal regional commissions and authorities themselves. |
| 2. |
40 U.S.C. §§14101-14704. |
| 3. |
P.L. 89-4 |
| 4. |
Appalachian Regional Commission, The ARC Code, https://www.arc.gov/publications/ARCCode.asp. |
| 5. |
Appalachian Regional Commission, ARC Code, 2018, https://www.arc.gov/publications/ARCCodeContents.asp. |
| 6. |
LDDs are not exclusive to the ARC. The DRA and NBRC also make use of them, and other inactive commissions and authorities are authorized to organize and/or support them. Designated LDDs may also be organized as Economic Development Administration (EDA)-designated economic development districts (EDDs), which serve a similar purpose. They may also be co-located with Small Business Administration-affiliated small business development centers (SBDCs). |
| 7. |
Appalachian Regional Commission, Local Development Districts, https://www.arc.gov/about/LocalDevelopmentDistricts.asp. |
| 8. |
See U.S. Government Accountability Office, Indian Issues: Federal Funding for Non-Federally Recognized Tribes, 12-348, April 2012, https://www.gao.gov/assets/600/590102.pdf. |
| 9. |
Appalachian Regional Commission, Investing in Appalachia's Future: The Appalachian Regional Commission's Five-Year Strategic Plan for Capitalizing on Appalachia's Opportunities, 2016–2020, https://www.arc.gov/about/arc2016-2020strategicplan.asp. |
| 10. |
Appalachian Regional Commission, Program Areas, https://www.arc.gov/program_areas/index.asp. |
| 11. |
The ARC defines asset-based development as "Appalachia's [local] natural, cultural, structural, and leadership resources." This includes cultural assets, ecological assets, agriculture, and other preexisting industries and resources that may be leveraged for increased economic development. Appalachian Regional Commission, Asset-Based Development, https://www.arc.gov/program_areas/index.asp?PROGRAM_AREA_ID=13. |
| 12. |
Appalachian Regional Commission, About ARC Project Grants, https://www.arc.gov/funding/ARCProjectGrants.asp. |
| 13. |
Appalachian Regional Commission, Partnerships for Opportunity and Workforce and Economic Revitalization (POWER) Initiative, https://www.arc.gov/funding/POWER.asp. |
| 14. |
The White House, Office of the Press Secretary, FACT SHEET: The Partnerships for Opportunity and Workforce and Economic Revitalization (POWER) Initiative, March 27, 2015, https://obamawhitehouse.archives.gov/the-press-office/2015/03/27/fact-sheet-partnerships-opportunity-and-workforce-and-economic-revitaliz. |
| 15. |
42 U.S.C. §14526 |
| 16. |
Appalachian Regional Commission, County Economic Status and Distressed Areas in Appalachia, https://www.arc.gov/appalachian_region/CountyEconomicStatusandDistressedAreasinAppalachia.asp. |
| 17. |
Appalachian Regional Commission, Data Reports: County Economic Status, Fiscal Year 2020, https://www.arc.gov/reports/custom_report.asp?REPORT_ID=76. |
| 18. |
Appalachian Regional Commission, Distressed Designation and County Economic Status Classification System, FY 2007–FY 2020, https://www.arc.gov/research/SourceandMethodologyCountyEconomicStatusFY2007FY2020.asp. |
| 19. |
Appalachian Regional Commission, ARC History, https://www.arc.gov/about/ARCHistory.asp. |
| 20. |
Appalachian Regional Commission, Appalachia: A Report by the President's Appalachian Regional Commission, 1964, April 1964, https://www.arc.gov/about/ARCAppalachiaAReportbythePresidentsAppalachianRegionalCommission1964.asp. |
| 21. |
P.L. 89-4 |
| 22. | |
| 23. | |
| 24. | |
| 25. | |
| 26. |
Where allowable, non-appropriated funds—such as those from states or localities—or even other non-ARC federal funds may be used to fund the balance of the project costs. |
| 27. |
The five designations of distress are: distressed, at-risk, transitional, competitive, and attainment. The "transitional" designation is not defined in statute, unlike the other four categories, but it is utilized as part of the five-level distress criteria nonetheless. |
| 28. | |
| 29. |
Office of Management and Budget, Budget of the United States Government, Fiscal Year 2018, Washington, DC, May 23, 2017, https://www.govinfo.gov/content/pkg/BUDGET-2018-BUD/pdf/BUDGET-2018-BUD.pdf. |
| 30. | |
| 31. |
Delta Regional Authority, About the Delta Regional Authority, https://dra.gov/about-dra/about-delta-regional-authority/. |
| 32. |
Delta Regional Authority, Board Members and Alternates, https://dra.gov/about-dra/board-members-and-alternates/. |
| 33. |
Delta Regional Authority, Eligibility & Funding Priorities, 2019, https://dra.gov/funding-programs/states-economic-development-assistance-program/eligibility-funding-priorities/. |
| 34. |
Delta Regional Authority, Moving the Delta Forward, Delta Regional Development Plan III, April 2016, https://dra.gov/images/uploads/content_files/DRA_RDP3-FINAL_APRIL2016.pdf. |
| 35. |
Delta Regional Authority, Strategic Economic Development Plans: State Strategic Economic Development Plans, 2016, https://dra.gov/funding-programs/strategic-economic-development-plans-by-state/. |
| 36. |
The DRA lists 44 LDDs in good standing on its website, but notes in the 2018 States' Economic Development Assistance Program (SEDAP) Manual that the DRA works with 45 LDDs. Delta Regional Authority, Local Development Districts, https://dra.gov/funding-programs/local-development-districts/. |
| 37. |
Delta Regional Authority, Distressed Counties and Parishes, 2019, https://dra.gov/funding-programs/states-economic-development-assistance-program/distressed-counties-and-parishes/. |
| 38. |
Delta Regional Authority, States' Economic Development Assistance Program (SEDAP), 2018, https://dra.gov/funding-programs/states-economic-development-assistance-program/. |
| 39. |
Delta Regional Authority, State Funding Allocations, 2019, https://dra.gov/funding-programs/state-funding-allocations/. |
| 40. |
Delta Regional Authority, Eligibility & Funding Priorities, 2019, https://dra.gov/funding-programs-states-economic-development/states-economic-development-assistance-program/eligibility-funding-priorities/. |
| 41. |
Delta Regional Authority, SEDAP Administrative Program Manual: FY2019, Clarksdale, MS, 2019, https://dra.gov/images/uploads/content_files/2019_SEDAP_Manual.pdf. |
| 42. |
The two bills contained the general basic authority, structure, geography, and mission that was carried over into the DRA's authorizing legislation. |
| 43. |
See CRS In Focus IF11126, 2018 Farm Bill Primer: What Is the Farm Bill?, by Renée Johnson and Jim Monke. |
| 44. | |
| 45. | |
| 46. | |
| 47. | |
| 48. |
Denali Commission, Work Plans, 2019, https://www.denali.gov/work-plans/. |
| 49. |
Denali Commission, Denali Commission Strategic Plan: FY2018-2022, October 4, 2017, https://www.denali.gov/wp-content/uploads/2018/03/Denali_Commission_FY2018_-_2022_Strategic_Plan_-_Final_Executed_document_-_10-4-17.pdf. |
| 50. | |
| 51. |
Denali Commission, Other Programs, https://www.denali.gov/programs/other-programs/. Accessed October 25, 2019. |
| 52. |
Denali Commission, Denali Commission Strategic Plan: FY2018-2022, October 4, 2017, https://www.denali.gov/wp-content/uploads/2018/03/Denali_Commission_FY2018_-_2022_Strategic_Plan_-_Final_Executed_document_-_10-4-17.pdf. |
| 53. |
Denali Commission, Denali Commission Investment Summary, May 2017, https://www.denali.gov/programs/. |
| 54. |
Denali Commission, Village Infrastructure Protection, https://www.denali.gov/programs/village-infrastructure-protection/. |
| 55. |
Denali Commission, Denali Commission Investment Summary, May 2017, https://www.denali.gov/programs/. |
| 56. |
U.S. Department of Transportation, Federal Highway Administration, Fact Sheet on Highway Provisions: Denali Access System Program, https://www.fhwa.dot.gov/safetealu/factsheets/denali.htm. |
| 57. | |
| 58. |
P.L. 108-7, Sec. 504 |
| 59. |
S. 1368, 110th Cong. (2007) |
| 60. | |
| 61. | |
| 62. | |
| 63. |
Northern Border Regional Commission, About the NBRC, http://www.nbrc.gov/content/about. |
| 64. |
Northern Border Regional Commission, About the NBRC, http://www.nbrc.gov/content/about. |
| 65. |
Northern Border Regional Commission, State Economic & Infrastructure Development Investment Program, 2019, http://www.nbrc.gov/content/economic-infrastructure-development-investments. |
| 66. |
Northern Border Regional Commission, Comprehensive Planning Investments for States, http://www.nbrc.gov/content/planning-for-states. |
| 67. |
Northern Border Regional Commission, Local Development Districts, 2019, http://www.nbrc.gov/content/local-development-districts. |
| 68. |
Northern Border Regional Commission, Administration: General Grant Administration, http://www.nbrc.gov/content/administration. |
| 69. |
Northern Border Regional Commission, Regional Forest Economy Partnership, http://www.nbrc.gov/content/Regional-Forest-Economy-Partnership. |
| 70. |
Northern Border Regional Commission, Regional Forest Economy Partnership: Notice of Funding Opportunity, http://www.nbrc.gov/uploads/RegionalForestEconomyParternship(5).pdf. |
| 71. |
Northern Border Regional Commission, 2017-2021 Strategic Plan, Concord, NH, 2017, http://www.nbrc.gov/content/strategic-plan. |
| 72. |
Northern Border Regional Commission, Northern Border Regional Commission: 2017-2021 Strategic Plan, http://www.nbrc.gov/uploads/004%20RESOURCES/Five%20Yr%20Strat%20Plan/NBRC%20Strategic%20Plan%2C%20Full%20Study.pdf. |
| 73. |
Northern Border Regional Commission, 2017-2021 Strategic Plan, Concord, NH, 2017, p. 6. |
| 74. | |
| 75. |
Northern Border Regional Commission, NBRC Annual Economic & Demographic Research for Fiscal Year 2019: To Determine Categories of Distress within the NBRC Service Area, Concord, NH, December 2018, http://www.nbrc.gov/uploads/NBRC%20Annual%20Economic%20%26%20Demographic%20Research%20for%20Fiscal%20Year%202019.pdf. |
| 76. |
Northern Border Regional Commission, NBRC Annual Economic & Demographic Research for Fiscal Year 2019: To Determine Categories of Distress within the NBRC Service Area, Concord, NH, December 2018, http://www.nbrc.gov/uploads/NBRC%20Annual%20Economic%20%26%20Demographic%20Research%20for%20Fiscal%20Year%202019.pdf. |
| 77. |
The bill was introduced by Rep. Hodes, Paul [D-NH-2] and co-sponsored by: Rep. Arcuri, Michael A. [D-NY-24]; Rep. Allen, Thomas H. [D-ME-1]; Rep. McHugh, John M. [R-NY-23]; Rep. Michaud, Michael H. [D-ME-2]; Rep. Shea-Porter, Carol [D-NH-1]; and Rep. Welch, Peter [D-VT-At Large]. |
| 78. |
The Regional Economic and Infrastructure Development Act of 2007, H.R. 3246. |
| 79. |
Food, Conservation, and Energy Act of 2008, P.L. 110-234. |
| 80. | |
| 81. | |
| 82. | |
| 83. | |
| 84. | |
| 85. | |
| 86. |
W.K. Kellogg Foundation, Grants: Northern Great Plains, Inc., https://www.wkkf.org/grants/grant/2007/09/the-meadowlark-project-a-leadership-laboratory-on-the-future-of-the-northern-great-plains-3004879. |
| 87. | |
| 88. |
Federal Reserve Bank of Minneapolis, "Great Plains Commission Completes Work, Looks to Region's Future," Minneapolis, MN, April 1, 1997, https://www.minneapolisfed.org/publications/fedgazette/great-plains-commission-completes-work-looks-to-regions-future. |
| 89. | |
| 90. | |
| 91. | |
| 92. |
40 U.S.C. §15731. |
| 93. |
In addition, in a review of the relevant SF 133 Reports on Budget Execution and Budgetary Resources, the SCRC is not listed by the Office of Management and Budget in its list of reported agencies, and subsequently offers no relevant funding reports on the SCRC. The SF 133 Report on Budget Execution and Budgetary Resources fulfills the requirement in 31 U.S.C. §§1511-1514 that the President review federal expenditures at least four times a year. |
| 94. |
U.S. Treasury 2018 Combined Statement of Receipts, Outlays, and Balances, Part III, https://fiscal.treasury.gov/reports-statements/combined-statement/current.html. |
| 95. |
Executive Order 13122, "Interagency Task Force on the Economic Development of the Southern Border," 64 Federal Register 29201-29202, May 25, 1999. |