Global Research and Development Expenditures: Fact Sheet
Changes from September 19, 2019 to April 29, 2020
This page shows textual changes in the document between the two versions indicated in the dates above. Textual matter removed in the later version is indicated with red strikethrough and textual matter added in the later version is indicated with blue.
Global Research and Development Expenditures: Fact Sheet
Research and development (R&D) plays a central role in advanced economies in areas such as economic growth and job creation, industrial competitiveness, national security, energy, agriculture, transportation, public health and well-being, environmental protection, and expanding the frontiers of human knowledge understanding.1 Accordingly, companies, governments, universities, nonprofit organizations, and others around the world have made substantial investments in R&D. Since 2000, total global R&D expenditures have nearlymore than tripled in current dollars, from $676 billion to $2.0 trillion in 2018.
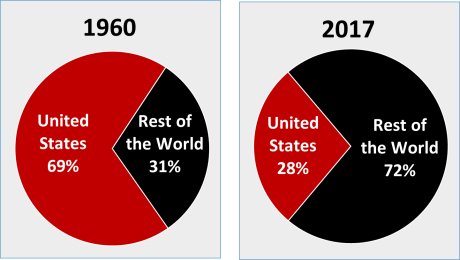
The United States emerged as a global leader in science and technology in the second half of the 20th century. During this period, U.S. public and private investments in R&D grew rapidly and helped to propel the United States to a position of global economic leadership. By 1960, the United States accounted for approximately 69% of the world's R&D funding. By 20172018, however, the U.S. share of global R&D expenditures2 had fallen to about 28%.3 (See Figure 1.) The U.S. decline in share of global R&D is not the result of a reduction in U.S. R&D investments—in fact, U.S. public and private R&D grew robustly during this period—but rather is the result of even greater increases in the investments of the governments and industries of other countries, which have recognized the importance of R&D to their industrial innovation and competitiveness.
 |
|
Sources: 1960: CRS analysis of U.S. Department of Commerce, Office of Technology Policy, The Global Context for U.S. Technology Policy, Summer 1997. Notes: Rest of the World includes the members of the OECD (less the United States), Argentina, China, Romania, Russia, Singapore, South Africa, and Taiwan. R&D expenditures by others countries are not included but are likely to be small in relative terms. In estimating total global R&D, CRS used the most recent year's reported R&D expenditures for |
In 20172018 (the most recent year for which comprehensive data are available), global R&D expenditures were $1.9612.107 trillion.4 The United States continued to fund more R&D than any other country. China, ranked second in 20172018, funded more R&D than the next four highest countries—Japan, Germany, South Korea, and France—combined. The 10 largest R&D-funding countries of 20172018 accounted for $1.662789 trillion in R&D expenditures, about 84.7% of the global total; the top 20 R&D-funding countries accounted for $1.995 trillion, 94.7% of the global total. (See Table 1.)
Table 1. Countries with the Highest Expenditure on R&D, 2017
(in billions of current PPP dollars)
|
Rank |
Country |
Amount |
Rank |
Country |
Amount |
|||||||||||||||||||||||||||||||||
|
1 |
United States |
$ |
6 |
France |
$64.7 |
|||||||||||||||||||||||||||||||||
|
2 |
China |
496.0 |
7 |
United Kingdom |
49.3 |
|||||||||||||||||||||||||||||||||
|
3 |
Japan |
170.9 |
8 |
Russia |
41.9 |
|||||||||||||||||||||||||||||||||
|
4 |
Germany |
132.0 |
9 |
Taiwan |
39.3 |
|||||||||||||||||||||||||||||||||
|
5 |
South Korea |
91.0 |
10 |
Italy |
33.5
|
15
|
Netherlands
|
21.5
|
6
|
France
|
$68.4
|
16
|
Switzerland
|
19.1
|
7
|
United Kingdom
|
53.1
|
17
|
Sweden
|
18.1
|
8
|
Taiwan
|
43.3
|
18
|
Israel
|
17.7
|
9
|
Russia
|
41.5
|
19
|
Belgium
|
16.5
|
10
|
Italy
|
36.0
|
20
|
Austria 16.0 |
Source: CRS analysis of Organisation for Economic Development and Cooperation, OECD.Stat database, https://stats.oecd.org/Index.aspx?DataSetCode=MSTI_PUB.
Notes: PPP = Purchasing Power Parity. PPP is used to determine the relative value of different currencies and to adjust data from different countries to a common currency allowing direct comparisons among them.
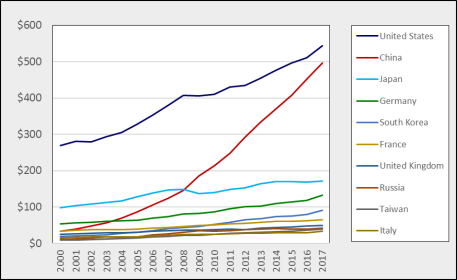
Figure 2 illustrates R&D expenditures between 2000 and 20172019 for the 10 countries with the highest R&D expenditures.
|
Figure 2. R&D Expenditures of Selected Countries, 2000- (in billions of current PPP dollars) |
 |
|
Source: CRS analysis of Organisation for Economic Cooperation and Development, OECD.Stat database, https://stats.oecd.org/Index.aspx?DataSetCode=MSTI_PUB. Notes: PPP = Purchasing Power Parity. PPP is used to determine the relative value of different currencies and to adjust data from different countries to a common currency allowing direct comparisons among them. |
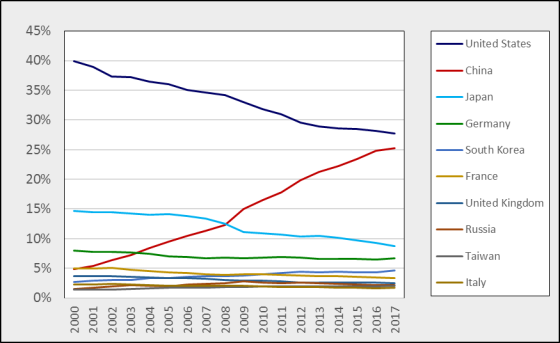
Trends in global R&D share between 2000 and 20172018 for the 10 countries with the highest 20172018 R&D expenditures are illustrated in Figure 3. Among them, six saw declines in share of global R&D—the United States, Japan, Germany, France, the United Kingdom, and Italy—while four saw their shares grow—China, South Korea, Russia, and Taiwan.
In 2000, China accounted for nearly 5% of global R&D, joining the United States, Japan, South Korea, and the countries of Western Europe as the largest funders of R&D. In 2009, China surpassed Japan to become the second largest funder of R&D. From 2000 to 20172018, while China's share of global R&D rose from 4.9% to 2526.3%, the U.S. share fell from 39.98% to 27.76% and Japan's share fell from 14.6% to 8.71%.
|
Figure 3. Share of Global R&D of Selected Countries, 2000- |
 |
|
Source: CRS analysis of Organisation for Economic Development and Cooperation, OECD.Stat database, https://stats.oecd.org/Index.aspx?DataSetCode=MSTI_PUB. Notes: Global R&D includes the expenditures of the OECD countries, Argentina, China, Romania, Russia, Singapore, South Africa, and Taiwan. Share computed in PPP terms. PPP = Purchasing Power Parity. PPP is used to determine the relative value of different currencies and to adjust data from different countries to a common currency allowing direct comparisons among them. |
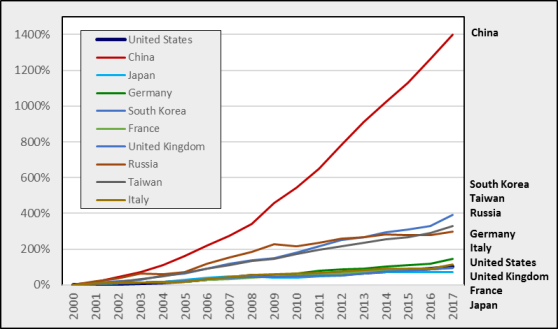
Figure 4 illustrates the growth of R&D expenditures for each of the 10 countries with the highest 20172018 R&D expenditures for 2000 to 20172018 as a percentage of its 2000 R&D expenditures.
|
Figure 4. Growth in R&D Expenditures Since 2000 for Selected Countries, 2000- |
 |
|
Source: CRS analysis of Organisation for Economic Development and Cooperation, OECD.Stat database, https://stats.oecd.org/Index.aspx?DataSetCode=MSTI_PUB. |
Author Contact Information
Footnotes
| 1. |
Alternatively, some nations have taken non-R&D intensive paths to economic growth, for example by serving as low labor-cost locations for the manufacturing and service needs of other nations, by licensing or acquiring the intellectual property needed for production activities, and by extracting and refining natural resources (e.g., oil, gas, minerals). |
| 2. |
For purposes of this report, global R&D expenditures include those of the OECD countries, Argentina, China, Romania, Russia, Singapore, South Africa, and Taiwan. R&D expenditures by others countries are not included but are likely to be small in relative terms. |
| 3. |
|
| 4. |
Includes OECD members, plus Argentina, China, Romania, Russia, Singapore, South Africa, and Taiwan. (Organisation for Economic Cooperation and Development, OECD.Stat database) |