Staff Pay, Selected Positions in House Member Offices, 2001-2023
Changes from June 11, 2019 to September 11, 2020
This page shows textual changes in the document between the two versions indicated in the dates above. Textual matter removed in the later version is indicated with red strikethrough and textual matter added in the later version is indicated with blue.
Contents
Tables
- Table 1. Annual Maximum Pay for Selected Staff In House Members' Offices, 2001-2019
- Table 2. Change in Median Pay for Selected Staff In House Members' Offices, Selected Periods
- Table 3. Caseworker
- Table 4. Chief of Staff
- Table 5. Communications Director
- Table 6. Constituent Services Representative
- Table 7. Counsel, 2010-2018
- Table 8. District Director
- Table 9. Executive Assistant
- Table 10. Field Representative
- Table 11. Legislative Assistant
- Table 12. Legislative Correspondent
- Table 13. Legislative Director
- Table 14. Office Manager
- Table 15. Press Secretary
- Table 16. Scheduler
- Table 17. Staff Assistant
Summary
Staff Pay Levels for Selected Positions in House September 11, 2020 Member Offices, 2001-2019 R. Eric Petersen Levels of pay for congressional staff are a source of recurring questions among Members of Specialist in American Congress, congressional staff, and the public. There may be interest in congressional pay data National Government from multiple perspectives, including assessment of the costs of congressional operations, guidance in setting pay levels for staff in Member offices, or comparison of congressional staff pay levels with those of other federal government pay systems.
This report provides pay data for 1516 staff position titles that are typically used in House Members'’ offices. The positions include the following: Caseworker, Chief of Staff, Communications Director, Constituent Services Representative, Counsel, (2010-2018), District Director, Executive Assistant, Field Representative, Legislative Assistant, Legislative Correspondent, Legislative Director, Office Manager, Press Secretary, Scheduler, Senior Legislative Assistant (2018-2019), and Staff Assistant. The following table provides the change in median pay levels for these positions in constant 20192020 dollars, between 2017 and 2018.
2018 and 2019.
Percentage Change in Median Pay for Selected Staf Positions in House Members’ Of ices, 2018-2019
Caseworker
-8.66% Legislative Correspondent
-3.92%
Chief of Staff
-2.04% Legislative Director
-4.52%
Communications Director
6.96% Office Manager
-1.21%
Constituent Services Representative
-5.74% Press Secretary
-6.16%
District Director
1.08% Scheduler
6.97%
Executive Assistant
-3.03% Senior Legislative Assistant
-2.47%
Field Representative
1.82% Staff Assistant
-6.32%
Legislative Assistant
2.65%
Source: Statement of Disbursements of the House, as col ated by LegiStorm, various years, Percentage Change in Median Pay for Selected Staff In House Members' Offices, 2017-2018
|
2017-2018 |
2017-2018 |
||
|
Caseworker |
4.68% |
Legislative Assistant |
-4.88% |
|
Chief of Staff |
-0.61% |
Legislative Correspondent |
12.03% |
|
Communications Director |
-5.52% |
Legislative Director |
-1.83% |
|
Constituent Services Representative |
2.60% |
Office Manager |
-5.37% |
|
Counsel |
2.75% |
Press Secretary |
-2.20% |
|
District Director |
-5.15% |
Scheduler |
-2.93% |
|
Executive Assistant |
-4.97% |
Staff Assistant |
7.39% |
|
Field Representative |
-4.92% |
Source: Statement of Disbursements of the House, as collated by LegiStorm, various years, and CRS calculations. Change is based on constant 2020 dol ars.
constant 2019 dollars.
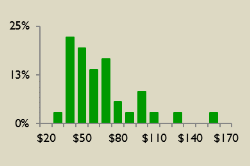
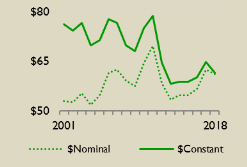
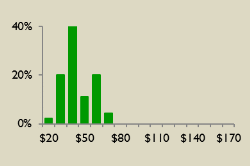
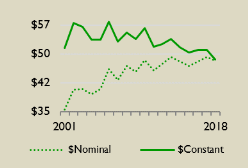
Report tables provide aggregate statistics on pay for each staff position for 2001, 2004, 2009, and 2014-2018, 2005, 2010, and 2015-2019, including quartiles, the medianmedian pay, and average pay. Complete data, for 2001-2018,2019 are available to congressional requestersstaff upon request. Graphic displays are also included, providing representations of pay from two perspectives, including the following:
- the following two perspectives:
a line graph showing change in median pay, 2001-
20182019, in nominal (current) and constant2019, 2020 dollars;and -
and
distributions of
20182019 pay in constant20192020 dollars, in $10,000
The Congressional Research Service provides a number of products on staffing issues. These can be found in CRS Report R44688, Congressional Staff: CRS Products on Size, Pay, and Job Tenure.
Introduction
Job Tenure, and Duties.
Congressional Research Service
link to page 4 link to page 5 link to page 6 link to page 9 link to page 7 link to page 8 link to page 8 link to page 10 link to page 11 link to page 12 link to page 13 link to page 14 link to page 15 link to page 16 link to page 17 link to page 18 link to page 19 link to page 20 link to page 21 link to page 22 link to page 23 link to page 24 link to page 25 link to page 26 Staff Pay Levels for Selected Positions in House Member Offices, 2001-2019
Contents
Introduction ................................................................................................................... 1 Data Concerns ................................................................................................................ 2 Data Tables and Visualizations .......................................................................................... 3 House Member Office Staff Pay Tables .............................................................................. 6
Tables Table 1. Annual Maximum Pay for Selected Staff In House Members’ Offices, 2001-2019 ......... 4 Table 2. Change in Median Pay for Selected Staff In House Members’ Offices, Selected
Periods ....................................................................................................................... 5
Table 3. Caseworker ........................................................................................................ 7 Table 4. Chief of Staff...................................................................................................... 8 Table 5. Communications Director..................................................................................... 9 Table 6. Constituent Services Representative ..................................................................... 10 Table 7. Counsel, 2010-2018........................................................................................... 11 Table 8. District Director ................................................................................................ 12 Table 9. Executive Assistant ........................................................................................... 13 Table 10. Field Representative ........................................................................................ 14 Table 11. Legislative Assistant ........................................................................................ 15 Table 12. Legislative Correspondent ................................................................................ 16 Table 13. Legislative Director ......................................................................................... 17 Table 14. Office Manager ............................................................................................... 18 Table 15. Press Secretary................................................................................................ 19 Table 16. Scheduler ....................................................................................................... 20 Table 17. Senior Legislative Assistant, 2018-2019 .............................................................. 21 Table 18. Staff Assistant ................................................................................................. 22
Contacts Author Information ....................................................................................................... 23
Congressional Research Service
link to page 7 Staff Pay Levels for Selected Positions in House Member Offices, 2001-2019
Introduction Levels of pay for congressional staff are a source of recurring questions among Members of Congress, congressional staff, and the public. Members of the House of Representatives typically typical y set the terms and conditions of employment for staff in their offices. These include job titles, duties, and rates of pay, subject to a maximum level,11 and resources available to them to carry out their official duties.22 There may be interest in congressional pay data from multiple perspectives,
including assessment of the costs of congressional operations; guidance in setting pay levels for staff in Member offices; or comparison of congressional staff pay levels with those of other
federal government pay systems.
Publicly available resources do not provide aggregated congressional staff pay data in a readily retrievable form. The most recent, publicly available staff compensation reportstudy was issued in 2019.3 Like previous compensation studies,4 it was issued in 2010,3 which, like previous compensation reports, relied on anonymous, self-reported survey data. Pay4Pay5 information in this report is based on the Statement of Disbursements of the House (SOD), published quarterly by the Chief Administrative Officer,56 as collated by LegiStorm, a private
entity that provides some congressional data by subscription.67 Data in this report are based on official House reports of specific staff positions, which afford the opportunity to use consistently collected data from a single, authoritative source. Additionally, , avoiding potential concerns inherent in survey data. Additional y, this report provides annual data, which allowsal ows for observations about the
nature of House Member staff compensation over time.
This report provides pay data for 1516 staff position titles that are typicallytypical y used in House Members' offices.7’
offices.8 The positions include the following:
Caseworker9
Legislative Assistant
Chief of Staff
Legislative Correspondent
Communications Director
Legislative Director
Constituent Services Representative
Office Manager
Counsel10
Press Secretary
1 Since 2020, the maximum annual pay for staff in House Member offices has been $173,900. See Order of the Speaker of the House of Representatives, January 27, 2020, set out as a note following 2 U.S.C. 4532. Maximum payable rates for House Member office staff since 2001 are available in Table 1.
2 For discussion of resources available to Members to carry out their official duties, see CRS Report RL30064, Congressional Salaries and Allowances: In Brief, by Ida A. Brudnick. 3 ICF, 2019 House of Representatives Compensation and Diversity Study Report: Member Committee and Leadership Offices, Guide for the 116th Congress, produced for the Chief Administrative Officer, House of Representatives (Washington: 2019).
4 For example, ICF International, 2010 House Compensation Study: Guide for the 112th Congress, prepared for the Chief Administrative Officer, House of Representatives (Washington: 20 10). 5 In this report, pay refers to monies paid by the House to staff, and excludes other components of total compensation, which might include paid leave or employer contributions to various insurance and retirement benefits.
6 Volumes of the Statement of Disbursements since July 2009 are available at http://disbursements.house.gov/. 7 See http://www.legistorm.com/. 8 For examples of staff roles and duties sought by Members of Congress, see CRS Report RL34545, Congressional Staff: Duties and Functions of Selected Positions, by R. Eric Petersen.
9 Other job titles which may indicate similar duties, and for which pay data were collected for this category, include Federal Caseworker.
10 Data for offices that employed Counsels are available 2010-2018.
Congressional Research Service
1
Staff Pay Levels for Selected Positions in House Member Offices, 2001-2019
District Director
Scheduler
Executive Assistant
Senior Legislative Assistant11
Field Representative
Staff Assistant
The collection of House Members’ staff pay data for the years 2001-2019 The positions include the following:
The collection of House Members' staff pay data for the years 2001-2018 proceeded as follows. For each year, a random sample10sample12 of 45 offices was taken for each position. House staff had to hold a position with the same job title in the Member'’s office for the entire calendar year examined, and not receive pay from any other congressional employing authority to be included. Generally
General y, each position has no more than one observation per House Member'’s office each year.
Every recorded payment ascribed in the LegiStorm data to those staff for the calendar year is included.1113 Data collected for this report may differ from an employee'’s stated annual salary due to the inclusion of overtime, bonuses, or other payments12payments14 in addition to base salary paid in the
course of a year.
For some positions, it was not possible to identify 45 employees who held that title for the entire
year. In circumstances when data for 1817 or fewer staff were identified for a position, this report
provides no data.
The Congressional Research Service provides a number of products on staffing issues. These can
be found in CRS Report R44688, Congressional Staff: CRS Products on Size, Pay, and Job Tenure.
, and Duties. Data Concerns
There may be some advantages to relying on official salary expenditure data instead of survey findings, but data presented here are subject to some challengeschal enges that could affect the findings or
their interpretation. Some of the concerns include the following:
No There are no data for first-term Members in the first session of a Congress. Authority to use the Member RepresentationalAllowanceAl owance (MRA) for the previous year expires January 2, and new MRA authority begins on January 3 when new Memberstypicallytypical y take office.13- 15
11 Data for offices that employed Senior Legislative Assistants are available 2018 -2019. 12 Obtaining the salaries of every congressional staff member listed in the SOD was beyond the capacity of available resources. Each year, a different, random sample of Members’ offices was taken for each position. T he large random sample of offices employing staff in each position means that a full accounting would be unlikely to yield significantly different results. At the same time, a study that examines pay data based on different job titles, or which combines pay data from positions of similar titles or presumptive duties (e.g., legislative aide, legislative assistant and senior legislative assistant, or executive assistants, schedulers, office managers, and executive assistant/schedulers), or estimates of pay using different data collection criteria, could result in findings that are different from those provided here. 13 T he numbers of staff for which data were counted are identified as observations in the data tables. 14 For each year, the SOD reports pay data for five time periods: January 1 and 2; January 3 -March 31; April 1-June 30; July 1-September 30; and October 1-December 31. T he aggregate pay of those five periods equals the annual pay of a congressional staff member. T he brief reporting period accommodates accounting of the Member Representational Allowance (MRA), which authorizes expenditures from January 3 to January 2 of the following year. For a discussion of MRA usage, see CRS Report R40962, Mem bers’ Representational Allowance: History and Usage, by Ida A. Brudnick. Other forms of payment do not appear to be recorded in a consistent manner. Sometimes overtime and other pay is listed as separate entries, and in other instances, significant one-time changes in a quarterly total might suggest payments in addition to regular salary. 15 Staff of all Members who serve an entire calendar year may be included in the data. For information on the number
Congressional Research Service
2
link to page 7 link to page 8 link to page 10 link to page 10 link to page 25 Staff Pay Levels for Selected Positions in House Member Offices, 2001-2019
The SOD reports monies paid directly by the House to staff, but does not provide
the individual
The SOD reports monies paid directly by the House to staff, but does not provide the individualvalue of other components of compensation, which might include paid leave or employer contributions to various insurance and retirement benefits. - Pay data provide no insight into the education, work experience, position tenure, full- or part-time status of staff, or other potential explanations for levels of compensation.
- Data do not differentiate between staff based in Washington, DC, district offices, or both.
-
Member offices that do not utilize any of the
1516 job position titles, or whose pay data were not reported consistently,1416 are excluded. -
Potential differences could exist in the job duties of positions with the same title.
Aggregation of pay by job title rests in part on the assumption that staff with the same title carry out similar tasks. Given the wide discretion congressional employing authorities have in setting the terms and conditions of employment, there may be differences in the duties of similarly
Data Tables and Visualizations
Tables in this section provide background information on House pay practices, comparative data for each position, and detailed pay data and visualizations for each positionposition. Table 1 provides the maximum payable rates for House Member staff since 2001 in both nominal (current) and constant 20192020 dollars. Constant dollar calculations throughout the report are based on the
Consumer Price Index for All Al Urban Consumers (CPI-U) for various years, expressed in constant 2019 dollars.15
2020 dollars.17
Table 2 provides available percentage changes in median pay in constant 20192020 dollars for each of the 1516 positions,; for Members of Congress,16;18 and for salaries paid under the General Schedule in Washington, DC, and surrounding areas, and in the Rest of the United States (RUS) area.1719 Table 3 through3 through Table 17 18 provide tabular pay data for each staff position for 2001, 2004, 2009, and 2014-20182005, 2010, and 2015-2019, including data distributed by quartile, including the medianmedian pay, and average pay. The numbers of staff for which data were counted are identified as "Number"“#” in the data tables. Staff pay tables also
provide a comparison, at various intervals to 20182019, based on data availability, of the cumulative
percentage change in median pay for that position, in constant, 20192020 dollars.
Graphic displays are also included for each position, providing representations of pay from two perspectives, including the following:
distributions of 2018 pay in 2019of first -term Members in each Congress, see CRS Report R41283, First-Term Mem bers of the House of Representatives and Senate, 64th-114th Congresses, by Jennifer E. Manning and R. Eric Petersen . 16 Some offices reported pay data that excluded the January 1 and 2 period, or included those days in reports including the period from October 1 of the previous year. 17 U.S. Department of Labor, Bureau of Labor Statistics, Consumer Price Index, at http://www.bls.gov/cpi/tables.htm. 18 Member pay data are taken from CRS Report 97-1011, Salaries of Members of Congress: Recent Actions and Historical Tables, by Ida A. Brudnick. 19 General Schedule pay change is based on changes in pay levels, and not the pay of individuals. General Schedule pay tables for various years are available at https://www.opm.gov/policy-data-oversight/pay-leave/salaries-wages/. For a complete description of areas covered under the Washington-Baltimore-Northern Virginia, DC-MD-VA-WV-PA and RUS locality pay tables in 2020, see https://www.opm.gov/policy-data-oversight/pay-leave/salaries-wages/2020/locality-pay-area-definitions/. Congressional Research Service 3 link to page 6 Staff Pay Levels for Selected Positions in House Member Offices, 2001-2019 Graphic displays are also included for each position, providing representations of pay from the following two perspectives: distributions of 2019 pay in 2020 dollars, in $10,000 increments; and dollars, in $10,000 increments; and- a line graph showing change in median pay, 2001-
20182019, in nominal (current) and constant20192020 dollars.
Table 1. Annual Maximum Pay for Selected Staff In House Members'’ Offices,
2001-2019
Year
Nominal $
Constant 2020 $
2001
$140,451
$204,258
2002
$145,226
$207,915
2003
$149,728
$209,584
2004
$153,022
$208,639
2005
$156,848
$206,847
2006
$159,828
$204,191
2007
$159,828
$198,536
2008
$163,795
$195,940
2009
$168,411
$202,182
2010
$168,411
$198,919
2011
$168,411
$192,832
2012
$168,411
$188,922
2013
$168,411
$186,195
2014
$168,411
$183,223
2015
$168,411
$183,006
2016
$168,411
$180,726
2017
$168,411
$176,954
2018
$168,411
$172,737
2019
$168,411
$169,663
2020
$173,900
$173,900
Source: 2 U.S.C. 4532 note, CRS calculations. Detailed information about data sources is available above in “ Offices, 2001-2019
|
Year |
Nominal $ |
Constant 2019 $ |
|
2001 |
$140,451 |
$201,598 |
|
2002 |
$145,226 |
$205,207 |
|
2003 |
$149,728 |
$206,854 |
|
2004 |
$153,022 |
$205,921 |
|
2005 |
$156,848 |
$204,153 |
|
2006 |
$159,828 |
$201,531 |
|
2007 |
$159,828 |
$195,950 |
|
2008 |
$163,795 |
$193,388 |
|
2009 |
$168,411 |
$199,548 |
|
2010 |
$168,411 |
$196,328 |
|
2011 |
$168,411 |
$190,320 |
|
2012 |
$168,411 |
$186,461 |
|
2013 |
$168,411 |
$183,770 |
|
2014 |
$168,411 |
$180,836 |
|
2015 |
$168,411 |
$180,622 |
|
2016 |
$168,411 |
$178,372 |
|
2017 |
$168,411 |
$174,649 |
|
2018 |
$168,411 |
$170,487 |
|
2019 |
$168,411 |
$168,411 |
Source: 2 U.S.C. 4532 note, CRS calculations. Detailed information about data sources is available above in "Data Tables and Visualizations."
Data Tables and Visualizations.”
Congressional Research Service
4
link to page 10 link to page 25 link to page 6 Staff Pay Levels for Selected Positions in House Member Offices, 2001-2019
Table 2. Change in Median Pay for Selected Staff In House Members' ’
Offices, Selected Periods
Change Based on Constant 2020 Dol ars
2018-2019
2015-2019
2010-2019
2005-2019
2001-2019
Caseworker
-8.66%
6.56%
-0.85%
-4.70%
0.58%
Chief of Staff
-2.04%
-1.81%
-9.93%
-8.79%
3.15%
Communications Director
6.96%
8.26%
-8.37%
-9.47%
-13.36%
Constituent Services Representative
-5.74%
-0.62%
-3.16%
-6.41%
-0.36%
District Director
1.08%
-6.77%
-11.79%
-12.86%
-8.99%
Executive Assistant
-3.03%
2.13%
-20.00%
-15.72%
-21.13%
Field Representative
1.82%
-1.40%
-12.10%
-7.21%
-3.41%
Legislative Assistant
2.65%
5.15%
-8.27%
-6.55%
-6.77%
Legislative Correspondent
-3.92%
7.70%
2.83%
0.70%
2.80%
Legislative Director
-4.52%
-6.76%
-13.88%
-7.78%
-9.03%
Office Manager
-1.21%
-6.60%
-12.31%
-11.37%
-24.41%
Press Secretary
-6.16%
-6.64%
-19.76%
-22.85%
-19.26%
Scheduler
6.97%
6.41%
-0.19%
-4.71%
-9.90%
Senior Legislative Assistant
-2.47%
—
—
—
—
Staff Assistant
-6.32%
4.07%
-16.04%
-13.04%
-12.56%
Congressional Staff Positions Pay Change Summary
Increase
5
7
1
1
3
Decrease
10
7
13
13
11
Members of Congress, General Schedule Pay Change
Members of Congress
-1.78%
-7.29%
-14.71%
-18.00%
-16.93%
General Schedule, Washington, DC
0.45%
1.23%
-5.00%
1.31%
8.68%
General Schedule, Rest of U.S.
-0.15%
-1.48%
-7.54%
-5.93%
-0.49%
Offices, Selected Periods
|
Change Based on Constant 2019 Dollars |
|||||
|
2017-2018 |
2014-2018 |
2009-2018 |
2004-2018 |
2001-2018 |
|
|
Caseworker |
4.68% |
17.35% |
2.75% |
-10.79% |
9.49% |
|
Chief of Staff |
-0.61% |
4.99% |
-1.58% |
-6.11% |
4.70% |
|
Communications Director |
-5.52% |
-5.03% |
-15.00% |
-16.31% |
-19.45% |
|
Constituent Services Representative |
2.60% |
2.85% |
-2.73% |
1.85% |
5.12% |
|
Counsel |
2.75% |
8.93% |
-9.63% |
— |
— |
|
District Director |
-5.15% |
-1.49% |
-10.49% |
-9.77% |
-10.46% |
|
Executive Assistant |
-4.97% |
4.93% |
-9.46% |
-11.74% |
-19.12% |
|
Field Representative |
-4.92% |
-6.09% |
-9.85% |
-9.51% |
-5.67% |
|
Legislative Assistant |
-4.88% |
0.79% |
-10.98% |
-9.52% |
-9.69% |
|
Legislative Correspondent |
12.03% |
10.68% |
3.81% |
2.34% |
6.39% |
|
Legislative Director |
-1.83% |
-0.96% |
-9.93% |
-4.76% |
-5.26% |
|
Office Manager |
-5.37% |
2.07% |
-17.89% |
-26.54% |
-23.92% |
|
Press Secretary |
-2.20% |
-5.42% |
-16.69% |
-15.50% |
-14.44% |
|
Scheduler |
-2.93% |
-5.31% |
-18.20% |
-16.24% |
-16.24% |
|
Staff Assistant |
7.39% |
6.10% |
-7.07% |
-15.29% |
-7.19% |
|
Members of Congress |
-2.38% |
-5.72% |
-14.56% |
-17.21% |
-15.43% |
|
General Schedule, DC |
-0.14% |
1.66% |
-4.77% |
1.16% |
8.19% |
|
General Schedule, Rest of U.S. |
-0.75% |
-0.46% |
-7.29% |
-5.91% |
-0.34% |
| |||||
|
Increase |
5 |
9 |
2 |
2 |
4 |
|
Decrease |
10 |
6 |
13 |
12 |
10 |
Source: CRS calculations, based on pay data provided in Table 3 throughthrough Table 17 18 for congressional positions in constant 2019 dollars2020 dol ars; CRS Report 97-1011, Salaries of Members of Congress: Recent Actions and Historical Tables, by Ida A. Brudnick, for Members of Congress; and the Office of Personnel Management for federal civilian workers workers in the District of Columbia and surrounding areas, and rest of the U.S., various years. “—” indicates no data. Detailed information about data sources is available above in "“Data Tables and Visualizations."
House Member Office Staff Pay Tables
.” Congressional Research Service 5 link to page 10 link to page 25 link to page 25 Staff Pay Levels for Selected Positions in House Member Offices, 2001-2019 House Member Office Staff Pay Tables Interpreting Pay Tables: Statistics Describing Pay Data
For each year that data are available, statistical values for staff positions
Statistical Measures Used in Pay Tables
|
|
Nominal, Current $ |
Constant, 2019, $ |
||||||||||||||||
|
Year |
Number |
Minimum |
Q1 |
Q2, Median |
Q3 |
Maximum |
Average |
Minimum |
Q1 |
Q2, Median |
Q3 |
Maximum |
Average |
||||
|
2001 |
45 |
$21,750 |
$30,000 |
$35,229 |
$40,122 |
$61,572 |
$36,189 |
$31,219 |
$43,061 |
$50,567 |
$57,590 |
$88,377 |
$51,945 |
||||
|
2004 |
45 |
$28,333 |
$37,804 |
$46,120 |
$50,000 |
$63,900 |
$44,992 |
$38,128 |
$50,873 |
$62,064 |
$67,285 |
$85,990 |
$60,545 |
||||
|
2009 |
45 |
$28,919 |
$38,750 |
$45,475 |
$53,375 |
$86,210 |
$47,751 |
$34,266 |
$45,914 |
$53,883 |
$63,243 |
$102,149 |
$56,580 |
||||
|
Most Recent Five Years |
|||||||||||||||||
|
2014 |
45 |
$27,833 |
$40,075 |
$43,937 |
$51,000 |
$85,000 |
$46,984 |
$29,887 |
$43,032 |
$47,179 |
$54,763 |
$91,271 |
$50,451 |
||||
|
2015 |
45 |
$28,000 |
$40,058 |
$44,500 |
$54,500 |
$84,667 |
$48,081 |
$30,030 |
$42,963 |
$47,726 |
$58,452 |
$90,806 |
$51,567 |
||||
|
2016 |
45 |
$29,667 |
$40,544 |
$50,300 |
$56,837 |
$89,100 |
$50,290 |
$31,421 |
$42,942 |
$53,275 |
$60,198 |
$94,370 |
$53,265 |
||||
|
2017 |
45 |
$30,000 |
$42,750 |
$51,000 |
$58,000 |
$92,567 |
$51,283 |
$31,111 |
$44,333 |
$52,889 |
$60,148 |
$95,995 |
$53,182 |
||||
|
2018 |
45 |
$35,000 |
$47,500 |
$55,000 |
$64,000 |
$94,036 |
$55,985 |
$35,233 |
$47,816 |
$55,366 |
$64,425 |
$94,661 |
$56,357 |
||||
|
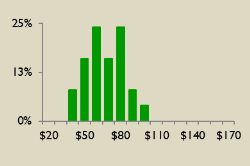
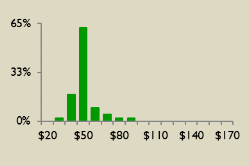
2018 Pay Distribution |
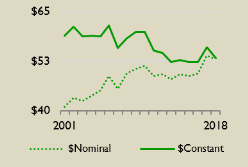
Median Pay |
Change |
|||||||||||||||
|
| 2017-2018 2014-2018 2009-2018 2004-2018 2001-2018 | 4.68% 17.35% 2.75% -10.79% 9.49% | ||||||||||||||
|
Dollars in figures are in thousands. |
|||||||||||||||||
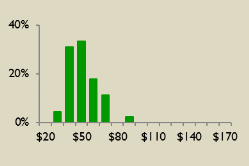
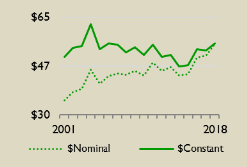
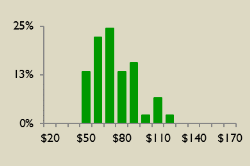
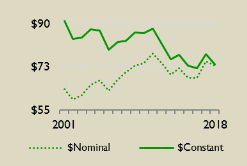
Source: Statement of Disbursements of the House, as collated by LegiStorm, various years, and CRS calculations. Percentage change in pay is based on the change in median pay (expressed in constant, March 2019 dollars2020 dol ars) for the periods noted. In the visualizations, position pay information based on constant 2019 dollars2020 dol ars in thousands of dollars, dol ars, or change in those levels, are presented in solid green. Detailed information about data sources is available above in "“Data Tables and Visualizations.".” Data provided here are partial; complete data, 2001-20182019, are available to congressional requestersstaff upon request.
CRS-7
link to page 6
Table 4. Chief of Staff
Nominal, Current $
Constant, 2020, $
Year
#
Minimum
Q1
Q2, Median
Q3
Maximum Average Minimum
Q1
Q2, Median
Q3
Maximum Average
2001
45
$76,361
$95,000
$104,250
$114,833
$137,020
$106,313
$111,052
$138,159
$151,611
$167,002
$199,268
$154,612
2005
45
$70,196
$115,450
$130,000
$146,712
$156,827
$129,013
$92,573
$152,253
$171,441
$193,480
$206,819
$170,139
2010
45
$98,500
$129,333
$147,000
$165,018
$168,411
$143,697
$116,343
$152,762
$173,629
$194,911
$198,919
$169,728
Most Recent Five Years
2015
45
$114,173
$137,924
$146,561
$160,000
$168,411
$147,650
$124,068
$149,877
$159,262
$173,866
$183,006
$160,446
2016
45
$116,534
$133,820
$148,902
$159,700
$168,411
$147,637
$125,056
$143,605
$159,790
$171,378
$180,726
$158,433
2017
45
$112,320
$139,444
$152,000
$160,834
$168,411
$150,185
$118,019
$146,520
$159,712
$168,994
$176,956
$157,805
2018
45
$99,917
$137,000
$155,637
$168,000
$168,411
$149,871
$102,483
$140,519
$159,635
$172,315
$172,737
$153,720
2019
45
$105,750
$144,652
$155,226
$168,411
$168,411
$153,302
$106,536
$145,727
$156,379
$169,663
$169,663
$154,441
Median Pay
2019 Pay Distribution
Change
2018-2019
-2.04%
2015-2019
-1.81%
2010-2019
-9.93%
2005-2019
-8.79%
2001-2019
3.15%
Dol ars in figures are in thousands.
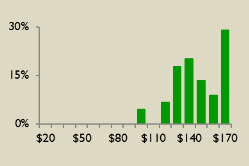
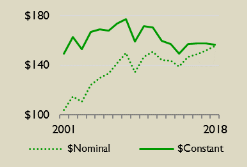
Source: Statement of Disbursements of the House, as col ated by LegiStorm, various years, and CRS calculations. upon request.
|
Nominal, Current $ |
Constant, 2019, $ |
||||||||||||||||
|
Year |
Number |
Minimum |
Q1 |
Q2, Median |
Q3 |
Maximum |
Average |
Minimum |
Q1 |
Q2, Median |
Q3 |
Maximum |
Average |
||||
|
2001 |
45 |
$76,361 |
$95,000 |
$104,250 |
$114,833 |
$137,020 |
$106,313 |
$109,606 |
$136,359 |
$149,636 |
$164,827 |
$196,673 |
$152,598 |
||||
|
2004 |
45 |
$86,500 |
$110,952 |
$124,000 |
$134,524 |
$151,974 |
$122,278 |
$116,403 |
$149,307 |
$166,866 |
$181,029 |
$204,511 |
$164,549 |
||||
|
2009 |
45 |
$42,708 |
$123,350 |
$134,344 |
$153,136 |
$168,411 |
$133,877 |
$50,605 |
$146,156 |
$159,183 |
$181,449 |
$199,548 |
$158,629 |
||||
|
Most Recent Five Years |
|||||||||||||||||
|
2014 |
45 |
$89,401 |
$124,167 |
$138,968 |
$161,091 |
$168,411 |
$140,803 |
$95,997 |
$133,328 |
$149,221 |
$172,975 |
$180,836 |
$151,191 |
||||
|
2015 |
45 |
$114,173 |
$137,924 |
$146,561 |
$160,000 |
$168,411 |
$147,650 |
$122,451 |
$147,925 |
$157,188 |
$171,601 |
$180,622 |
$158,356 |
||||
|
2016 |
45 |
$116,534 |
$133,820 |
$148,902 |
$159,700 |
$168,411 |
$147,637 |
$123,427 |
$141,735 |
$157,708 |
$169,145 |
$178,372 |
$156,369 |
||||
|
2017 |
45 |
$112,320 |
$139,444 |
$152,000 |
$160,834 |
$168,411 |
$150,185 |
$116,480 |
$144,609 |
$157,630 |
$166,791 |
$174,649 |
$155,748 |
||||
|
2018 |
45 |
$99,917 |
$137,000 |
$155,637 |
$168,000 |
$168,411 |
$149,871 |
$100,581 |
$137,911 |
$156,671 |
$169,117 |
$169,530 |
$150,867 |
||||
|
2018 Pay Distribution |
Median Pay |
Change |
|||||||||||||||
|
| 2017-2018 2014-2018 2009-2018 2004-2018 2001-2018 | -0.61% 4.99% -1.58% -6.11% 4.70% | ||||||||||||||
|
Dollars in figures are in thousands. |
|||||||||||||||||
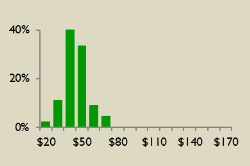
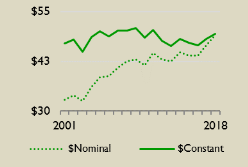
Source: Statement of Disbursements of the House, as collated by LegiStorm, various years, and CRS calculations. Percentage change in pay is based on the change in median pay (expressed in constant, March 2019 dollars2020 dol ars) for the periods noted. In the visualizations, position pay information based on constant 2019 dollars2020 dol ars in thousands of dollars, dol ars, or change in those levels, are presented in solid green. Detailed information about data sources is available above in "“Data Tables and Visualizations.".” Data provided here are partial; complete data, 2001-20182019, are available to congressional requestersstaff upon request.
CRS-8
link to page 6
Table 5. Communications Director
Nominal, Current $
Constant, 2020, $
Year
#
Minimum
Q1
Q2, Median
Q3
Maximum Average Minimum
Q1
Q2, Median
Q3
Maximum Average
2001
32
$35,233
$51,118
$63,563
$72,000
$99,020
$63,538
$51,240
$74,340
$92,439
$104,710
$144,005
$92,404
2005
45
$45,817
$55,916
$67,083
$76,300
$102,125
$67,517
$60,422
$73,741
$88,468
$100,623
$134,680
$89,040
2010
45
$52,000
$61,000
$74,000
$83,500
$132,596
$76,208
$61,420
$72,050
$87,405
$98,626
$156,616
$90,013
Most Recent Five Years
2015
45
$43,878
$61,678
$68,078
$77,937
$102,918
$70,327
$47,680
$67,023
$73,978
$84,692
$111,837
$76,422
2016
45
$48,000
$58,546
$68,125
$82,680
$120,300
$73,690
$51,510
$62,827
$73,106
$88,726
$129,097
$79,079
2017
45
$46,500
$69,000
$75,000
$84,250
$106,733
$76,784
$48,859
$72,501
$78,805
$88,525
$112,149
$80,680
2018
45
$52,000
$63,333
$73,001
$89,986
$124,000
$77,436
$53,336
$64,960
$74,876
$92,297
$127,185
$79,426
2019
45
$41,000
$66,333
$79,500
$90,000
$114,750
$77,817
$41,305
$66,826
$80,091
$90,669
$115,603
$78,396
Median Pay
2019 Pay Distribution
Change
2018-2019
6.96%
2015-2019
8.26%
2010-2019
-8.37%
2005-2019
-9.47%
2001-2019
-13.36%
Dol ars in figures are in thousands.
Source: Statement of Disbursements of the House, as col ated by LegiStorm, various years, and CRS calculations. upon request.
|
Nominal, Current $ |
Constant, 2019, $ |
||||||||||||||||
|
Year |
Number |
Minimum |
Q1 |
Q2, Median |
Q3 |
Maximum |
Average |
Minimum |
Q1 |
Q2, Median |
Q3 |
Maximum |
Average |
||||
|
2001 |
32 |
$35,233 |
$51,118 |
$63,563 |
$72,000 |
$99,020 |
$63,538 |
$50,573 |
$73,372 |
$91,235 |
$103,346 |
$142,129 |
$91,200 |
||||
|
2004 |
45 |
$39,000 |
$56,489 |
$65,250 |
$69,567 |
$106,690 |
$65,201 |
$52,482 |
$76,017 |
$87,807 |
$93,616 |
$143,572 |
$87,740 |
||||
|
2009 |
45 |
$48,233 |
$64,617 |
$72,961 |
$83,273 |
$128,992 |
$77,048 |
$57,151 |
$76,563 |
$86,451 |
$98,670 |
$152,841 |
$91,293 |
||||
|
Most Recent Five Years |
|||||||||||||||||
|
2014 |
45 |
$42,500 |
$63,000 |
$72,061 |
$82,000 |
$115,000 |
$72,485 |
$45,636 |
$67,648 |
$77,378 |
$88,050 |
$123,484 |
$77,833 |
||||
|
2015 |
45 |
$43,878 |
$61,678 |
$68,078 |
$77,937 |
$102,918 |
$70,327 |
$47,059 |
$66,150 |
$73,014 |
$83,588 |
$110,380 |
$75,427 |
||||
|
2016 |
45 |
$48,000 |
$58,546 |
$68,125 |
$82,680 |
$120,300 |
$73,690 |
$50,839 |
$62,008 |
$72,154 |
$87,570 |
$127,415 |
$78,048 |
||||
|
2017 |
45 |
$46,500 |
$69,000 |
$75,000 |
$84,250 |
$106,733 |
$76,784 |
$48,222 |
$71,556 |
$77,778 |
$87,371 |
$110,687 |
$79,628 |
||||
|
2018 |
45 |
$52,000 |
$63,333 |
$73,001 |
$89,986 |
$124,000 |
$77,436 |
$52,346 |
$63,754 |
$73,486 |
$90,584 |
$124,824 |
$77,951 |
||||
|
2018 Pay Distribution |
Median Pay |
Change |
|||||||||||||||
|
| 2017-2018 2014-2018 2009-2018 2004-2018 2001-2018 | -5.52% -5.03% -15.00% -16.31% -19.45% | ||||||||||||||
|
Dollars in figures are in thousands. |
|||||||||||||||||
Source: Statement of Disbursements of the House, as collated by LegiStorm, various years, and CRS calculations. Percentage change in pay is based on the change in median pay (expressed in constant, March 2019 dollars2020 dol ars) for the periods noted. In the visualizations, position pay information based on constant 2019 dollars2020 dol ars in thousands of dollars, dol ars, or change in those levels, are presented in solid blue. green. Detailed information about data sources is available above in "“Data Tables and Visualizations.".” Data provided here are partial; complete data, FY2001-FY2018, is data, 2001-2019, are available to congressional requestersstaff upon request.
CRS-9
link to page 6
Table 6. Constituent Services Representative
Nominal, Current $
Constant, 2020, $
Year
#
Minimum
Q1
Q2, Median
Q3
Maximum Average Minimum
Q1
Q2, Median
Q3
Maximum Average
2001
30
$25,894
$28,789
$32,791
$37,401
$46,880
$33,815
$37,658
$41,868
$47,688
$54,392
$68,178
$49,177
2005
45
$25,533
$34,797
$38,500
$43,000
$56,000
$38,529
$33,673
$45,890
$50,773
$56,707
$73,851
$50,811
2010
45
$25,000
$37,000
$41,542
$54,500
$66,667
$44,824
$29,529
$43,703
$49,067
$64,373
$78,743
$52,944
Most Recent Five Years
2015
45
$28,500
$36,000
$44,000
$50,322
$77,250
$44,186
$30,970
$39,120
$47,813
$54,683
$83,945
$48,015
2016
45
$22,903
$39,775
$44,000
$56,400
$74,417
$46,874
$24,577
$42,683
$47,217
$60,524
$79,858
$50,302
2017
45
$20,425
$41,000
$46,500
$52,500
$64,000
$47,104
$21,461
$43,080
$48,859
$55,164
$67,247
$49,494
2018
45
$23,833
$42,925
$49,150
$54,972
$73,567
$49,145
$24,446
$44,028
$50,412
$56,384
$75,456
$50,407
2019
45
$31,000
$41,900
$47,167
$53,500
$65,500
$48,308
$31,230
$42,211
$47,517
$53,898
$65,987
$48,667
Median Pay
2019 Pay Distribution
Change
2018-2019
-5.74%
2015-2019
-0.62%
2010-2019
-3.16%
2005-2019
-6.41%
2001-2019
-0.36%
Dol ars in figures are in thousands.
Source: Statement of Disbursements of the House, as col ated by LegiStorm, various years, and CRS calculations. upon request.
|
Nominal, Current $ |
Constant, 2019, $ |
||||||||||||||||
|
Year |
Number |
Minimum |
Q1 |
Q2, Median |
Q3 |
Maximum |
Average |
Minimum |
Q1 |
Q2, Median |
Q3 |
Maximum |
Average |
||||
|
2001 |
30 |
$25,894 |
$28,789 |
$32,791 |
$37,401 |
$46,880 |
$33,815 |
$37,168 |
$41,322 |
$47,067 |
$53,684 |
$67,290 |
$48,537 |
||||
|
2004 |
45 |
$24,247 |
$30,300 |
$36,100 |
$42,667 |
$63,333 |
$36,983 |
$32,629 |
$40,775 |
$48,580 |
$57,416 |
$85,227 |
$49,768 |
||||
|
2009 |
45 |
$27,125 |
$33,833 |
$42,928 |
$52,000 |
$86,558 |
$43,815 |
$32,140 |
$40,089 |
$50,865 |
$61,614 |
$102,562 |
$51,915 |
||||
|
Most Recent Five Years |
|||||||||||||||||
|
2014 |
45 |
$26,250 |
$35,000 |
$44,800 |
$50,833 |
$88,833 |
$46,912 |
$28,187 |
$37,582 |
$48,105 |
$54,584 |
$95,387 |
$50,373 |
||||
|
2015 |
45 |
$28,500 |
$36,000 |
$44,000 |
$50,322 |
$77,250 |
$44,186 |
$30,566 |
$38,610 |
$47,190 |
$53,971 |
$82,851 |
$47,389 |
||||
|
2016 |
45 |
$22,903 |
$39,775 |
$44,000 |
$56,400 |
$74,417 |
$46,874 |
$24,257 |
$42,127 |
$46,602 |
$59,736 |
$78,818 |
$49,647 |
||||
|
2017 |
45 |
$20,425 |
$41,000 |
$46,500 |
$52,500 |
$64,000 |
$47,104 |
$21,182 |
$42,519 |
$48,222 |
$54,445 |
$66,371 |
$48,849 |
||||
|
2018 |
45 |
$23,833 |
$42,925 |
$49,150 |
$54,972 |
$73,567 |
$49,145 |
$23,992 |
$43,210 |
$49,477 |
$55,338 |
$74,056 |
$49,472 |
||||
|
2018 Pay Distribution |
Median Pay |
Change |
|||||||||||||||
|
| 2017-2018 2014-2018 2009-2018 2004-2018 2001-2018 | 2.60% 2.85% -2.73% 1.85% 5.12% | ||||||||||||||
|
Dollars in figures are in thousands. |
|||||||||||||||||
Source: Statement of Disbursements of the House, as collated by LegiStorm, various years, and CRS calculations. Percentage change in pay is based on the change in median pay (expressed in constant, March 2019 dollars2020 dol ars) for the periods noted. In the visualizations, position pay information based on constant 2019 dollars2020 dol ars in thousands of dollars, dol ars, or change in those levels, are presented in solid green. Detailed information about data sources is available above in "“Data Tables and Visualizations.".” Data provided here are partial; complete data, 2001-20182019, are available to congressional requestersstaff upon request.
CRS-10
link to page 6 link to page 6
Table 7. Counsel, 2010-2018
Nominal, Current $
Constant, 2020, $
Year
#
Minimum
Q1
Q2, Median
Q3
Maximum Average Minimum
Q1
Q2, Median
Q3
Maximum Average
2010
30
$45,250
$61,013
$75,502
$87,724
$127,981
$76,884
$53,447
$72,065
$89,179
$103,616
$151,165
$90,811
Most Recent Five Years
2015
23
$41,000
$61,000
$70,678
$80,324
$108,142
$71,155
$44,553
$66,286
$76,803
$87,285
$117,513
$77,321
2016
28
$44,500
$53,425
$60,333
$68,000
$91,097
$61,538
$47,754
$57,332
$64,745
$72,972
$97,759
$66,038
2017
21
$29,000
$52,000
$68,333
$77,841
$88,000
$64,413
$30,471
$54,638
$71,800
$81,791
$92,465
$67,681
2018
25
$46,000
$61,750
$72,333
$81,333
$99,000
$70,871
$47,182
$63,336
$74,191
$83,423
$101,543
$72,691
Median Pay
Dol ars in figures are in thousands.
Source: Statement of Disbursements of the House, as col ated by LegiStorm, various years, and CRS calculations. In the visualization, upon request.
|
Nominal, Current $ |
Constant, 2019, $ |
||||||||||||||||
|
Year |
Number |
Minimum |
Q1 |
Q2, Median |
Q3 |
Maximum |
Average |
Minimum |
Q1 |
Q2, Median |
Q3 |
Maximum |
Average |
||||
|
2010 |
30 |
$45,250 |
$61,013 |
$75,502 |
$87,724 |
$127,981 |
$76,884 |
$52,751 |
$71,126 |
$88,017 |
$102,266 |
$149,196 |
$89,628 |
||||
|
2011 |
23 |
$34,792 |
$58,250 |
$74,417 |
$79,500 |
$100,375 |
$70,824 |
$39,318 |
$65,828 |
$84,098 |
$89,842 |
$113,433 |
$80,038 |
||||
|
2012 |
20 |
$49,236 |
$60,804 |
$72,167 |
$81,640 |
$130,833 |
$73,390 |
$54,513 |
$67,321 |
$79,902 |
$90,390 |
$144,856 |
$81,256 |
||||
|
2013 |
19 |
$41,667 |
$51,125 |
$58,692 |
$71,750 |
$126,546 |
$63,416 |
$45,467 |
$55,787 |
$64,044 |
$78,293 |
$138,087 |
$69,199 |
||||
|
2014 |
19 |
$45,200 |
$52,917 |
$62,250 |
$77,500 |
$119,868 |
$67,088 |
$48,535 |
$56,821 |
$66,843 |
$83,218 |
$128,711 |
$72,038 |
||||
|
2015 |
23 |
$41,000 |
$61,000 |
$70,678 |
$80,324 |
$108,142 |
$71,155 |
$43,973 |
$65,423 |
$75,802 |
$86,148 |
$115,983 |
$76,314 |
||||
|
2016 |
28 |
$44,500 |
$53,425 |
$60,333 |
$68,000 |
$91,097 |
$61,538 |
$47,132 |
$56,585 |
$63,902 |
$72,022 |
$96,485 |
$65,178 |
||||
|
2017 |
21 |
$29,000 |
$52,000 |
$68,333 |
$77,841 |
$88,000 |
$64,413 |
$30,074 |
$53,926 |
$70,864 |
$80,725 |
$91,259 |
$66,799 |
||||
|
2018 |
25 |
$46,000 |
$61,750 |
$72,333 |
$81,333 |
$99,000 |
$70,871 |
$46,306 |
$62,160 |
$72,814 |
$81,874 |
$99,658 |
$71,342 |
||||
|
2018 Pay Distribution |
Median Pay |
Change |
|||||||||||||||
|
| 2017-2018 2014-2018 | 2.75% 8.93% | ||||||||||||||
|
Dollars in figures are in thousands. |
|||||||||||||||||
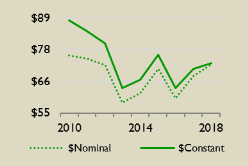
Source: Statement of Disbursements of the House, as collated by LegiStorm, various years, and CRS calculations. Percentage change in pay is based on the change in median pay (expressed in constant, March 2019 dollars) for the periods noted. In the visualizations, position pay information based on constant 2019 dollars2020 dol ars in thousands of dollars, dol ars, or change in those levels, are presented in solid green. Detailed information about data sources is available above in "“Data Tables and Visualizations.".” Data provided here are complete; no data are available prior to 2010.
|
Nominal, Current $ |
Constant, 2019, $ |
||||||||||||||||
|
Year |
Number |
Minimum |
Q1 |
Q2, Median |
Q3 |
Maximum |
Average |
Minimum |
Q1 |
Q2, Median |
Q3 |
Maximum |
Average |
||||
|
2001 |
45 |
$49,538 |
$58,667 |
$72,844 |
$78,240 |
$101,624 |
$70,062 |
$71,105 |
$84,208 |
$104,558 |
$112,302 |
$145,867 |
$100,564 |
||||
|
2004 |
45 |
$42,500 |
$70,750 |
$77,100 |
$83,050 |
$116,568 |
$77,877 |
$57,192 |
$95,208 |
$103,753 |
$111,760 |
$156,865 |
$104,799 |
||||
|
2009 |
45 |
$60,000 |
$80,680 |
$88,274 |
$98,115 |
$120,450 |
$90,238 |
$71,093 |
$95,597 |
$104,595 |
$116,255 |
$142,720 |
$106,922 |
||||
|
Most Recent Five Years |
|||||||||||||||||
|
2014 |
45 |
$45,000 |
$75,400 |
$88,500 |
$107,083 |
$144,667 |
$93,519 |
$48,320 |
$80,963 |
$95,029 |
$114,984 |
$155,340 |
$100,419 |
||||
|
2015 |
45 |
$59,433 |
$78,000 |
$95,167 |
$112,000 |
$162,600 |
$97,911 |
$63,743 |
$83,655 |
$102,067 |
$120,121 |
$174,389 |
$105,010 |
||||
|
2016 |
45 |
$58,417 |
$79,500 |
$89,750 |
$105,917 |
$145,265 |
$94,988 |
$61,872 |
$84,202 |
$95,058 |
$112,181 |
$153,856 |
$100,606 |
||||
|
2017 |
45 |
$56,000 |
$85,638 |
$95,172 |
$105,000 |
$163,028 |
$97,105 |
$58,074 |
$88,810 |
$98,697 |
$108,889 |
$169,066 |
$100,701 |
||||
|
2018 |
45 |
$62,200 |
$81,250 |
$93,000 |
$105,000 |
$138,000 |
$94,042 |
$62,613 |
$81,790 |
$93,618 |
$105,698 |
$138,917 |
$94,667 |
||||
|
2018 Pay Distribution |
Median Pay |
Change |
|||||||||||||||
|
| 2017-2018 2014-2018 2009-2018 2004-2018 2001-2018 | -5.15% -1.49% -10.49% -9.77% -10.46% | ||||||||||||||
|
Dollars in figures are in thousands. |
|||||||||||||||||
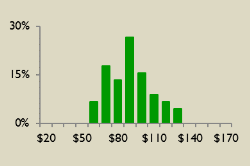
Source: Statement of Disbursements of the House, as collated by LegiStorm, various years, and CRS calculations. partial; complete data, 2010-2018, are available to congressional staff upon request.
CRS-11
link to page 6
Table 8. District Director
Nominal, Current $
Constant, 2020, $
Year
#
Minimum
Q1
Q2, Median
Q3
Maximum Average Minimum
Q1
Q2, Median
Q3
Maximum Average
2001
45
$49,538
$58,667
$72,844
$78,240
$101,624
$70,062
$72,043
$85,319
$105,938
$113,785
$147,792
$101,891
2005
45
$49,583
$73,412
$83,904
$94,320
$123,500
$83,325
$65,389
$96,814
$110,650
$124,387
$162,869
$109,888
2010
45
$48,100
$83,500
$92,545
$107,000
$136,003
$95,323
$56,813
$98,626
$109,310
$126,383
$160,640
$112,591
Most Recent Five Years
2015
45
$59,433
$78,000
$95,167
$112,000
$162,600
$97,911
$64,584
$84,760
$103,414
$121,706
$176,691
$106,396
2016
45
$58,417
$79,500
$89,750
$105,917
$145,265
$94,988
$62,688
$85,313
$96,313
$113,662
$155,887
$101,934
2017
45
$56,000
$85,638
$95,172
$105,000
$163,028
$97,105
$58,841
$89,984
$100,001
$110,327
$171,300
$102,031
2018
45
$62,200
$81,250
$93,000
$105,000
$138,000
$94,042
$63,798
$83,337
$95,389
$107,697
$141,545
$96,457
2019
45
$56,150
$81,150
$95,706
$106,000
$132,958
$94,771
$56,567
$81,753
$96,417
$106,788
$133,946
$95,476
Median Pay
2019 Pay Distribution
Change
2018-2019
1.08%
2015-2019
-6.77%
2010-2019
-11.79%
2005-2019
-12.86%
2001-2019
-8.99%
Dol ars in figures are in thousands.
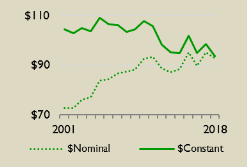
Source: Statement of Disbursements of the House, as col ated by LegiStorm, various years, and CRS calculations. Percentage change in pay is based on the change in median pay (expressed in constant, March 2019 dollars2020 dol ars) for the periods noted. In the visualizations, position pay information based on constant 2019 dollars2020 dol ars in thousands of dollars, dol ars, or change in those levels, are presented in solid green. Detailed information about data sources is available above in "“Data Tables and Visualizations.".” Data provided here are partial; complete data, 2001-20182019, are available to congressional requestersstaff upon request.
CRS-12
link to page 6
Table 9. Executive Assistant
Nominal, Current $
Constant, 2020, $
Year
#
Minimum
Q1
Q2, Median
Q3
Maximum Average Minimum
Q1
Q2, Median
Q3
Maximum Average
2001
45
$27,583
$44,750
$53,136
$65,917
$104,167
$56,922
$40,115
$65,080
$77,276
$95,863
$151,490
$82,782
2005
45
$27,000
$49,667
$54,837
$76,333
$97,275
$60,504
$35,607
$65,499
$72,318
$100,667
$128,284
$79,791
2010
45
$20,500
$49,750
$64,500
$82,069
$134,278
$67,102
$24,214
$58,762
$76,184
$96,935
$158,602
$79,258
Most Recent Five Years
2015
38
$21,000
$44,412
$54,917
$66,125
$92,426
$55,918
$22,820
$48,261
$59,676
$71,855
$100,435
$60,764
2016
42
$21,000
$48,667
$56,799
$64,768
$93,291
$57,936
$22,536
$52,225
$60,952
$69,504
$100,112
$62,172
2017
28
$21,000
$49,125
$62,590
$73,845
$96,500
$61,742
$22,065
$51,618
$65,766
$77,592
$101,396
$64,874
2018
34
$35,041
$49,250
$61,278
$78,246
$166,137
$67,677
$35,941
$50,515
$62,852
$80,256
$170,404
$69,416
2019
19
$22,583
$49,813
$60,500
$65,042
$103,750
$59,981
$22,751
$50,183
$60,950
$65,525
$104,521
$60,427
Median Pay
2019 Pay Distribution
Change
2018-2019
-3.03%
2015-2019
2.13%
2010-2019
-20.00%
2005-2019
-15.72%
2001-2019
-21.13%
Dol ars in figures are in thousands.
Source: Statement of Disbursements of the House, as col ated by LegiStorm, various years, and CRS calculations. upon request.
|
Nominal, Current $ |
Constant, 2019, $ |
||||||||||||||||
|
Year |
Number |
Minimum |
Q1 |
Q2, Median |
Q3 |
Maximum |
Average |
Minimum |
Q1 |
Q2, Median |
Q3 |
Maximum |
Average |
||||
|
2001 |
45 |
$27,583 |
$44,750 |
$53,136 |
$65,917 |
$104,167 |
$56,922 |
$39,592 |
$64,232 |
$76,269 |
$94,614 |
$149,517 |
$81,704 |
||||
|
2004 |
45 |
$27,446 |
$41,957 |
$51,933 |
$68,600 |
$87,602 |
$55,603 |
$36,934 |
$56,461 |
$69,887 |
$92,315 |
$117,885 |
$74,824 |
||||
|
2009 |
45 |
$30,000 |
$46,000 |
$57,500 |
$66,000 |
$108,047 |
$58,062 |
$35,547 |
$54,505 |
$68,131 |
$78,203 |
$128,023 |
$68,796 |
||||
|
Most Recent Five Years |
|||||||||||||||||
|
2014 |
30 |
$32,000 |
$46,625 |
$54,750 |
$64,612 |
$89,167 |
$55,748 |
$34,361 |
$50,065 |
$58,789 |
$69,379 |
$95,745 |
$59,861 |
||||
|
2015 |
38 |
$21,000 |
$44,412 |
$54,917 |
$66,125 |
$92,426 |
$55,918 |
$22,523 |
$47,633 |
$58,898 |
$70,919 |
$99,127 |
$59,973 |
||||
|
2016 |
42 |
$21,000 |
$48,667 |
$56,799 |
$64,768 |
$93,291 |
$57,936 |
$22,242 |
$51,545 |
$60,158 |
$68,599 |
$98,808 |
$61,362 |
||||
|
2017 |
28 |
$21,000 |
$49,125 |
$62,590 |
$73,845 |
$96,500 |
$61,742 |
$21,778 |
$50,945 |
$64,908 |
$76,580 |
$100,074 |
$64,028 |
||||
|
2018 |
34 |
$35,041 |
$49,250 |
$61,278 |
$78,246 |
$166,137 |
$67,677 |
$35,274 |
$49,577 |
$61,685 |
$78,766 |
$167,241 |
$68,127 |
||||
|
2018 Pay Distribution |
Median Pay |
Change |
|||||||||||||||
|
| 2017-2018 2014-2018 2009-2018 2004-2018 2001-2018 | -4.97% 4.93% -9.46% -11.74% -19.12% | ||||||||||||||
|
Dollars in figures are in thousands. |
|||||||||||||||||
Source: Statement of Disbursements of the House, as collated by LegiStorm, various years, and CRS calculations. Percentage change in pay is based on the change in median pay (expressed in constant, March 2019 dollars2020 dol ars) for the periods noted. In the visualizations, position pay information based on constant 2019 dollars2020 dol ars in thousands of dollars, dol ars, or change in those levels, are presented in solid green. Detailed information about data sources is available above in "“Data Tables and Visualizations.".” Data provided here are partial; complete data, 2001-20182019, are available to congressional requestersstaff upon request.
CRS-13
link to page 6
Table 10. Field Representative
Nominal, Current $
Constant, 2020, $
Year
#
Minimum
Q1
Q2, Median
Q3
Maximum Average Minimum
Q1
Q2, Median
Q3
Maximum Average
2001
45
$22,131
$31,250
$35,500
$40,795
$75,275
$38,242
$32,185
$45,447
$51,628
$59,328
$109,473
$55,616
2005
45
$25,805
$36,500
$40,750
$47,500
$72,000
$43,791
$34,031
$48,135
$53,740
$62,642
$94,952
$57,750
2010
45
$28,917
$41,200
$48,033
$54,248
$77,311
$48,932
$34,155
$48,663
$56,735
$64,075
$91,316
$57,796
Most Recent Five Years
2015
45
$22,100
$40,994
$46,544
$55,000
$100,000
$49,031
$24,015
$44,547
$50,578
$59,766
$108,666
$53,280
2016
45
$25,000
$39,050
$47,667
$56,250
$71,890
$48,188
$26,828
$41,905
$51,152
$60,363
$77,147
$51,711
2017
45
$21,500
$44,500
$48,750
$57,489
$81,400
$50,091
$22,591
$46,758
$51,223
$60,406
$85,530
$52,632
2018
45
$29,250
$41,000
$47,750
$54,750
$72,128
$48,707
$30,001
$42,053
$48,976
$56,156
$73,980
$49,959
2019
45
$30,761
$45,000
$49,500
$57,000
$74,440
$50,824
$30,989
$45,334
$49,868
$57,424
$74,993
$51,202
Median Pay
2019 Pay Distribution
Change
2018-2019
1.82%
2015-2019
-1.40%
2010-2019
-12.10%
2005-2019
-7.21%
2001-2019
-3.41%
Dol ars in figures are in thousands.
Source: Statement of Disbursements of the House, as col ated by LegiStorm, various years, and CRS calculations. upon request.
|
Nominal, Current $ |
Constant, 2019, $ |
||||||||||||||||
|
Year |
Number |
Minimum |
Q1 |
Q2, Median |
Q3 |
Maximum |
Average |
Minimum |
Q1 |
Q2, Median |
Q3 |
Maximum |
Average |
||||
|
2001 |
45 |
$22,131 |
$31,250 |
$35,500 |
$40,795 |
$75,275 |
$38,242 |
$31,765 |
$44,855 |
$50,955 |
$58,555 |
$108,047 |
$54,891 |
||||
|
2004 |
45 |
$26,017 |
$35,558 |
$39,472 |
$49,000 |
$78,967 |
$42,892 |
$35,011 |
$47,851 |
$53,117 |
$65,939 |
$106,265 |
$57,719 |
||||
|
2009 |
45 |
$34,033 |
$40,300 |
$45,000 |
$51,021 |
$81,917 |
$47,299 |
$40,326 |
$47,751 |
$53,320 |
$60,455 |
$97,062 |
$56,044 |
||||
|
Most Recent Five Years |
|||||||||||||||||
|
2014 |
45 |
$25,750 |
$42,000 |
$47,667 |
$55,417 |
$94,625 |
$48,428 |
$27,650 |
$45,099 |
$51,183 |
$59,505 |
$101,606 |
$52,001 |
||||
|
2015 |
45 |
$22,100 |
$40,994 |
$46,544 |
$55,000 |
$100,000 |
$49,031 |
$23,702 |
$43,967 |
$49,919 |
$58,988 |
$107,251 |
$52,586 |
||||
|
2016 |
45 |
$25,000 |
$39,050 |
$47,667 |
$56,250 |
$71,890 |
$48,188 |
$26,479 |
$41,360 |
$50,486 |
$59,577 |
$76,142 |
$51,038 |
||||
|
2017 |
45 |
$21,500 |
$44,500 |
$48,750 |
$57,489 |
$81,400 |
$50,091 |
$22,296 |
$46,148 |
$50,556 |
$59,618 |
$84,415 |
$51,946 |
||||
|
2018 |
45 |
$29,250 |
$41,000 |
$47,750 |
$54,750 |
$72,128 |
$48,707 |
$29,444 |
$41,272 |
$48,067 |
$55,114 |
$72,607 |
$49,031 |
||||
|
2018 Pay Distribution |
Median Pay |
Change |
|||||||||||||||
|
| 2017-2018 2014-2018 2009-2018 2004-2018 2001-2018 | -4.92% -6.09% -9.85% -9.51% -5.67% | ||||||||||||||
|
Dollars in figures are in thousands. |
|||||||||||||||||
Source: Statement of Disbursements of the House, as collated by LegiStorm, various years, and CRS calculations. Percentage change in pay is based on the change in median pay (expressed in constant, March 2019 dollars2020 dol ars) for the periods noted. In the visualizations, position pay information based on constant 2019 dollars2020 dol ars in thousands of dollars, dol ars, or change in those levels, are presented in solid green. Detailed information about data sources is available above in "“Data Tables and Visualizations.".” Data provided here are partial; complete data, 2001-20182019, are available to congressional requestersstaff upon request.
CRS-14
link to page 6
Table 11. Legislative Assistant
Nominal, Current $
Constant, 2020, $
Year
#
Minimum
Q1
Q2, Median
Q3
Maximum Average Minimum
Q1
Q2, Median
Q3
Maximum Average
2001
45
$30,154
$37,748
$41,092
$45,676
$70,000
$43,493
$43,853
$54,898
$59,760
$66,427
$101,801
$63,252
2005
45
$29,542
$40,150
$45,208
$52,500
$104,290
$50,609
$38,959
$52,949
$59,620
$69,236
$137,535
$66,742
2010
45
$37,637
$45,500
$51,427
$58,250
$114,814
$54,346
$44,455
$53,742
$60,743
$68,802
$135,613
$64,190
Most Recent Five Years
2015
45
$30,000
$43,850
$48,760
$52,667
$83,336
$49,860
$32,600
$47,650
$52,986
$57,231
$90,558
$54,181
2016
45
$36,896
$46,500
$49,400
$59,583
$72,967
$52,276
$39,594
$49,900
$53,012
$63,940
$78,302
$56,098
2017
45
$41,746
$48,833
$54,000
$60,961
$91,033
$56,951
$43,864
$51,311
$56,740
$64,054
$95,652
$59,841
2018
45
$37,163
$50,000
$52,917
$57,500
$96,417
$55,304
$38,118
$51,284
$54,276
$58,977
$98,893
$56,725
2019
45
$43,000
$50,058
$55,306
$63,333
$91,208
$56,741
$43,320
$50,430
$55,717
$63,804
$91,886
$57,163
Median Pay
2019 Pay Distribution
Change
2018-2019
2.65%
2015-2019
5.15%
2010-2019
-8.27%
2005-2019
-6.55%
2001-2019
-6.77%
Dol ars in figures are in thousands.
Source: Statement of Disbursements of the House, as col ated by LegiStorm, various years, and CRS calculations. upon request.
|
Nominal, Current $ |
Constant, 2019, $ |
||||||||||||||||
|
Year |
Number |
Minimum |
Q1 |
Q2, Median |
Q3 |
Maximum |
Average |
Minimum |
Q1 |
Q2, Median |
Q3 |
Maximum |
Average |
||||
|
2001 |
45 |
$30,154 |
$37,748 |
$41,092 |
$45,676 |
$70,000 |
$43,493 |
$43,282 |
$54,182 |
$58,981 |
$65,561 |
$100,475 |
$62,428 |
||||
|
2004 |
45 |
$30,081 |
$37,813 |
$43,750 |
$49,242 |
$95,585 |
$46,008 |
$40,479 |
$50,884 |
$58,874 |
$66,264 |
$128,628 |
$61,913 |
||||
|
2009 |
45 |
$34,000 |
$44,595 |
$50,500 |
$54,950 |
$63,500 |
$49,982 |
$40,286 |
$52,840 |
$59,837 |
$65,110 |
$75,240 |
$59,223 |
||||
|
Most Recent Five Years |
|||||||||||||||||
|
2014 |
45 |
$31,333 |
$44,667 |
$49,219 |
$55,400 |
$90,833 |
$50,854 |
$33,645 |
$47,962 |
$52,851 |
$59,487 |
$97,535 |
$54,606 |
||||
|
2015 |
45 |
$30,000 |
$43,850 |
$48,760 |
$52,667 |
$83,336 |
$49,860 |
$32,175 |
$47,029 |
$52,296 |
$56,485 |
$89,378 |
$53,476 |
||||
|
2016 |
45 |
$36,896 |
$46,500 |
$49,400 |
$59,583 |
$72,967 |
$52,276 |
$39,078 |
$49,250 |
$52,322 |
$63,107 |
$77,282 |
$55,367 |
||||
|
2017 |
45 |
$41,746 |
$48,833 |
$54,000 |
$60,961 |
$91,033 |
$56,951 |
$43,292 |
$50,642 |
$56,000 |
$63,219 |
$94,405 |
$59,061 |
||||
|
2018 |
45 |
$37,163 |
$50,000 |
$52,917 |
$57,500 |
$96,417 |
$55,304 |
$37,410 |
$50,332 |
$53,268 |
$57,882 |
$97,058 |
$55,672 |
||||
|
2018 Pay Distribution |
Median Pay |
Change |
|||||||||||||||
|
| 2017-2018 2014-2018 2009-2018 2004-2018 2001-2018 | -4.88% 0.79% -10.98% -9.52% -9.69% | ||||||||||||||
|
Dollars in figures are in thousands. |
|||||||||||||||||
Source: Statement of Disbursements of the House, as collated by LegiStorm, various years, and CRS calculations. Percentage change in pay is based on the change in median pay (expressed in constant, March 2019 dollars2020 dol ars) for the periods noted. In the visualizations, position pay information based on constant 2019 dollars2020 dol ars in thousands of dollars, dol ars, or change in those levels, are presented in solid green. Detailed information about data sources is available above in "“Data Tables and Visualizations.".” Data provided here are partial; complete data, 2001-20182019, are available to congressional requestersstaff upon request.
CRS-15
link to page 6
Table 12. Legislative Correspondent
Nominal, Current $
Constant, 2020, $
Year
#
Minimum
Q1
Q2, Median
Q3
Maximum Average Minimum
Q1
Q2, Median
Q3
Maximum Average
2001
31
$24,500
$27,750
$31,313
$33,167
$84,267
$33,552
$35,630
$40,357
$45,538
$48,234
$122,549
$48,795
2005
37
$26,000
$31,833
$35,250
$41,122
$60,750
$37,095
$34,288
$41,981
$46,487
$54,231
$80,116
$48,919
2010
45
$28,000
$36,750
$38,542
$42,000
$75,833
$40,366
$33,072
$43,407
$45,524
$49,608
$89,571
$47,679
Most Recent Five Years
2015
45
$25,000
$36,250
$40,000
$43,750
$77,000
$41,290
$27,167
$39,391
$43,466
$47,541
$83,673
$44,868
2016
45
$25,000
$37,000
$40,255
$43,000
$58,667
$40,713
$26,828
$39,706
$43,199
$46,144
$62,957
$43,690
2017
41
$30,729
$38,000
$41,156
$45,917
$63,000
$42,420
$32,288
$39,928
$43,244
$48,246
$66,197
$44,572
2018
45
$35,833
$42,900
$47,500
$52,125
$78,250
$48,217
$36,754
$44,002
$48,720
$53,464
$80,260
$49,456
2019
45
$35,167
$39,750
$46,467
$48,750
$69,250
$45,457
$35,428
$40,045
$46,812
$49,112
$69,765
$45,795
Median Pay
2019 Pay Distribution
Change
2018-2019
-3.92%
2015-2019
7.70%
2010-2019
2.83%
2005-2019
0.70%
2001-2019
2.80%
Dol ars in figures are in thousands.
Source: Statement of Disbursements of the House, as col ated by LegiStorm, various years, and CRS calculations. upon request.
|
Nominal, Current $ |
Constant, 2019, $ |
||||||||||||||||
|
Year |
Number |
Minimum |
Q1 |
Q2, Median |
Q3 |
Maximum |
Average |
Minimum |
Q1 |
Q2, Median |
Q3 |
Maximum |
Average |
||||
|
2001 |
31 |
$24,500 |
$27,750 |
$31,313 |
$33,167 |
$84,267 |
$33,552 |
$35,166 |
$39,831 |
$44,945 |
$47,606 |
$120,953 |
$48,160 |
||||
|
2004 |
40 |
$25,372 |
$31,933 |
$34,720 |
$39,139 |
$66,667 |
$36,524 |
$34,143 |
$42,971 |
$46,722 |
$52,669 |
$89,713 |
$49,150 |
||||
|
2009 |
45 |
$29,085 |
$35,653 |
$38,875 |
$42,689 |
$75,917 |
$41,173 |
$34,463 |
$42,245 |
$46,062 |
$50,582 |
$89,953 |
$48,785 |
||||
|
Most Recent Five Years |
|||||||||||||||||
|
2014 |
45 |
$30,000 |
$35,000 |
$40,233 |
$44,500 |
$63,000 |
$41,122 |
$32,213 |
$37,582 |
$43,202 |
$47,783 |
$67,648 |
$44,156 |
||||
|
2015 |
45 |
$25,000 |
$36,250 |
$40,000 |
$43,750 |
$77,000 |
$41,290 |
$26,813 |
$38,878 |
$42,900 |
$46,922 |
$82,583 |
$44,284 |
||||
|
2016 |
45 |
$25,000 |
$37,000 |
$40,255 |
$43,000 |
$58,667 |
$40,713 |
$26,479 |
$39,188 |
$42,636 |
$45,543 |
$62,136 |
$43,121 |
||||
|
2017 |
41 |
$30,729 |
$38,000 |
$41,156 |
$45,917 |
$63,000 |
$42,420 |
$31,867 |
$39,408 |
$42,680 |
$47,617 |
$65,333 |
$43,991 |
||||
|
2018 |
45 |
$35,833 |
$42,900 |
$47,500 |
$52,125 |
$78,250 |
$48,217 |
$36,071 |
$43,185 |
$47,816 |
$52,471 |
$78,770 |
$48,538 |
||||
|
2018 Pay Distribution |
Median Pay |
Change |
|||||||||||||||
|
| 2017-2018 2014-2018 2009-2018 2004-2018 2001-2018 | 12.03% 10.68% 3.81% 2.34% 6.39% | ||||||||||||||
|
Dollars in figures are in thousands. |
|||||||||||||||||
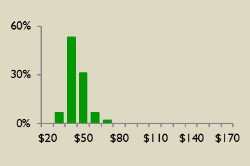
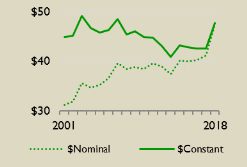
Source: Statement of Disbursements of the House, as collated by LegiStorm, various years, and CRS calculations. Percentage change in pay is based on the change in median pay (expressed in constant, March 2019 dollars2020 dol ars) for the periods noted. In the visualizations, position pay information based on constant 2019 dollars2020 dol ars in thousands of dollars, dol ars, or change in those levels, are presented in solid green. Detailed information about data sources is available above in "“Data Tables and Visualizations.".” Data provided here are partial; complete data, 2001-20182019, are available to congressional requestersstaff upon request.
CRS-16
link to page 6
Table 13. Legislative Director
Nominal, Current $
Constant, 2020, $
Year
#
Minimum
Q1
Q2, Median
Q3
Maximum Average Minimum
Q1
Q2, Median
Q3
Maximum Average
2001
45
$47,000
$60,000
$66,250
$72,458
$91,412
$66,932
$68,352
$87,258
$96,348
$105,376
$132,940
$97,339
2005
45
$58,963
$67,454
$72,068
$81,583
$133,833
$75,692
$77,758
$88,957
$95,042
$107,590
$176,496
$99,821
2010
45
$61,303
$79,800
$86,167
$95,868
$118,000
$87,717
$72,408
$94,256
$101,776
$113,235
$139,376
$103,607
Most Recent Five Years
2015
45
$55,133
$76,875
$86,500
$90,083
$132,800
$84,862
$59,911
$83,537
$93,996
$97,890
$144,309
$92,216
2016
45
$63,722
$77,000
$85,500
$94,359
$128,150
$87,306
$68,382
$82,630
$91,752
$101,259
$137,521
$93,690
2017
45
$54,000
$77,123
$88,500
$96,920
$132,167
$87,830
$56,740
$81,036
$92,990
$101,838
$138,873
$92,287
2018
45
$62,500
$82,868
$89,500
$102,500
$139,333
$93,114
$64,106
$84,996
$91,799
$105,133
$142,912
$95,505
2019
45
$70,167
$80,715
$87,000
$95,417
$127,250
$89,596
$70,688
$81,315
$87,647
$96,126
$128,196
$90,262
Median Pay
2019 Pay Distribution
Change
2018-2019
-4.52%
2015-2019
-6.76%
2010-2019
-13.88%
2005-2019
-7.78%
2001-2019
-9.03%
Dol ars in figures are in thousands.
Source: Statement of Disbursements of the House, as col ated by LegiStorm, various years, and CRS calculations. upon request.
|
Nominal, Current $ |
Constant, 2019, $ |
||||||||||||||||
|
Year |
Number |
Minimum |
Q1 |
Q2, Median |
Q3 |
Maximum |
Average |
Minimum |
Q1 |
Q2, Median |
Q3 |
Maximum |
Average |
||||
|
2001 |
45 |
$47,000 |
$60,000 |
$66,250 |
$72,458 |
$91,412 |
$66,932 |
$67,462 |
$86,122 |
$95,093 |
$104,003 |
$131,209 |
$96,071 |
||||
|
2004 |
45 |
$51,761 |
$62,667 |
$70,300 |
$78,316 |
$124,833 |
$73,294 |
$69,655 |
$84,330 |
$94,602 |
$105,389 |
$167,988 |
$98,632 |
||||
|
2009 |
45 |
$51,500 |
$77,125 |
$84,417 |
$94,750 |
$127,411 |
$85,883 |
$61,022 |
$91,384 |
$100,024 |
$112,268 |
$150,967 |
$101,761 |
||||
|
Most Recent Five Years |
|||||||||||||||||
|
2014 |
45 |
$50,417 |
$77,750 |
$84,718 |
$99,417 |
$127,000 |
$87,256 |
$54,136 |
$83,486 |
$90,968 |
$106,751 |
$136,370 |
$93,693 |
||||
|
2015 |
45 |
$55,133 |
$76,875 |
$86,500 |
$90,083 |
$132,800 |
$84,862 |
$59,131 |
$82,449 |
$92,772 |
$96,615 |
$142,429 |
$91,015 |
||||
|
2016 |
45 |
$63,722 |
$77,000 |
$85,500 |
$94,359 |
$128,150 |
$87,306 |
$67,491 |
$81,554 |
$90,557 |
$99,940 |
$135,729 |
$92,470 |
||||
|
2017 |
45 |
$54,000 |
$77,123 |
$88,500 |
$96,920 |
$132,167 |
$87,830 |
$56,000 |
$79,980 |
$91,778 |
$100,510 |
$137,062 |
$91,083 |
||||
|
2018 |
45 |
$62,500 |
$82,868 |
$89,500 |
$102,500 |
$139,333 |
$93,114 |
$62,916 |
$83,419 |
$90,095 |
$103,181 |
$140,259 |
$93,732 |
||||
|
2018 Pay Distribution |
Median Pay |
Change |
|||||||||||||||
|
| 2017-2018 2014-2018 2009-2018 2004-2018 2001-2018 | -1.83% -0.96% -9.93% -4.76% -5.26% | ||||||||||||||
|
Dollars in figures are in thousands. |
|||||||||||||||||
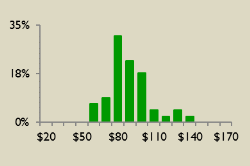
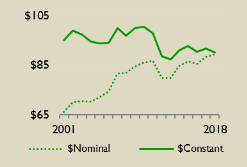
Source: Statement of Disbursements of the House, as collated by LegiStorm, various years, and CRS calculations. Percentage change in pay is based on the change in median pay (expressed in constant, March 2019 dollars2020 dol ars) for the periods noted. In the visualizations, position pay information based on constant 2019 dollars2020 dol ars in thousands of dollars, dol ars, or change in those levels, are presented in solid green. Detailed information about data sources is available above in "“Data Tables and Visualizations.".” Data provided here are partial; complete data, 2001-20182019, are available to congressional requestersstaff upon request.
CRS-17
link to page 6
Table 14. Office Manager
Nominal, Current $
Constant, 2020, $
Year
#
Minimum
Q1
Q2, Median
Q3
Maximum Average Minimum
Q1
Q2, Median
Q3
Maximum Average
2001
45
$22,949
$33,583
$46,167
$51,500
$84,750
$44,639
$33,374
$48,840
$67,140
$74,896
$123,252
$64,918
2005
40
$22,041
$36,941
$43,417
$54,062
$89,688
$47,198
$29,067
$48,717
$57,257
$71,296
$118,278
$62,244
2010
31
$32,250
$38,329
$49,000
$60,763
$88,333
$51,484
$38,092
$45,273
$57,876
$71,770
$104,335
$60,810
Most Recent Five Years
2015
23
$35,850
$43,114
$50,000
$60,684
$85,038
$51,961
$38,957
$46,851
$54,333
$65,943
$92,407
$56,464
2016
31
$31,900
$42,250
$50,000
$62,827
$84,738
$52,830
$34,233
$45,339
$53,656
$67,421
$90,934
$56,693
2017
25
$33,175
$44,167
$51,375
$66,042
$91,258
$55,366
$34,858
$46,408
$53,982
$69,392
$95,888
$58,175
2018
27
$35,833
$43,500
$50,083
$64,018
$96,821
$56,300
$36,754
$44,617
$51,370
$65,662
$99,308
$57,746
2019
21
$40,155
$43,667
$50,375
$63,000
$91,626
$55,829
$40,454
$43,991
$50,749
$63,468
$92,307
$56,244
Median Pay
2019 Pay Distribution
Change
2018-2019
-1.21%
2015-2019
-6.60%
2010-2019
-12.31%
2005-2019
-11.37%
2001-2019
-24.41%
Dol ars in figures are in thousands.
Source: Statement of Disbursements of the House, as col ated by LegiStorm, various years, and CRS calculations. upon request.
|
Nominal, Current $ |
Constant, 2019, $ |
||||||||||||||||
|
Year |
Number |
Minimum |
Q1 |
Q2, Median |
Q3 |
Maximum |
Average |
Minimum |
Q1 |
Q2, Median |
Q3 |
Maximum |
Average |
||||
|
2001 |
45 |
$22,949 |
$33,583 |
$46,167 |
$51,500 |
$84,750 |
$44,639 |
$32,939 |
$48,204 |
$66,266 |
$73,921 |
$121,647 |
$64,073 |
||||
|
2004 |
43 |
$20,024 |
$41,846 |
$51,000 |
$61,192 |
$86,650 |
$52,846 |
$26,946 |
$56,312 |
$68,630 |
$82,345 |
$116,605 |
$71,115 |
||||
|
2009 |
25 |
$29,983 |
$45,992 |
$51,818 |
$63,667 |
$106,877 |
$55,578 |
$35,527 |
$54,495 |
$61,398 |
$75,438 |
$126,637 |
$65,854 |
||||
|
Most Recent Five Years |
|||||||||||||||||
|
2014 |
27 |
$33,434 |
$40,046 |
$46,000 |
$60,404 |
$116,583 |
$52,283 |
$35,900 |
$43,001 |
$49,394 |
$64,861 |
$125,185 |
$56,141 |
||||
|
2015 |
23 |
$35,850 |
$43,114 |
$50,000 |
$60,684 |
$85,038 |
$51,961 |
$38,449 |
$46,240 |
$53,625 |
$65,084 |
$91,204 |
$55,729 |
||||
|
2016 |
31 |
$31,900 |
$42,250 |
$50,000 |
$62,827 |
$84,738 |
$52,830 |
$33,787 |
$44,749 |
$52,957 |
$66,543 |
$89,750 |
$55,955 |
||||
|
2017 |
25 |
$33,175 |
$44,167 |
$51,375 |
$66,042 |
$91,258 |
$55,366 |
$34,404 |
$45,803 |
$53,278 |
$68,488 |
$94,638 |
$57,416 |
||||
|
2018 |
27 |
$35,833 |
$43,500 |
$50,083 |
$64,018 |
$96,821 |
$56,300 |
$36,072 |
$43,789 |
$50,416 |
$64,443 |
$97,464 |
$56,674 |
||||
|
2018 Pay Distribution |
Median Pay |
Change |
|||||||||||||||
|
| 2017-2018 2014-2018 2009-2018 2004-2018 2001-2018 | -5.37% 2.07% -17.89% -26.54% -23.92% | ||||||||||||||
|
Dollars in figures are in thousands. |
|||||||||||||||||
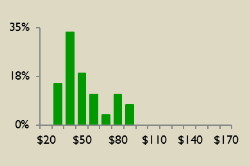
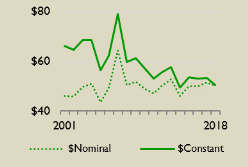
Source: Statement of Disbursements of the House, as collated by LegiStorm, various years, and CRS calculations. Percentage change in pay is based on the change in median pay (expressed in constant, March 2019 dollars2020 dol ars) for the periods noted. In the visualizations, position pay information based on constant 2019 dollars2020 dol ars in thousands of dollars, dol ars, or change in those levels, are presented in solid green. Detailed information about data sources is available above in "“Data Tables and Visualizations.".” Data provided here are partial; complete data, 2001-2012, and 2014-2018 (no data are available for 2013) data, 2001-2019, are available to congressional requestersstaff upon request.
CRS-18
link to page 6
Table 15. Press Secretary
Nominal, Current $
Constant, 2020, $
Year
#
Minimum
Q1
Q2, Median
Q3
Maximum Average Minimum
Q1
Q2, Median
Q3
Maximum Average
2001
45
$29,000
$45,167
$50,000
$57,250
$85,913
$52,726
$42,175
$65,686
$72,715
$83,259
$124,943
$76,679
2005
45
$30,722
$50,000
$57,708
$68,000
$101,000
$61,521
$40,516
$65,939
$76,104
$89,677
$133,196
$81,133
2010
45
$40,361
$52,000
$61,953
$72,699
$109,200
$65,657
$47,673
$61,420
$73,176
$85,868
$128,982
$77,551
Most Recent Five Years
2015
28
$40,500
$51,500
$57,875
$68,117
$116,458
$63,689
$44,010
$55,963
$62,891
$74,020
$126,551
$69,208
2016
44
$36,898
$52,390
$61,658
$69,625
$121,213
$62,365
$39,596
$56,221
$66,167
$74,716
$130,077
$66,925
2017
22
$42,000
$53,558
$60,542
$70,244
$90,333
$62,869
$44,131
$56,276
$63,613
$73,808
$94,917
$66,059
2018
21
$40,000
$55,667
$61,000
$70,800
$93,000
$63,188
$41,027
$57,097
$62,567
$72,619
$95,389
$64,811
2019
18
$41,500
$50,181
$58,280
$66,745
$98,333
$62,515
$41,808
$50,553
$58,713
$67,241
$99,064
$62,980
Median Pay
2019 Pay Distribution
Change
2018-2019
-6.16%
2015-2019
-6.64%
2010-2019
-19.76%
2005-2019
-22.85%
2001-2019
-19.26%
Dol ars in figures are in thousands.
Source: Statement of Disbursements of the House, as col ated by LegiStorm, various years, and CRS calculations. upon request.
|
Nominal, Current $ |
Constant, 2019, $ |
||||||||||||||||
|
Year |
Number |
Minimum |
Q1 |
Q2, Median |
Q3 |
Maximum |
Average |
Minimum |
Q1 |
Q2, Median |
Q3 |
Maximum |
Average |
||||
|
2001 |
45 |
$29,000 |
$45,167 |
$50,000 |
$57,250 |
$85,913 |
$52,726 |
$41,625 |
$64,830 |
$71,768 |
$82,174 |
$123,316 |
$75,680 |
||||
|
2004 |
45 |
$32,378 |
$45,653 |
$54,000 |
$66,390 |
$93,500 |
$56,927 |
$43,571 |
$61,435 |
$72,668 |
$89,341 |
$125,823 |
$76,606 |
||||
|
2009 |
41 |
$36,000 |
$55,750 |
$62,208 |
$77,300 |
$117,400 |
$65,998 |
$42,656 |
$66,057 |
$73,710 |
$91,592 |
$139,106 |
$78,200 |
||||
|
Most Recent Five Years |
|||||||||||||||||
|
2014 |
28 |
$43,500 |
$53,458 |
$60,464 |
$68,196 |
$124,233 |
$63,049 |
$46,709 |
$57,402 |
$64,925 |
$73,227 |
$133,399 |
$67,700 |
||||
|
2015 |
28 |
$40,500 |
$51,500 |
$57,875 |
$68,117 |
$116,458 |
$63,689 |
$43,436 |
$55,234 |
$62,072 |
$73,056 |
$124,902 |
$68,307 |
||||
|
2016 |
44 |
$36,898 |
$52,390 |
$61,658 |
$69,625 |
$121,213 |
$62,365 |
$39,080 |
$55,489 |
$65,305 |
$73,743 |
$128,382 |
$66,054 |
||||
|
2017 |
22 |
$42,000 |
$53,558 |
$60,542 |
$70,244 |
$90,333 |
$62,869 |
$43,556 |
$55,542 |
$62,784 |
$72,845 |
$93,679 |
$65,198 |
||||
|
2018 |
21 |
$40,000 |
$55,667 |
$61,000 |
$70,800 |
$93,000 |
$63,188 |
$40,266 |
$56,037 |
$61,405 |
$71,271 |
$93,618 |
$63,608 |
||||
|
2018 Pay Distribution |
Median Pay |
Change |
|||||||||||||||
|
| 2017-2018 2014-2018 2009-2018 2004-2018 2001-2018 | -2.20% -5.42% -16.69% -15.50% -14.44% | ||||||||||||||
|
Dollars in figures are in thousands. |
|||||||||||||||||
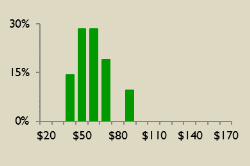
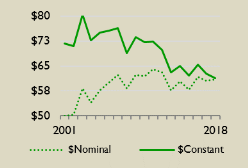
Source: Statement of Disbursements of the House, as collated by LegiStorm, various years, and CRS calculations. Percentage change in pay is based on the change in median pay (expressed in constant, March 2019 dollars2020 dol ars) for the periods noted. In the visualizations, position pay information based on constant 2019 dollars2020 dol ars in thousands of dollars, dol ars, or change in those levels, are presented in solid green. Detailed information about data sources is available above in "“Data Tables and Visualizations.".” Data provided here are partial; complete data, 2001-20182019, are available to congressional requestersstaff upon request.
CRS-19
link to page 6
Table 16. Scheduler
Nominal, Current $
Constant, 2020, $
Year
#
Minimum
Q1
Q2, Median
Q3
Maximum Average Minimum
Q1
Q2, Median
Q3
Maximum Average
2001
19
$34,117
$37,125
$42,286
$45,066
$57,000
$42,699
$49,616
$53,991
$61,496
$65,540
$82,895
$62,097
2005
37
$28,625
$38,000
$44,090
$49,250
$69,250
$44,975
$37,750
$50,113
$58,145
$64,950
$91,325
$59,312
2010
41
$31,547
$39,750
$47,000
$61,250
$110,750
$51,968
$37,261
$46,951
$55,514
$72,345
$130,812
$61,382
Most Recent Five Years
2015
45
$33,000
$42,917
$47,917
$58,333
$96,418
$51,932
$35,860
$46,636
$52,069
$63,389
$104,773
$56,432
2016
45
$35,000
$44,940
$51,202
$56,604
$92,500
$52,758
$37,559
$48,226
$54,946
$60,743
$99,264
$56,616
2017
45
$37,000
$46,965
$50,500
$57,444
$84,000
$53,683
$38,877
$49,348
$53,062
$60,359
$88,262
$56,407
2018
45
$36,259
$44,000
$50,500
$58,500
$98,000
$53,571
$37,190
$45,130
$51,797
$60,003
$100,517
$54,947
2019
45
$35,833
$46,417
$55,000
$61,750
$107,000
$56,270
$36,099
$46,762
$55,409
$62,209
$107,795
$56,689
Median Pay
2019 Pay Distribution
Change
2018-2019
6.97%
2015-2019
6.41%
2010-2019
-0.19%
2005-2019
-4.71%
2001-2019
-9.90%
Dol ars in figures are in thousands.
Source: Statement of Disbursements of the House, as col ated by LegiStorm, various years, and CRS calculations. upon request.
|
Nominal, Current $ |
Constant, 2019, $ |
||||||||||||||||
|
Year |
Number |
Minimum |
Q1 |
Q2, Median |
Q3 |
Maximum |
Average |
Minimum |
Q1 |
Q2, Median |
Q3 |
Maximum |
Average |
||||
|
2001 |
19 |
$34,117 |
$37,125 |
$42,286 |
$45,066 |
$57,000 |
$42,699 |
$48,970 |
$53,288 |
$60,695 |
$64,686 |
$81,815 |
$61,288 |
||||
|
2004 |
25 |
$30,625 |
$42,750 |
$45,100 |
$54,000 |
$104,367 |
$50,838 |
$41,212 |
$57,528 |
$60,691 |
$72,668 |
$140,446 |
$68,412 |
||||
|
2009 |
41 |
$32,000 |
$42,981 |
$52,450 |
$57,098 |
$93,000 |
$52,879 |
$37,916 |
$50,927 |
$62,147 |
$67,655 |
$110,194 |
$62,655 |
||||
|
Most Recent Five Years |
|||||||||||||||||
|
2014 |
45 |
$29,667 |
$42,583 |
$50,000 |
$62,167 |
$96,950 |
$53,342 |
$31,855 |
$45,725 |
$53,689 |
$66,753 |
$104,103 |
$57,277 |
||||
|
2015 |
45 |
$33,000 |
$42,917 |
$47,917 |
$58,333 |
$96,418 |
$51,932 |
$35,393 |
$46,028 |
$51,391 |
$62,563 |
$103,408 |
$55,697 |
||||
|
2016 |
45 |
$35,000 |
$44,940 |
$51,202 |
$56,604 |
$92,500 |
$52,758 |
$37,070 |
$47,598 |
$54,231 |
$59,952 |
$97,971 |
$55,879 |
||||
|
2017 |
45 |
$37,000 |
$46,965 |
$50,500 |
$57,444 |
$84,000 |
$53,683 |
$38,370 |
$48,705 |
$52,370 |
$59,572 |
$87,111 |
$55,671 |
||||
|
2018 |
45 |
$36,259 |
$44,000 |
$50,500 |
$58,500 |
$98,000 |
$53,571 |
$36,500 |
$44,292 |
$50,836 |
$58,889 |
$98,651 |
$53,927 |
||||
|
2018 Pay Distribution |
Median Pay |
Change |
|||||||||||||||
|
| 2017-2018 2014-2018 2009-2018 2004-2018 2001-2018 | -2.93% -5.31% -18.20% -16.24% -16.24% | ||||||||||||||
|
Dollars in figures are in thousands. |
|||||||||||||||||
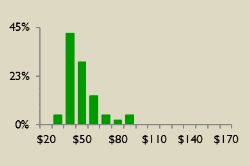
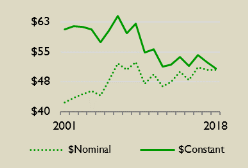
Source: Statement of Disbursements of the House, as collated by LegiStorm, various years, and CRS calculations. Percentage change in pay is based on the change in median pay (expressed in constant, March 2019 dollars2020 dol ars) for the periods noted. In the visualizations, position pay information based on constant 2019 dollars2020 dol ars in thousands of dollars, dol ars, or change in those levels, are presented in solid green. Detailed information about data sources is available above in "“Data Tables and Visualizations.".” Data provided here are partial; complete data, 2001-20182019, are available to congressional requestersstaff upon request.
CRS-20
link to page 6
Table 17. Senior Legislative Assistant, 2018-2019
Nominal, Current $
Constant, 2020, $
Year
#
Minimum
Q1
Q2, Median
Q3
Maximum Average Minimum
Q1
Q2, Median
Q3
Maximum Average
2018
31
$50,733
$59,867
$65,083
$69,167
$81,961
$65,070
$52,037
$61,404
$66,755
$70,943
$84,066
$66,742
2019
44
$20,185
$55,037
$64,625
$71,021
$99,250
$63,667
$20,335
$55,446
$65,105
$71,549
$99,988
$64,140
2019 Pay Distribution
Change
2018-2019
-2.47%
Dol ars in figures are in thousands.
Source: Statement of Disbursements of the House, as col ated by LegiStorm, various years, and CRS calculations. Percentage change in pay is based on the change in median pay (expressed in constant, 2020 dol ars) for the periods noted. In the visualization, position pay information based on constant 2020 dol ars in thousands of dol ars, or change in those levels, are presented in solid green. Detailed information about data sources is available above in “Data Tables and Visualizations.” Data provided here are partial; complete data, 2018-2019, are available to congressional staff upon request.
CRS-21
link to page 6
Table 18. Staff Assistant
Nominal, Current $
Constant, 2020, $
Year
#
Minimum
Q1
Q2, Median
Q3
Maximum Average Minimum
Q1
Q2, Median
Q3
Maximum Average
2001
45
$21,667
$28,750
$31,000
$35,166
$79,516
$33,302
$31,510
$41,811
$45,083
$51,142
$115,640
$48,431
2005
45
$22,000
$30,000
$34,375
$42,500
$105,950
$38,296
$29,013
$39,563
$45,333
$56,048
$139,724
$50,504
2010
45
$25,000
$33,633
$39,750
$47,689
$93,750
$42,084
$29,529
$39,726
$46,951
$56,328
$110,733
$49,708
Most Recent Five Years
2015
45
$25,950
$32,000
$34,857
$39,967
$69,500
$37,958
$28,199
$34,773
$37,878
$43,430
$75,523
$41,248
2016
45
$19,000
$30,000
$33,413
$38,139
$64,183
$34,941
$20,389
$32,194
$35,856
$40,928
$68,877
$37,496
2017
45
$21,000
$33,250
$37,083
$43,251
$54,750
$38,071
$22,066
$34,937
$38,965
$45,445
$57,528
$40,003
2018
45
$31,000
$36,767
$41,025
$45,989
$58,754
$42,303
$31,797
$37,711
$42,079
$47,170
$60,263
$43,390
2019
45
$29,000
$34,849
$39,130
$46,994
$67,333
$41,961
$29,215
$35,108
$39,421
$47,343
$67,834
$42,272
Median Pay
2019 Pay Distribution
Change
2018-2019
-6.32%
2015-2019
4.07%
2010-2019
-16.04%
2005-2019
-13.04%
2001-2019
-12.56%
Dol ars in figures are in thousands.
Source: Statement of Disbursements of the House, as col ated by LegiStorm, various years, and CRS calculations. upon request.
|
Nominal, Current $ |
Constant, 2019, $ |
||||||||||||||||
|
Year |
Number |
Minimum |
Q1 |
Q2, Median |
Q3 |
Maximum |
Average |
Minimum |
Q1 |
Q2, Median |
Q3 |
Maximum |
Average |
||||
|
2001 |
45 |
$21,667 |
$28,750 |
$31,000 |
$35,166 |
$79,516 |
$33,302 |
$31,099 |
$41,267 |
$44,496 |
$50,476 |
$114,134 |
$47,800 |
||||
|
2004 |
45 |
$21,200 |
$30,499 |
$36,227 |
$41,178 |
$52,750 |
$35,866 |
$28,529 |
$41,042 |
$48,750 |
$55,413 |
$70,986 |
$48,264 |
||||
|
2009 |
45 |
$20,175 |
$30,333 |
$37,504 |
$43,583 |
$67,333 |
$37,829 |
$23,905 |
$35,942 |
$44,438 |
$51,641 |
$79,782 |
$44,824 |
||||
|
Most Recent Five Years |
|||||||||||||||||
|
2014 |
45 |
$21,067 |
$31,500 |
$36,250 |
$40,020 |
$88,058 |
$37,176 |
$22,621 |
$33,824 |
$38,924 |
$42,973 |
$94,555 |
$39,918 |
||||
|
2015 |
45 |
$25,950 |
$32,000 |
$34,857 |
$39,967 |
$69,500 |
$37,958 |
$27,831 |
$34,320 |
$37,384 |
$42,864 |
$74,539 |
$40,710 |
||||
|
2016 |
45 |
$19,000 |
$30,000 |
$33,413 |
$38,139 |
$64,183 |
$34,941 |
$20,124 |
$31,774 |
$35,389 |
$40,395 |
$67,979 |
$37,008 |
||||
|
2017 |
45 |
$21,000 |
$33,250 |
$37,083 |
$43,251 |
$54,750 |
$38,071 |
$21,778 |
$34,482 |
$38,457 |
$44,853 |
$56,778 |
$39,481 |
||||
|
2018 |
45 |
$31,000 |
$36,767 |
$41,025 |
$45,989 |
$58,754 |
$42,303 |
$31,206 |
$37,011 |
$41,298 |
$46,295 |
$59,145 |
$42,585 |
||||
|
2018 Pay Distribution |
Median Pay |
Change |
|||||||||||||||
|
| 2017-2018 2014-2018 2009-2018 2004-2018 2001-2018 | 7.39% 6.10% -7.07% -15.29% -7.19% | ||||||||||||||
|
Dollars in figures are in thousands. |
|||||||||||||||||
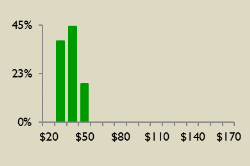
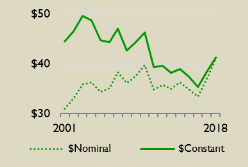
Source: Statement of Disbursements of the House, as collated by LegiStorm, various years, and CRS calculations. Percentage change in pay is based on the change in median pay (expressed in constant, March 2019 dollars2020 dol ars) for the periods noted. In the visualizations, position pay information based on constant 2019 dollars2020 dol ars in thousands of dollars, dol ars, or change in those levels, are presented in solid green. Detailed information about data sources is available above in "“Data Tables and Visualizations.".” Data provided here are partial; complete data, 2001-20182019, are available to congressional requestersstaff upon request.
CRS-22
Staff Pay Levels for Selected Positions in House Member Offices, 2001-2019
Author Information
R. Eric Petersen
upon request.
Author Contact Information
Acknowledgments
In addition to the listed authors, a number of CRS staff made substantial contributions to this report. Sandra L. Edwards, User Support Specialist, and Michael M. McCarthy, Editor, provided formatting and editorial Specialist in American National Government
Acknowledgments
A number of CRS staff made substantial contributions to this report. William T. Egar, former Analyst in American National Government, provided technical and editorial assistance. Jonathan P Kardashian, User Support Specialist, and Andrew M. Schaefer, Editor, provided formatting, editorial, and production support. Amber Hope Wilhelm, Visual Information Specialist, originally created the visualizations.
Previous versions of the report were supported by the following: Raymond T. Williams and Lara Chausow, former Research Assistant, was a coauthor of this reportAssistants, were coauthors and collected some of the data provided. Casey Burgat, former Research Assistant, provided update support. Sandra L. Edwards, User Support Specialist, and Michael M. McCarthy, Editor, Claudia Guidi, formerly a User Support Specialist, and Alex Marine, former Publications Editor, provided formatting, editorial, and production and editorial support. Jacobo Licona, Brian Hamel, Joe Wisniewski, and Claire Laurence, former CRS interns, collected data for this report.
Disclaimer
This document was prepared by the Congressional Research Service (CRS). CRS serves as nonpartisan shared staff to congressional committees and Members of Congress. It operates solely at the behest of and under the direction of Congress. Information in a CRS Report should n ot be relied upon for purposes other than public understanding of information that has been provided by CRS to Members of Congress in connection with CRS’s institutional role. CRS Reports, as a work of the United States Government, are not subject to copyright protection in the United States. Any CRS Report may be reproduced and distributed in its entirety without permission from CRS. However, as a CRS Report may include copyrighted images or material from a third party, you may need to obtain the permission of the copyright holder if you wish to copy or otherwise use copyrighted material.
Congressional Research Service
R44323 · VERSION 10 · UPDATED
23 Claire Laurence, former CRS interns, collected data for this report.
Footnotes
| 1. |
|
| 2. |
For discussion of resources available to Members to carry out their official duties, see CRS Report RL30064, Congressional Salaries and Allowances: In Brief, by Ida A. Brudnick. |
| 3. |
ICF International, 2010 House Compensation Study: Guide for the 112th Congress, prepared for the Chief Administrative Officer, House of Representatives (Washington: 2010). |
| 4. |
In this report, pay refers to monies paid by the House to staff, and excludes other components of total compensation, which might include paid leave or employer contributions to various insurance and retirement benefits. |
| 5. |
|
| 6. |
|
| 7. |
For a discussion of staff roles in Members' offices, see CRS Report RL34545, Congressional Staff: Duties and Functions of Selected Positions, by R. Eric Petersen. |
| 8. |
Other job titles which may indicate similar duties, and for which pay data were collected for this category, include Federal Caseworker. |
| 9. |
Data for offices that employed Counsels are available 2010-2018. |
| 10. |
Obtaining the salaries of every congressional staff member listed in the SOD was beyond the capacity of available resources. Each year, a different, random sample of Members' offices was taken for each position. The large random sample of offices employing staff in each position means that a full accounting would be unlikely to yield significantly different results. At the same time, a study that examines pay data based on different job titles, or which combines pay data from positions of similar titles or duties (e.g., legislative assistant and senior legislative assistant, or executive assistants, schedulers, and executive assistant/schedulers), or estimates of pay using different data collection criteria, could result in findings that are different from those provided here. |
| 11. |
The numbers of staff for which data were counted are identified as observations in the data tables. |
| 12. |
For each year, the SOD reports pay data for five time periods: January 1 and 2; January 3-March 31; April 1-June 30; July 1-September 30; and October 1-December 31. The aggregate pay of those five periods equals the annual pay of a congressional staff member. The brief reporting period accommodates accounting of the Member Representational Allowance (MRA), which authorizes expenditures from January 3 to January 2 of the following year. For a discussion of MRA usage, see CRS Report R40962, Members' Representational Allowance: History and Usage, by Ida A. Brudnick. Other forms of payment do not appear to be recorded in a consistent manner. Sometimes overtime and other pay is listed as separate entries and in other instances, significant one-time changes in a quarterly total may suggest payments in addition to regular salary. |
| 13. |
Staff of all Members who serve an entire calendar year may be included in the data. For information on the number of first-term Members in each Congress, see CRS Report R41283, First-Term Members of the House of Representatives and Senate, 64th-114th Congresses, by Jennifer E. Manning and R. Eric Petersen. |
| 14. |
Some offices reported pay data that excluded the January 1 and 2 period, or included those days in reports including the period from October 1 of the previous year. |
| 15. |
U.S. Department of Labor, Bureau of Labor Statistics, Consumer Price Index, at http://www.bls.gov/cpi/tables.htm. |
| 16. |
Member pay data are taken from CRS Report 97-1011, Salaries of Members of Congress: Recent Actions and Historical Tables, by Ida A. Brudnick. |
| 17. |
General Schedule pay change is based on changes in pay levels, and not the pay of individuals. General Schedule pay tables are available at https://www.opm.gov/policy-data-oversight/pay-leave/salaries-wages/2019/general-schedule/. For a complete description of areas covered under the Washington-Baltimore-Northern Virginia, DC-MD-VA-WV-PA locality pay table, see https://www.opm.gov/policy-data-oversight/pay-leave/salaries-wages/2019/locality-pay-area-definitions/#DC. For areas covered by the RUS, see https://www.opm.gov/policy-data-oversight/pay-leave/salaries-wages/2019/locality-pay-area-definitions/#US. |