Maintaining Electric Reliability with Wind and Solar Sources: Background and Issues for Congress
Changes from June 10, 2019 to August 4, 2022
This page shows textual changes in the document between the two versions indicated in the dates above. Textual matter removed in the later version is indicated with red strikethrough and textual matter added in the later version is indicated with blue.
Contents
- Introduction
- Electric Power Sector Overview
- What Is Electric Reliability?
- Changing Electricity Generation Profile
- Balancing Variable Renewable Energy
- Federal Government Activities Affecting Reliability and Balancing
- Potential Issues for Congress
Figures
- Figure 1. Simplified Schematic of Electric Power Sector Systems
- Figure 2. Map of Regional Transmission Organizations (RTOs)
- Figure 3. Generation Patterns for U.S. Wind and Solar Sources
- Figure 4. Annual Net U.S. Electricity Generation by Source, 2008-2018
- Figure A-1. Power System Reliability Timescales
- Figure A-2. NERC Regional Entities
Summary
Reliability with Wind and
August 4, 2022
Solar Sources: Background and Issues for
Ashley J. Lawson
Congress
Analyst in Energy Policy
The share of wind and solar power in the U.S. electricity mix grew from 1% in 2008 to 813% in 20182021. Wind and solar are variable renewable energy (VRE) sources. Unlike conventional
sources, weather variability creates uncertainty about the availability of VRE sources. This uncertainty could potentially result in a lack of reliability.
Some Members of Congress have expressed concerns about the reliability of the electric power system given recent growth in generation from wind and solar sources and projections that growth will continue. According to official metrics, electric reliability was generally stable or improving over the 2013-2017 period. In other words, generationGeneration from wind and solar sources does not appear to be causing widespread electric reliability issues at the national level over this period, though some solar generators have exacerbated regional events in some cases. Questions remain, however, about maintaining reliability if generation from wind and solar should increase above current projections, as some Members of Congress have supported. Entities in the electric power sector and their regulators are evaluating changes to their approaches to reliability to prepare for this possibility. Congress might seek clarification onexplore whether new or modified approaches are required.
Under the current regulatory framework, the federal government oversees reliability for the generation and transmission systems of the electric power sector. These components comprise the bulk power system and include large-scale wind and solar sources. The Energy Policy Act of 2005 (EPACT05; P.L. 109-58) authorized the Federal Energy Regulatory Commission (FERC) and its certified electric reliability organization, the North American Electric Reliability Corporation (NERC), to develop and enforce mandatory reliability standards for the bulk power system. Small-scale wind and solar sources, such as rooftop solar photovoltaic (PV) panels, are connected to the distribution system which is localized and under state jurisdiction. Federal mandatory reliability standards do not apply to the distribution system.
The
A colloquial definition of reliability is "“having power when it is needed,"” but regulators and operators of power system components require a more precise statement of objectives and metrics. FERC and NERC have developed numerous technical standards to address reliability. These standards apply over the range of timescales over which reliability is measured, from milliseconds to years. FERC has approved approximately 100 reliability standards to date, and new standards are developed as needed to respond to changing conditions, including increasing generation from wind and solar sources. Multiple entities spanning multiple jurisdictions work together to maintain electric reliability.
For economic reasons, wind and solar sources tend to be utilized to the maximum extent possible. When their availability changes, which can happen quickly, other sources must quickly respond to maintain reliability. Typically, other sources respond by increasing or decreasing their output, an operation known as balancing. Multiple types of electricity sources are used to balance wind and solar, including some fossil fuel-fired generators, some nuclear generators, other wind and solar renewable energy sources (provided sufficient transmission availability), energy storage, and demand response. Each of these has benefits and limitations. In the Infrastructure Investment and Jobs Act (IIJA; P.L. 117-58), Congress provided some support to electric transmission infrastructure and certain energy sources, both of which could potentially promote electricity reliability. At the time of publication of this report, implementation of these provisions is in the early stages, and any eventual impact of IIJA on reliability is unknown.
limitations. Some sources and system operations that currently support balancing have received federal financial support in the past, such as tax credits, grants to states or other entities, and Department of Energy research programs. Congress might consider continuing or expanding such support, if lawmakers believed current activities affecting reliability were insufficient.
Beyond developing and enforcing reliability standards, other federal government activities affect electric reliability. For example, FERC'’s regulation of interstate electricity transmission can be a key determinant of how effectively different electricity sources can meet demand. FERC'’s regulation of the wholesale electricity markets that operate in some regions of the country may alsoalso may affect reliability, because market rules can influence which individual generators are used for system balancing. Market prices directly affect project revenues, influencing the kinds of sources that are developed. Additionally, some projects and programs Congress funds support reliability by enabling technology development and providing financial support for projects that support reliability.
Introduction
Economic factors, new technologies, environmental concerns and associated regulatory policies, and other developments Congress also conducts oversight into electricity reliability, including power outages caused by extreme weather, such as those affecting parts of Texas and other states in February 2021.
Congressional Research Service
link to page 4 link to page 5 link to page 7 link to page 10 link to page 12 link to page 15 link to page 17 link to page 18 link to page 5 link to page 6 link to page 10 link to page 11 link to page 21 link to page 24 link to page 23 link to page 21 link to page 25 Maintaining Electric Reliability with Wind and Solar Sources
Contents
Introduction ..................................................................................................................................... 1 Electric Power Sector Overview ..................................................................................................... 2 What Is Electric Reliability? ........................................................................................................... 4 Changing Electricity Generation Profile ......................................................................................... 7 Balancing Variable Renewable Energy ........................................................................................... 9 Federal Government Activities Affecting Reliability and Balancing ............................................ 12
The Infrastructure Investment and Jobs Act (P.L. 117-58) ...................................................... 14
Potential Issues for Congress......................................................................................................... 15
Figures Figure 1. Simplified Schematic of Electric Power Sector Systems ................................................. 2 Figure 2. Map of Regional Transmission Organizations (RTOs) .................................................... 3 Figure 3. Generation Patterns for U.S. Wind and Solar Sources ..................................................... 7 Figure 4. Annual Net U.S. Electricity Generation by Source, 2008-2021 ....................................... 8
Figure A-1. Power System Reliability Timescales ........................................................................ 18 Figure A-2. NERC Regional Entities ............................................................................................ 21
Tables
Table A-1. Selected Entities Involved in Power System Reliability ............................................. 20
Appendixes Appendix. Key Reliability Concepts for Policymakers ................................................................. 18
Contacts Author Information ........................................................................................................................ 22
Congressional Research Service
Maintaining Electric Reliability with Wind and Solar Sources
Introduction Economic factors, new technologies, aging of power plants, climate change concerns and associated regulatory policies, among other developments, are changing the energy sources used to generate electricity in the United States. One notable change is increased generation from variable renewable energy (VRE) sources such as wind and solar. According to the U.S. Energy Information Administration (EIA), combined generation from wind and solar sources increased from 1% of total electricity generation in 2008 to 913% of total electricity generation in 2018.1 These sources have2021.1 These sources typically have time of day and weather-dependent availability, meaning that changing weather patterns can change available electricity supply from those sources. In contrast, conventional “base load” sources for electricity generation, such as coal, natural gas, or nuclear energy, are usually available under normal weather conditions.2 Power system operators have adjusted existing reliability standards and planning practices to accommodate weather-dependent wind and solar sources. Further adjustments are being discussed by regulators and market participants as generation from wind and solar sources continue to grow.
Congress required the setting and enforcement of electric reliability standards in the Energy Policy Act of 2005 (EPACT05; P.L. 109-58).2).3 These standards are developed by the North American Electric Reliability Corporation (NERC) and approved by the Federal Energy Regulatory Commission (FERC) in the United States.34 These mandatory standards apply to the bulk power system, which is comprised mostly of large-scale generators and electricity transmission systems. Small-scaleDistributed generators (e.g., rooftop solar electricity generation), publicly owned utilities, and local electricity distribution systems are generally under the jurisdiction of state public utility regulatory commissions (PUCs).
To date, generation from wind and solar sources does not appear to be causing widespread electric reliability issues at the national level. NERC's 2018 annual report on reliability showed that, of the 13 metrics it uses to assess reliability, 9 were stable or improving over the 2013-2017 period and 4 showed trends that were, at least partly, inconclusive. Of the four metrics with inconclusive trends, three improved over this period for a subset of bulk power system components.4 Data from NERC also indicate that reliability performance is currently stable in regions such as the Midwest and California where the shares of generation from wind and solar sources are above the national average. Questions remain about how higher levels of generation from wind and solar sources might impact electric reliability moving forward.
, though the devices handling the form of electric current typically produced by solar generators exacerbated regional events in some cases.5 Questions remain about how anticipated higher levels of generation from wind and solar sources might affect electric reliability moving forward.
1 CRS analysis of data from U.S. Energy Information Administration (EIA), “Electricity Data Browser,” accessed May 19, 2022, https://www.eia.gov/electricity/data/browser/. EIA began collecting data on generation from small-scale solar photovoltaic (PV) sources in 2014. The statistic reported for 2021 includes both large-scale and small-scale solar sources. Typically, small-scale solar PV sources are connected to the distribution system, not the bulk power system.
2 EIA defines a base load plant as one “usually housing high-efficiency steam-electric units, which is normally operated to take all or part of the minimum load [demand] of a system, and which consequently produces electricity at an essentially constant rate and runs continuously.” EIA, “Glossary,” accessed July 25, 2022. Some renewable energy sources, such as hydropower and geothermal energy, can power base load plants. Pairing variable renewable energy (VRE) sources with sufficient energy storage might allow the resulting hybrid systems to behave like base load plants.
3 16 U.S.C. §824o. 4 Due to the integrated nature of the bulk power system, the North American Electric Reliability Corporation (NERC) oversees electric reliability for parts of Canada and Mexico as well. The electric industry originally established NERC’s predecessor, the National Electric Reliability Council, in 1968 to coordinate voluntarily reliability efforts. Alaska and Hawaii are exempt from NERC’s jurisdiction. 5 For example, during events in California in 2016 and 2021 and separate events in Texas in 2021, some solar generators went offline when grid disturbances occurred. The loss of electricity from these generators exacerbated the underlying event, “causing a minor system disturbance to become a major disturbance.” NERC 2022 Summer Reliability Assessment, May 2022, p. 6. Regulators have attributed this behavior to the way inverters—electronic devices that convert the form of electricity generated by solar photovoltaics into the form used throughout the electricity system—are programmed to operate. Industry participants and their regulators continue work to address the issue.
Congressional Research Service
1
link to page 5
Maintaining Electric Reliability with Wind and Solar Sources
This report provides background on reliability planning in the United States with an emphasis on the effects of daily and seasonal variability in wind and solar sources on the bulk power system. Members of Congress might consider how reliability could be impacted if generation from wind and solar sources increases, as many analysts expect. Other reliability concerns, such as cyber and physical security, small-scale generatorsextreme weather events, distributed generation, and local distribution networks, may be of interest to Congress but are not discussed at length in this report.
Electric Power Sector Overview
As shown inin Figure 1, the provision of the electric power sector consists primarily of three systems. The generation system consists of power plants that generate electricity. The transmission system generally consists of high voltage transmission lines that move power across long distances. The distribution systems make final delivery of electricity to homes and businesses. This report will refer to the combined generation and transmission systems as the bulk power system, following the definition Congress established in EPACT05:
The term "bulk-power system" means—(a) facilities and control systems necessary for
The term “bulk-power system” means—(a) facilities and control systems necessary for operating an interconnected electric energy transmission network (or any portion thereof); and
(b) electric energy from generation facilities needed to maintain transmission and
(b) electric energy from generation facilities needed to maintain transmission system reliability.
The term does not include facilities used in the local distribution of electric energy.5
6 Notably, the discussion in this report generally excludes distributed energy resources such as rooftop solar electricity generation. These resources might pose separate reliability challenges that Congress might choose to consider.
Figure 1. Simplified Schematic of Electric Power Sector Systems |
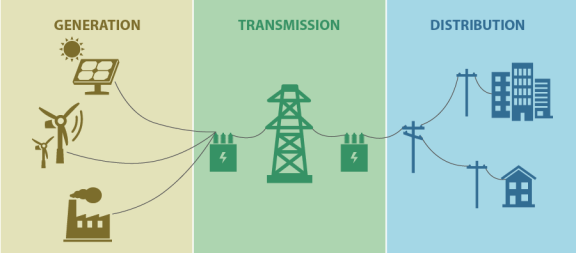 |
Source: CRS, adapted from U.S.-Canada Power System Outage Task Force, Final Report on the August 14, 2003, Blackout in the United States and Canada: Causes and Recommendations, April 2004, p. 5, https://www.energy.gov/sites/prod/files/oeprod/DocumentsandMedia/BlackoutFinal-Web.pdf . Note: Not all types of components in each system are shown. |
6 16 U.S.C. §824o
Congressional Research Service
2
link to page 6 link to page 21
Maintaining Electric Reliability with Wind and Solar Sources
Ownership structures for bulk power system components vary across the country. In some regions, shown in Figure 2, competitive markets exist for wholesale electric power, and regional transmission organizations (RTOs) and independent system operators (ISOs) manage the generation and transmission components of the power system.6 In RTO regions generally underwent “restructuring” of their electric utility companies. The utility companies created separate, competitive companies for each power plant, with transmission remaining owned by the utility company but managed by the RTO. Separate distribution companies were formed to sell power to retail customers.7 Thus, in RTO regions, electricity generators compete to sell power to distribution utilities. The RTO manages an auction process to select the sources for generation producing the electric power that distribution utilities resell to end-use customers. The RTO is alsoalso is responsible for managing the transmission system and overseeing reliability within its boundaries. In RTO regions, market signals primarily determine new power plant investment decisions. Some RTOs operate separate auction processes specifically for essential reliability services.78 According to FERC, two-thirds of U.S. electricity demand comes from RTO regions.8
9 Figure 2. Map of Regional Transmission Organizations (RTOs) |
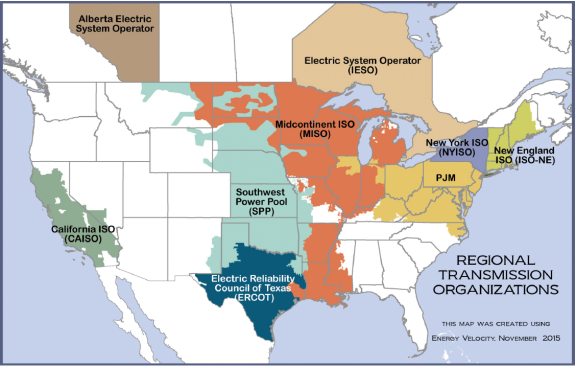 |
Source: FERC, “RTOs and ISOs,” https://www.ferc.gov/power-sales-and-markets/rtos-and-isos. Notes: RTOs manage almost two-thirds of U.S. electricity generation, including day-to-day reliability responsibilities. In non-RTO regions, shown as white in this map, vertically-integrated utilities, municipal utilities, or electric co-operatives have these functions. ISO = Independent System Operator. Alaska and Hawaii are not shown because RTOs and ISOs do not operate in those states. |
7 A more detailed history of Regional Transmission Organizations (RTOs) and Independent System Operators (ISOs), and further description of the functions summarized in this paragraph, are in CRS Report R44783, The Federal Power Act (FPA) and Electricity Markets, by Richard J. Campbell, and CRS Report R43093, Electricity Markets—Recent Issues in Market Structure and Energy Trading, by Richard J. Campbell.
8 The term essential reliability services refers to a group of functions that generators perform, usually automatically, over timescales of seconds or less. Damage to bulk power system components could occur if sufficient essential reliability services are not available. More details are provided in the Appendix.
9 Federal Energy Regulatory Commission (FERC), Electric Power Markets: National Overview, updated July 20, 2021, https://www.ferc.gov/electric-power-markets.
Congressional Research Service
3
link to page 21 Maintaining Electric Reliability with Wind and Solar Sources
In non-RTO regions, vertically integrated electric utilities are largely responsible for power generation, transmission, and distribution of electricity to end-use customers. These utilities are essentially regulated as natural monopolies and, unlike utilities in RTO regions, : under the “regulatory compact” concept, electric utilities were granted near monopoly status in some states in exchange for agreeing to provide universal service. Unlike utilities in RTO regions, vertically integrated electric utilities generally do not face competition for generation and transmission services. These utilities may also may take responsibility for some aspects of reliability as discussed in thethe Appendix. StateState regulators generally oversee these utility operations and are responsible for authorizing new investmentspower plant and transmission siting and allowing recovery of new investments in utility rates, including those related to reliability.9
10
Even in RTO regions, municipal utilities and rural electric cooperatives may own generation and transmission system components and oversee their operation.10provide regulatory oversight of their operations.11 These systems and operationoperations are generally outside of federal and state regulatory jurisdiction.
What Is Electric Reliability?
A colloquial definition of electric reliability is "“having power when it is needed."” Operators of bulk power system components, though, require specific and highly technical definitions for reliability. For purposes of regulation, these definitions are provided in the form of NERC reliability standards. NERC develops individual standards for each set of power system components, which may include separate standards covering different reliability timescales for each set of components. As NERC defines "“reliability standard,"” it
it
includes requirements for the operation of existing Bulk-Power System facilities, including cybersecurity protection, and the design of planned additions or modifications to such facilities to the extent necessary to provide for Reliable Operation of the cybersecurity protection, and the design of planned additions or modifications to such facilities to the extent necessary to provide for Reliable Operation of the Bulk-Power System, but the term does not include any requirement to enlarge such facilities or to System, but the term does not include any requirement to enlarge such facilities or to construct new transmission capacity or generation capacity.11
12
When all bulk power system components meet reliability standards, NERC expects the vast majority of individualspower customers to have the full amount of electricity they desire. NERC reliability standards do not apply to local electricity distribution system components and operations (see discussion in text box, "“Distribution System Reliability"”), so localized outages could stilloutages still could occur when reliability standards are met. An analysis found that from 2008 to 2014, upwards of 90% of power outages originated in local distribution systems.1213 This measure includes major events (e.g., major storms and hurricanes), but may not capture the full scope or severity of large-scale outages.
Distribution System Reliability
15 Small-scale wind and solar generators |
NERC'16
NERC’s reliability standards are meant to ensure an Adequate Level of Reliability (ALR) for the bulk power system during normal operating conditions and following localized disturbances such as lightning strikes.1617 For economic reasons, some risk of occasional power loss is accepted in reliability planning. A common goal is to limit outages to no more than 1 day every 10 years under normal operating conditions.17
18
Achieving ALR is not the same goal as preventing all brownouts and blackouts. Bulk power system outages could stillstill could occur when reliability standards are fully met. These outages might follow a major event such as a hurricane, tornado, or wildfire affecting large areas of the bulk power system.
System: Identifying the Source of Electric Service Interruptions in the US,” IET Generation, Transmission & Distribution, vol. 13, no. 5 (2019). These findings are consistent with other analyses that the vast majority of power outages occur in distribution systems.
14 For a discussion of how distribution system outages can be impactful, see CRS Report R42696, Weather-Related Power Outages and Electric System Resiliency, by Richard J. Campbell.
15 Definitions for microgrids vary, but they generally are understood to include sources of electricity supply and demand within defined electrical boundaries. Some are capable of operating in isolation of the bulk power system. For additional information on microgrids, see DOE, “How Microgrids Work,” June 17, 2014.
16 The independent distribution system operator concept is described in Farrokh Rahimi and Sasan Mokhtari, “From ISO to DSO,” Public Utilities Fortnightly, June 2014, and James Tong and Jon Wellinghoff, “Rooftop Parity: Solar for Everyone, Including Utilities,” Public Utilities Fortnightly, August 2014. 17 While cybersecurity is an important aspect of power system reliability that NERC addresses, it is outside the scope of this report. That topic is discussed in CRS Report R43989, Cybersecurity Issues for the Bulk Power System, by Richard J. Campbell.
18 This target is called loss of load expectation (LOLE) and is calculated using estimates of generation, demand, and the probabilities of outages on system components. The 1 outage day every 10 years target is equivalently expressed as 0.1 days/year. A technical discussion of LOLE methods in the context of variable sources such as wind and solar is available in NERC, Methods to Model and Calculate Capacity Contributions of Variable Generation for Resource Adequacy Planning, March 2011.
Congressional Research Service
5
link to page 10 Maintaining Electric Reliability with Wind and Solar Sources
power system.
Electricity System Resilience
An emerging topic of interest is the concept of electricity system resilience. This term is somewhat similar to reliability in that both terms suggest that power
Resilience is not just about lessening the likelihood that these outages 19
Whereas the electric power industry has developed technical standards and metrics for reliability that are suitable for regulatory purposes, a technical definition of resilience is (1) to develop a common understanding among the Commission, industry, and others of what resilience of the bulk power system means and requires; (2) to understand how each RTO and ISO assesses resilience in its geographic footprint; and (3) to use this information to evaluate whether additional Commission action regarding resilience is appropriate at this time.19 This report does not discuss power system resilience in depth, although some system operations and other activities that support reliability |
Generally, factors that increase uncertainty reduce reliability, and factors that reduce uncertainty increase reliability. Wind and solar are types of variable renewable energy sources of electricity, and weather is a key source of uncertainty for forecasts of generation from these sources. In contrast, conventional sourcesbase load power generation such as coal and nuclear have long-lasting, on-site fuel supplies that reduce the uncertainty about their availability.2022 This difference has raised questions about how to integrate large amounts of VRE sources into the existing bulk power system, since it was not originally designed to accommodate large amounts of weather-dependent sources of electricity.21
23
Figure 3 shows typical patterns for electricity generation for wind and solar sources in the United States. WindOnshore wind generation tends to peak overnight and during winter months.22and early spring months (i.e., November-April).24 Solar generation, on the other hand, tends to be highest during the middle of the day and during the summerlate spring and summer (i.e., May-August). Though these typical patterns are well established for most of the United States, actual generation from wind and solar sources at any particular moment will depend upon specific weather conditions.
|
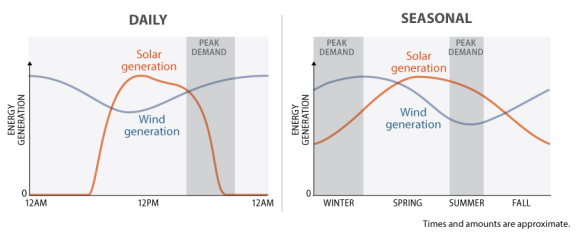 |
. Notes: The y-axis represents the potential energy generation from each individual source, from a minimum of zero to a maximum defined by the installed capacity of the source. Actual generation from any individual source |
Changing Electricity Generation Profile
The electric power sector is increasing its use of sources associated with more uncertainty in availability. According to the U.S. Energy Information AdministrationEIA, combined generation from wind and utility-scale solar sources increased from 1% of total electricity generation in 2008 (the first year in which this share was greater than 1%) to 13to 8% of total electricity generation in 2018.232021.25 Of the generation in 20182021 from wind and utility-scale solar sources, 8077% came from wind. Conventional sources such as coal, natural gas, and nuclear comprised a large majority of power generation over this time period. The annual share of generation from different sources from 2008 to 20182021 in shown inin Figure 4.
25 CRS analysis of data from EIA, “Electricity Data Browser,” accessed May 19, 2022, https://www.eia.gov/electricity/data/browser/. EIA began collecting data on generation from small-scale solar PV sources in 2014. The statistic reported for 2021 includes both large-scale and small-scale solar sources. Typically, small-scale solar PV sources are connected to the distribution system, not the bulk power system.
Congressional Research Service
7
Maintaining Electric Reliability with Wind and Solar Sources
Figure 4.
Figure 4. Annual Net U.S. Electricity Generation by Source, 2008- 2021
Percent of total
|
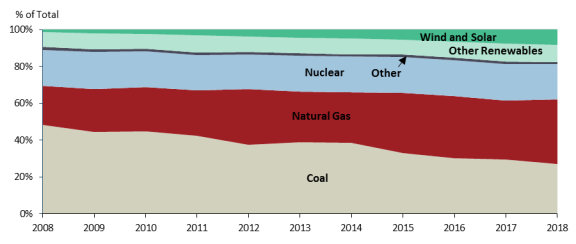 |
Source: CRS analysis of data from EIA, . Notes: Some EIA categories are combined. Other = petroleum liquids, petroleum coke, other gas, and other |
National-level data are not indicative of how generation from wind and solar sources varies across the country. Similarly, annual data do not show how electricity generation varies throughout the day or during different seasons. For example, during brief periods in some regions, wind and solar sources have provided a large majority of the energy for electricity generation. Some examples are
On April 30, 2022, generation from renewable energy sources equaled 100examples are
Generation from wind sources supplied 56% of% of electricity demand inERCOTthe California Independent System Operator, the RTO covering most ofTexas, at 3:10 am on January 19, 2019.24Generation from solar sources supplied 59% of electricity demand in CAISOCalifornia, for about 15 minutes. About two-thirds of the generation from renewable energy sources was from solar.26 On March 29, 2022, generation from wind energy sources supplied 89% of electricity demand in the Southwest Power Pool (SPP), the RTO covering many central states.27 On April 10, 2022, generation from wind energy sources supplied 69% of electricity demand in the Electric Reliability Council of Texas, the RTO covering most of Texas.28 26 Ryan Kennedy, “For the First Time in History, California’s Demand Was 100% Matched by Renewable Energy Generation,” PV Magazine, May 2, 2022. 27 Southwest Power Pool (SPP) press release, “SPP Sets Regional Records for Renewable Energy Production,” March 29, 2022. 28 Electric Reliability Council of Texas, “Fact Sheet,” April 2022. Congressional Research Service 8 link to page 21 Maintaining Electric Reliability with Wind and Solar Sources These events all set regionalmost of California, at 2:45 pm on March 16, 2019.25- Generation from wind supplied 67.3% of electricity demand in SPP, the RTO covering many central states, at 1:25 am on April 27, 2019.26
These events all set records for maximum share of generation from renewable sources, and the bulk power system maintained reliability during them. Some advocates for increased use of wind and solar sources have pointed to events like these as evidence that VRE sources can be used to an even greater degree without impacting reliability.27
Extrapolating these events to scenarios of correspondingly high national levels of generation from wind and solar sources, however,Although some may contend these events demonstrate how high levels of wind and solar can be used without affecting reliability, extrapolating these events to national, annual levels is complicated by several factors. First, these events were all short lived, typically fivefifteen minutes or less. Further, these events all occurred when electricity demand was relatively low, namely weekend days during cool monthsduring cool months and (except for SPP) on weekends. During times of the year when electricity demand is high, such as the summer cooling season, the share of electricity generation from renewable sources is lower.2829 For example, SPP has reported that during its peak demand hours in 2016, wind supplied 11% of generation while conventional sources such as coal (47%) and natural gas (33%) supplied the majority of electricity.2930 The seasonality of VRE availability also likely contributed to these record-setting events, especially for wind, which tends to have maximum generation during winter and spring months.
Balancing Variable Renewable Energy
Electricity is essentially generatedgenerated essentially as a just-in-time commodity, due to limited energy storage capacities. If electricity supply and demand differ by too much, system components and customer equipment could be damaged, leading to system instability or potential failure. The operations that keep electricity supply and demand within acceptable levels are known as balancing.
system load balancing.
Balancing involves increasing or decreasing output from generators according to system conditions over timescales of minutes to hours, and it is a critical aspect of maintaining reliability. Balancing authorities, discussed in thethe Appendix, issueissue orders to generators to change their output as needed to maintain reliability. Balancing authorities can be utilities, or RTOs can act as balancing authorities in the regions where they exist. The rules for selecting which generators must increase or decrease output typically reflect an approach known as security-constrained economic dispatch (SCED). Under SCED, system operators ensure that electricity is produced at the lowest overall cost while respecting any transmission or operational constraints.3031 When generation from a low-cost source would jeopardize reliability, a higher-cost source is used. In other words, SCED has two goals: affordability and reliability.
SCED favors sources with low operating costs, and wind and solar sources do not have to pay for fuel. As a result, wind and solar sources typically generate the maximum amount of electricity they can at any moment.3132 Balancing typically involves quickly increasing or decreasing output from other sources in response to variable output from wind and solar sources. The capability to
29 VRE sources generally are used to the maximum extent possible, for economic reasons, as described in the section “Balancing Variable Renewable Energy.” Unlike other types of sources, the potential supply of electricity from VRE sources usually does not change in response to total electricity demand. Thus, when demand increases and more electricity in total is generated to meet that demand, the relative share of generation from VRE sources decreases. If total demand for electricity at any moment is 10,000 MW and 5,000 MW of electricity from VRE sources is available, the share of generation from VRE sources would likely be 50%. If, however, total demand were 50,000 MW, the share of generation from VRE sources would likely be 10%.
30 SPP Supply Adequacy Working Group, Wind and Solar Report, May 23, 2017, https://www.spp.org/documents/53721/sawg%20approved_wind%20and%20solar%20report.pdf.
31 In EPACT05, Congress required FERC to study SCED and report its findings to Congress. That report is FERC, Security Constrained Economic Dispatch: Definition, Practices, Issues and Recommendations, July 31, 2006.
32 Exceptions do exist. Many such instances, known as curtailment, have been associated with limited transmission capacity.
Congressional Research Service
9
Maintaining Electric Reliability with Wind and Solar Sources
from other sources in response to variable output from wind and solar sources. The capability to quickly change output is known as ramping, and electricity sources differ in their ramping capability.
System operators use a variety of electricity sources to balance generation from wind and solar sources. Some may be more commonly used in certain regions of the country, depending on local factors. Each has different benefits and limitations, some of which are summarized below.
-
Reciprocating internal combustion engines
(RICE)have seen an increase in installed capacity since 2000, partly in response to higher levels of generation from wind and solar sources.3233 These sources have high ramping capabilities and use mature technologies. They usually use natural gas or fuel oil as fuel, so they have associated fuel costs and environmental impacts.33 - 34
Steam turbines, usually fueled by coal or nuclear energy
, have historically been, historically have been operated at steady, high output levels, barring maintenance needs, because that is the most efficient and lowest cost operational mode for them. These sources are capable of ramping to some extent. This operational mode may provide revenue for certain sources located in regions of the country with low wholesale electricity prices. Itmight alsoalso might result in higher costs for electricity from these sources, compared to when they are not ramped.34 Wind and solar sources located in one area can35 Hydropower can be ramped up or down relatively quickly, has relatively few associated greenhouse gas emissions, and is relatively inexpensive to operate. Existing hydropower resources are concentrated in some regions of the country, and development of new resources may face barriers such as concerns over the environmental impact of dams. Proposals to expand U.S. hydropower capacity have focused on increasing the electricity generating capacity at existing hydropower dams and adding electricity generating capacity to existing non-powered dams.36 Drought and other weather factors can affect the availability of hydropower, though not over the same short timescales over which weather affects wind and solar availability. Wind and solar sources located in one area can potentially balance wind and solarbalance wind and solarsources in other areas, since it is rare to have cloudy skies or calm winds over broad regions of the country almost simultaneously. This could have the benefit of using sources with zero fuel costs and zero emissions for balancing; however, 33 Suparna Ray, Natural Gas-Fired Reciprocating Engines Are Being Deployed More to Balance Renewables, EIA, February 19, 2019, https://www.eia.gov/todayinenergy/detail.php?id=37972. Reciprocating Internal Combustion Engines work through pistons, similar to internal combustion engines used in vehicles. In contrast, most base load plants using natural gas rely, at least in part, on steam-driven turbines. 34 Some other benefits and limitations are discussed in Chris Warren, “20 Power Companies Examine the Role of Reciprocating Internal Combustion Engines for the Grid,” EPRI Journal, September 26, 2018, http://eprijournal.com/start-your-engines/. 35 Power plant operators do not often publicly discuss operational decisions because they can contain proprietary information. Aggregated and anonymous industry reports document how flexible operations like ramping are increasing. For example, see Peter Maloney, “How Market Forces Are Pushing Utilities to Operate Nuclear Plants More Flexibly,” Utility Dive, October 4, 2016, https://www.utilitydive.com/news/how-market-forces-are-pushing-utilities-to-operate-nuclear-plants-more-flex/427496/. 36 For a discussion of hydropower and proposals to expand U.S. hydropower capacity, see, for example, CRS Report R42579, Hydropower: Federal and Nonfederal Investment, by Kelsi Bracmort, Adam Vann, and Charles V. Stern, and DOE, Hydropower Vision Report, July 2016. Congressional Research Service 10 link to page 10 link to page 10 Maintaining Electric Reliability with Wind and Solar Sourcesof using sources with zero fuel costs and zero emissions for balancing; however,existing electricity transmission system constraints limit the extent to which this is possible.35- 37
Energy storage can be used for balancing because it stores electricity during
periods of high supply and then provides electricity when supply is low. Many experts also see storage as a way to address the daily variability shown
inin Figure 3 and thereby expand the utilization of installed wind and solar sources.3638 Many energy storage types are relatively expensive and not currently deployed in largeamounts.37amounts, although energy storage deployment (especially battery storage) is growing.39 Energy storage can be co-located with wind or solar generators, or it can be located at other sites in the power system or the distribution system.38 - 40
Demand response, sometimes called demand-side management, involves
adjusting electricity demand in response to available supply. This is counter to how the power system
has historicallyhistorically has been operated, but has become more commonly used.3941 Demand response includes programs in which electricity consumers voluntarily reduce their usage in exchange for financial compensation. Demand response can be a low-cost balancing option because it does not require electricity generation; however, it comes at a social cost because consumers do not use electricity at their preferred time. -
The electric power sector is working to improve the use of weather and power
forecasting in system balancing. For example, MISO changed its wholesale electricity market rules in 2011 to create a Dispatchable Intermittent Resources program.42 This program allows wind and solar sources to make use of their own generation forecasts and offer generation at five-minute intervals. Previously, offers had to be made on an hourly basis. This was creating inefficiencies in using VRE
using wind sourcessince their output can vary over the course of an hour.ImprovedImproved 37 Existing boundaries between balancing authorities also can pose hurdles to using remote wind and solar sources for balancing. Some Western states have created an Energy Imbalance Market to address such market hurdles. See Aaron Larson, “How Does the Western Energy Imbalance Market Work?,” https://www.powermag.com/how-does-the-western-energy-imbalance-market-work/. 38 For example, “grid-scale storage helps with renewable integration, allowing higher renewable energy levels than would otherwise be possible.” Ben Fowke, Chairman, President, and Chief Executive Officer of Xcel Energy in written testimony, U.S. Congress, Senate Committee on Energy and Natural Resources, Hearing on Expanded Deployment of Grid-Scale Energy Storage, 116th Cong., June 4, 2019. 39 Current policy discussion is focused on how energy storage might balance daily variability of wind and solar sources, but some energy storage types potentially could balance seasonal variability as well. For a discussion of energy storage, see CRS Report R42455, Energy Storage for Power Grids and Electric Transportation: A Technology Assessment, by Paul W. Parfomak, and CRS Report R45980, Electricity Storage: Applications, Issues, and Technologies, by Richard J. Campbell. 40 In Order No. 841, issued February 15, 2018, FERC defines an energy storage source as “a resource capable of receiving electric energy from the grid and storing it for later injection of electric energy back to the grid.” The definition does not specify location, and FERC further clarifies that “electric storage resources located on the interstate transmission system, on a distribution system, or behind the meter fall under this definition.” FERC, Order No. 841: Electric Storage Participation in Markets Operated by Regional Transmission Organizations and Independent System Operators, February 15, 2018, paragraph 29. 41 Demand response in energy markets is discussed in CRS Report R43093, Electricity Markets—Recent Issues in Market Structure and Energy Trading, by Richard J. Campbell. 42 Jasmin Melvin, “FERC OKs MISO Plan to Extend ‘Dispatchability’ Requirement to Solar Resources,” S&P Global Market Intelligence, June 11, 2020. Congressional Research Service 11 Maintaining Electric Reliability with Wind and Solar Sources forecasting could result in increased use of low-cost wind and solar sources, but forecasting methodologies are still being optimized for this purpose.
The above considerations apply to bulk power system balancing today. Technological or policy developments could alter how system balancing is conducted in the future. Additionally, if wind and solar sources provided even larger shares of overall generation, new benefits or limitations for each balancing source type could emerge.
Federal Government Activities Affecting Reliability and Balancing
Work at the federal level to address reliability needs associated with increased use of wind and solar sources has been underway for some time. For example, NERC created a task force in December 2007 to study the integration of VRE and identify gaps in reliability standards.40
43 The federal government undertakes actions in addition to the development and enforcement of reliability standards that affect electric reliability. FERC regulates interstate electricity transmission, which can be a key determinant of what sources are available to balance wind and solar. FERC also regulates wholesale electricity transactions, and competitive markets in most regions of the country. Market rules, including how SCED is implemented, can influence which individual generators are used for system balancing. Market prices can directly affect project revenues and influence investment decisions. Additionally, Congress funds projects and programs that support technology development and deployment, including for sources and operations that improve reliability.
Some examples demonstrate the breadth of federal activities indirectly related to reliability.
In EPACT05, Congress EPACT05 created Section 219 of the Federal Power Actthat directs, directing FERC to establish financial incentives for certain electricity transmission investments.FERC'FERC’s resulting rule became effective in 2006 and includes provisions allowing higher rates of return, accelerated depreciation, and full cost recovery, all for investments and activities that FERC approves on a case-by-case basis.414245 On March 21, 2019, FERC opened an inquiry on potential changes to its transmission incentive policy.43- The agency continues to move forward with proposed reforms.46
In 2011, FERC issued a rule, Order No. 1000, revising requirements related to
new transmission projects.
4447 Among other revisions, Order No. 1000 increased the weight given to achieving public policy requirements when FERC considersapproval of transmission projects.4543 NERC, Accommodating High Levels of Variable Generation, April 2009. 44 FERC, Order No. 679: Promoting Transmission Investment Through Pricing Reform, July 20, 2006, http://elibrary.ferc.gov/idmws/common/opennat.asp?fileID=11089376. 45 Lori Aniti, Utilities Continue to Increase Spending on Transmission Infrastructure, EIA, February 9, 2018, https://www.eia.gov/todayinenergy/detail.php?id=34892. 46 FERC, “News Release: FERC Opens Inquiry on Improvements to Electric Transmission Incentives Policy,” press release, March 21, 2019, and FERC, “FERC Proposes Further Reforms to Electric Transmission Incentives Policy,” April 15, 2021. 47 FERC, “Order No. 1000—Transmission Planning and Cost Allocation,” updated November 9, 2021. Congressional Research Service 12 Maintaining Electric Reliability with Wind and Solar Sources approval of transmission projects.48 An example of a public policy requirement might be a state requirement that a specified share of electricity sales come from renewable sources, a policy commonly known as a renewable portfolio standard.49 In July 2021, FERC began a new process for additional reform to its transmission policies.50 standard.46 New transmission capacity is often needed to access and balance wind and solar sources. - Several FERC orders demonstrate how market rules are changing in response to
increased need for balancing and ramping. Order No. 745 allows demand response to earn compensation from wholesale electricity markets for providing energy services to balance the power system in day-ahead and real-time markets.
4751 Order No. 841 allows energy storage systems to earn compensation from wholesale electricity markets for providing any energy, capacity, and essential reliability services they are capable of providing.4852 Implementation of Order No. 841 might lead to greater deployment of energy storage which could improve balancing. -
Various grant programs administered by
the Department of Energy (DOE)DOE have supported the development of new technologies that can balance wind and solar sources or support reliability in other ways. These include research and development into electricity generators; wind forecast models and methodology; power electronics for solar sources; and standards for interconnection into the bulk power system.49 DOE'53 DOE’s Office of Energy Efficiency and Renewable Energy(EERE)has funded research meant to improve short-term weather forecasting specifically related to wind power forecasts in two Wind Forecast Improvement Projects. DOE reports that advances made during this research include improved observations of meteorological data and improved methodologies for using those data in wind forecasts.54 48 For a discussion, see CRS Report R41193, Electricity Transmission Cost Allocation, by Richard J. Campbell and Adam Vann. 49 Thirty states and the District of Columbia are implementing mandatory renewable portfolio standards, and an additional eight states have voluntary versions. Texas and Iowa have portfolio standards that set a requirement in terms of installed capacity, not share of electricity sales. DSIRE, Renewable & Clean Energy Standards, September 2020, https://ncsolarcen-prod.s3.amazonaws.com/wp-content/uploads/2020/09/RPS-CES-Sept2020.pdf. For discussion of this policy, see CRS Report R45913, Electricity Portfolio Standards: Background, Design Elements, and Policy Considerations, by Ashley J. Lawson. 50 FERC, “News Release: FERC Begins Reform Process to Build the Transmission System of the Future,” press release, July 15, 2021, and FERC, “FERC Issues Transmission NOPR Addressing Planning, Cost Allocation,” press release, April 21, 2022. 51 FERC, Order No. 745: Demand Response Compensation in Organized Wholesale Energy Markets, March 15, 2011, https://www.ferc.gov/sites/default/files/2020-06/Order-745.pdf. 52 FERC, Order No. 841: Electric Storage Participation in Markets Operated by Regional Transmission Organizations and Independent System Operators, February 15, 2018. 53 The authorization and appropriations history for some of these programs is summarized in CRS Report R40913, Renewable Energy and Energy Efficiency Incentives: A Summary of Federal Programs, by Lynn J. Cunningham. Many of these efforts were organized within DOE as part of its Grid Modernization Initiative. Information on that effort is available at https://www.energy.gov/grid-modernization-initiative. 54 DOE, WFIP NOAA Final Report, April 30, 2014; and NOAA, Wind Forecast Improvement Project 2 (WFIP 2) in Complex Flow. Congressional Research Service 13 Maintaining Electric Reliability with Wind and Solar Sources The Infrastructure Investment and Jobs Act (P.L. 117-58) On November 15, 2021, President Biden signed the Infrastructure Investment and Jobs Act (IIJA; P.L. 117-58), sometimes referred to as the Bipartisan Infrastructure Law. This broad infrastructure law addressed a range of issues, including surface transportation, transit, water infrastructure, broadband, and minority business. IIJA also addressed a number of energy issues, including issues related to electricity reliability.55 As of July 2022, most of these IIJA provisions are in early stages of implementation, and their eventual impact on electric reliability in the United States is unknown. One focus area in IIJA is electricity transmission. New authorities were given to DOE and FERC with the goals of addressing electric reliability, resilience, and promotion of renewable energy.56 Section 40105 of IIJA revises the process for designation of a National Interest Electric Transmission Corridor (NIETC) by DOE.57 A key revision allows for an NIETC designation that may lead to new interstate transmission lines connecting regions with strong wind or solar resources. Another key change in the section enhances FERC’s “backstop” siting authority for transmission lines in NIETCs. This would allow FERC to supersede traditional state permitting of transmission facilities and issue a permit for the construction and operation of certain interstate facilities under defined circumstances, including when a state has denied an applicant’s request to site transmission facilities. It is unclear when or if FERC may use this authorization.58 Section 40106 establishes the “Transmission Facilitation Program,” under which DOE can facilitate the construction of electric power transmission lines and related facilities.59 Under this program, DOE may enter into a capacity contract (for no more than 40 years or 50% of the total capacity) with respect to an eligible transmission project; issue a loan to an eligible entity for an eligible transmission project; or participate with an eligible entity in designing, developing, constructing, operating, maintaining, or owning an eligible transmission project. Thus, under a capacity project, DOE could be closely involved in operational support of eligible transmission-line construction. Such an arrangement potentially could help move a transmission project from proposal to construction, as a transmission project is unlikely to be built without significant customer commitment to its use. IIJA also provided appropriations for research, development, and deployment of various technologies that could potentially support electric reliability. Examples include: $8 billion for Regional Clean Hydrogen Hubs which IIJA established (hydrogen can potentially be used as energy storage and for balancing);60 55 For an overview of energy issues in the Infrastructure Investment and Jobs Act (IIJA), see CRS Report R47034, Energy and Minerals Provisions in the Infrastructure Investment and Jobs Act (P.L. 117-58), coordinated by Brent D. Yacobucci. 56 For additional information on IIJA transmission provisions, see CRS Insight IN11821, IIJA: Efforts to Address Electric Transmission for Reliability, Resilience, and Renewables, by Richard J. Campbell. 57 For background information on National Interest Electric Transmission Corridors, see CRS In Focus IF11411, The Legal Framework of the Federal Power Act, by Adam Vann, and DOE, “DOE Issues Two Draft National Interest Electric Transmission Corridor Designations,” April 26, 2007. 58 Catherine Morehouse, “FERC Will Hold Off on Flexing Transmission Authority, Clements Says,” Politico, January 25, 2022. 59 DOE, “Transmission Facilitation Program,” May 10, 2022. 60 42 U.S.C. §16161a. Congressional Research Service 14 Maintaining Electric Reliability with Wind and Solar Sources $5 billion for the Program Upgrading Our Electric Grid and Ensuring Reliability and Resiliency which IIJA established;61 $505 million for several energy storage demonstration projects;62 $125 million for incentives for qualified hydropower;63 $10 million for a pumped storage hydropower demonstration project that is “able to store electricity generated by intermittent renewable electricity projects located on Tribal land.”64 Potential Issues for Congress Congress has held hearings related to the changes in the electricity generation profile of the country, and some Members raised concerns about reliability during these hearings.65 Members may continue to examine reliability issues moving forward, in light of projections that wind and solar will become an increasingly larger share of electricity generation. For example, EIA’s projection of existing law and regulations shows wind and solar sources contributing 36% of electricity generation in 2050.66 Potential power outages—such as those that affected parts of Texas and other states in February 2021—might prompt additional congressional oversight activity.67 Preparing for higher levels of generation from wind and solar might require modified approaches to maintaining electric reliability, given the variable nature of these sources. The existing regulatory framework can accommodate some changes since FERC and NERC have authority to initiate development of new reliability standards. For example, NERC has raised the issue of whether it should develop new reliability metrics in light of the increasing use of VRE for electricity generation. In addition to its capacity supply assessment, NERC’s Reliability Assessment Subcommittee should lead the electric industry in developing a common approach and identify metrics to assess energy adequacy. As identified in this assessment, the changing resource mix can alter the energy and availability characteristics of the generation fleet. 61 42 U.S.C. §18712(b). 62 The funded energy storage demonstrations are authorized at 42 U.S.C. §17232(c) and 42 U.S.C. §17232(d). 63 42 U.S.C. §15881. 64 42 U.S.C. §17232(e)(2)(iii). 65 See, for example, U.S. Congress, Senate Committee on Energy and Natural Resources, Keeping the Lights On—Are We Doing Enough to Ensure the Reliability and Security of the U.S. Electric Grid?, 113th Cong., April 10, 2014, S. Hrg. 113-271; U.S. Congress, House Committee on Energy and Commerce, Subcommittee on Energy and Power, Hearing on Discussion Draft Addressing Energy Reliability and Security, 114th Cong., May 19, 2015; U.S. Congress, House Committee on Energy and Commerce, Subcommittee on Energy, Powering America: Defining Reliability in a Transforming Electricity Industry, 115th Cong., September 14, 2017; U.S. Congress, Senate Committee on Energy and Natural Resources, Hearing to Examine the Electricity Sector in a Changing Climate, 116th Cong., March 5, 2019; and U.S. Congress, House Committee on Energy and Commerce, Subcommittee on Oversight and Investigations, Power Struggle: Examining the 2021 Texas Grid Failure, 117th Cong., 1st sess., March 24, 2021. 66 EIA, Annual Energy Outlook 2022, March 3, 2022, p. 19, https://www.eia.gov/outlooks/aeo/pdf/AEO2022_Narrative.pdf. Factors that could increase the use of wind and solar sources above this level might be missing from EIA’s analysis. Such factors include new state or federal policies that might be enacted and unexpected cost declines for wind and solar sources or energy storage technologies. 67 For a discussion of the causes of the February 2021 power outages, see FERC, NERC, and Regional Entity Staff Report, The February 2021 Cold Weather Outages in Texas and the South Central United States, November 2021. Congressional Research Service 15 Maintaining Electric Reliability with Wind and Solar Sources Additional analysis is needed to determine energy sufficiency, particularly during off-peak periods and where energy-limited resources are most prominent.68 Congress could choose to provide guidance for FERC and NERC activities in this area. Additionally, Congress could assess whether the existing regulatory framework is sufficient to maintain reliability given the changing mix of energy sources used for electricity generation. An emerging area of interest is the interdependency of electric systems and natural gas systems.69 Increased use of natural gas for electricity generation raises potential reliability risks that are distinct from those associated with wind and solar. However, the two may be linked through the widespread use of natural gas to balance wind and solar. Congress continues to debate the desired amount of wind and solar energy used for electricity generation. For example, H.R. 5376, the Build Back Better Act, passed by the House in November 2021, and the Inflation Reduction Act of 2022, released by Senate Majority Leader Schumer and Senator Manchin on July 27, 2022, would provide several tax credits aimed at increasing the use of renewable energy sources such as wind and solar.70 Congress could consider how financial incentives for renewable energy could potentially take electric reliability into account. Agency actions affecting the power sector may be of interest as well. For example, the U.S. Environmental Protection Agency (EPA) may regulate greenhouse gas emissions in the power sector under the Clean Air Act. Such regulations potentially could lead to more favorable market conditions for wind and solar energy sources relative to fossil fuels. Any potential market impact of EPA regulations on power sector emissions will be influenced by the specifics of how they may be implemented. The scope of regulatory tools available to EPA, and any regulations themselves, could be influenced by the U.S. Supreme Court’s ruling in West Virginia v. EPA.71 Congress could consider clarifying the scope of EPA’s authority to regulate greenhouse gas emissions from the power sector, including how (if at all) EPA alone or together with other agencies might address any potential reliability concerns arising from an agency action.72 As noted above, most power outages occur on local electricity distribution systems, and these are generally regulated by state or local governments. Congress could consider examining whether distribution system reliability warrants federal action. This might involve studies of the factors (e.g., weather, aging infrastructure, VRE) that result in power outages or promotion of best practices for distribution system reliability. It also might include federal financial support for 68 NERC, 2018 Long-Term Reliability Assessment, December 20, 2018, p. 9, https://www.nerc.com/pa/RAPA/ra/Reliability%20Assessments%20DL/NERC_LTRA_2018_12202018.pdf. 69 See, for example, NERC, Special Reliability Assessment: Potential Bulk Power System Impacts Due to Severe Disruption on the Natural Gas System, November 2017; and Robert Walton, “North American Energy Standards Board to Tackle Gas-Electric Coordination in 2022,” Utility Dive, December 15, 2021. Additionally, NERC and FERC found forced shutdowns of power plants and natural gas supply were “inextricably linked” during the February 2021 power outages in Texas and other states. See FERC, NERC, and Regional Entity Staff Report, The February 2021 Cold Weather Outages in Texas and the South Central United States, November 2021, p. 172. 70 For a discussion of energy tax credits included in the House-passed Build Back Better Act, see CRS Report R46960, Tax Provisions in the Build Back Better Act: Rules Committee Print 117-18, coordinated by Molly F. Sherlock. For a discussion of energy tax credits included in the Inflation Reduction Act of 2022, see CRS Report R47202, Tax Provisions in the Inflation Reduction Act of 2022 (H.R. 5376), coordinated by Molly F. Sherlock. 71 For an overview of West Virginia v EPA, see CRS Legal Sidebar LSB10791, Supreme Court Addresses Major Questions Doctrine and EPA’s Regulation of Greenhouse Gas Emissions, by Kate R. Bowers. 72 Some Members have raised concerns about potential reliability issues arising from environmental regulations. See, for example, House Energy and Commerce Committee Republicans, “House Republicans Demand Answers from EPA on Life Threatening Blackouts and Grid Instability,” press release, July 12, 2022. Congressional Research Service 16 Maintaining Electric Reliability with Wind and Solar Sources projects or practices that improve reliability of distribution systems or encouraging new operational regimes such as independent distribution system operators. (See earlier discussion of this issue in text box, “Distribution System Reliability.”) Congress also might consider acting on the emerging and related issue of electric resilience. Some support for an enhanced federal role in electricity system resilience exists. For example, the National Academies recommend Congress and the Department of Energy leadership should sustain and expand the substantive areas of research, development, and demonstration that are now being undertaken by the Department of Energy’s Office of Electricity Delivery and Energy Reliability and Office of Energy Efficiency and Renewable Energy, with respect to grid modernization and systems integration, with the explicit intention of improving the resilience of the U.S. power grid.73 Electric resilience faces challenges, such as higher costs and technical issues challenges (e.g., developing appropriate scenarios with sufficient data granularity around which to plan for resilience). 73 National Academies of Sciences, Engineering, and Medicine, Enhancing the Resilience of the Nation’s Electricity System, 2017, p. 4, https://doi.org/10.17226/24836. Congressional Research Service 17 link to page 21 Maintaining Electric Reliability with Wind and Solar Sources Appendix. Key Reliability Concepts for Policymakers Electric reliability encompasses short-term and long-term aspects as shown in Figure A-1. System operators and reliability planners, governed by reliability standards from the North American Electric Reliability Corporation (NERC), have different practices in place to address reliability over these various timescales. Figure A-1. Power System Reliability Timescales Source: DOE, Staff Report to the Secretary on Electricity Markets and Reliability, August 2017, p. 62, https://www.energy.gov/downloads/download-staff-report-secretary-electricity-markets-and-reliability. Notes: AC = alternating current; T&D = transmission and distribution systems. Reliability over Different Timescales At the smallest timescales, typically seconds or less, reliability requires factors such as frequency control, voltage support, and ramping capability.74 These are often automatic responses of power system components. NERC refers to these factors as Essential Reliability Services (ERS), and they are sometimes called ancillary services. Historically, many ERS were provided as a natural consequence of the physical operational characteristics of steam turbines. Wind and solar generators do not inherently provide ERS in the same way. They require additional electrical components to do so, and these are being more commonly deployed. In some cases, FERC has mandated the use of technologies that allow wind and solar to provide ERS.75 Balancing, described in the main body of this report, typically occurs over minutes to hours. Unlike ERS, balancing typically requires action by a system operator. Long-term aspects of reliability relate to planning for energy and transmission needs over months to years. This is sometimes referred to as resource adequacy. Policy goals, such as preferences for certain electricity sources over others, tend to influence long-term reliability planning more than shorter-term reliability aspects. 74 For more background, see FERC, Reliability Primer, https://www.ferc.gov/media/2135. 75 For a discussion of the technical and market issues around ERS, seeforecasts.50
Potential Issues for Congress
Congress has held hearings related to the changes in the electricity generation profile of the country, and some Members raised concerns about reliability during these hearings.51 Members may continue to examine reliability issues moving forward, in light of projections that wind and solar will become an increasingly larger share of electricity generation. For example, EIA's projection of existing law and regulations shows wind and solar sources contributing 23% of electricity generation in 2050.52 Members may also choose to include reliability as part of any debate about policies to increase the generation from wind and solar sources.53
Preparing for higher levels of generation from wind and solar might require new approaches to maintaining electric reliability. The existing regulatory framework can accommodate some changes since FERC and NERC have authority to initiate development of new reliability standards. For example, NERC has raised the issue of whether it should develop new reliability metrics in light of the increasing use of VRE for electricity generation.
In addition to its capacity supply assessment, NERC's Reliability Assessment Subcommittee should lead the electric industry in developing a common approach and identify metrics to assess energy adequacy. As identified in this assessment, the changing resource mix can alter the energy and availability characteristics of the generation fleet. Additional analysis is needed to determine energy sufficiency, particularly during off-peak periods and where energy-limited resources are most prominent.54
Congress could choose to provide guidance for FERC and NERC activities in this area.
Congress could also assess whether the existing regulatory framework is sufficient to maintain reliability if generation from wind and solar sources increase above current projections. One area of discussion is the siting and approval of transmission projects, particularly those that might result in enhanced availability of wind and solar sources for system balancing. Currently, the siting of electricity transmission facilities is largely left to the states. Section 1221 of EPACT05 directs FERC to issue permits for the construction or modification of transmission facilities in certain circumstances in areas designated by the Secretary of Energy as "National Interest Electric Transmission Corridors." This authority was to be exercised only if the relevant state agency lacks the authority to permit the transmission facilities or has "withheld approval for more than one year." Shortly after passage of EPACT05, DOE set out to designate the National Interest Electric Transmission Corridors and FERC set up a framework for permitting transmission facilities on those corridors. However, federal courts vacated both agencies' actions, and neither agency has taken any significant action pursuant to their Section 1221 authority since that time.55
As noted above, most power outages occur on local electricity distribution systems, and these are regulated by state or local governments. Congress could consider expanding federal activities affecting distribution system reliability. This might involve studies of the factors (e.g., weather, aging infrastructure, VRE) that result in power outages. Such activities might also include federal financial support for projects or practices that improve reliability of distribution systems or encouraging new operational regimes such as independent distribution system operators (see earlier discussion of this issue in text box, "Distribution System Reliability").
Congress might also consider acting on the emerging and related issue of electric resilience. Some support for an enhanced federal role in electricity system resilience exists. For example, the National Academy recommends
Congress and the Department of Energy leadership should sustain and expand the substantive areas of research, development, and demonstration that are now being undertaken by the Department of Energy's Office of Electricity Delivery and Energy Reliability and Office of Energy Efficiency and Renewable Energy, with respect to grid modernization and systems integration, with the explicit intention of improving the resilience of the U.S. power grid.56
Many sources currently used to balance wind and solar have received federal financial support in the past, such as tax credits, grants to states or other entities, and DOE research programs. Congress might consider continuing or expanding this type of support if current activities affecting reliability were deemed insufficient.
Appendix. Key Reliability Concepts for Policymakers
Electric reliability encompasses short-term and long-term aspects as shown in Figure A-1. System operators and reliability planners, governed by reliability standards from the North American Electric Reliability Corporation (NERC), have different practices in place to address reliability over these various timescales.
|
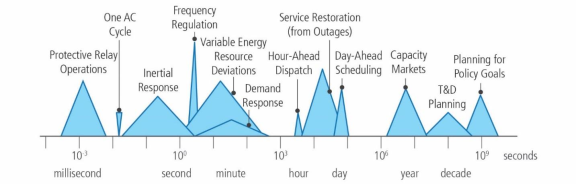 |
Notes: AC = alternating current; T&D = transmission and distribution systems. |
Reliability over Different Timescales
At the smallest timescales, typically seconds or less, are factors such as frequency control, voltage support, and ramping capability.57 These are often automatic responses of power system components. NERC refers to these factors as Essential Reliability Services (ERS), and they are sometimes called ancillary services. Historically, many ERS were provided as a natural consequence of the physical operational characteristics of steam turbines. Wind and solar generators do not inherently provide ERS in the same way. They require additional electrical components to do so, and these are being more commonly deployed. In some cases, FERC has mandated the use of technologies that allow wind and solar to provide ERS.58
Balancing, described in the main body of this report, typically occurs over minutes to hours. Unlike ERS, balancing typically requires action by a system operator.
Long-term aspects of reliability relate to planning for energy and transmission needs over months to years. This is sometimes referred to as resource adequacy. Policy goals, such as preferences for certain electricity sources over others, tend to influence long-term reliability planning more than shorter-term reliability aspects.
Planning for resource adequacy involves forecasts of electricity supply and demand. For variable renewable energy (VRE) like wind and solar sources, these forecasts require assumptions about wind and solar availability. Reliability planners commonly use planning reserve margins to assess whether planned generation and transmission capacity will be sufficient to supply electricity demand. A planning reserve margin is the difference between expected peak demand and available generating capacity at the peak period in each forecast year.59 It is often expressed as a percentage where the difference is normalized by the peak demand value. According to NERC, reserve margins "in the range of 10-18 percent" are typically sufficient for ensuring reliability, although "by itself the expected Planning Reserve Margin cannot communicate how reliable a system is."60 Reserve margins are calculated months or years ahead as part of assessments of whether and where reliability concerns might exist. High planning reserve margins may indicate a likelihood that reliability will be maintained, but, especially when variable sources are present, they might not be predictive. That is, a high planning reserve margin does not guarantee reliability and a low planning reserve margin does not guarantee power disruptions.
At the national level, NERC annually assesses resource adequacy over a 10-year forecasting window. NERC uses historic VRE generation data in its assessment and has noted "methods for determining the on-peak availability of wind and solar are improving with growing performance data."61 In its 2018 Long-Term Reliability Assessment, NERC recommended enhancing its reliability assessment process to account for events, like those noted in the "Changing Electricity Generation Profile" section above, during which VRE sources provided large shares of generation during off-peak periods.62
Solar eclipses, though rare events, provide opportunities to test the ability of grid operators to reliably operate the grid when solar sources are unavailable. The August 21, 2017, solar eclipse that affected many parts of the United States was one such opportunity. According to NERC, no reliability issues developed during the event, in part because of the measures implemented in advance by the electric industry.63
Electric Reliability Regulatory Framework
Current electric reliability planning is a coordinated process involving multiple entities and spanning multiple jurisdictions. These reliability planning organizations share responsibility for, among other responsibilities, ensuring electricity from wind and solar sources are reliably integrated into the power system. Table A-1 summarizes these entities and their responsibilities.
|
Entity Name |
Selected Reliability Activities |
Enforcement Mechanism |
Oversight Mechanism |
Notes |
|
Federal Energy Regulatory Commission (FERC) |
Approves new or modified reliability standards proposed by NERC and conducts enforcement activities. |
FERC can enforce compliance plans, reliability enhancements, and impose civil penalties for violations of reliability standards. |
Commissioners are nominated by the President and confirmed by the Senate. |
Pursuant to EPACT05, FERC may approve reliability standards that are developed by NERC. FERC rules for investigating potential violations of reliability standards are codified in 18 C.F.R. §1b |
|
North American Electric Reliability Corporation (NERC) |
Sets reliability standards for industry and annually assesses long-term (10-year) resource adequacy. |
NERC files Notices of Penalty with FERC. |
Independent board oversees NERC. FERC may direct NERC to revise reliability standards. |
FERC certified NERC as the Electric Reliability Organization (ERO) in 2006. EPACT05 specifies duties of the ERO regarding reliability standards. |
|
Regional Entity |
Monitors and enforces compliance with NERC reliability standards. |
Can recommend penalties on entities that violate reliability standards and/or fail to mitigate any violations. |
NERC can hear appeals in case of disputed violations. |
EPACT05 allows NERC to delegate some responsibilities to Regional Entities. Older documents may refer to eight regional entities, but in 2018 the Southwest Power Pool Regional Entity ceased operations and its members transferred into other regional entities, leaving seven regional entities. |
|
Balancing Authority (BAs) |
Maintains real time power system reliability in response to system conditions. |
Enforcement conducted by appropriate Regional Entity. |
Mostly conducted at the local or regional level. |
BAs as separate entities are not required by law. Instead, NERC reliability standards require BAs to ensure that electricity supply and demand are balanced in real time. Entities voluntarily register to take on these duties. All of the RTOs act as BAs. |
|
Public Utilities Commissions (PUCs) |
In some states PUCs approve power system investments, including those related to power system reliability. PUCs have exclusive jurisdiction over distribution system reliability. |
Could include imposing penalties or denying cost recovery for damages associated with poor reliability. |
Some state utilities commissioners are appointed by governors; others are elected. |
Some state policies, including those supporting wind and solar energy development, might have consequences for reliability. Some states are considering adoption of performance-based rates to provide financial incentives to utilities with positive reliability performance. |
Source: CRS analysis.
Notes: Other entities, including generator operators, transmission operators, and reliability coordinators are involved in reliability planning, but their activities are not shown here. Each of those entities has a different scope of function in maintaining power system reliability. A full list of the roles of power system entities in maintaining reliability is available in the NERC Reliability Functional Model at https://www.nerc.com/pa/Stand/pages/functionalmodel.aspx.
In the Energy Policy Act of 2005 (EPACT05; P.L. 109-58), Congress gave FERC responsibility for reliability of the grid through the setting and enforcement of electric reliability standards.64 These standards are developed by NERC and approved by FERC in the United States.65 NERC has set over 100 reliability standards that cover all timescales of reliability planning.66
Congress gave NERC authority to enforce reliability standards in EPACT05. Per statute, NERC has delegated this authority to the Regional Entities shown in Figure A-2. The jurisdiction for enforcing compliance with reliability standards includes "all users, owners and operators of the bulk-power system" within the contiguous United States.67
|
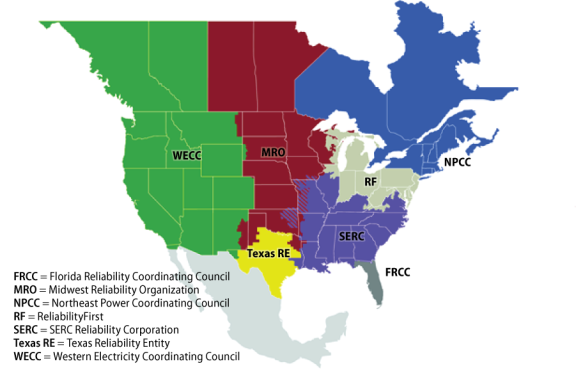 |
Notes: The multicolored areas represent areas where some entities are members of MRO and some entities are members of SERC. Alaska and Hawaii are not shown because mandatory reliability standards do not apply in those states. |
Separate from the tasks of setting and enforcing reliability standards is the task of reliably operating the power system in real time. Per NERC's reliability standards, balancing authorities carry most of the responsibility for matching generation levels with electricity demand. Balancing authorities can have different geographic footprints. RTOs act as balancing authorities and they may have a footprint spanning multiple states. Other balancing authorities might have a footprint spanning an area within a single state. Another class of entities with operational responsibilities are reliability coordinators. A reliability coordinator may operate over larger geographic areas than balancing authorities and can overrule real-time decisions by balancing authorities to preserve the larger scale power system reliability. RTOs typically also act as reliability coordinators. NERC has certified 66 balancing authorities and 11 reliability coordinators in the United States.68
Author Contact Information