Deferred Maintenance of Federal Land Management Agencies: FY2013-FY2022 Estimates and Issues
Changes from April 30, 2019 to November 30, 2021
This page shows textual changes in the document between the two versions indicated in the dates above. Textual matter removed in the later version is indicated with red strikethrough and textual matter added in the later version is indicated with blue.
Deferred Maintenance of Federal Land Management Agencies: FY2009-FY2018 Estimates and Issues
Contents
- Introduction
- Estimates
- FY2018
- Overview of Decade (FY2009-FY2018)
- Changes in Estimates in Current and Constant Dollars
- Agency Shares of Deferred Maintenance in Current and Constant Dollars
- Issues in Analyzing Deferred Maintenance
- Methodology
- Funding
- Assets
Figures
- Figure 1. Change in Deferred Maintenance by Agency in Current Dollars, FY2009-FY2018
- Figure 2. Change in Deferred Maintenance by Agency in 2018 Constant Dollars, FY2009-FY2018
- Figure 3. Deferred Maintenance Total by Agency in Current Dollars, FY2009-FY2018
- Figure 4. Deferred Maintenance Total by Agency in Constant Dollars, FY2009-FY2018
Summary
Deferred Maintenance of Federal Land
November 30, 2021
Management Agencies: FY2011-FY2020
Carol Hardy Vincent
Estimates and Issues
Specialist in Natural Resources Policy
Each of the four major federal land management agencies maintains tens of thousands of
diverse assets, including roads, bridges, buildings, and water management structures. These agencies are the Bureau of Land Management (BLM), Fish and Wildlife Service
(FWS), National Park Service (NPS), and Forest Service (FS). Congress and the Administration continue to Administrations have continued to focus on the agencies'’ deferred maintenance and repair of these assets—in essence, the cost of any maintenance or repair that was not done when it should have been or was scheduled to be done. Deferred maintenance and repair is oftensometimes is called the maintenance backlog.
In FY2018
In FY2020, the most recent year for which these estimates are available, the four agencies had combined deferred maintenance estimated at $19.3825.78 billion. This figure includes $11.92approximately $14.37 billion (6256%) in deferred maintenance for NPS, $5.2086 billion (2723%) for FS, $1.304.09 billion (716%) for FWSBLM, and $0.961.46 billion (56%) for BLM. FWS. The estimates reflect project costs.
Over the past decade (FY2009-FY2018), the total deferred maintenance for the four agencies fluctuated, peaking in FY2012 and ending the decade relatively flat in current dollars. It increased overall by $0.36 billion, from $19.02 billion to $19.38 billion, or 2%. Both the BLM and NPS estimates increased, whereas the FWS and FS estimates decreased. By contrast, in constant dollars, the total deferred maintenance estimate for the four agencies decreased from FY2009 to FY2018 by $3.61 billion, from $22.99 billion to $19.38 billion, or 16%. The BLM estimate increased, whereas estimates for the other three agencies decreased.
In each fiscal year, NPS had the largest portion of the total deferred maintenance, considerably more than any of the other three agencies. FS consistently had the second-largest share, followed by FWS and then BLM
From FY2011 to FY2020, total deferred maintenance for the four agencies increased in current dollars by $5.98 billion (30%), from $19.80 billion in FY2011 to $25.78 billion in FY2020. The estimates for BLM and NPS each increased by more than $3 billion, with a smaller increase for FS and a decrease for FWS. In constant dollars (FY2020 base year), total deferred maintenance for the four agencies increased over the 10-year period by $2.61 billion, from $23.17 billion to $25.78 billion (11%). Two agencies had overall increases: $3.62 billion (770%) for BLM and $1.45 billion (11%) for NPS. Two agencies had overall decreases: $1.88 billion (56%) for FWS and $0.59 billion (9%) for FS.
In both current and constant dollars, in each fiscal year, NPS had the largest portion of total deferred maintenance and FS had the second-largest share. FWS had the third-largest portion except in FY2020, when BLM moved from the fourth to the third spot due to a relatively large increase in estimated deferred maintenance. Throughout the past decade, the asset class that included roads comprised the largest portion of the four-agency combined deferred maintenance.
Congressional debate has focused on varied issues, including the level and sources of funds needed to reduce deferred maintenance, whether agencies are using existing funding efficiently, how to balance the maintenance of existing infrastructure with the acquisition of new assets, whether disposal of assets is desirable given limited funding, and the priority of maintaining infrastructure relative to other government functions.
Congress enacted P.L. 116-152, the Great American Outdoors Act, with up to $1.9 billion in new mandatory spending for deferred maintenance of the four agencies (and the Bureau of Indian Education) for each of FY2021-FY2025. This funding potentially could impact deferred maintenance estimates for FY2021 or subsequent years.
Some question why deferred maintenance estimates have fluctuated over time. These fluctuations are likely the result of many factors, among them the following:
-
Agencies have refined methods of defining and quantifying the maintenance needs of their assets.
- Levels of funding for maintenance, including funding to address the maintenance backlog, vary from year to year. Economic conditions, including costs of services and products, also fluctuate.
-
The asset portfolios of the agencies change, with acquisitions and disposals affecting the number,
type, size, age, and location of agency assets.
The extent to which these and other factors affected changes in each agency'’s maintenance backlog over the past decade is not entirely clear. In some cases, comprehensive information is not readily available or has not been examined.
Congressional Research Service
link to page 4 link to page 5 link to page 6 link to page 7 link to page 7 link to page 10 link to page 12 link to page 12 link to page 14 link to page 16 link to page 9 link to page 9 link to page 9 link to page 9 link to page 11 link to page 11 link to page 11 link to page 8 link to page 8 link to page 8 link to page 8 link to page 17 Deferred Maintenance of Federal Land Management Agencies
Contents
Introduction ..................................................................................................................................... 1 Deferred Maintenances Estimates ................................................................................................... 2
FY2020 ...................................................................................................................................... 3 Overview of Decade (FY2011-FY2020) ................................................................................... 4
Changes in Estimates in Current and Constant Dollars ...................................................... 4 Agency Shares of Deferred Maintenance in Current and Constant Dollars ....................... 7
Issues in Analyzing Deferred Maintenance ..................................................................................... 9
Methodologies Used by Agencies ............................................................................................. 9 Funding Amounts and Impacts ................................................................................................. 11 Asset Number, Condition, Acquisition, and Disposal ............................................................. 13
Figures Figure 1. Change in Deferred Maintenance by Agency in Current Dollars,
FY2011-FY2020 .......................................................................................................................... 6
Figure 2. Change in Deferred Maintenance by Agency in Constant Dollars,
FY2011-FY2020 .......................................................................................................................... 6
Figure 3. Deferred Maintenance Total by Agency in Current Dollars, FY2011-FY2020 ............... 8 Figure 4. Deferred Maintenance Total by Agency in FY2020 Constant Dollars,
FY2011-FY2020 .......................................................................................................................... 8
Tables Table 1. Estimated Deferred Maintenance by Agency in Current Dollars,
FY2011-FY2020 .......................................................................................................................... 5
Table 2. Estimated Deferred Maintenance by Agency in Constant Dollars,
FY2011-FY2020 .......................................................................................................................... 5
Contacts Author Information ........................................................................................................................ 14
Congressional Research Service
Deferred Maintenance of Federal Land Management Agencies
Introduction examined.
Introduction
Each of the four major federal land management agencies has maintenance responsibility for tens of thousands of diverse assets in dispersed locations. These agencies are the Bureau of Land Management (BLM), Fish and Wildlife Service (FWS), and National Park Service (NPS), all within the Department of the Interior (DOI), and the Forest Service (FS), within the Department of Agriculture. These agencies maintain assets to preserve their functioning and to repair and replace components as needed.1
(see text box below).
Number and Type of Federal Land Management Agency Assets
The most recent available data from the four major federal land management agencies on assets they manage include the fol owing:
In FY2018, the Bureau of Land Management (BLM) managed 45,871 assets, including 4,335 buildings, 18,908 roads, and 22,628 structures.
In FY2018, the National Park Service (NPS) managed 76,039 assets, including 25,073 buildings; 3,690 housing units; 1,421 campgrounds; 6,273 trails; 1,831 wastewater systems; 1,530 other water systems; 5,537 unpaved roads; 11,988 paved roads; and 18,696 other assets. The NPS FY2022 budget justification reflected a similar figure of over 76,000 assets in total.
In FY2020, the Fish and Wildlife Service (FWS) managed over 44,000 assets, including 6,400 buildings; 17,500 roads, bridges, and trails; 8,700 water management assets; and 11,400 other real property assets.
In FY2020, the Forest Service (FS) managed nearly 30,000 recreation facilities; more than 39,000 buildings; more than 370,000 miles of roads, nearly 65,000 miles of which were operated for passenger vehicles; nearly 160,000 miles of trails; more than 13,000 road and trail bridges; more than 4,700 drinking water systems; more than 4,700 wastewater systems; and nearly 500 agency-owned dams.
Sources: BLM and NPS data for FY2018 from CRS discussions with U.S. Department of the Interior (DOI), Office of Budget, on April 22, 2019. For NPS, see also DOI, NPS, Budget Justifications and Performance Information, Fiscal Year 2022, p. ONPS-66, at https://www.doi.gov/budget/appropriations/2022. FWS data for FY2020 from DOI, FWS, Budget Justifications and Performance Information, Fiscal Year 2022, p. NWRS-22, at https://www.doi.gov/budget/appropriations/2022. Most FS data from U.S. Department of Agriculture (USDA), FS, FY2022 Budget Justification, p. 83, at https://www.fs.usda.gov/about-agency/budget-performance; FS data on roads operated for passenger vehicles from CRS discussions with USDA, FS, Legislative Affairs Office, September 21, 2021. Notes: CRS has not obtained the size, age, or location of each asset. For example, CRS has not obtained the square footage for the buildings or the size of the water systems and thus did not analyze the deferred maintenance relative to the size of each agency’s assets.
The infrastructure needs of the federal land management agencies have been a subject of significant federal and public attention for many years. Congressional and administrative attention has focused on deferred maintenance and repairs, defined as "“maintenance and repairs that were not performed when they should have been or were scheduled to be and which are put off or delayed for a future period."2 "”1 “Maintenance and repair"” include a variety of activities intended to preserve assets in an acceptable condition, including activities such as preventive maintenance and replacement of parts, systems, and components. These terms do not include activities intended to expand the capacity of assets to allow them to serve different purposes or significantly increased needs.3
2
1 This definition is taken from the Statement of Federal Financial Accounting Standards 42: Deferred Maintenance and Repairs, p. 1443 (pdf) of the FASAB Handbook of Federal Accounting Standards and Other Pronouncements, as Amended, available on the website of the Federal Accounting Standards Advisory Board at https://files.fasab.gov/pdffiles/2021_%20FASAB_%20Handbook.pdf.
2 Ibid., p. 1443.
Congressional Research Service
1
Deferred Maintenance of Federal Land Management Agencies
Deferred maintenance and repairs often are called the maintenance backlog. The agencies assert that continuing to defer the maintenance and repair of facilities accelerates the rate of these facilities'facilities’ deterioration, increases their repair costs, and decreases their value. Debate has focused on varied issues, including the level of funds needed to reduce deferred maintenance, whether agencies are using existing funding efficiently, the priority of deferred maintenance relative to regular maintenance, and whether additional sources of funds should be directed to maintenance. 3 Other issues include how to balance the maintenance of existing infrastructure with the acquisition of new assets, whether disposal of assets is desirable given limited funding, and how much to prioritize maintaining infrastructure relative to other government functions.
Another issue relates to the dollar amount of deferred maintenance and the reasons for fluctuations over time. This report focuses on these issues. It first provides agency deferred maintenance estimates for FY2018FY2020, the most recent fiscal year for which this information is available. It alsonext discusses changes in deferred maintenance over the past decade (FY2009-FY2018) andestimates over 10 years, FY2011-FY2020.4 It then identifies some of the factors that likely contributed to these changes.
Estimates
Deferred Maintenances Estimates The agencies typically identify deferred maintenance through periodic condition assessments of facilities.4 FS currently reports5 For FY2020, FS reported an annual deferred maintenance dollar total composed of estimates for 10 classes of assets. These classes include roads, buildings, trails, bridges, and and drinking water systems, among others.5 DOI 6 DOI agencies currently reportsreport annual deferred maintenance composed of estimates for four broad categories of assets: (1) roads, bridges, and trails; (2) irrigation, dams, and other water structures; (3) buildings; and (4) other structures. The "other structures"“other structures” category includes a variety of assets (e.g., recreation sites and hatcheries).
For each of the 10 years covered by this report, FS has reported the amount of deferred maintenance as a single figure rather than a range, as DOI agencies had done prior to FY2015. DOI agencies began reporting deferred maintenance as a single figure in FY2015.6 In prior years7 Prior to FY2015, DOI agencies reported estimates as a range. For FY2014, for instance, the range had an "“accuracy level of minus 15 percent to plus 25 percent of initial estimate."7”8 According to DOI, a range had been used because "was used because, “due to the scope, nature, and variety of the assets entrusted to DOI, as well as the nature of deferred maintenance itself, exact estimates are very difficult to determine."8
FS estimates of deferred maintenance included in this report generally are taken from the agency's annual budget justifications to Congress.9 The DOI Budget Office provided the Congressional Research Service (CRS)”9
3 Beginning in FY2021, P.L. 116-152, the Great American Outdoors Act, provided a new source of mandatory funding for deferred maintenance, as discussed in the “Issues in Analyzing Deferred Maintenance” section of this report. 4 In this report, the 10-year period from FY2011 to FY2020 is sometimes referred to as a decade. 5 For a brief description of Forest Service (FS) condition assessments, see U.S. Department of Agriculture (USDA), 2020 Agency Financial Report, pp. 186-188. For a brief description of U.S. Department of the Interior (DOI) condition assessments, see DOI, Agency Financial Report 2020, p. 141.
6 For FY2020, the 10 asset classes were buildings, dams, drinking water systems, heritage, minor construction features, road bridges, roads, trail bridges, trails, and wastewater systems. This information was provided to CRS by the FS Legislative Affairs Office on June 10, 2021.
7 The change to a single figure resulted from revisions to federal financial accounting standards that took effect in FY2015. See the Statement of Federal Financial Accounting Standards 42: Deferred Maintenance and Repairs, in the FASAB Handbook of Federal Accounting Standards and Other Pronouncements, as Amended, available on the website of the Federal Accounting Standards Advisory Board at https://files.fasab.gov/pdffiles/2021_%20FASAB_%20Handbook.pdf.
8 DOI, Agency Financial Report, FY2014, p. 126. 9 Ibid, p. 126.
Congressional Research Service
2
Deferred Maintenance of Federal Land Management Agencies
FS estimates of deferred maintenance included in this report were taken from the agency’s annual budget justifications to Congress for FY2011-FY2015.10 The Forest Service Legislative Affairs Office provided the Congressional Research Service (CRS) with estimates for FY2016-FY2020. The DOI Budget Office provided CRS with a deferred maintenance range for each DOI agency for each fiscal year from FY2009FY2011 to FY2014. From these ranges, CRS calculated mid-range figures. For instance, DOI estimated NPS deferred maintenance for FY2014 at between $9.31 billion and $13.70 billion. The CRS-calculated mid-range figure is $11.50 billion.1011 This report reflects CRS'’s mid-range calculations for FY2009FY2011-FY2014 to facilitate comparison with FS estimates.11 12 Since FY2015, the DOI Budget Office has provided CRS with a single estimate for each DOI agency, and those figures are used in this report. TheyFor both DOI agencies and FS, the figures represent deferred maintenance as of the end of the fiscal year (i.e., September 30).12 For both FS and DOI agencies, the deferred maintenance estimates13 Also, they generally reflect project costs.1314 Finally, totals shown in the body and in tables of this report may not add to 100% due to rounding.
FY2018
FY2020 The four agencies had combined FY2018FY2020 deferred maintenance estimated at $19.38 billion.1425.78 billion.15 The agencies had widely varying shares of the total. NPS had the largest portion, 6256%, based on an estimate of $11.92 billion.1514.37 billion.16 The FS share was 2723% of the total, with an estimated deferred maintenance of $5.2086 billion. The FWSBLM portion was 7%, reflecting the agency's deferred maintenance of $1.30 billion. BLM16%, based on a backlog estimate of $4.09 billion. The FWS had the smallest share, 5%, based on a backlog estimate of $0.96 billion.
Each agency'6%, reflecting the agency’s deferred maintenance of $1.46 billion.
Each agency’s deferred maintenance estimate for FY2018FY2020 consisted of various components. For FS, the single largest asset class was roads, which comprised 6160% of the FY2018FY2020 total of $5.20 86 billion. The next largest asset class was buildings, which represented 2422% of the FS FY2018 FY2020 total. The next two largest asset classes were trails androad bridges, eachwith 6% and trails, with 5%. Six other asset classes made up the remaining 6%.
8%.
For NPS, the largest asset category was roads, bridges, and trails, which comprised 57% of the FY2018FY2020 deferred maintenance total of $11.9214.37 billion. The buildingsother structures category comprised 1920% of the total, followed by 18% for other structures and 616% for buildings, and 7% for irrigation, dams, and other water structures.
Roads, bridges, and trails also reflected the largest share of BLM's FY2018’s FY2020 deferred maintenance, with 6988% of the $0.964.09 billion total. TwoThree other categories of assets had relatively comparable portions, specifically 14% for buildings and 12% for other structures. The remaining 6% was 10 For instance, the FY2015 deferred maintenance estimate was taken from USDA, FS, Fiscal Year 2017 Budget Justification, p. 411, at https://www.fs.fed.us/about-agency/budget-performance.
11 CRS calculated this mid-range figure as the average of the high and low estimates. 12 In addition, policy discussions of agency deferred maintenance commonly have referred to a single mid-range estimate, as shown in this report.
13 The DOI Budget Office has provided deferred maintenance information to CRS periodically throughout the decade. These estimates are generally based on DOI financial reports and may differ from figures reported by the agencies independently. In particular, in some years the National Park Service (NPS) has independently reported estimates that differ from those reflected in agency financial reports, as they have included assets that are not owned by the NPS but for which the agency has maintenance responsibility.
14 Estimates do not reflect indirect costs, such as salaries and benefits for government employees. 15 For comparison, the four agencies combined had FY2020 regular discretionary appropriations of $13.85 billion and FY2020 total budget authority (including emergency appropriations and mandatory appropriations) of $16.74 billion.
16 For additional information on NPS deferred maintenance, see CRS Report R44924, National Park Service Deferred Maintenance: Frequently Asked Questions, by Laura B. Comay.
Congressional Research Service
3
link to page 8 link to page 9 link to page 9 link to page 12 link to page 8 link to page 9 Deferred Maintenance of Federal Land Management Agencies
small portions, specifically 6% for buildings, 4% for other structures, and 3% for irrigation, dams, and other water structures.
Roads, bridges, and trails made up the smallest portion of FWS's FY2018’s FY2020 deferred maintenance ($1.3046 billion), unlike for the other agencies. Moreover, the four asset categories had roughly comparable portions, as follows: 2728% for buildings; 27% for other structures; 24other structures; 27% for buildings; 26% for irrigation, dams, and other water structures; and 2220% for roads, bridges, and trails.
Overview of Decade (FY2009-FY2018)
FY2011-FY2020) Changes in Estimates in Current and Constant Dollars
As shown inin Table 1 and Figure 1, in current dollars,1617 the total deferred maintenance estimate for the four agencies showed considerable variation over the 10-year period from FY2009-FY2018,17 with a peak in FY2012.18 It ended the decade relatively flat, with an increase of $0.36 billion overall, from $19.02 billion to $19.38 billion, or 2%. Both the BLM and NPS estimates increased, by $0.42 billion (80%) and $1.75 billion (17%), respectively. By contrast, both the FWS and FS estimates decreased, by $1.71 billion (57%) and $0.11 billion (2%), respectively.
FY2011-FY2020.18 Deferred maintenance was at a low in FY2017 ($18.39 billion) and a high in FY2020 ($25.78 billion). From the start of the decade, deferred maintenance increased overall by $5.98 billion (30%), from $19.80 billion in FY2011 to $25.78 billion in FY2020. The estimates for BLM and NPS each increased by more than $3 billion. Specifically, BLM had a more than nine-fold increase of $3.69 billion (923%), primarily from an increase in the roads, bridges, and trails category in FY2020. NPS had an increase of $3.33 billion (30%), in large part due to an increase in the roads, bridges, and trails category during the period. The FS estimate also increased, by $0.35 billion (6%). By contrast, the FWS estimate decreased over the decade by $1.39 billion (49%).
Within these overall changes, there was considerable variation among agency trends. The NPS estimate increased fairly steadily for several years, fell in FY2016, then rose again. The FS estimate was similar at the beginning and end of the decade, although it fluctuated between $5.10 billion and $6.03 billion throughout the 10-year period. The BLM estimate also fluctuated, falling in the first few years of the decade, then rising, leveling off, and rising again to a new high at the end of the decade. The FWS estimate had a generally steady decline duringBLM estimate increased relatively gradually throughout most of the period but ended with a steep increase from FY2019 to FY2020. The NPS estimate increased fairly steadily for several years, fell in FY2016, then rose again each year thereafter, with the largest increase (in both dollars and percentage) from FY2019 to FY2020. The FWS estimate generally declined steadily for the first several years, leveled off somewhat after FY2015, and reached a decade low in FY2018. The FS estimate fluctuated between $5.00 billion and $6.03 billion throughout the 10-year period, with an increase each year since FY2017. Figure 1 depicts the annual changes in current dollars for each agency and for the four agencies combined. Factors that might have contributed to the changes are discussed in the "“Issues in Analyzing Deferred Maintenance" ” section, below.
By contrast, as
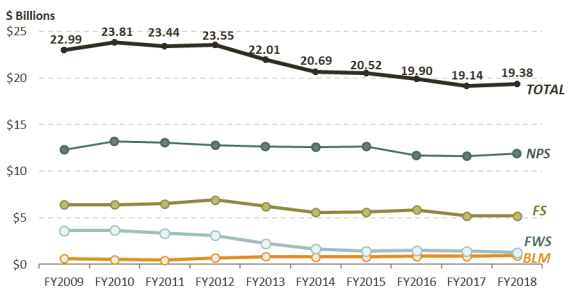
As shown in Table 2 and Figure 2, in FY2020 in constant dollars,1919 the total deferred maintenance estimate for the four agencies decreasedincreased over the course of the ten10-year period by $32.61 billion, from $22.9923.17 billion to $19.3825.78 billion, or 16%. Three11% (as compared with a 30% increase in current dollars). Two agencies had overall decreases: $0.37increases: $3.62 billion (3770%) for NPS, $1.22BLM and $1.45 billion (19%) for FS, and $2.34 billion (64%) for FWS. However, the BLM estimate increased by $0.32 billion (50%) over the 10-year period.
(11%) for NPS. Two agencies had overall decreases: $1.88 billion (56%) for FWS and $0.59 billion (9%) for FS.
As was the case for current-dollar estimates, the overall changes in constant dollars reflected various fluctuations. The BLM estimate fell and rose during the period, with the lowest estimate in FY2011 and the highest at the end (FY2018). The FWS estimate exceeded $3 billion for each of the first fourincreased gradually throughout most of the period but increased sharply from FY2019 to FY2020. The NPS estimate decreased gradually for several years, fell in FY2016, and then increased each year thereafter. The largest increase was from
17 “Current dollar” figures have not been adjusted for inflation. 18 For DOI agencies, for each year from FY2009 to FY2014, CRS calculated a mid-range deferred maintenance figure based on the average of the high and low estimates provided by DOI to CRS. This report reflects CRS’s mid-range calculations for these years, as previously noted.
19 “Constant dollar” figures have been adjusted for inflation, with FY2020 as the base year.
Congressional Research Service
4
link to page 9 link to page 8 Deferred Maintenance of Federal Land Management Agencies
FY2019 to FY2020. The FWS estimate exceeded $3 billion for each of the first two years before dropping to about half that amount by the middle of the decade. Thereafter, the estimate declined gradually through FY2019, then rose relatively modestly in FY2020. The FS estimate rose and fell throughout the 10-year period, fluctuating between $5.28 billion and $6.93 billion. The first three years had the highest estimates, each exceeding $6.00 billiondropping steeply over the next six years to roughly one-third of the FY2009 level. The NPS estimate peaked in FY2010, then mainly declined, until increasing in FY2018. The FS estimate exceeded $6 billion for the first half of the 10-year period. It ranged roughly between $5 billion and $6 billion during the second half of the period, reaching a low of $5.20 billion in both FY2017 and FY2018. Figure 2 depicts the annual changes in constant dollars for each agency and for the four agencies combined.
Table 1. Estimated Deferred Maintenance by Agency in Current Dollars, FY2009-FY2018
FY2011-FY2020
(in billions of current dollars)
Agency
FY2011 FY2012 FY2013 FY2014 FY2015 FY2016 FY2017 FY2018 FY2019 FY2020
BLM
0.40
0.61
0.74
0.74
0.75
0.81
0.84
0.96
1.09
4.09
FWS
2.85
2.70
2.01
1.53
1.33
1.40
1.38
1.30
1.33
1.46
NPS
11.04
11.16
11.27
11.50
11.73
10.93
11.18
11.92a
12.71
14.37
FS
5.51
6.03
5.56
5.10
5.20
5.49
5.00
5.20
5.22
5.86
Total
19.80
20.50
19.58
18.87
19.02
18.62
18.39
19.38
20.35
25.78
Sources: Estimates for FS were taken from the annual budget justification to Congress for FY2011-FY2015 and were provided by FS for FY2016-FY2020. Estimates for Department of the Interior (DOI) agencies for FY2011-FY2014 were calculated by CRS based on deferred maintenance ranges provided by the DOI Budget Office; DOI agency estimates for FY2015-FY2020 were provided by the DOI Budget Office. (in billions of current dollars)
|
Agency |
FY2009 |
FY2010 |
FY2011 |
FY2012 |
FY2013 |
FY2014 |
FY2015 |
FY2016 |
FY2017 |
FY2018 |
|
BLM |
0.53 |
0.44 |
0.40 |
0.61 |
0.74 |
0.74 |
0.75 |
0.81 |
0.84 |
0.96 |
|
FWS |
3.01 |
3.02 |
2.85 |
2.70 |
2.01 |
1.53 |
1.33 |
1.40 |
1.38 |
1.30 |
|
NPS |
10.17 |
10.83 |
11.04 |
11.16 |
11.27 |
11.50 |
11.73 |
10.93 |
11.18 |
|
|
FS |
5.31 |
5.27 |
5.51 |
6.03 |
5.56 |
5.10 |
5.20 |
5.49 |
5.00 |
5.20 |
|
Total |
19.02 |
19.56 |
19.80 |
20.50 |
19.58 |
18.87 |
19.02 |
18.62 |
18.39 |
19.38 |
Sources: Estimates for FS were taken from the annual budget justification to Congress, except that the FY2016-FY2018 estimates were provided by the FS. Estimates for Department of the Interior (DOI) agencies for FY2009-FY2014 were calculated by CRS based on deferred maintenance ranges provided by the DOI Budget Office; estimates for FY2015-FY2018 were provided by the DOI Budget Office.
Notes: BLM = Bureau of Land Management; FWS = Fish and Wildlife Service; NPS = National Park Service; FS = Forest Service.
a. This figure differs from NPS estimates for prior years, because it includes assets that are not owned by the
NPS but for which the agency has maintenance responsibility. Excluding these assets, the FY2018 estimate for NPS was $11.50 billion.
bil ion.
Table 2. Estimated Deferred Maintenance by Agency in Constant Dollars, FY2009-FY2018
FY2011-FY2020
(in billions of 2018FY2020 constant dollars)
Agency
FY2011
FY2012 FY2013 FY2014 FY2015
FY2016
FY2017 FY2018 FY2019 FY2020
BLM
0.47
0.70
0.83
0.81
0.81
0.89
0.90
0.99
1.10
4.09
FWS
3.34
3.10
2.26
1.68
1.67
1.53
1.48
1.35
1.35
1.46
NPS
12.92
12.83
12.67
12.63
12.56
11.94
11.99
12.35
12.87
14.37
FS
6.45
6.93
6.25
5.60
5.57
6.00
5.36
5.39
5.28
5.86
Total
23.17
23.57
22.02
20.72
20.61
20.35
19.72
20.08
20.60
25.78
Sources: Current dol ar estimates for FS were taken from the annual budget justification to Congress for FY2011-FY2015 and were provided by FS for FY2016-FY2020. Current dol ar constant dollars)
|
Agency |
FY2009 |
FY2010 |
FY2011 |
FY2012 |
FY2013 |
FY2014 |
FY2015 |
FY2016 |
FY2017 |
FY2018 |
|
BLM |
0.64 |
0.54 |
0.47 |
0.70 |
0.83 |
0.81 |
0.81 |
0.87 |
0.87 |
0.96 |
|
FWS |
3.64 |
3.68 |
3.37 |
3.10 |
2.26 |
1.68 |
1.43 |
1.50 |
1.44 |
1.30 |
|
NPS |
12.29 |
13.18 |
13.07 |
12.82 |
12.67 |
12.61 |
12.65 |
11.68 |
11.64 |
11.92 |
|
FS |
6.42 |
6.42 |
6.52 |
6.93 |
6.25 |
5.59 |
5.61 |
5.87 |
5.20 |
5.20 |
|
Total |
22.99 |
23.81 |
23.44 |
23.55 |
22.01 |
20.69 |
20.52 |
19.90 |
19.14 |
19.38 |
Sources: Current dollar estimates for FS were taken from the annual budget justification to Congress, except that the FY2016-FY2018 estimates were provided by the FS. Current dollar estimates for Department of the Interior (DOI) agencies for FY2009FY2011-FY2014 were calculated by CRS based on deferred maintenance ranges provided by the DOI Budget Office; DOI agency estimates for FY2015-FY2018FY2020 were provided by the DOI Budget Office.
Amounts in 2018 constant dollarsFY2020 constant dol ars were calculated by CRS using U.S. Department of Commerce, Bureau of Economic Analysis, Table 3.9.4, "“Price Indexes for Government Consumption Expenditures and Gross Investment,"” for nondefense structures, annual indexes, at https://apps.bea.gov/iTable/iTable.cfm?reqid=19&step=2#reqid=19&step=2&isuri=1&1921=survey.
. Notes: BLM = Bureau of Land Management; FWS = Fish and Wildlife Service; NPS = National Park Service; FS = Forest Service.
Congressional Research Service
5
Deferred Maintenance of Federal Land Management Agencies
Figure 1. Change in Deferred Maintenance by Agency in Current Dollars,
FY2011-FY2020
Sources: Estimates for FS were taken from the annual budget justification to Congress for FY2011-FY2015 and were provided by FS for FY2016-FY2020Forest Service.
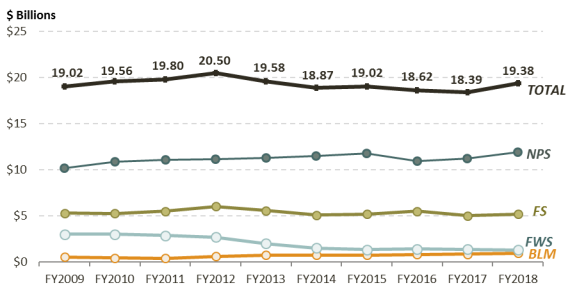
Figure 2. Change in Deferred Maintenance by Agency in |
 |
Constant Dollars,
FY2011-FY2020
Sources: Current Amounts in . Notes: BLM = Bureau of Land Management; FWS = Fish and Wildlife Service; NPS = National Park Service; FS = Forest Service. |
Agency Shares of Deferred Maintenance in Current and Constant Dollars
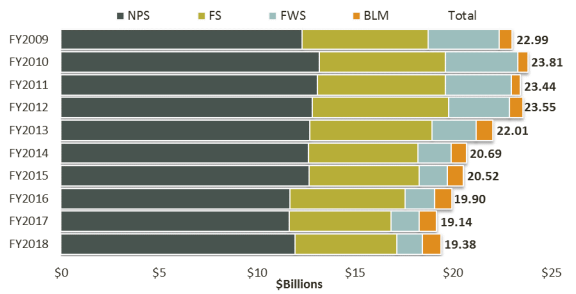
Throughout the decade, agency shares of the deferred maintenance totals differed, as shown in Figure 3 and Figure 4. InIn both current and constant dollars, in each fiscal year NPS had the largest portion of total deferred maintenance and considerably more than any other agency. FS consistently had the second-largest share, followed by FWS and then BLM. Moreover, in both current and constant dollars, each agency's. FWS had the third-largest portion of total deferred maintenance in each year except FY2020, when BLM assumed the third spot due to a relatively large increase in estimated deferred maintenance. Until FY2020, BLM had the smallest portion of the total annual deferred maintenance changed over the decade. Specifically, the NPS portion of the annual total grew overall throughout the period, from 53% in FY2009 to 62% in FY2018. By contrast, the FS share of the total decreased over the 10-year period from 28% to 27%. The FWS component also declined, from 16% to 7%, whereas the BLM portion rose from 3% to 5%.20
The asset class or category that included roads typically comprised the largest portion of each agency'sdeferred maintenance, though the difference with the FWS had narrowed in recent years.
The NPS portion of the total annual deferred maintenance was the same at the start and the end of the 10-year period—56%. Both FS and FWS had declining shares over the decade. The FS share decreased from 28% in FY2011 to 23% in FY2020, and the FWS share dropped from 14% to 6%. By contrast, the BLM portion rose from 2% in FY2011 to 16% in FY2020.20
During the decade, the asset class that included roads comprised the largest portion of the four agencies’ combined deferred maintenance. Roads represented the largest portion of FS deferred maintenance from FY2009 to FY2018FY2011 to FY2020. Over the 10-year period, the NPS roads, bridges, and trails category had the highest share of the agency'’s deferred maintenance, and irrigation, dams, and other water structures had the smallest. In some years, the portion of NPS deferred maintenance for the "other structures" category exceeded the buildings portion, but in some years the reverse was the case. Roads, bridges, and trails also was the biggest category of BLM's deferred maintenance from FY2009 to FY2018. Although this category typically represented a majority of the FWS total deferred maintenance in the earlier part of the period, this has not been the case since FY2013. A decline in the dollar estimate for roads, bridges, and trails resulted in a sizeable drop in overall FWS deferred maintenance beginning in FY2013, as discussed below.
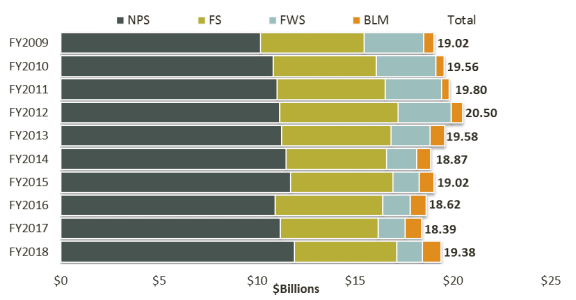
Figure 4. Deferred Maintenance Total by Agency in FY2020 Constant Dollars,
FY2011-FY2020
Sources: Current dol ar |
 |
Amounts in . Notes: BLM = Bureau of Land Management; FWS = Fish and Wildlife Service; NPS = National Park Service; FS = Forest Service. |
Issues in Analyzing Deferred Maintenance
Fluctuations in deferred maintenance estimates are likely the result of many factors, among them estimation methods, levels of funding, and asset portfolios, as discussed below. The extent to which these and other factors affected year-to-year changes in any one agency'’s maintenance backlog during the decade backlog is unclear, in part because comprehensive information is not readily available in all cases or has not been examined. Therefore, the data in this report may not fully explain the changes in deferred maintenance estimates over time.
Methodology
Methodologies Used by Agencies Methods for assessing the condition of assets and estimating deferred maintenance have changed over the years. As a result, it is unclear what portion of the change in deferred maintenance estimates is due to the addition of maintenance work that was not done on time and what portion may be due to changes in methods of assessing and estimating deferred maintenance.
During the past decade, the four federal land management agencies altered methods for estimating the deferred maintenance of roads, as shown in the following examples. Most recently, a BLM change in road methodology led to an increase in the deferred maintenance for roads, bridges, and trails category of $2.89 billion (408%), from $0.71 billion in FY2019 to $3.59 billion in FY2020. The increase in this category mirrors the roughly four-fold increase in BLM’s total deferred maintenance from FY2019 to FY2020. BLM’s methodology change stemmed from a Department of Transportation determination that BLM’s methodology differed from that used by most other agencies, according to DOI and BLM.21 BLM had been focusing on discrete road deficiencies (e.g., potholes) rather than on overall road condition and performance. Beginning in FY2020, BLM implemented the Pavement Surface Evaluation Rating (PASER) system, regarded as an industry standard tool for assessing overall road condition.22 BLM made related changes to evaluate every surface road (rather than a subset) and to enter data into the new system in a more timely way. However, BLM’s FY2020 estimate of deferred maintenance of roads was based on modeling and is expected to be updated in FY2021 following actual road assessments. This update could contribute to a change in the estimate, according to DOI and BLM.23
The other three land management agencies changed road evaluation methods in earlier years. The FY2015 FWS budget justification states that
[i]n 2012, Service leadership concluded that condition assessment practices and policies in place at that time were unintentionally producing higher than appropriate [deferred
21 CRS consultation with DOI and BLM staff on June 16, 2021. 22 See DOI, BLM, Budget Justifications and Performance Information, Fiscal Year 2020, p. VI-127, at https://www.doi.gov/sites/doi.gov/files/uploads/fy2020_blm_budget_justification.pdf.
23 Information in this paragraph was derived from a CRS consultation with DOI and BLM staff on June 16, 2021.
Congressional Research Service
9
Deferred Maintenance of Federal Land Management Agencies
maintenance (DM)] cost estimates for some types of constructed real property. DM estimates for our extensive inventory of gravel and native surface roads are a major may be due to changes in methods of assessing and estimating deferred maintenance. With regard to facility assessment, agencies have enhanced efforts to define and quantify the maintenance needs of their assets. Efforts have included collecting comprehensive information on the condition of facilities and maintenance and improvement needs. For instance, the first cycle of comprehensive condition assessments of NPS industry-standard facilities21 was completed at the end of FY2006. However, through at least FY2018, NPS continued to develop business practices to estimate the maintenance needs of nonindustry-standard assets.22 This category presents particular challenges because it includes unique asset types.23
Alterations in methodology have contributed to changes in deferred maintenance estimates, as shown in the following examples for roads. The FY2015 FWS budget justification states that
[i]n 2012, Service leadership concluded that condition assessment practices and policies in place at that time were unintentionally producing higher than appropriate [deferred maintenance (DM)] cost estimates for some types of constructed real property. DM estimates for our extensive inventory of gravel and native surface roads are a major contributor to this challenge. In response, the FWS is refining its practices and procedures to improve consistency of DM cost estimates and their use in budget planning. Significant reductions in the DM backlog are resulting from this effort.24
24
Subsequent FWS budget justifications have elaborated on changes to methods of estimating deferred maintenance for roads. For instance, the FY2017 document states that ", “deferred maintenance estimates for our extensive inventory of roads were further classified to emphasize public use and traffic volume. As a result, minimally used administrative roads are now generally excluded from contributing to deferred maintenance backlog calculations."25”25 Of note is that the roads, bridges, and trails category of FWS deferred maintenance declined substantially (by $1.18 17 billion, 8180%) in the past several years in current dollars, from $1.46 billion in FY2012 to $0.28 29 billion in FY2018FY2020. This decline is reflected in the smaller FWS deferred maintenance total for FY2018 ($1.30FY2020 ($1.46 billion). The FWS change in the method of estimating deferred maintenance for roads, bridges, and trails appears to be a primary reason for the decreased estimate for this category and total FWS deferred maintenance over the 10-year period.
Similarly, FS attributes variations in deferred maintenance partly to changes in the methodology for estimating roads.2626 For example, in FY2013 and FY2014, FS adjusted the survey methodology for passenger-car roads, with the goal of providing more accurate estimates of the roads backlog.2727 The FS estimate of deferred maintenance for roads fell in current dollars by $0.84 billion (22%) from FY2012 to FY2014, from $3.76 billion to $2.92 billion.2828 The extent to which the drop is attributable to changes in methodology, including regarding the types of roads reflected in the estimates, is not certain.29
29
Finally, in FY2014, the NPS first reflected deferred maintenance for unpaved roads as part of its total deferred maintenance estimate (in agency financial reports). The agency'’s total deferred maintenance increased in current dollars by $0.26 billion (4%) from FY2013 to FY2014, from $6.57 billion to $6.83 billion. DOI cited the inclusion of unpaved roads as among the reasons for changes in NPS deferred maintenance estimates,3030 although the extent of the effect on NPS estimates is unclear.
In addition to these changes pertaining to roads, broader changes in methodology for assessing asset condition occurred during the decade. For example, DOI agencies had been using an
24 DOI, FWS, Budget Justifications and Performance Information, Fiscal Year 2015, p. NWR-30. 25 DOI, FWS, Budget Justifications and Performance Information, Fiscal Year 2017, p. NWRS-36. 26 Phone communication between CRS and FS staff on March 17, 2015, and FS annual budget justifications. 27 Information provided to CRS by the FS Legislative Affairs Office on March 13, 2015. 28 Other years during the decade had varying amounts of increase or decrease in the roads backlog related to prior years.
29 More recently, the FS again modified its method of estimating deferred maintenance of roads, in response to a 2017 audit report that expressed concerns about the random sampling approach that was in use. The change was noted in USDA, FS, Fiscal Year 2020 Budget Justification, p. 87, at https://www.fs.fed.us/sites/default/files/media_wysiwyg/usfs-fy-2020-budget-justification.pdf. For a discussion of the audit findings on the random sampling method, see USDA, Office of Inspector General, Audit Report 08601-0004-31, Forest Service Deferred Maintenance, May 2017, pp. 27-28. Hereinafter cited as USDA OIG 2017 FS Audit.
Additional examples of FS changes in roads methodology that appear to have affected deferred maintenance estimates pertain to years earlier than the 10-year period reflected in this report (e.g., changes first reflected in estimates for FY2007 and FY2008).
30 Information provided to CRS by the DOI Budget Office on February 27, 2015.
Congressional Research Service
10
Deferred Maintenance of Federal Land Management Agencies
accuracy range of -15% to +25% to derive the estimated range of deferred maintenance for industry-standard assets.31 The change from a range to a single estimate beginning in FY2015 would have affected DOI deferred maintenance estimates as reflected in this report.32
As another example, agencies have enhanced efforts to define and quantify the maintenance needs of their assets generally. Efforts have included collecting comprehensive information on the condition of facilities and maintenance and improvement needs. For instance, the first cycle of comprehensive condition assessments of NPS industry-standard facilities was completed at the end of FY2006.33 However, through at least FY2018, NPS continued to develop business practices to estimate the maintenance needs of non-industry standard assets.34 This category presents particular challenges because it includes unique asset types.35
Funding Amounts and Impacts It is unclear how much total funding is provided each year for deferred maintenance for the four agencies, because annual presidential budget requests, appropriations laws, and supporting documents typically do not aggregate funds for deferred maintenance. During the 10-year period examined, portions of deferred maintenance funding (for one or more of the four agencies) have come from agency maintenance and construction accounts, recreation fees, the Highway Trust Fund (Department of Transportation) for roads, the Timber Sale Pipeline Restoration Fund (for FS and BLM), NPS concession fees, and the NPS Centennial Challenge account, among other accounts.
In addition, funding figures are not directly comparable to deferred maintenance estimates because the estimates are limited to project costs and thus do not reflect indirect costs, such as salaries and benefits for government employees. Annual appropriations figures typically reflect indirect costs. Evaluations of the sufficiency of federal funding for deferred maintenance may be hindered by the lack of total funding figures and by the incomparability of appropriations and deferred maintenance estimates.
Deferred maintenance estimates might vary due to economic conditions that are not related to agency efforts or within the control of facility managers. For example, if deferred maintenance estimates reflect costs of needed materials, fuel, supplies, and labor, then the cost of deferred maintenance might change as the costs of these products and services change.36 Further, DOI has
31 See, for example, DOI, Agency Financial Report FY 2014, p. 126, at https://www.doi.gov/pfm/afr/2014. 32 In addition to changes in methodology, the accuracy and consistency in agency application of estimation methods and in reporting on deferred maintenance also may affect estimates. For instance, the 2017 audit of FS deferred maintenance (for FY2014 and FY2015) identified inaccuracies and inconsistencies in some areas. See USDA OIG 2017 FS Audit, pp. 27-31.
33 Industry-standard assets include buildings, housing, campgrounds, trails, unpaved roads, water utilities, and wastewater utility systems. See DOI, National Park Service, Budget Justifications and Performance Information, Fiscal Year 2019, pp. ONPS-57-58.
34 See DOI, National Park Service, Budget Justifications and Performance Information, Fiscal Year 2017, p. ONPS-Ops&Maint-8.
35 NPS has approximately 25 non-industry standard asset types, among them bridges, tunnels, monuments and memorials, ruins, amphitheaters, dams, marinas, and railroads.
36 For example, the FS noted that an increase (in current dollars) in the deferred maintenance estimate for roads from FY2006 to FY2007 was partly the result of rises in fuel prices and other associated construction costs. See FY2009 FS Budget Justification, pp. 15-18.
Congressional Research Service
11
Deferred Maintenance of Federal Land Management Agencies
noted that NPS deferred maintenance estimates could fluctuate with inflation and market trends (e.g., construction-related).37
Moreover, consistent and comprehensive information on the effect of federal funding on the condition of facilities and deferred maintenance over the decade does not appear to be available in budget documents. In particular, information based on the facilities condition index (FCI) seems to be incomplete or inconsistent in agency budget justifications.38 In some cases, budget justifications either do not provide FCI figures for assets or provide figures only for certain years. In other cases, it is not clear whether the FCI figures cover all agency assets or a subset of the assets. Together, the budget justifications present a mix of FCI information using quantitative measurements; percentage measurements; and qualitative statements, such as that a certain number or percentage of structures are in “good” condition, but without corresponding FCI figures.
Although amounts and impacts of deferred maintenance funding may not be readily available, agencies sometimes attributed reductions in deferred maintenance (or slower rates of increase) in part to additional appropriations, such as those provided in the American Recovery and Reinvestment Act of 2009 (ARRA; P.L. 111-5).39 The FY2016 FWS budget justification notes the ARRA funding as one factor contributing to a reduction in the backlog following a high in FY2010, for instance.40 At times, audits of agency programs, Administration budget requests, and other sources have asserted a need for increased appropriations to reduce agency backlogs.41
Recent Congresses debated whether to enact additional appropriations for deferred maintenance needs of agencies. In P.L. 116-152, the Great American Outdoors Act, Congress established a new fund with mandatory spending authority for deferred maintenance of the four major federal land management agencies and the Bureau of Indian Education. The new fund—the National Parks and Public Land Legacy Restoration Fund—is to receive certain revenues from energy
37 Information provided to CRS by the DOI Budget Office on February 27, 2015. 38 The facilities condition index (FCI) is an accepted industry measure of the condition of constructed assets at a specific point in time, and it serves as a performance measure for condition improvement. It is the ratio of the deferred maintenance to the current replacement value of the asset. As a general guideline, a facility with an FCI less than 0.15 is considered to be in acceptable condition. See DOI, BLM, Budget Justifications and Performance Information, Fiscal Year 2022, p. V-105, at https://www.doi.gov/budget/appropriations/2022.
39 The information was provided to CRS by the DOI Budget Office on February 27, 2015, and by the FS Legislative Affairs Office on March 13, 2015. ARRA provided emergency funding to the agencies for FY2009, with the monies available for obligation through September 30, 2010. Some of the projects were completed in subsequent fiscal years. Under the law, the four agencies received $1.99 billion in appropriations for various accounts and purposes (excluding funding for wildland fire management), although the portion used for deferred maintenance is not clear. These funds were in addition to regular appropriations for FY2009.
40 DOI, FWS, Budget Justifications and Performance Information, Fiscal Year 2016, p. NWR-31. The FWS deferred maintenance estimate for FY2010 was $3.02 billion (in current dollars). Other information provided to CRS by DOI (for NPS) and by FS attributed reductions or slower growth of deferred maintenance to ARRA funding.
41 For instance, a 2017 audit report asserted that reducing the FS maintenance backlog “will require devoting the necessary resources over an extended period of time,” and that “increasing wildfire management costs have left the agency without extra funding to concentrate on reducing deferred maintenance.” See USDA OIG 2017 FS Audit, p. 6. As another example, the Interior Budget in Brief for FY2021 (and earlier fiscal years) set out a proposal for the establishment of a “Public Lands Infrastructure Fund,” with revenues from energy development on federal lands, to be used for deferred maintenance needs of the four agencies (as well as the Bureau of Indian Education). See DOI, The Interior Budget in Brief, Fiscal Year 2021, p. DH-37, at https://www.doi.gov/budget/appropriations/2021https://www.doi.gov/sites/doi.gov/files/uploads/2020_highlights_book.pdf. A similar proposal was enacted by the 116th Congress in P.L. 116-152, the Great American Outdoors Act, as discussed in the report. For information on legislative proposals that had been proposed to establish a fund to address deferred maintenance, especially for the NPS, see CRS In Focus IF10987, Legislative Proposals to Address National Park Service Deferred Maintenance, by Laura B. Comay.
Congressional Research Service
12
Deferred Maintenance of Federal Land Management Agencies
development on federal lands, for each of FY2021-FY2025, up to $1.9 billion annually. Of the annual deposits in the fund, NPS is to receive the largest share—70%. The other agency shares are 15% for FS and 5% for each of BLM, FWS, and the Bureau of Indian Education. At least 65% of each agency’s funds are to be used for non-transportation projects.42 Congress first provided funding under this authority for FY2021.43 Thus, any impact of this funding would not be reflected in the deferred maintenance estimates for the 10-year period covered by this report.
Some observers and stakeholders have identified ways to potentially address deferred maintenance without solely relying on federal funding. For instance, a 2016 report by the Government Accountability Office (GAO) on NPS deferred maintenance listed various actions that NPS is taking at some park units. They include using donations, volunteers, and partnerships to assist with maintenance; leasing assets to nonfederal parties in exchange for rehabilitation or maintenance; and partnering with states in seeking transportation grants.44 As another example, a 2016 report by a research institute set out options including outsourcing certain agency operations to the private sector, establishing a franchising system for new park units, and disposal of assets.45
Asset Number, Condition, Acquisition, and Disposal The asset portfolios of the four agencies vary considerably in terms of number, type, size, age, and location of agency assets. Although comprehensive data on these variables over the past decade are not readily available, it is likely that they affect agency maintenance responsibilities and maintenance backlogs. For instance, NPS has more assets than the other DOI agencies, a sizeable portion of which were constructed before 1900 or in the first half of the 20th century. The 2016 GAO report assessed various characteristics of the NPS maintenance backlog, including the age of park units. The agency determined that of the total FY2015 NPS deferred maintenance,46 park units established over 100 years ago had the largest share (32%). Further, park units established more than 40 years ago collectively accounted for 88% of all NPS deferred maintenance.47 Moreover, some NPS assets are in urban areas or are iconic structures, which could affect maintenance costs.48
42 For additional information on the operation of the fund, see CRS In Focus IF11636, The Great American Outdoors Act (P.L. 116-152), by Carol Hardy Vincent, Laura B. Comay, and Bill Heniff Jr.
43 The Interior, Environment, and Related Agencies appropriations law for FY2021 (P.L. 116-260, Division G, §434) and the accompanying explanatory statement allocated the funding among the agencies and identified specific projects that would receive funding.
44 Government Accountability Office, National Park Service: Process Exists for Prioritizing Asset Maintenance Decisions, but Evaluation Could Improve Efforts, GAO-17-136, pp. 34-37, December 2016, at https://www.gao.gov/products/GAO-17-136. Hereinafter cited as GAO 2016 NPS Asset Maintenance Report.
45 Property and Environment Research Center, Breaking the Backlog, 7 Ideas to Address the National Park Deferred Maintenance Problem, February 2016, at https://www.perc.org/wp-content/uploads/old/pdfs/BreakingtheBacklog_7IdeasforNationalParks.pdf.
46 The total FY2015 deferred maintenance estimate cited by GAO was $11.9 billion. This figure is different than the figure reflected in this CRS report ($11.73 billion), because it reflects assets that are not owned by the agency but for which the agency has maintenance responsibility.
47 GAO 2016 NPS Asset Maintenance Report, pp. 22-23, at https://www.gao.gov/products/GAO-17-136. Note that the year a park unit was established is not necessarily reflective of the age of the assets in the unit; for example, newly established units of the National Park System may contain historic properties.
48 As one example, the NPS is undertaking a $227 million renovation of Arlington Memorial Bridge to address deferred maintenance. Recent deferred maintenance estimates for the bridge have varied depending on the method for repairing, rehabilitating, or replacing the historic steel drawbridge span. For information on the bridge restoration, see the NPS website at https://www.nps.gov/gwmp/learn/management/bridge-rehabilitation.htm.
Congressional Research Service
13
Deferred Maintenance of Federal Land Management Agencies
The effect of changes in agency asset portfolios on deferred maintenance is not entirely clear. However, it could be asserted that the acquisition of assets, such as a sizeable number of large or iconic assets in relatively poor condition, would increase regular maintenance needs and the backlog, if maintenance is not performed when scheduled. For instance, the NPS contended that “when parks are created or when new land is acquired, the properties sometimes come with facilities that are in unacceptable condition or are unstable for the park or partner organizations.... When facilities are excess to the park ... they also contribute to the deferred maintenance backlog.”49 Similarly, it could be asserted that disposal of assets, such as a large quantity of old assets in poor condition, could reduce deferred maintenance. For example, a 2017 audit of the FS recommended that the agency “establish goals and milestones to aggressively reduce the number of unused or underused assets in the agency’s portfolio” as one way to reduce maintenance backlogs given limited resources.50
Agencies examine whether to retain assets in their current condition or dispose of some assets, as the following examples indicate. FS has sought to reduce its maintenance backlog by conveying unneeded or underused administrative sites, as well as decommissioning roads, road and facility infrastructure, and nonpriority recreation sites.51 FWS has attributed reductions in deferred maintenance in part to “disposing of unneeded assets.”52 NPS identifies assets that are not critical to the agency’s mission and that are in relatively poor condition for potential disposal. In the past, the agency has noted that although the agency seeks to improve the condition of its asset portfolio by disposing of assets, “analysis of removal costs versus annual costs often precludes the removal option.”53
Author Information
Carol Hardy Vincent
Specialist in Natural Resources Policy
49 DOI, National Park Service, Budget Justifications and Performance Information, Fiscal Year 2020, p. CONST-66, at https://www.doi.gov/sites/doi.gov/files/fy2020-nps-justification.pdf.
50 USDA OIG 2017 FS Audit, p. 11. 51 See, for example, USDA, FS, FY2020 Budget Justification, p. 83 and p. 127, at https://www.fs.fed.us/sites/default/files/media_wysiwyg/usfs-fy-2020-budget-justification.pdf.
52 DOI, FWS, Budget Justifications and Performance Information, Fiscal Year 2016, p. NWR-31. 53 DOI, National Park Service, Budget Justifications and Performance Information, Fiscal Year 2017, p. ONPS-Ops&Maint-14.
Congressional Research Service
14
Deferred Maintenance of Federal Land Management Agencies
Disclaimer
This document was prepared by the Congressional Research Service (CRS). CRS serves as nonpartisan shared staff to congressional committees and Members of Congress. It operates solely at the behest of and under the direction of Congress. Information in a CRS Report should not be relied upon for purposes other than public understanding of information that has been provided by CRS to Members of Congress in connection with CRS’s institutional role. CRS Reports, as a work of the United States Government, are not subject to copyright protection in the United States. Any CRS Report may be reproduced and distributed in its entirety without permission from CRS. However, as a CRS Report may include copyrighted images or material from a third party, you may need to obtain the permission of the copyright holder if you wish to copy or otherwise use copyrighted material.
Congressional Research Service
R43997 · VERSION 11 · UPDATED
15 estimates is unclear.
Broader changes in methodology also occurred during the decade. For example, DOI agencies had been using an accuracy range of -15% to +25% to derive the estimated range of deferred maintenance for industry-standard assets.31 The change to a single estimate beginning in FY2015 would have affected DOI deferred maintenance estimates as reflected in this report.32
Funding
How much total funding is provided each year for deferred maintenance for the four agencies is unclear because annual presidential budget requests, appropriations laws, and supporting documents typically do not aggregate funds for deferred maintenance. Portions of deferred maintenance funding (for one or more of the four agencies) have come from agency maintenance and construction accounts, recreation fees, the Highway Trust Fund (Department of Transportation) for roads, the Timber Sale Pipeline Restoration Fund (for FS and BLM), NPS concession fees, and the NPS Centennial Challenge account, among other accounts.
In addition, funding figures are not directly comparable to deferred maintenance estimates because the estimates are limited to project costs and thus do not reflect indirect costs, such as salaries and benefits for government employees. Annual appropriations figures typically reflect indirect costs. Evaluations of the sufficiency of federal funding for deferred maintenance may be hindered by the lack of total funding figures and by the incomparability of appropriations and deferred maintenance estimates.
Deferred maintenance estimates might vary due to economic conditions that are not related to agency efforts or within the control of facility managers. For example, if deferred maintenance estimates reflect costs of needed materials, fuel, supplies, and labor, then the cost of deferred maintenance might change as the costs of these products and services change.33 Further, DOI has noted that NPS deferred maintenance estimates could fluctuate with market trends and inflation.34
Moreover, consistent and comprehensive information on the effect of federal funding on the condition of facilities and deferred maintenance over the decade does not appear to be available in budget documents. In particular, information based on the facilities condition index (FCI)35 seems to be incomplete or inconsistent in agency budget justifications. In some cases, budget justifications either do not provide FCI figures for assets or provide figures only for certain years. In other cases, it is not clear whether the FCI figures cover all agency assets or a subset of the assets. Together, the budget justifications present a mix of FCI information using quantitative measurements; percentage measurements; and qualitative statements, such as that a certain number or percentage of structures are in "good" condition, but without corresponding FCI figures.
Although amounts and impacts of deferred maintenance funding may not be readily available, the agencies at times have asserted a need for increased appropriations to reduce their backlogs. As a recent example, the Interior Budget in Brief for FY2020 sets out a proposal for the establishment of a "Public Lands Infrastructure Fund," with revenues from energy development on federal lands, to be used for deferred maintenance needs of the four agencies (as well as the Bureau of Indian Education).36 As a second example, a 2017 audit report asserted that reducing the FS maintenance backlog "will require devoting the necessary resources over an extended period of time," and that "increasing wildfire management costs have left the agency without extra funding to concentrate on reducing deferred maintenance."37 Moreover, in the past, agencies sometimes attributed reductions in deferred maintenance (or slower rates of increase) in part to additional appropriations, such as those provided in the American Recovery and Reinvestment Act of 2009 (ARRA; P.L. 111-5).38 The FY2016 FWS budget justification notes the ARRA funding as one factor contributing to a reduction in the backlog from the FY2010 high, for instance.39
Some observers and stakeholders have identified ways to potentially address deferred maintenance without solely relying on federal funding. For instance, a 2016 report by the Government Accountability Office (GAO) on NPS deferred maintenance listed various actions that NPS is taking at some park units. They include using donations, volunteers, and partnerships to assist with maintenance; leasing assets to nonfederal parties in exchange for rehabilitation or maintenance; and partnering with states in seeking transportation grants.40 As another example, a 2016 report by a research institute set out options including outsourcing certain agency operations to the private sector, establishing a franchising system for new park units, and disposal of assets.41
Assets
The asset portfolios of the four agencies vary considerably in terms of number, type, size, age, and location of agency assets. Although comprehensive data on these variables over the past decade are not readily available, it is likely that they affect agency maintenance responsibilities and maintenance backlogs. For instance, NPS has more assets than the other DOI agencies, a sizeable portion of which were constructed before 1900 or in the first half of the 20th century. The 2016 GAO report assessed various characteristics of the NPS maintenance backlog, including the age of park units. The agency determined that of the total FY2015 NPS deferred maintenance,42 park units established over 100 years ago had the largest share (32%). Further, park units established more than 40 years ago collectively accounted for 88% of all NPS deferred maintenance.43 Moreover, some NPS assets are in urban areas or are iconic structures, which could affect maintenance costs.44
The effect of changes in agency asset portfolios on deferred maintenance is not entirely clear. However, it could be asserted that the acquisition of assets, such as a sizeable number of large or iconic assets in relatively poor condition, would increase regular maintenance needs and the backlog, if maintenance is not performed when scheduled. For instance, the NPS asserted that "when parks are created or when new land is acquired, the properties sometimes come with facilities that are in unacceptable condition or are unstable for the park or partner organizations.... When facilities are excess to the park ... they also contribute to the deferred maintenance backlog."45 Similarly, it could be argued that disposal of assets, such as a large quantity of old assets in poor condition, could reduce deferred maintenance. For example, a 2017 audit of the FS recommended that the agency "establish goals and milestones to aggressively reduce the number of unused or underused assets in the agency's portfolio" as one way to reduce maintenance backlogs given limited resources.46
Agencies examine whether to retain assets in their current condition or dispose of some assets, as the following examples indicate. FS has sought to reduce its maintenance backlog by conveying unneeded or underused administrative sites, as well as decommissioning roads, road and facility infrastructure, and nonpriority recreation sites.47 FWS has attributed reductions in deferred maintenance in part to "disposing of unneeded assets."48 NPS identifies assets that are not critical to the agency's mission and that are in relatively poor condition for potential disposal. In the past, the agency has noted that although the agency seeks to improve the condition of its asset portfolio by disposing of assets, "analysis of removal costs versus annual costs often precludes the removal option."49
Author Contact Information
Footnotes
| 1. |
Assets managed by the three DOI agencies included the following. BLM managed 45,871 assets, including (1) 4,335 buildings, (2) 18,908 roads, and (3) 22,628 structures. FWS managed 39,697 assets, including (1) 6,540 buildings, (2) 13,928 transportation-related assets (roads, bridges, and trails), (3) 8,677 water management structures, and (4) 10,552 other assets. NPS managed 76,039 assets, including (1) 25,073 buildings, (2) 3,690 housing units, (3) 1,421 campgrounds, (4) 6,273 trails, (5) 1,831 wastewater systems, (6) 1,530 other water systems, (7) 5,537 unpaved roads, (8) 11,988 paved roads, and (9) 18,696 other assets. The information for FWS is for FY2016, and was provided to the Congressional Research Service (CRS) by the Department of the Interior (DOI) Budget Office on March 2, 2017. More recent information is not readily available. The information for BLM and NPS is for FY2018, and was provided to CRS by the DOI Budget Office on April 22, 2019. In FY2018, the Forest Service (FS) managed 93,691 assets (excluding trails and roads) as follows: (1) 39,370 buildings, (2) 13,401 road and trail bridges, (3) 29,706 recreation sites, (4) 4,736 wastewater systems, (5) 4,710 drinking water systems, and (6) 1,768 dams. In addition, the FS managed 158,726 miles of trails and 64,983 miles of roads operated for passenger vehicles. (The agency also manages categories of roads that are not counted towards deferred maintenance, namely those operated for high-clearance vehicles and "stored for future use.") The FS information was provided to CRS by the Forest Service Legislative Affairs Office on April 18, 2019. CRS has not obtained the size, age, or location of each asset. For example, CRS has not obtained the square footage for the buildings or the size of the water systems, and thus did not analyze the backlog relative to the size of each agency's assets. |
| 2. |
This definition is taken from the Statement of Federal Financial Accounting Standards 42: Deferred Maintenance and Repairs, p. 1463 (pdf) of the FASAB Handbook of Federal Accounting Standards and Other Pronouncements, as Amended, available on the website of the Federal Accounting Standards Advisory Board at http://files.fasab.gov/pdffiles/2018_fasab_handbook.pdf. |
| 3. |
Ibid., p. 1463. |
| 4. |
For a brief description of FS condition assessments, see U.S. Dept. of Agriculture, Agency Financial Report 2018, pp. 145-147, at https://www.ocfo.usda.gov/docs/2018AFR20181115-E.pdf. For a brief description of DOI condition assessments, see U.S. Dept. of the Interior, Agency Financial Report, FY2018, p. 110, at https://www.doi.gov/sites/doi.gov/files/uploads/doi_fy2018_afr.pdf. |
| 5. |
The 10 asset classes are bridges, buildings, dams, heritage, minor constructed features, roads, trails, trail bridges, wastewater, and water. This information was provided to CRS by the FS Legislative Affairs Office on February 12, 2019. |
| 6. |
The change to a single figure resulted from revisions to federal financial accounting standards that took effect in FY2015. See the Statement of Federal Financial Accounting Standards 42: Deferred Maintenance and Repairs, in the FASAB Handbook of Federal Accounting Standards and Other Pronouncements, as Amended, available on the website of the Federal Accounting Standards Advisory Board at http://files.fasab.gov/pdffiles/2018_fasab_handbook.pdf. |
| 7. |
U.S. Dept. of the Interior, Agency Financial Report, FY2014, p. 126, at http://www.doi.gov/pfm/afr/2014/upload/DOI-FY-2014-AFR.pdf. |
| 8. |
Ibid, p. 126. |
| 9. |
For instance, the FY2015 deferred maintenance estimate was taken from U.S. Department of Agriculture, Forest Service, Fiscal Year 2017 Budget Justification, p. 411, at https://www.fs.fed.us/about-agency/budget-performance. Information on the deferred maintenance estimates for FY2016-FY2018 were provided to CRS by the FS Legislative Affairs Office. |
| 10. |
CRS calculated this mid-range figure as the average of the high and low estimates. |
| 11. |
In addition, policy discussions of agency deferred maintenance commonly have referred to a single mid-range estimate, as shown in this report. |
| 12. |
The DOI Budget Office has provided deferred maintenance information to CRS periodically throughout the decade. These estimates are generally based on DOI financial reports and may differ from figures reported by the agencies independently. In particular, in recent years the NPS has independently reported estimates that differ from those reflected in agency financial reports, as they have included assets that are not owned by the NPS but for which the agency has maintenance responsibility. |
| 13. |
Thus the estimates do not reflect indirect costs, such as salaries and benefits for government employees. |
| 14. |
For comparison, the four agencies combined had FY2018 regular discretionary appropriations of $12.10 billion and FY2018 total budget authority (including emergency appropriations and mandatory appropriations) of $16.38 billion. |
| 15. |
This figures differs from NPS estimates for prior years, because it includes assets that are not owned by the NPS but for which the agency has maintenance responsibility. Excluding these assets, the FY2018 estimate for NPS was $11.50 billion, as reflected in DOI financial reports. A breakdown of the NPS total deferred maintenance of $11.92 billion for FY2018, by state and park unit, is on the agency's website at https://www.nps.gov/subjects/infrastructure/identifying-reporting-deferred-maintenance.htm. For additional information on NPS deferred maintenance, see CRS Report R44924, The National Park Service's Maintenance Backlog: Frequently Asked Questions, by Laura B. Comay. |
| 16. |
"Current dollar" figures have not been adjusted for inflation. |
| 17. |
In this report, the 10-year period from FY2009-FY2018 is sometimes referred to as a "decade." |
| 18. |
For DOI agencies, for each year from FY2009-FY2014, CRS calculated a mid-range deferred maintenance figure based on the average of the high and low estimates provided by DOI to CRS. This report reflects CRS's mid-range calculations for these years, as previously noted. |
| 19. |
"Constant dollar" figures have been adjusted for inflation. |
| 20. |
An analysis of data over a longer period would provide additional perspective and in some respects a different one than presented in this report. For instance, in current dollars the four agencies had a combined deferred maintenance of $14.40 billion in FY1999, the first year for which estimates for all agencies are readily available. In contrast to the FY2009-FY2018 years, in FY1999, FS had the largest share of the backlog—$8.90 billion, or 62% of the total. This was more than twice the NPS amount of $4.25 billion, or 29% of the total. The estimates for FWS and BLM were $0.95 billion (7%) and $0.30 billion (2%), respectively. From FY1999 through FY2018, total deferred maintenance of the four agencies increased in current dollars by $4.98 billion (35%), from $14.40 billion to $19.38 billion. As compared with the 10-year period examined in this report, agencies had different amounts of change during this 20-year period. Specifically, estimates of deferred maintenance increased for the three DOI agencies: by $7.67 billion (180%) for NPS, $0.66 billion (220%) for BLM, and $0.35 billion (37%) for FWS. By contrast, the FS estimate declined by $3.70 billion (42%). |
| 21. |
Industry-standard assets include buildings, housing, campgrounds, trails, unpaved roads, water utilities, and wastewater utility systems. See U.S. Dept. of the Interior, National Park Service, Budget Justifications and Performance Information, Fiscal Year 2017, p. ONPS-Ops&Maint-17, at https://www.doi.gov/budget/appropriations/2017. Hereinafter cited as FY2017 NPS Budget Justification. |
| 22. |
FY2017 NPS Budget Justification, p. ONPS-Ops&Maint-8, at https://www.doi.gov/budget/appropriations/2017. |
| 23. |
Currently, NPS has 25 nonindustry-standard asset types, among them bridges, tunnels, monuments and memorials, ruins, amphitheaters, dams, marinas, and railroads. |
| 24. |
U.S. Dept. of the Interior, Fish and Wildlife Service, Budget Justifications and Performance Information, Fiscal Year 2015, p. NWR-30, at http://www.doi.gov/budget/appropriations/2015/upload/FY2015_FWS_Greenbook.pdf. |
| 25. |
U.S. Dept. of the Interior, Fish and Wildlife Service, Budget Justifications and Performance Information, Fiscal Year 2017, p. NWRS-36, at https://www.doi.gov/budget/appropriations/2017. |
| 26. |
Phone communication between CRS and FS staff on March 17, 2015, and Forest Service annual budget justifications. |
| 27. |
Information provided to CRS by the Forest Service Legislative Affairs Office on March 13, 2015. |
| 28. |
Other years during the decade had varying amounts of increase or decrease in the roads backlog related to prior years. |
| 29. |
More recently, the FS again modified its method of estimating deferred maintenance of roads, in response to a 2017 audit report that expressed concerns about the random sampling approach that was in use. The change was noted in U.S. Department of Agriculture, Forest Service, Fiscal Year 2020 Budget Justification, p. 87, at https://www.fs.fed.us/sites/default/files/media_wysiwyg/usfs-fy-2020-budget-justification.pdf. For a discussion of the audit findings on the random sampling method, see U.S. Dept. of Agriculture, Office of Inspector General, Audit Report 08601-0004-31, Forest Service Deferred Maintenance, May 2017, pp. 27-28, at https://www.usda.gov/oig/webdocs/08601-0004-31.pdf. Hereinafter cited as USDA 2017 FS Audit. An additional example of a change in assessing roads derives from FY2008. Since that year, the roads estimate has been limited to certain types of roads—passenger-car roads (Levels 3-5)—whereas prior year estimates included closed roads and high-clearance roads (Levels 1-2). The FS estimate of deferred maintenance for roads decreased in current dollars by $0.76 billion (18%) from FY2007 to FY2008, from $4.16 billion to $3.40 billion. The FS also cited a change in roads methodology as contributing to an increased backlog estimate for an earlier year. Specifically, the FY2009 FS budget justification attributed an increase in current dollars in deferred maintenance for roads from FY2006 to FY2007 in part to a "new surveying sampling protocol" and surveys conducted "at a higher standard." The agency also described efforts at the time to develop a more "statistically valid" method for calculating the deferred maintenance of roads. U.S. Dept. of Agriculture, Forest Service, Fiscal Year 2009 President's Budget, Budget Justification, pp. 15-18, at http://www.fs.fed.us/publications/budget-2009/fy2009-forest-service-budget-justification.pdf. Hereinafter cited as FY2009 FS Budget Justification. |
| 30. |
Information provided to CRS by the DOI Budget Office on February 27, 2015. |
| 31. |
See, for example, U.S. Dept. of the Interior, Agency Financial Report FY 2014, p. 126, at https://www.doi.gov/pfm/afr/2014. |
| 32. |
In addition to changes in methodology, the accuracy and consistency in agency application of estimation methods and in reporting on deferred maintenance may also affect estimates. For instance, the 2017 audit of FS deferred maintenance (for FY2014 and FY2015) identified inaccuracies and inconsistencies in some areas. See USDA 2017 FS Audit, pp. 27-31, at https://www.usda.gov/oig/webdocs/08601-0004-31.pdf. |
| 33. |
For example, the FS noted that an increase (in current dollars) in the deferred maintenance estimate for roads from FY2006 to FY2007 was partly the result of rises in fuel prices and other associated construction costs. See FY2009 FS Budget Justification, pp. 15-18, at http://www.fs.fed.us/publications/budget-2009/fy2009-forest-service-budget-justification.pdf. |
| 34. |
Information provided to CRS by the DOI Budget Office on February 27, 2015. |
| 35. |
The facilities condition index is an accepted industry measure of the condition of constructed assets at a specific point in time, and it serves as a performance measure for condition improvement. It is the ratio of the deferred maintenance to the current replacement value of the asset. As a general guideline, a facility with an FCI less than 0.15 is considered to be in acceptable condition. See U.S. Dept. of the Interior, Bureau of Land Management, Budget Justifications and Performance Information, Fiscal Year 2020, p. VI-127, at https://www.doi.gov/sites/doi.gov/files/uploads/fy2020_blm_budget_justification.pdf. |
| 36. |
U.S. Dept. of the Interior, The Interior Budget in Brief, Fiscal Year 2020, p. DH-31, at https://www.doi.gov/sites/doi.gov/files/uploads/2020_highlights_book.pdf. Under the proposal, agencies would receive differing percentages of the monies in the fund, as follows: 70% for NPS, 10% for FWS, 10% for FS, 5% for BLM, and 5% for the Bureau of Indian Education. In the FY2019 budget request, the Trump Administration proposed a similar fund. For information on legislative proposals to establish a fund to address deferred maintenance, especially for the NPS, see CRS In Focus IF10987, Legislative Proposals for a National Park Service Deferred Maintenance Fund, by Laura B. Comay. |
| 37. |
USDA 2017 FS Audit, p. 6. |
| 38. |
The information was provided to CRS by the DOI Budget Office on February 27, 2015, and by the Forest Service Legislative Affairs Office on March 13, 2015. ARRA provided emergency funding to the agencies for FY2009, with the monies available for obligation through September 30, 2010. Some of the projects were completed in subsequent fiscal years. Under the law, the four agencies received $1.99 billion in appropriations for various accounts and purposes (excluding funding for wildland fire management), although the portion used for deferred maintenance is not clear. These funds were in addition to regular appropriations for FY2009. |
| 39. |
U.S. Dept. of the Interior, Fish and Wildlife Service, Budget Justifications and Performance Information, Fiscal Year 2016, p. NWR-31, at http://www.doi.gov/budget/appropriations/2016/upload/FY2016_FWS_Greenbook.pdf. Information provided to CRS by DOI (for NPS) and by FS also attributed reductions or slower growth of deferred maintenance to ARRA funding. |
| 40. |
Government Accountability Office, National Park Service: Process Exists for Prioritizing Asset Maintenance Decisions, but Evaluation Could Improve Efforts, GAO-17-136, pp. 34-37, December 2016, at https://www.gao.gov/products/GAO-17-136. Hereinafter cited as GAO 2016 NPS Asset Maintenance Report. |
| 41. |
Property and Environment Research Center, Breaking the Backlog, 7 Ideas to Address the National Park Deferred Maintenance Problem, February 2016, at https://www.perc.org/wp-content/uploads/old/pdfs/BreakingtheBacklog_7IdeasforNationalParks.pdf. |
| 42. |
The total FY2015 deferred maintenance estimate cited by GAO was $11.9 billion. This figure is different than the figure reflected in this CRS report ($11.73 billion), because it reflects assets that are not owned by the agency but for which the agency has maintenance responsibility. |
| 43. |
GAO 2016 NPS Asset Maintenance Report, pp. 22-23, at https://www.gao.gov/products/GAO-17-136. Note that the year a park unit was established is not necessarily reflective of the age of the assets in the unit; for example, newly established units of the National Park System may contain historic properties. |
| 44. |
As one example, the NPS is undertaking a $227 million renovation of Arlington Memorial Bridge to address deferred maintenance. Recent deferred maintenance estimates for the bridge have varied depending on the method for repairing, rehabilitating, or replacing the historic steel drawbridge span. For information on the bridge restoration, see the NPS website at https://www.nps.gov/gwmp/learn/management/bridge-rehabilitation.htm. |
| 45. |
U.S. Dept. of the Interior, National Park Service, Budget Justifications and Performance Information, Fiscal Year 2020, p. CONST-66, at https://www.doi.gov/sites/doi.gov/files/fy2020-nps-justification.pdf. |
| 46. |
USDA 2017 FS Audit, p. 11. |
| 47. |
See, for example, U.S. Dept. of Agriculture, Forest Service, FY2020 Budget Justification, p. 83 and p. 127, at https://www.fs.fed.us/sites/default/files/media_wysiwyg/usfs-fy-2020-budget-justification.pdf. |
| 48. |
U.S. Dept. of the Interior, Fish and Wildlife Service, Budget Justifications and Performance Information, Fiscal Year 2016, p. NWR-31, at http://www.doi.gov/budget/appropriations/2016/upload/FY2016_FWS_Greenbook.pdf. |
| 49. |
U.S. Dept. of the Interior, National Park Service, Budget Justifications and Performance Information, Fiscal Year 2017, p. ONPS-Ops&Maint-14, at https://www.doi.gov/budget/appropriations/2017. |