Government Expenditures on Defense Research and Development by the United States and Other OECD Countries: Fact Sheet
Changes from December 19, 2018 to January 28, 2020
This page shows textual changes in the document between the two versions indicated in the dates above. Textual matter removed in the later version is indicated with red strikethrough and textual matter added in the later version is indicated with blue.
Government Expenditures on Defense Research and Development by the United States and Other OECD Countries: Fact Sheet
Background
Research and development (R&D) has played a central role in the national security of the United States and its allies. R&D creates the foundation for new and improved technologies that underpin a wide range of applications. These applications include advanced weapons and systems that provide intelligence, medical treatments, and troop support.
For more than 70 years, U.S. defense-related R&D has delivered breakthroughs in computing, communications, networks, satellites, fighter and bomber aircraft, aircraft carriers, submarines, tanks, tactical and strategic missiles, nuclear weapons, drones, advanced materials, autonomy, and many other weapons and technologies. Military and policy analysts broadly agree that investments in R&D can provide substantial technological advantages against potential adversaries.
This fact sheet provides data on government defense R&D funding of the United States and other countries of the Organisation for Economic Co-operation and Development (OECD).1
Government Defense R&D Funding of OECD Members
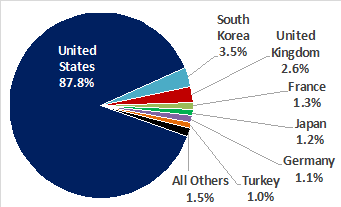
In 20162017, the United States spent $78.155.4 billion on defense R&D, more than sevenfour times as much on defense R&D than the rest of the OECD countries combined. Table 1 shows government-funded defense R&D for OECD countries in 20162017. The United States spent 2516 times the amount spent by the next-highest funder, South Korea; 3323 times the amount spent by the United Kingdom; 7036 times the amount spent by Germany; 39 times the amount spent by France; 7341 times the amount spent by JapanTurkey; and 8046 times the amount spent by GermanyJapan.
OECD defense R&D is highly concentrated among a handful of countries. Since at least 2009, the United States has accounted for more than 85%79% or more of total OECD government defense R&D funding. In 20162017, the U.S. share was 87.881.2% (see Figure 1); the top seven countries account for 98.597.7%.
Table 1. Top Ten OECD Countries by Government Defense R&D Funding, 2016
(in millions of purchasing power parity dollars)
|
Country |
R&D |
|||
|
United States |
|
|||
|
South Korea |
|
|||
|
United Kingdom |
|
|||
|
France |
|
|||
|
Japan |
|
|||
|
Germany |
|
|||
|
Turkey |
|
|||
|
Australia |
|
|||
|
Canada |
|
|||
|
Poland |
|
|||
|
Other OECD Countries |
|
|||
|
Total, OECD |
|
Source: Organisation for Economic Co-operation and Development (OECD), Research and Development Statistics (RDS) Database, https://stats.oecd.org/Index.aspx?DataSetCode=GBARD_NABS2007.
Notes: Purchasing power parity is a method of adjusting foreign currencies to a single common currency (in this case U.S. dollars) to allow for direct comparison between countries. It is intended to reflect the spending power of each local currency, rather than international exchange rates. The latestOECD government defense R&D data for 2017 are not available for Canada and Latvia; data for 2016 for these countries have been used instead.
a. The most recent government defense R&D data available for Canada is for 2016 government defense R&D data for Canada, Chile, and Switzerland available from the OECD are for 2015. OECD government defense R&D data not available for Israel, Lithuania, and Portugal.
a. 2015 data are the most recent available for Canada, Chile, and Switzerland.
Government Defense R&D Funding as a Share of GDP
In general, countries with larger economies are able to make larger investments in R&D and defense.2 In 20162017, the United States had the largest GDP among OECD countries at $18.619.5 trillion, followed by Japan ($5.43 trillion), Germany ($4.03 trillion), the United Kingdom ($2.83.0 trillion), and France ($2.83.0 trillion).
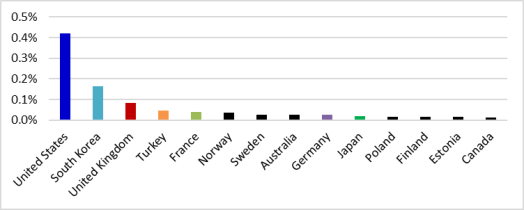
One approach used to facilitate comparison of government defense R&D spending among countries with different size economies is to divide each government's defense R&D spending by that country's gross domestic product (GDP). Figure 2 illustrates this metric, government defense R&D funding as a percentage of GDP, for the OECD countries ranked highest by this metric in 20162017. The United States spent 0.419285% of its GDP on defense R&D in 20162017. The United States led in this metric, spending more than 2.5 times68% more than the share spent by South Korea (0.164169%), the OECD country ranked second in this metric. Compared to the other largest OECD economies, the United States spent a much greater share of GDP on defense R&D: more than 2112 times the share spent by Japan, more than 178 times the share spent by Germany (0.024035%), more than 53 times the share spent by the United Kingdom (0.083080%), and more than 105 times the share spent by France (0.040048%).
|
Figure 2. OECD Countries with the Highest Levels of Government Defense R&D Funding as a Share of GDP, |
 |
|
Source: CRS analysis of OECD RDS Database data. Notes: Does not include countries with |
Share of Government R&D Funding Spent on Defense R&D
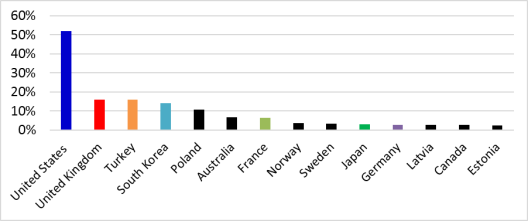
Government defense R&D spending as a share of total government R&D spending is a metric that provides an indication of the relative importance of defense R&D within each nation's R&D portfolio. Figure 3 illustrates this metric for each OECD country. In FY2016FY2017, the United States devoted 51.943.5% of government R&D expenditures to defense. The United Kingdom and Turkey tied forTurkey ranked second in this metric among OECD countries at 15.917.3%. Among other largethe largest OECD economies, France ranked 7th (6.4%); Japan ranked 10th (3.1%); and Germany ranked 11th (2.8%).
|
Figure 3. OECD Countries with the Highest Levels of Government Defense R&D Funding as a Percentage of Total Government R&D Funding, |
 |
|
Source: CRS analysis of OECD RDS Database data. Notes: Does not include countries that spent less than 2.0% of total government R&D |
Statistical Notes
The data, table, and figures in this fact sheet are based on CRS analysis of 20162017 OECD data on government budget allocations for R&D (GBARD), government budget allocations for defense-related R&D, and gross domestic product (GDP), on a purchasing power parity basis.3
Some caveats:
- The
20162017 OECD data are the most recent nearly complete set of government defense R&D funding figures for OECD countries.Data for Canada, Chile, and Switzerland are based on each country's 2015 GBARD, government budget allocations for defense-related R&D, and GDP levels.OECD funding information for government defense R&D does not include 2017 data for Canada and Latvia; for purposes of this analysis, 2016 data were used instead. OECD funding information for total government R&D does not include 2017 data for Canada; for purposes of this analysis 2016 data were used instead.
- In July 2016, the U.S. Office of Management and Budget adopted a refinement to the categories of R&D used by the federal government in data collection, replacing "development" with "experimental development." This new definition more narrowly defines the set of activities to be included in R&D reporting.
This change resulted in lower reported R&D funding for some agencies, including the Department of Defense. Data reported to OECD for 2016 reflected funding based on the previous definition; according to the National Science Foundation, U.S. reporting of government defense R&D funding to the OECD is expected to be based on the new definition beginning with 2018 GBARD data. According to the Office of Management and Budget, for FY2017, $26.95 billion in non-experimental development funding at the Department of Defense, which would have been reported as R&D under the previous definition, will not be reported under the new definition. This would reduce reported U.S. defense R&D funding by about one-third.4
Author Contact Information
Footnotes
| 1. |
The OECD is an organization of 36 countries formed after World War II to promote economic cooperation and reconstruction. Among its activities, the OECD collects, analyzes, and publishes data on each of its member countries. |
| 2. |
For additional information on overall national spending on research and development, see CRS Report R44283, Global Research and Development Expenditures: Fact Sheet, by John F. Sargent Jr. |
| 3. |
Organisation for Economic Co-operation and Development (OECD), Research and Development Statistics (RDS) Database, https://stats.oecd.org/Index.aspx?DataSetCode=GBARD_NABS2007. |
| 4. |
Email communication from the Office of Management and Budget to CRS, February 4, 2018. |