National Park Service (NPS) Appropriations: TenYear Trends
Changes from July 10, 2018 to July 2, 2019
This page shows textual changes in the document between the two versions indicated in the dates above. Textual matter removed in the later version is indicated with red strikethrough and textual matter added in the later version is indicated with blue.
Contents
- NPS Discretionary Appropriations Totals
- Individual NPS Accounts
- Operation of the National Park System Account
- Construction Account
- National Recreation and Preservation Account
- Historic Preservation Fund
- Land Acquisition and State Assistance
- National Recreation and Preservation Account
Centennial Challenge- NPS Appropriations in Context
- Size of the National Park System
- Visits to the National Parks
- National Park Service Staffing
- Conclusion
Figures
- Figure 1. NPS Discretionary Appropriations,
FY2009-FY2018FY2010-FY2019
- Figure 2. NPS's
FY2018FY2019 Discretionary Appropriations by Account - Figure 3. Appropriations for NPS's Operation of the National Park System (ONPS) Account,
FY2009-FY2018FY2010-FY2019
- Figure 4. Appropriations for
NPS's Construction Account, FY2009-FY2018 - Figure 5. Appropriations for NPS's National Recreation and Preservation (NR&P) Account, FY2009-FY2018
- Figure 5. Appropriations for NPS's Construction Account, FY2010-FY2019
- Figure 6. Appropriations for NPS's Historic Preservation Fund (HPF) Account,
FY2009-FY2018FY2010-FY2019
- Figure 7. Appropriations for NPS's Land Acquisition and State Assistance (LASA) Account,
FY2009-FY2018FY2010-FY2019
- Figure 8. Appropriations for NPS's National Recreation and Preservation (NR&P) Account, FY2010-FY2019
Figure 9. Appropriations for NPS's Centennial Challenge Account,
FY2009-FY2018FY2010-FY2019
- Figure
910. Size of the National Park System,FY2009-FY2018FY2010-FY2019
- Figure
1011. Annual Recreational Visits to the National Park System,2009-20182010-2019
- Figure
1112. NPS Full-Time Equivalent (FTE) Staff,FY2007-FY2016FY2010-FY2019
Tables
- Table 1. NPS Discretionary Appropriations,
FY2009-FY2018FY2010-FY2019
- Table 2. NPS Appropriations by Account,
FY2009-FY2018FY2010-FY2019
- Table 3. Size of the National Park System,
FY2009-FY2018FY2010-FY2019
- Table 4. Annual Recreational Visits to the National Park System,
2009-20182010-2019
- Table 5. NPS Full-Time Equivalent (FTE) Staff,
FY2009-FY2018FY2010-FY2019
Summary
The National Park Service (NPS) generally receives appropriations in the annual Interior, Environment, and Related Agencies appropriations bill. This report examines trends in NPS appropriations over the past decade (FY2009-FY2018), as well as changes during the decade in the size of the National Park System, numbers of recreational visits to the parks, and NPS staffing levels.
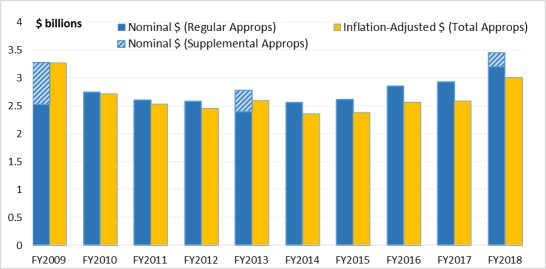
NPS's appropriations fluctuated during the decade, mainly declining in the first part of the decade and then increasing during the second part. In the first and last years of the decade (FY2009 and FY2018), as well as in one intervening year (FY2013), appropriations totals were notably increased by supplemental funding. In FY2009, supplemental appropriations for economic stimulus affected NPS accounts for park operations, construction, and historic preservation; in FY2013 and FY2018, supplemental funding for hurricane recovery affected the accounts for construction and historic preservation. With the supplemental appropriations included, the total discretionary appropriation for FY2018 represented an increase (+5.6%) in nominal dollars over the FY2009 total but a decrease (-8.0%) in inflation-adjusted dollars. Excluding supplementals, NPS appropriations increased between FY2009 and FY2018 by 26.8% in nominal dollars and 10.5% in inflation-adjusted dollars.
During this period, NPS's discretionary appropriations were organized primarily in five accounts. A sixth account (Centennial Challenge) was funded only in certain years. Regular appropriations fluctuated over the decade for all the accounts, and the extent to which an account increased or decreased also was affected by supplemental appropriations. With supplementals included, two accounts received more funding in FY2018 than in FY2009 in real (inflation-adjusted) terms, including one account that funds federal land acquisition and outdoor recreation assistance to states and one that provides grants to states and tribes for historic preservation activities. Three other accounts received less funding in FY2018 than in FY2009 in inflation-adjusted dollars—including NPS's largest account, which funds basic park operations, as well as the account that funds construction and major repairs and the account for NPS assistance to nonfederal entities. Excluding supplementals, funding still grew in real terms for the land acquisition and historic preservation accounts, but it also grew for the operations and construction accounts, declining only for assistance to nonfederal entities. The operations and construction accounts are partially used to address NPS's deferred maintenance backlog, which has grown throughoutOver the past decade (FY2010-FY2019), NPS received both regular (annual) appropriations and, in some years, supplemental appropriations to address damage from natural disasters. The agency also has some mandatory sources of funding. NPS's regular appropriations mainly declined in the first part of the decade and increased in the second part, resulting in near parity at the beginning and end of the period when amounts are adjusted for inflation. The FY2019 regular appropriation was 17% higher than FY2010 in nominal dollars but less than 1% higher in inflation-adjusted dollars. NPS also received supplemental appropriations for response to damage from hurricanes and other natural disasters in FY2013 (P.L. 113-2), FY2018 (P.L. 115-123), and FY2019 (P.L. 116-20). These funds were provided outside of regular appropriations laws and were not subject to discretionary spending caps. With supplemental appropriations included, NPS's FY2019 funding was 22% higher than FY2010 in nominal dollars and 4% higher in inflation-adjusted dollars.
During this period, NPS's discretionary appropriations generally were organized in six accounts. Appropriations fluctuated over the decade for all the accounts. With supplemental appropriations included, four accounts received more funding in FY2019 than FY2010 in real (inflation-adjusted) terms. These included accounts that fund construction and major repairs, federal land acquisition and outdoor recreation assistance to states, grants to states and tribes for historic preservation activities, and grants to spur partner donations for park improvements. Two accounts received less funding in FY2019 than FY2010 in inflation-adjusted dollars—including NPS's largest account, which funds basic park operations, and an account covering other NPS assistance programs for nonfederal entities. A significant issue for NPS throughout the decade was the agency's multibillion-dollar backlog of deferred maintenance (i.e., infrastructure maintenance and repairs that were not performed as scheduled or as needed). Combined funding for two budget activities that primarily address the backlog (within larger budget accounts) grew in real terms over the decade.
The funding changes took place in the context of relative stability in the size of the National Park System, which was about 85 million acres throughout the decade, with slight growth (+0.8%). The total consisted of roughly 80a total growth of 1% from the beginning to the end of the period. The system consists of roughly 81 million acres of federal land, with the remainder nonfederal. Although system acreage remained relatively stable, 2628 new units —many of relatively small size—were added to the system during the decade. NPS staffing levels hovered around 20,000 and were highesthigher in the first part of the decade, stemming partly from the economic stimulus measures in FY2009 than the last. Visits to the parks increased over the decade10-year period, peaking at approximately 331 million visits in 2016.
The National Park Service (NPS) administers the National Park System, which covers 85 million acres of land and consists of 417419 diverse units valuedincluded for their natural, cultural, and recreational importance. NPS generally receives appropriations in the annual Interior, Environment, and Related Agencies appropriations bill. This report examines trends in the agency's discretionary appropriations over the past decade (FY2009-FY2018FY2010-FY2019) and related issues and congressional actions. It also discusses changes in the size of the National Park System, numbers of recreational visits to the parks, and NPS staffing levels during that period.
NPS Discretionary Appropriations Totals
NPS's discretionary appropriations fluctuated during the past decade (FY2009-FY2018). Appropriations in the decade's first and last years were highest, partially owing to supplemental appropriations in both years. With the supplementals included,FY2010-FY2019). Regular discretionary appropriations totaled $3.2762.744 billion in FY2009FY2010 and $3.460223 billion in FY2018. The FY2018FY2019. The FY2019 figure was 5.617% higher than FY2009FY2010 in nominal dollars but 8.0% lowerless than 1% higher when adjusted for inflation. In both nominal and inflation-adjusted dollars, the general trend was an annual decline between FY2010 and FY2013 and increases thereafter. NPS also received supplemental appropriations for response to natural disasters in FY2013 (P.L. 113-2), FY2018 (P.L. 115-123), and FY2019 (P.L. 116-20). These funds were provided outside of regular appropriations laws and were not subject to discretionary spending caps. With supplementals included, NPS's FY2019 discretionary appropriations totaled $3.351 billion, 22% higher than FY2010 in nominal dollars and 4% higher when adjusted for inflation (Figure 1 and Table 1).1 when adjusted for inflation (Figure 1 and Table 1).1 Excluding supplementals, NPS's FY2018 appropriations were 26.8% higher than FY2009 appropriations in nominal dollars and 10.5% higher in inflation-adjusted dollars. In either case, the main trend was decline in the first part of the decade and increase in the second part.
|
Figure 1. NPS Discretionary Appropriations, ($ billions, in nominal and inflation-adjusted |
 |
|
Sources: Notes: See footnote 1 for additional information on this figure. |
Table 1. NPS Discretionary Appropriations, FY2009-FY2018
($ billions, in nominal and inflation-adjusted 20092010 dollars)
|
Appropriation in Nominal $ |
Appropriation in Inflation-Adjusted |
% Change Since Previous Year |
||||
|
Nominal |
Inflation-Adjusted |
|||||
|
FY2009 |
|
3.276 |
— |
— |
||
FY2010 |
2.744 |
2. |
-16.2% |
-17.0% |
||
|
FY2011 |
2.611 |
2. |
-4.8% |
-6.7% |
||
|
FY2012 |
2.580 |
2. |
-1.2% |
-3.0% |
||
|
FY2013 |
2.775 |
2. |
+7.6% a |
+5. |
||
|
FY2014 |
2.562 |
2. |
-7.7% |
-9.4% |
||
|
FY2015 |
2.616 |
2. |
+2.1% |
+0.9% |
||
|
FY2016 |
2.852 |
2. |
+9.0% |
+ |
||
|
FY2017 |
2.932 |
2. |
+2.8% |
+1. |
||
|
FY2018 |
3.460 |
3. |
+ |
+ |
||
|
Total Change
|
-3.2%c
2.865
|
-5.1% Change Over Decade |
+0. |
-0.261 |
+ |
|
Sources: FY2009-FY2014 data Data for FY2010-FY2014 are from annual House Appropriations Committee detailed tables for NPS. FY2015-FY2017 dataData for FY2015-FY2018 are from NPS budget justifications for FY2017-FY2019. FY2018 dataFY2020. Data for FY2019 are from annual House Appropriations Committee detailed tables for NPS. Percentage calculations by CRS, and P.L. 116-20.
Notes: DataFigures include supplemental appropriations. See footnote 1 for additional information on this table.
a. The FY2009FY2013 total of $3.2762.775 billion includes regular appropriations of $2.526398 billion and supplemental appropriations of $0.750377 billion.
b. The FY2013FY2018 total of $2.7753.460 billion includes regular appropriations of $2.3983.202 billion and supplemental appropriations of $0.377258 billion.
c. The FY2018FY2019 total of $3.460351 billion includes regular appropriations of $3.202222 billion and supplemental appropriations of $0.258128 billion.
billion.
The supplemental appropriations consisted of economic stimulus measures in FY2009 (P.L. 111-5, the American Recovery and Reinvestment Act) and appropriations for hurricane recovery in FY2013 (P.L. 113-2) and FY2018 (P.L. 115-123). These funds were provided outside of regular appropriations laws and were not subject to discretionary spending caps.
Individual NPS Accounts
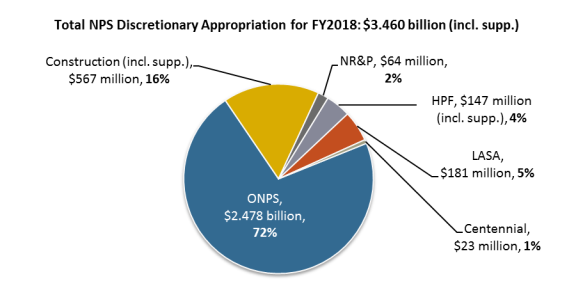
During the decade, NPS's appropriations were primarily organized in fivesix accounts that cover basic park operations (Operation of the National Park System, or ONPS, account); construction and repair of infrastructure (Construction account); assistance to state, local, tribal, and private land managers (National Recreation and Preservation account); grants to states and localities for historic preservation (Historic Preservation Fund); and land acquisition by both NPS and the states (Land Acquisition and State Assistance account);2 and matching grants primarily to address the high backlog of deferred maintenance on NPS infrastructure (Centennial Challenge account).3.2 By far the largest share of NPS's discretionary appropriations—7275% in FY2019% in FY20183—went to the ONPS account, which covers basic park operations (Figure 2 and Table 2). In addition to these five accounts, during five years of the past decade (FY2010 and FY2015-FY2018), Congress appropriated funds for a sixth account, the Centennial Challenge account.4 The account provides the federal share of matching grants for "signature" park projects and programs, primarily aimed at addressing the agency's substantial backlog of deferred maintenance on its infrastructure.5
Figure 2. NPS's FY2019 Discretionary Appropriations by Account
Source: H.Rept. 116-9 and P.L. 116-20.
|
Mandatory Appropriations in the National Park Service's Budget Most of NPS's funding comes from discretionary appropriations, which are controlled by annual appropriations laws. However, NPS also receives mandatory appropriations under In its
New mandatory spending would be subject to certain budget enforcement requirements, including the potential need to offset such spending. These requirements represent a hurdle for the above-described mandatory proposals. In the |
Table 2. NPS Appropriations by Account, FY2009-FY2018
($ millions, in nominal dollars and inflation-adjusted 20092010 dollars)
|
ONPS |
Construction |
NR&P |
HPF |
LASA |
CC |
Totala |
|
|
FY2009 |
|
|
58.384 |
|
64.190 |
— |
|
|
2,261.559 |
232.969 |
68.436 |
79.500 |
126.266 |
5.000 |
2,743.730 |
|
FY2011 |
2,250.050 |
184.646 |
57.245 |
54.391 |
94.810 |
— |
2,611.142 |
|
FY2012 |
2,236.568 |
155.366 |
59.879 |
55.910 |
101.897 |
— |
2,579.620 |
|
FY2013 |
2,097.261 |
453.885 |
56.747 |
100.486 |
96.567 |
— |
2,774.946 |
|
FY2014 |
2,236.753 |
137.461 |
60.795 |
56.410 |
98.100 |
— |
2,561.519 |
|
FY2015 |
2,277.485 |
138.339 |
63.117 |
56.410 |
98.960 |
10.000 |
2,616.501 |
|
FY2016 |
2,370.724 |
192.937 |
62.632 |
65.410 |
173.670 |
15.000 |
2,852.413 |
|
FY2017 |
2,425. |
209.353 |
62.638 |
80.910 |
162.029 |
20.000 |
2,932.120 |
|
FY2018 |
2,477.969 |
567.304 |
63.638 |
146.910 |
180.941 |
23.000 |
3,459.762 |
Sources: FY2009d3,018.117
FY2019Inflation-Adjusted
2,502.7112,139.780
442.704e378.505
64.13854.837
152.660e130.522
168.444144.017
20.00017.100
3,350.657e2,864.761
Sources: FY2010-FY2014 data are from annual House Appropriations Committee detailed tables for NPS. FY2015-FY2017FY2018 data are from NPS budget justifications for FY2017-FY2019. FY2018FY2020. FY2019 data are from annual House Appropriations Committee detailed tables for NPS.
Notes: ONPS = Operation of the National Park System account; NR&P = National Recreation and Preservation account; HPF = Historic Preservation Fund account; LASA = Land Acquisition and State Assistance account; CC = Centennial Challenge account. Data include supplemental appropriations. See footnote 1 for additional information on this table.
a. Totals reflect annual rescissions forof LWCF contract authority of $30.0 million for FY2005-FY2013 and $28.0 million for FY2014-FY2017. Because these rescissions are not included in the amounts for individual accounts, the figures for the individual accounts do not add up to the totals shown. Congress did not enact the rescissionrescissions in FY2018 or FY2019 appropriations.
b in FY2018 appropriations.
b. The FY2009 total of $3.276 billion includes regular appropriations of $2.526 billion and supplemental appropriations of $750.0 million. Supplemental FY2009 appropriations for specific accounts were $146.0 million for ONPS, $589.0 million for Construction, and $15.0 million for HPF.
c. For FY2010, the Centennial Challenge account was titled Park Partnership Project Grants.
dc. The FY2013 total of $2.775 billion includes regular appropriations of $2.398 billion and supplemental appropriations of $377.3 million (after sequestration). Supplemental FY2013 appropriations for specific accounts (after sequestration) were $329.8 million for Construction and $47.5 million for HPF. See NPS budget justification for FY2015, with FY2013 final appropriations totals, at https://www.nps.gov/aboutus/upload/FY-2015-Greenbook-Linked.pdf.
ed. The FY2018 total of $3.460 billion includes regular appropriations of $3.202 billion and supplemental appropriations of $257.6 million. Supplemental FY2018 appropriations for specific accounts were $207.6 million for Construction and $50.0 million for HPF.
|
 |
|
Source: P.L. 115-123; and P.L. 115-141, Division G, Explanatory Statement, Congressional Record, March 22, 2018, pp. H2609-H2694. Notes: ONPS = Operation of the National Park Service; NR&P = National Recreation and Preservation; HPF = Historic Preservation Fund; LASA = Land Acquisition and State Assistance. These data exclude permanent budget authorities and generally do not reflect scorekeeping adjustments. The data reflect supplemental appropriations for hurricane recovery in P.L. 115-123, including $207.6 million for the Construction account and $50.0 million for the HPF account. |
Operation of the National Park System Account
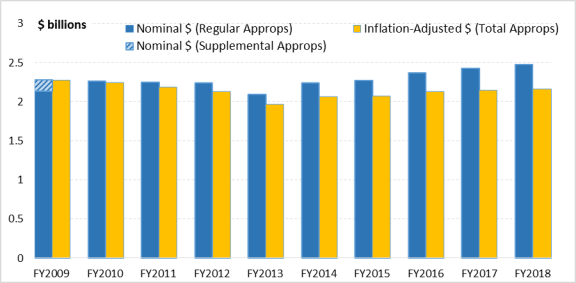
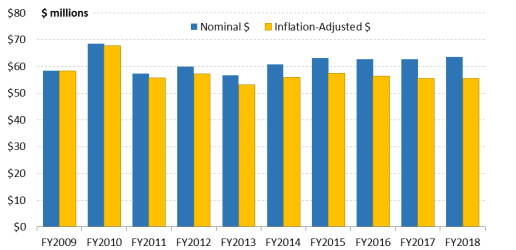
Appropriations for the largest NPS account, entitled Operation of the National Park System (ONPS), support the activities, programs, and services that form the day-to-day operations of the National Park System. Including supplemental appropriations for economic stimulus, ONPS funding was $2.278262 billion in FY2009FY2010 and increased in nominal dollars to $2.478503 billion in FY2018FY2019 (see Table 2 and Figure 3). When adjusted for inflation, however, this represents a decrease of 5.2%. With supplemental appropriations excluded, the FY2009 funding was less ($2.132 billion), and by this measure funding for the account increased over the decade in real terms, by 1.3% in inflation-adjusted dollars. %. As a percentage of total NPS appropriations, the ONPS share grew slightly over the decade if supplemental appropriations are counted, increasing from 69.5decreased over the decade from 82% of total funding in FY2009 to 71.6% in FY2018. Without supplementals, the ONPS share was 84% of total funding in FY2009 and 77% in FY2018, representing a decrease in share.FY2010 to 75% in FY2019. The ONPS account was not affected by supplemental appropriations during the decade.4
The majority of ONPS funds are provided directly to managers of individual park units. Activities covered under the account include visitor services, resource stewardship, park protection (including the U.S. Park Police), facility operations and maintenance, and park support,6 as well as "external administrative costs" for services provided by outside entities.7 Among these activities, funding for facility operations and maintenance, park support, and external administrative costs grew over the decade, whereas collective funding for the remaining activities—resource stewardship, visitor services, and park protection—declined.8 (These calculations do not reflect supplementals, because the supplemental funds were not assigned at the subaccount level.)
($ millions, in nominal and inflation-adjusted 2009 dollars) |
 |
|
Sources: FY2009-FY2014 data are from annual House Appropriations Committee detailed tables for NPS. FY2015-FY2017 data are from NPS budget justifications for FY2017-FY2019. FY2018 data are from annual House Appropriations Committee detailed tables for NPS. Notes: See footnote 1 for additional information on this figure. |
Construction Account
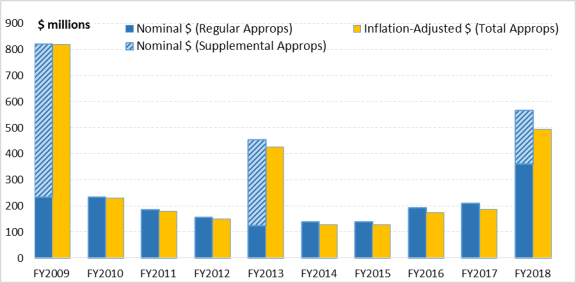
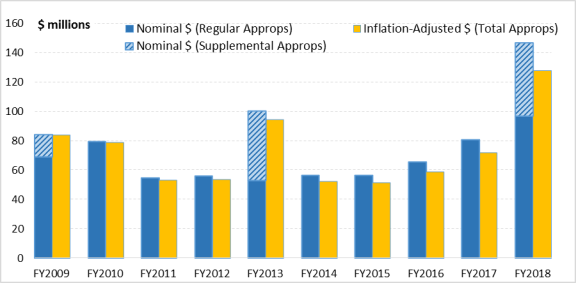
The second-largest NPS account, titled Construction, funds new construction projects as well as repairs and improvements to existing facilities, among other activities. Appropriations to the account for the first and last years of the decade (FY2009 and FY2018), along with the appropriation for FY2013, were considerably higher than construction appropriations in intervening years, in all three cases owing to supplemental appropriations related to economic stimulus (FY2009) or hurricane recovery (FY2013 and FY2018). With the supplementals included and adjusting for inflation, the FY2018 appropriation was 39.8% lower than the FY2009 appropriation (see Figure 4 and Table 2). Construction appropriations accordingly represented a smaller portion of total NPS appropriations in FY2018 (16.4%) than they did in FY2009 (25.0%). Excluding supplementals, funding for the account grew over the decade by 34.8% in inflation-adjusted dollars, and Construction's share of total funding also rose (from 9.2% in FY2009 to 11.2% in FY2018).
|
 |
|
Sources: Notes: See footnote 1 for additional information on this figure. |
|
NPS Infrastructure: Funding for Deferred Maintenance NPS's substantial backlog of deferred maintenance (DM)—infrastructure maintenance and repairs that were not performed as scheduled or as needed—has been an ongoing concern for Congress. The Despite the agency's efforts to reduce
($ millions, in nominal and inflation-adjusted 2010 dollars) Source: Annual House Appropriations Committee detailed tables for NPS, and NPS budget justifications for FY2012-FY2020. FY2019 data for Line-Item Construction are from CRS communication with NPS Budget Office, June 5, 2019. Notes: Funding does not include supplemental appropriations to the Construction account for disaster recovery. See footnote 1 for additional information on this figure. For more information on NPS deferred maintenance, see CRS Report R44924, The National Park Service's Maintenance Backlog: Frequently Asked Questions; CRS In Focus IF10987, Legislative Proposals for a National Park Service Deferred Maintenance Fund; and CRS Report R43997, Deferred Maintenance of Federal Land Management Agencies: FY2009-FY2018 Estimates and Issues.
($ millions, in nominal and inflation-adjusted 2010 dollars) Sources: FY2010-FY2014 data are from annual House Appropriations Committee detailed tables for NPS. FY2015-FY2018 data are from NPS budget justifications for FY2017-FY2020. FY2019 data are from annual House Appropriations Committee detailed tables for NPS and P.L. 116-20. Notes: See footnote 1 for additional information on this figure. For more information on NPS deferred maintenance, see CRS Report R44924, The National Park Service's Maintenance Backlog: Frequently Asked Questions, by Laura B. Comay; and CRS Report R43997, Deferred Maintenance of Federal Land Management Agencies: FY2007-FY2016 Estimates and Issues, by Carol Hardy Vincent. |
Among the specific activities funded in the Construction account, the largest is line-item construction and maintenance, which covers construction of new facilities and rehabilitation and replacement of existing facilities.9 In recent years, NPS has planned no new facility construction, in order to prioritize deferred maintenance. Projects are prioritized based on their contribution to NPS mission factors and cost-benefit considerations.10 Other activities funded in the Construction account include emergency and unscheduled construction, repair and replacement of employee housing, dam safety, equipment replacement, construction planning and program management, development of general management plans for park units, and preparation of special studies of areas (for instance, to assess their potential for inclusion in the National Park System).
National Recreation and Preservation Account
The National Recreation and Preservation (NR&P) account funds NPS programs that primarily assist state, local, tribal, and private land managers with outdoor recreation planning, natural and cultural resource preservation, environmental compliance, and other activities outside the National Park System. Appropriations for the account ranged from $55 million to $65 million throughout the decade. Comparing FY2018 with FY2009 shows a growth in nominal dollars, from $58.4 million in FY2009 to $63.6 million in FY2018. Adjusted for inflation, however, this represents a decline of 5.0% (Figure 5 and Table 2). The portion of total NPS funding used for the NR&P account (1.8%) was the same at the beginning and end of the decade. The NR&P account was not affected by supplemental funding during the decade.
($ millions, in nominal and inflation-adjusted 2009 dollars) |
 |
|
Sources: FY2009-FY2014 data are from annual House Appropriations Committee detailed tables for NPS. FY2015-FY2017 data are from NPS budget justifications for FY2017-FY2019. FY2018 data are from annual House Appropriations Committee detailed tables for NPS. Notes: See footnote 1 for additional information on this figure. |
A variety of natural, cultural, and recreational assistance programs are funded in the NR&P account. The Heritage Partnership Program, which provides NPS assistance to national heritage areas, is the largest single program in the account.11 Its appropriations grew over the decade in both nominal and inflation-adjusted dollars,12 despite budget requests from the Obama and Trump Administrations to significantly reduce it. The number of heritage areas also increased during the decade, from 39 to 49. The NR&P account also has included other programs that assist nonfederal entities, such as the American Battlefield Protection Program; Rivers, Trails, and Conservation Assistance Program; National Natural Landmarks and National Historic Landmarks Programs; National Register of Historic Places; and Preserve America Program. The account further covers international park affairs, environmental and compliance review, and grants administration.
Historic Preservation Fund
The Historic Preservation Fund (HPF), established in 1976,13.
Historic Preservation Fund
The Historic Preservation Fund (HPF), established in 1976, is administered by NPS through appropriations to the agency's HPF account. In accordance with the purposes of the National Historic Preservation Act (NHPA; P.L. 89-665; 54 U.S.C. §§300101 et seq.),),10 the fund primarily provides grants-in-aid to state and tribal historic preservation offices for conservation of cultural and historical assets and sites. Grants are typically awarded onThese grants are awarded by formula and require a 60% federal–40% state matching share basis. The HPF is funded by revenues from oil and gas activities on the U.S. outer continental shelf. Funding was reauthorized through FY2023 in P.L. 114-289.14
Appropriations for the HPF account varied during the decade and were highest in FY2013 ($100.4 million) and FY2018 ($146.9 million), in both cases due to supplemental appropriations for hurricane recovery (see Figure 6 and Table 2).15 This supplemental funding was primarily to assist recovering states and territories with compliance activities related to Section 106 of the NHPA. (Under Section 106, projects that receive federal funds or permits—such as many hurricane recovery projects—must be assessed for their potential effects on historic properties.) The account also received some supplemental funding as part of the economic stimulus package in FY2009. With supplementals included, the FY2018 appropriation was 52.4% higher in inflation-adjusted dollars than the FY2009 appropriation, and the account represented 2.6% of the total NPS appropriation in FY2009 and 4.2% in FY2018. With supplementals excluded, the FY2018 appropriation was 22.4% higher than in FY2009, and the account's share of total NPS appropriations was 2.7% in FY2009 and 3.0% in FY2018.
The largest activity in the account is funding for state historic preservation offices, which stayed relatively level (growth of +0.3%) in inflation-adjusted terms over the decade. (This does not include any supplemental funding, because none of the supplemental appropriations were assigned at the subaccount level.) Tribal grants rose by 42.9% after adjusting for inflation. At various points during the decade, the account also funded other grant programs, such as a competitive grant program for historically black colleges and universities (HBCUs) and the Save America's Treasures program to restore nationally significant historic structures and artifacts.
($ millions, in nominal and inflation-adjusted 2009 dollars) |
 |
The largest activity in the HPF account is grant funding for state historic preservation offices, which declined by 9% in inflation-adjusted terms over the decade. Grants for tribal historic preservation offices, on the other hand, rose by 25% after adjusting for inflation. The account also funded various competitive grant programs in particular years. For FY2019, these included grants for historically black colleges and universities (HBCUs), historic designation of properties associated with underrepresented communities, preservation of sites and stories associated with the civil rights movement, and the Save America's Treasures program to restore nationally significant historic structures and artifacts. Supplemental appropriations augmented regular appropriations for the HPF account in three years—FY2013, FY2018, and FY2019—and were targeted primarily to hurricane recovery.11 The funding was mainly to assist recovering states and territories with compliance activities related to Section 106 of the NHPA.12 Under Section 106, undertakings that receive federal funds or permits—including some hurricane recovery activities—must be evaluated for their potential effects on historic properties.
($ millions, in nominal and inflation-adjusted 2010 dollars) Notes: See footnote 1 for additional information on this figure. |
Land Acquisition and State Assistance
The Land Acquisition and State Assistance (LASA) account represents NPS's share of appropriations from the Land and Water Conservation Fund (LWCF; 54 U.S.C. §§200301 et seq.). The LWCF, funded mainly from offshore oil and gas revenues, is the primary
($ millions, in nominal and inflation-adjusted 2010 dollars) Sources: FY2010-FY2014 data are from annual House Appropriations Committee detailed tables for NPS. FY2015-FY2018 data are from NPS budget justifications for FY2017-FY2020. FY2019 data are from annual House Appropriations Committee detailed tables for NPS. Notes: See footnote 1 for additional information on this figure. is the primary funding source for land acquisition funding for the four major federal land management agencies—NPS, the Bureau of Land Management, the Fish and Wildlife Service, and the Forest Service.16 In addition, the LWCF supports grants to states (and, through states, to localities) for assistance with recreation planning, acquiring recreational lands and waters, and developing outdoor recreational facilities.13 These 50/50 matching grants, administered by NPS, generally are allocated to states by formula. In recent years, a portion of the funding ($20.0 million for FY2018FY2019, out of a total of $124.0 million for state assistance) also has been appropriated for a nationally competitive grant program. Overall, the LWCF is authorized at $900 million annually, but The LWCF receives deposits of $900 million annually, primarily from offshore oil and gas revenues, but this funding is only available to the extent appropriated (at no point in the past decade was thisthe "full funding" appropriated).
.
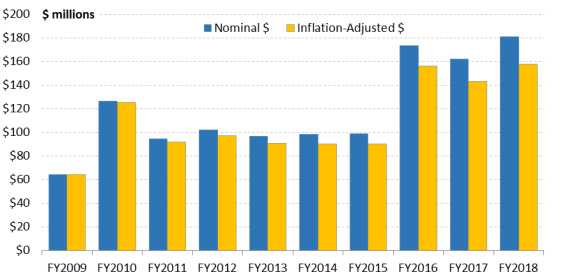
Appropriations for the LASA account—comprising the NPS federal and state assistance portions of the LWCFincluding both NPS federal land acquisition and assistance to states—varied during the decade and rose overall, with the highest amounts appropriated in the past threefour years (see Figure 7 and Table 2). The appropriation rosegrew from $64.2126.3 million in FY2009 to $180.9 million in FY2018. (As with NR&P, supplemental appropriations did not affect the LASA account during the decade.) Adjusted for inflation, this is a growth of 145.6%. The growth is largely attributable to a significant increase in appropriations for state land acquisition in recent years. Altogether, the LASA account represented 2.0% of the total NPS appropriation in FY2009 and 5.2% in FY2018.
Both parts of the account—the funds for NPS land acquisition and for assistance to states—grew over the decade, but growth in the NPS portion was smaller (+9.8% in inflation-adjusted dollars) than in the state portion (+468.6%). State assistance was less than $20 million in FY2009, rose toFY2010 to $168.4 million in FY2019.14 Adjusted for inflation, this is a growth of 14%. The LASA account represented approximately 5% of the total NPS appropriation in both FY2010 and FY2019.
The increase in funding for the account is largely attributable to higher appropriations for the state assistance program in recent years. The FY2019 appropriation for NPS federal land acquisition was 56% lower than FY2010 when adjusted for inflation. By contrast, the appropriation for NPS assistance to states grew over the decade by 165% in inflation-adjusted dollars. State assistance was roughly $40 million-$50 million annually for FY2010-FY2015, and more than doubled in nominal dollars, reaching $110 million-$125 million, for FY2016-FY2018FY2019. For land acquisition by NPS, annual funding the funding was $86 million in FY2010 and ranged between $4544 million and $65 million, except in FY2010, when it rose to $86 million.
|
 |
|
Notes: See footnote 1 for additional information on this figure. |
A variety of natural, cultural, and recreational assistance programs are funded in the NR&P account. The Heritage Partnership Program, which provides NPS assistance to national heritage areas, is the largest single program in the account.16 Its appropriations stayed relatively steady over the decade in inflation-adjusted dollars,17 despite budget requests from the Obama and Trump Administrations to significantly reduce it. There were 49 heritage areas for almost all of the decade, until Congress established 6 new heritage areas in March 2019 in P.L. 116-9. The NR&P account also has included other programs that assist nonfederal entities, such as the American Battlefield Protection Program;18 Rivers, Trails, and Conservation Assistance Program; National Natural Landmarks and National Historic Landmarks Programs; National Register of Historic Places; and Preserve America Program. The account further covers international park affairs, environmental and compliance review, and grants administration.
Centennial Challenge
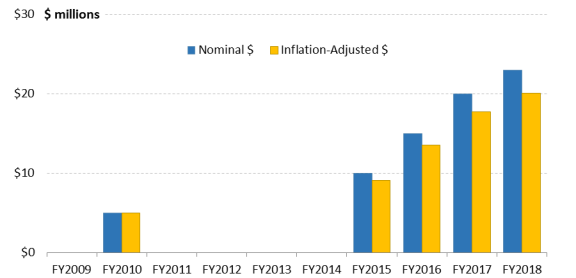
The Centennial Challenge account was funded during certain years of the decade (FY2010 and FY2015-FY2018FY2019). The account consists of a matching-grant program to spur partner donations for park improvements, primarily aimed at addressing deferred maintenance.19 The name "Centennial Challenge" indicates the fund's origin as a program to improve the parks in anticipation of NPS's 2016 centennial anniversary and its second century of park management.20 Both the Bush and Obama Administrations had proposed discretionary and mandatory funding for the fund prior to its legislative establishment in December 2016 (P.L. 114-289), and Congress had provided discretionary appropriations in some years, starting in FY2008. P.L. 114-289 codified the Centennial Challenge Fund and authorized it to receive federal revenues from certain sales of National Parks and Federal Recreational Lands Passes to seniors, in addition to discretionary appropriations. The senior pass revenues are provided as offsetting collections.1721 Revenues are to be matched on at least a one-to-one basis by nonfederal donations.
During the past decade, Congress appropriated $5.0 million for the fund in 2010 and then did not make further appropriations until FY2015. Starting in that year, Congress appropriated increasing amounts, so that the FY2018 appropriation represented an increase of 120.1% over FY2015, and 304.3% over FY2010, in inflation-adjusted dollars. Still, the FY2018 appropriation, at $23.0 million, remained smaller than that for any other NPS account.18
($ millions, in nominal and inflation-adjusted |
 |
|
Sources: Notes: See footnote 1 for additional information on this figure. |
During the past decade, Congress appropriated $5.0 million for the fund in 2010 and then did not make further appropriations until FY2015 (Table 2 and Figure 9). Starting in that year, Congress appropriated mainly increasing amounts, and the FY2019 appropriation represented an increase of 242% over FY2010 in inflation-adjusted dollars.22 The account represented less than 1% of total NPS appropriations in both FY2010 and FY2019. NPS Appropriations in Context
Changes in NPS appropriations can be considered in the context of the National Park System's size, the number of visits to the parks, and NPS staffing levels, among other factors. Over the past decade, the acreage of the National Park System remained relatively stable, growing by 0.81%, while 2628 new units were added.23 Visitation peaked in 2016 and was generally higher in the second part of the decade than the first. Staffing levels fluctuated around 20,000 during the past 10 yearsfull-time equivalent (FTE) employees during the past 10 years and were lower at the end of the decade than at the beginning.
Size of the National Park System
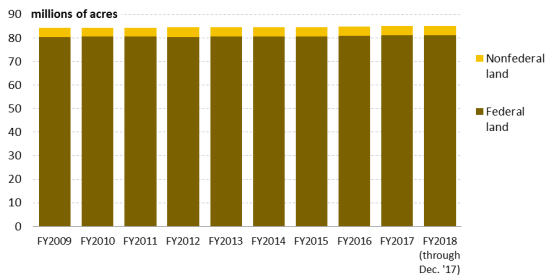
National Park System acreage grew slightly over the decade, from 84.4 million acres to 85.01 million acres, a growth of 0.81%. (See Figure 910 and Table 3.) The percentage of National Park System lands owned by the federal government remained steady, at 95.3% of total system lands.1924 The remainder—the nonfederal land in the system—includes lands within park boundaries that are owned by state or local governments and by private landowners.
Although the overall size of the National Park System did not change significantly, 26A total of 28 units were added to the system in the FY2009-FY2018 period.20FY2010-FY2019 period. Many were relatively small in acreage, such as Stonewall National Monument in New York (0.12 acres) and Belmont-Paul Women's Equality National Monument in Washington, DC (0.34 acres), which each consist of a single building. The largest units added to the system during the decade were Valles Caldera National Preserve in New Mexico (89,000 acres) and Katahdin Woods and Waters National Monument in Maine (87,563 acres). Other acreage changes resulted from boundary adjustments in existing parks.
|
Figure (in millions of acres) |
 |
|
Sources: NPS Land Resources Division, annual summaries of acreage, available Notes: "Federal |
|
Federal Land |
Nonfederal Land |
Total Acreage |
|
|
FY2009 |
80. |
3. |
84. |
|
FY2010 |
80. |
3. |
84. |
|
FY2011 |
80. |
3.900 |
84. |
|
FY2012 |
80. |
4. |
84. |
|
FY2013 |
80. |
4. |
84. |
|
FY2014 |
80. |
4. |
84. |
|
FY2015 |
80. |
4. |
84. |
|
FY2016 |
80.629 |
4. |
84.736 |
|
FY2017 |
81. |
4. |
85. |
|
|
81. |
4. |
85. |
Sources: NPS Land Resources Division, annual summaries of acreage, available on NPS Stats web page at https://irmawww.nps.gov/Stats/Reports/National. FY2018subjects/lwcf/acreagereports.htm. FY2019 figures are as of December 31, 20172018, the most recent data available.
Notes: Federal Land category includes NPS Fee Acres, Less Than Fee Acres, and Other Federal Fee Acres. Nonfederal Land category includes Other Public Acres and Private Acres.
Visits to the National Parks
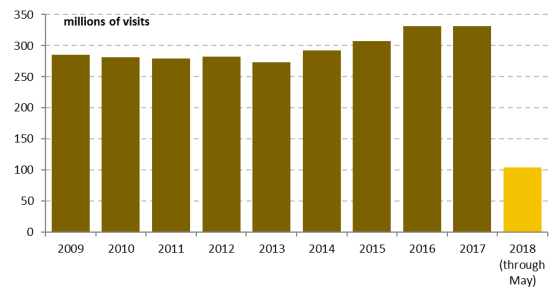
Numbers of recreational visits to the National Park System varied over the past 10 years but were generally higher toward the end of the decade. The highest numbers of visits were in 2016 (331.0 million visits) and 2017 (330.9 million visits; see Figure 1011 and Table 4). Visits at the end of the decade were 15.913% higher than at the beginning.21
Table 4. Annual Recreational Visits to the National Park System, 2009-2018
(total visits in millions, by calendar year) Notes: The figure for 2019 shows visits through May 2019 (101.9 million visits). For comparison with the previous year, visits through May 2018 totaled 105.6 million.(total visits 26 Many factors may affect the number of visitors to the parks in a given year, including national economic conditions, weather, changes in population demographics, park promotional campaigns, competing recreational choices, park closures due to natural disasters or lapses in appropriations, and other factors.
|
Year |
Number of Visits |
Year |
Number of Visits |
|
2009 |
285.6 |
2014 |
292.8 |
|
2010 |
281.3 |
2015 |
307.2 |
|
2011 |
278.9 |
2016 |
331.0 |
|
2012 |
282.8 |
2017 |
330.9 |
|
2013 |
273.6 |
|
104.4 |
Source: NPS, NPS Stats, at https://irma.nps.gov/Stats/Reports/National.
Notes: The figure for NPS visitation for 2019 is available through the end of May 2019. The year-to-date total of 101.9 million visitors is lower than the total for the same five-month span in 2018 (105.6 million visitors). Visitation was lower in most months of 2019 than in the comparable months of 2018, with the greatest difference (-21%) during January, when NPS experienced a government shutdown due to a lapse in FY2019 appropriations.2720182019 shows visits through May 20182019. For comparison with the previous year, visits through May 2017 were higher at 110.32018 were 105.6 million.
million.
(total visits in millions, by calendar year) |
 |
Notes: The figure for 2018 shows visits through May 2018 (104.4 million visits). For comparison with the previous year, visits through May 2017 totaled 110.3 million. |
National Park Service Staffing
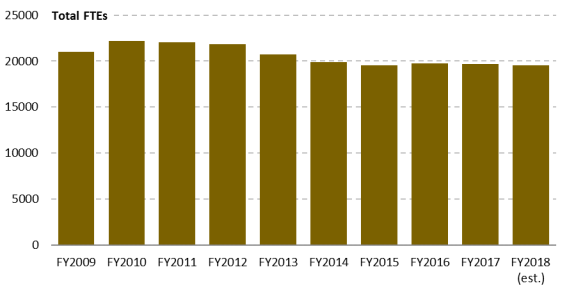
NPS's full-time equivalent (FTE) staffing levels were highest in the earlier part of the decade, starting with an FY2010 increase that followed economic stimulus measures in FY2009. Staffing. FTE staffing ranged from a high of 22,211 in FY2010 to a low of 19,359 in FY2015032 in FY2018 (Figure 11 and Table 5). NPS's staffing estimate for FY2018 would appear to be the second-lowest, but it may not fully capture staffing numbers because it was based on an appropriations baseline derived from a continuing resolution, whereas the final NPS appropriation was higher.
Table 5. NPS Full-Time Equivalent (FTE) Staff, FY2009-FY2018
Figure 12. NPS Full-Time Equivalent (FTE) Staff, FY2010-FY2019 Sources: FY2010-FY2015 numbers from U.S. Department of the Interior, "Department of the Interior FTE History: Full-Time Equivalent Staff Year (FTE) Actual of Bureaus and Offices," at https://www.doi.gov/sites/doi.gov/files/uploads/fte-_history_table-20161108.pdf. FY2016-FY2019 numbers from NPS budget justifications.
Note: NPS's FTE estimate for FY2019 was based on an appropriations baseline of $3.202 billion derived from a continuing resolution, whereas the final appropriation for FY2019 was $3.222 billion (excluding supplementals).
Table 5. NPS Full-Time Equivalent (FTE) Staff, FY2010-FY2019|
Year |
Number of FTEs |
Year |
Number of FTEs |
|
FY2009 |
20,991 |
FY2014 |
19, |
|
FY2010 |
22, |
FY2015 |
19, |
|
FY2011 |
22,051 |
FY2016 |
19, |
|
FY2012 |
21,830 |
FY2017 |
19, |
|
FY2013 |
20,720 |
|
19, |
Sources: FY2009FY2010-FY2015 numbers from U.S. Department of the Interior, "Department of the Interior FTE History: Full-Time Equivalent Staff Year (FTE) Actual of Bureaus and Offices," at https://www.doi.gov/sites/doi.gov/files/uploads/fte-_history_table-20161108.pdf. FY2016-FY2018FY2019 numbers from NPS budget justifications.
Note: NPS's FTE estimate for NPS's discretionary appropriations fluctuated over the past decade, with an overall trend of decline in the first part of the decade and growth in the second part. Supplemental appropriations for disaster relief increased the totals in FY2013, FY2018, and FY2019. Counting the supplementals, the total NPS discretionary appropriation for FY2019 was 22% higher than FY2010 in nominal dollars and 4% higher in inflation-adjusted dollars. Excluding supplementals, the FY2019 appropriation was 17% higher than FY2010 in nominal dollars and less than 1% higher in inflation-adjusted dollars. The share of total appropriations represented by each individual account in the NPS portfolio also fluctuated, although the account covering park operations represented the highest share by far throughout the decade. FY2018FY2019 was based on an appropriations baseline of $2.9243.202 billion derived from a continuing resolution, whereas the final NPS appropriation for FY2019 was $3.202222 billion, not including (excluding supplementals).
Summary
.
|
 |
Note: NPS's FTE estimate for FY2018 was based on an appropriations baseline of $2.924 billion derived from a continuing resolution, whereas the final NPS appropriation was $3.202 billion, not including supplementals. |
Conclusion
NPS's appropriations fluctuated over the past decade, and supplemental appropriations notably increased the totals in FY2009, FY2013, and FY2018. Counting the supplementals, the total NPS discretionary appropriation for FY2018 was 5.6% higher than FY2009 in nominal dollars but 8.0% lower in inflation-adjusted dollars. Excluding supplementals, the FY2018 appropriation was higher than FY2009 in both nominal (+26.8%) and inflation-adjusted (+10.5%) dollars. The overall trend was one of decline in the first part of the decade and growth in the second part. The share of total appropriations represented by each individual account in the NPS portfolio also fluctuated, and overall changes in share vary depending on whether or not supplemental appropriations are counted.
The funding changes took place in the context of a park system of relatively stable size and a staffing level that hovered around 20,000. Although park acreage grew only slightly, 26 units were added to the system during the decade. Visits to the parks generally were higher in the second half of the decade than the first and peaked in 2016 at approximately 331 million visits.
A major funding issue for NPS is infrastructure reinvestment. The agency's backlog of deferred maintenance and repairs for its infrastructure was estimated at $11.6192 billion for FY2017. Funding for both of the discretionary appropriations accountsFY2018. The identified backlog amount declined in inflation-adjusted dollars but grew in nominal dollars over the decade. Combined funding for two discretionary subaccounts that mainly address deferred maintenance (within the ONPS and Construction accounts) increased by about 50% in inflation-adjusted dollars over this periodONPS and Construction) decreased over the decade if supplementals are counted in the measurement but increased if supplementals are excluded. NPS's infrastructure needs continue to receive attention in the 115116th Congress, both within and outside the annual appropriations process.
Author Contact Information
Footnotes
| 1. |
The figures and tables in this report generally reflect rescissions and supplemental appropriations to date, including |
|||||||||||||||||||
| 2. |
The Land Acquisition and State Assistance account constitutes NPS's portion of appropriations from the Land and Water Conservation Fund (LWCF). |
|||||||||||||||||||
| 3. |
| |||||||||||||||||||
| 4. |
The account was titled Centennial Challenge in FY2015-FY2018, but it was called Park Partnership Project Grants in FY2010. |
|||||||||||||||||||
| 5. |
The backlog is estimated at $11.6 billion for FY2017. For more information, see CRS Report R44924, The National Park Service's Maintenance Backlog: Frequently Asked Questions, by Laura B. Comay. "Signature" projects and programs are to be identified by the Interior Secretary and must "help prepare the national parks for another century of conservation, preservation, and visitor enjoyment" (P.L. 114-289). |
|||||||||||||||||||
| 4.
|
|
However, the calculation of ONPS's percentage share of total NPS appropriations for FY2019 takes into account FY2019 supplemental appropriations to other accounts. |
The park support activity includes administering, managing, and supporting the operations of park units. | |||||||||||||||||
| 7. |
|
|||||||||||||||||||
|
These calculations use funding amounts from annual House Appropriations Committee detailed tables for NPS. | ||||||||||||||||||||
| 9. |
It is not possible to assess growth or decline in funding for the line-item construction activity (or other activities in the account) over the decade, because much of the FY2018 funding was given as a "general program increase," without being assigned to a specific activity. |
|||||||||||||||||||
| 10. |
A fuller description of NPS's two-tier priority system is in the agency's FY2019 budget justification, p. Const-8, at https://www.nps.gov/aboutus/upload/FY2019-NPS-Budget-Justification.pdf. |
|||||||||||||||||||
| 11. |
National heritage areas are established by Congress but are not federally managed, and they are not part of the National Park System. For more on national heritage areas, see CRS Report RL33462, Heritage Areas: Background, Proposals, and Current Issues, by Laura B. Comay and Carol Hardy Vincent. |
|||||||||||||||||||
| 12. |
In inflation-adjusted dollars, the FY2018 appropriation for heritage area partnerships was 12.7% higher than the FY2009 appropriation. |
|||||||||||||||||||
| 7.
|
|
Unlike other inflation adjustments in this report, the inflation adjustment for deferred maintenance is calculated using an index from the Bureau of Economic Analysis that specifically reflects inflation associated with nondefense infrastructure. Bureau of Economic Analysis, Table 3.9.4, "Price Indexes for Government Consumption Expenditures and Gross Investment," for nondefense structures, annual indexes, at https://apps.bea.gov/iTable/iTable.cfm?reqid=19&step=2#reqid=19&step=2&isuri=1&1921=survey. 8.
|
|
The amount for the Line-Item Construction and Maintenance budget activity for FY2019 ($259.3 million) is from CRS communication with NPS Budget Office, June 5, 2019, and includes an allocation from a "general program increase" appropriated by Congress for the NPS Construction account, in addition to the amount appropriated specifically for Line-Item Construction and Maintenance. The amount does not reflect the FY2019 supplemental appropriation in P.L. 116-20, as the supplemental was not assigned to any specific budget activity. 9.
|
|
NPS, Budget Justifications and Performance Information, Fiscal Year 2020, p. Const-9, at https://www.doi.gov/sites/doi.gov/files/fy2020-nps-justification.pdf. 10.
|
|
P.L. 89-665, as amended; 54 U.S.C. §§300101 et seq. 11.
|
|
P.L. 113-2, P.L. 115-123, and P.L. 116-20. The FY2019 funds also were for response to other types of natural disasters. 12.
|
54 U.S.C. §306108 |
|
||||||||
|
The fund receives $150 million annually from offshore oil and gas revenues, but the funding is available only to the extent appropriated by Congress. |
||||||||||||||||||||
| 15. |
P.L. 113-2 and P.L. 115-123. |
|||||||||||||||||||
| 16. | For more information on the LWCF, see CRS Report RL33531, Land and Water Conservation Fund: Overview, Funding History, and Issues, by Carol Hardy Vincent As with ONPS and NR&P, the LASA account did not receive supplemental appropriations during the decade. The appropriation for NPS federal acquisition also includes an amount for the American Battlefield Protection Program's (ABPP's) battlefield acquisition grants to states (54 U.S.C. §308103), even though this portion of the money is not for federal acquisitions. In FY2019, the amount for ABPP grants was $10.0 million (nominal dollars), and in FY2010 it was $9.0 million. National heritage areas are established by Congress but are not federally managed, and they are not part of the National Park System. For more on national heritage areas, see CRS Report RL33462, Heritage Areas: Background, Proposals, and Current Issues, by Laura B. Comay and Carol Hardy Vincent. In inflation-adjusted dollars, the FY2019 appropriation for heritage area partnerships was 2% lower than the FY2010 appropriation. The ABPP's planning grants are funded in the NR&P account, while grants to states for battlefield land acquisition are funded in the LASA account. The account provides the federal share of matching grants for "signature" park projects and programs, primarily aimed at addressing deferred maintenance. "Signature" projects and programs are to be identified by the Interior Secretary and must "help prepare the national parks for another century of conservation, preservation, and visitor enjoyment" (P.L. 114-289). The Centennial Challenge account was funded in FY2010 under the title "Park Partnership Grants." For a discussion of offsetting collections in the federal budget process, see CRS Report 98-721, Introduction to the Federal Budget Process, coordinated by James V. Saturno. The Centennial Challenge account received no supplemental funding during the decade. | |||||||||||||||||||
| 17. |
For a discussion of offsetting collections in the federal budget process, see CRS Report 98-721, Introduction to the Federal Budget Process, coordinated by James V. Saturno. |
|||||||||||||||||||
| 18. |
No supplemental funding affected the Centennial Challenge account during the decade. |
|||||||||||||||||||
| 19. |
Almost all of the system's federally owned lands are directly administered by NPS. However, the federally owned portion of the system also includes some NPS "less than fee" acres (e.g., conservation easements or rights-of-way) and some lands managed by other federal agencies, such as the Bureau of Reclamation, the Forest Service, or the Fish and Wildlife Service. Taken together, these lands amount to about 1% of the federally owned portion of the system. |
|||||||||||||||||||
| 20. |
| |||||||||||||||||||
| 21. | Almost all of the system's federally owned lands are directly administered by NPS. However, the federally owned portion of the system also includes some NPS "less than fee" acres (e.g., conservation easements or rights-of-way) and some lands managed by other federal agencies, such as the Bureau of Reclamation, the Forest Service, or the Fish and Wildlife Service. Taken together, these two types of lands amount to about 1% of the federally owned portion of the system. See footnote 23 for a list of all units added to the National Park System in the FY2010-FY2019 period to date. This increase compares 2018 visits with 2010 visits, since 2018 is the most recent year for which full information is available. For more information on federal government shutdowns, see CRS Report RS20348, Federal Funding Gaps: A Brief Overview, by James V. Saturno. |