U.S. Research and Development Funding and Performance: Fact Sheet
Changes from May 22, 2017 to June 29, 2018
This page shows textual changes in the document between the two versions indicated in the dates above. Textual matter removed in the later version is indicated with red strikethrough and textual matter added in the later version is indicated with blue.
U.S. Research and Development Funding and Performance: Fact Sheet
Research and development (R&D) in the United States is funded and performed by a number of sectors—including the federal government, state governments, businesses, academia, and nonprofit organizations—for a variety of purposes. This fact sheet begins by providing a profile of the U.S. R&D enterprise, including historical trends and current funding by sector and by whether the R&D is basic research, applied research, or development. The final section of this fact sheet includes data on R&D performance by sector.
Historical Trends in U.S. R&D Funding
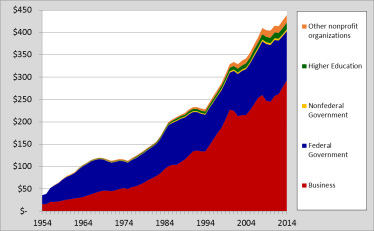
The United States became a global leader in R&D in the 20th century, funding as much as 7069% of annual global R&D in the period following World War II.1 Figure 1 shows the growth in total U.S. R&D expenditures from 1954 to 2014 in constant dollars.2 In current dollars, U.S. R&D in 2014 was more than 851953 to 2015 in current dollars.2 U.S. R&D in 2015 was 95 times higher than it was in 1954; it was1953 in current dollars, and 12 times higher in constant dollars.3 By sector, business-funded R&D grew the most during this period. However, faster growth in aggregatetotal R&D spending of other nations has reduced the U.S. share of global R&D to approximately 2928% in 20142015.4
|
Figure 1. U.S. R&D Expenditures by Source of Funding,
|
 |
|
Source: CRS analysis of National Science Foundation, National Patterns of R&D Resources: Notes: Figure includes data through 2015 although the final year shown on the axis is 2013. |
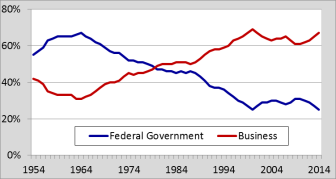
Two sectors—business and the federal government—have accounted for more than 90% of U.S. R&D funding since 1953. Federal R&D expenditures as a share of total U.S. R&D expenditures peaked in 1964 at 66.8%, the same year that business R&D expenditures reached a nadir of 30.8%. Between 1964 and 2000, the federal government's share fell and business's share rose. In 2000, business accounted for 69.24% of U.S. R&D expenditures and the federal government 25.21%. This shift in the composition of R&D funding resulted not from a reduction in federal government R&D expenditures, but rather from faster growth in business R&D expenditures. Since 1995, business has accounted for 60%-70% of total U.S. R&D each year while the federal government has accounted for 25%-34%.24%-35%.5 (See Figure 2.)
Trends in Federally Funded R&D
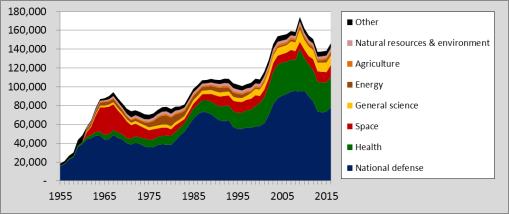
In current dollars, federal funding for R&D grew from $3.12.8 billion in 1954 to $119.81953 to $120.9 billion in 20142015, a compound annual growth rate (CAGR) of 6.3%. In constant dollars, federal R&D grew by a 2.9% CAGR during this period. However between 2011 and 2014, federal R&D funding, as measured in current dollars, fell for three consecutive years for the first time since such data has been collected; the total decline in federal funding for these years was $9.17.4 billion (7.15.9%). In constant dollars, federal R&D declined for five consecutive years from 2009 to 2014, a total drop of 13.5%; a deeper17.0%; a similar drop occurred from 1987 to 1994, when federal R&D fell by 15.8%.56 Figure 3 shows federal R&D funding by budget function in constant dollars from 19551953 to 2015.
Trends in U.S. Business-Funded R&D
Business funding of R&D has grown nearly every year (in current dollars) since 19541953. In current dollars, business-funded R&D grew from $2.42 billion in 19541953 to $318333.2.6 billion in 20142015, a compound annual growth rate (CAGR) of 8.54%. In constant dollars, business-funded R&D grew by a 5.0% CAGR during this period. In recent years, business-funded R&D has grown at a slower pace. Between 2000 and 20142015, business R&D grew by a 3.94.0% CAGR in current dollars, and by a 1.89% CAGR in constant dollars.6
|
Character of R&D: Definitions Basic research is conducted to gain more comprehensive knowledge or understanding of the subject under study without specific applications in mind. Applied research is conducted to gain knowledge or understanding to meet a specific, recognized need. Development is the systematic use of the knowledge or understanding gained from research directed toward the production of useful materials, devices, systems, or methods, including the design and development of prototypes and processes. Source: National Science Board, Science and Engineering Indicators 2014. |
Current Composition of U.S. R&D Funding
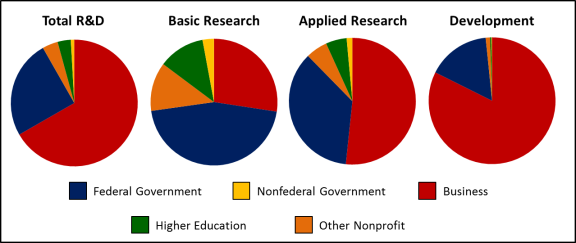
R&D funding can be categorized by the character of the work that it supports: basic research, applied research, and development. (See text box for definitions.) Total U.S. R&D expenditures in
20142015 (the most recent year for which data are available) were $477.7495.1 billion. Of this amount, $84.083.5 billion (17.616.9%) was for basic research, $93.697.2 billion (19.6%) was for applied research, and $300.1314.5 billion (62.863.5%) was for development.78
Table 1 shows total U.S. R&D expenditures in 20142015 by funding sector and character of work. Figure 4 shows this information graphically.
|
Sector |
Basic Research |
Applied Research |
Development |
Total |
||||
|
Dollars |
Percent |
Dollars |
Percent |
Dollars |
Percent |
Dollars |
Percent |
|
|
Federal Government |
$ |
45.4 |
$ |
36.0 |
$ |
16.0 |
$ |
25.1 |
|
Nonfederal Government |
2.4 |
2. |
$1.4 |
1.5 |
0. |
0. |
4. |
0.9 |
|
Business |
23.0 |
27. |
48.4 |
51.7 |
247.2 |
82. |
318.6 |
66.7 |
|
Higher Education |
10. |
11.9 |
5.0 |
5.3 |
1. |
0. |
16.0 |
3. |
|
Other Nonprofit Organizations |
10. |
12. |
5.2 |
5. |
3. |
1. |
19. |
4.0 |
|
Total |
$ |
100.0 |
$ |
100.0 |
$ |
100. |
$477.7 |
100.0 |
Source: CRS analysis of National Science Foundation, National Patterns of R&D Resources: 2014–152015–16 Data Update, March 14, 2017May 21, 2018.
Note: Rows and columns may not add to totals due to rounding.
| 2015 |
 |
|
Source: CRS analysis of National Science Foundation, National Patterns of R&D Resources: |
Current Composition of U.S. R&D Performance
R&D is often performed by sectors other than the one funding the R&D. For example, the federal government performs some of the research it funds, but also funds research performed by business, universities and colleges, and other organizations. Table 2 provides data on performance of U.S. R&D by sector and character of the work (basic research, applied research, and development).
|
Sector |
Basic |
Applied Research |
Development |
Total |
||||
|
Dollars |
Percent |
Dollars |
Percent |
Dollars |
Percent |
Dollars |
Percent |
|
|
Federal Government |
$10. |
12.0 |
$ |
16.6 |
$ |
8. |
$ |
10.9 |
|
Nonfederal Government |
n/a |
n/a |
n/a |
n/a |
n/a |
n/a |
0. |
0.1 |
|
Business |
21. |
26.1 |
53.4 |
57.0 |
265.4 |
88. |
340.7 |
71. |
|
Higher Education |
41. |
49. |
|
19.8 |
4.8 |
1.6 |
64.7 |
13. |
|
Other Nonprofit Organizations |
10. |
12.6 |
5.9 |
6.3 |
3.0 |
1.0 |
19. |
4. |
|
Total |
$ |
100.0 |
$ |
100.0 |
$ |
100.0 |
$ |
100.0 |
Source: CRS analysis of National Science Foundation, National Patterns of R&D Resources: 2014–152015–16 Data Update, March 14, 2017May 21, 2018.
Note: Rows and columns may not add to totals due to rounding.
Author Contact Information
Footnotes
| 1. |
Office of Technology Policy, U.S. Department of Commerce, The Global Context for U.S. Technology Policy, 1997. |
| 2. |
Data for all years in this report are for calendar years unless otherwise specified. |
| 3. |
|
| 4. |
|
| 5. |
CRS analysis of data from National Science Foundation, National Patterns of R&D Resources: |
| 6. |
Ibid. |
| 7. |
Ibid. |
| 8. |
Ibid. |