Federal Spending on Benefits and Services for People with Low Income: FY2008-FY2018 Update
The Congressional Research Service (CRS) regularly receives requests about federal benefits and services targeted to low-income populations. This report is the latest update in a series of CRS reports that attempt to identify and provide information about federal spending targeted to this population. The report series does not discuss social insurance programs such as Social Security, Medicare, or Unemployment Insurance, but includes only programs with an explicit focus on low-income people or communities. Tax provisions, other than the refundable portion of two tax credits, are excluded. Past reports in this series include the following:
CRS Report R44574, Federal Benefits and Services for People with Low Income: Overview of Spending Trends, FY2008-FY2015, and
CRS Report R43863, Federal Benefits and Services for People with Low Income: Programs and Spending, FY2008-FY2013.
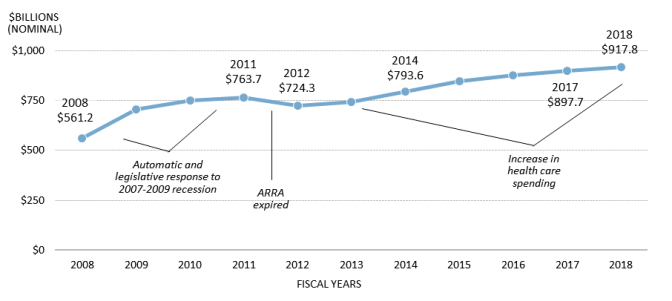
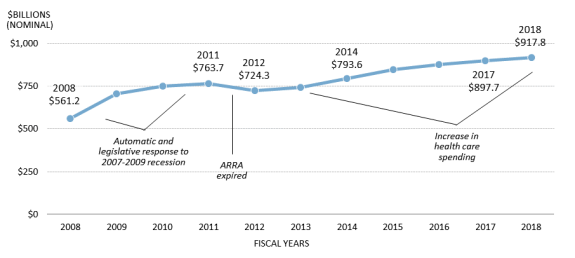
This current report is intended to provide a brief update of federal spending during FY2008-FY2018 for programs or activities identified in past reports. This report has not been updated to include information on new programs or activities; it simply provides information on the programs or activities that had previously been identified. Over the course of the 11-year period examined, federal spending on people with low income increased by 64% in nominal terms, peaking at nearly $918 billion in FY2018. Increases in recent years were largely driven by spending on health care.
Federal Spending on Benefits and Services for People with Low Income, FY2008-FY2018
/
Source: Prepared by the Congressional Research Service (CRS) from information contained in federal budget documents for President’s budget submissions, FY2010 through FY2020.
Notes: ARRA = American Recovery and Reinvestment Act of 2009 (P.L. 111-5).
Key findings include the following:
No single label best describes all programs with a low-income focus, and no single trait characterizes those who benefit. Programs are highly diverse in their purpose, design, and target population. Readers should use caution in making generalizations about the programs described in this report.
Total federal spending on low-income programs in nominal terms rose sharply between FY2008 and FY2009 as the Great Recession took hold. Spending stabilized in FY2011, but it has increased at a fairly steady pace since FY2012 largely due to increases in health care spending.
The peak spending year in this window was FY2018, when federal spending on low-income populations totaled $918 billion. This represents a nominal increase of 64% from FY2008.
Health care is the single largest category of low-income spending and tends to drive overall trends. In each year, spending on health care has accounted for roughly half of all spending; since FY2015, it has accounted for just over half of all spending. The single largest program within the health category is Medicaid.
After health care, cash aid and food assistance are the next largest categories, with food assistance seeing a 59% nominal increase over the 11-year period. Other categories (in descending size based on FY2018 spending) are housing and development, education, social services, employment and training, and energy assistance.
Most low-income spending is classified in budgetary terms as mandatory (or direct), which means the amount spent is a function of eligibility and payment rules established in authorizing laws. The amount spent for the remaining discretionary programs is controlled through the annual appropriations process. In some cases, programs receive both mandatory and discretionary funding. In FY2018, 81% of low-income spending was mandatory-only, 15% was discretionary-only, and 4% was spent on programs receiving both mandatory and discretionary funding.
Four programs accounted for 68% of low-income spending in FY2018 and ten programs made up 82%. Medicaid alone represented 48% of the total. In addition to Medicaid, the top four include the Supplemental Nutrition Assistance Program (SNAP), the refundable portion of the Earned Income Tax Credit (EITC), and Supplemental Security Income (SSI).
Federal Spending on Benefits and Services for People with Low Income: FY2008-FY2018 Update
Jump to Main Text of Report
Contents
- Introduction
- Trends in Federal Spending on Benefits and Services for People with Low Income
- Federal Spending on Benefits and Services for Low-Income People by Category
- Mandatory and Discretionary Spending
- Federal Spending on Benefits and Services for Low-Income People by Program
Figures
- Figure 1. Federal Spending on Benefits and Services for People with Low Income, FY2008-FY2018
- Figure 2. Federal Spending on Benefits and Services for People with Low Income, Health and Non-health, FY2008-FY2018
- Figure 3. Federal Spending on Benefits and Services for People with Low Income, by Budget Classification, FY2018
Summary
The Congressional Research Service (CRS) regularly receives requests about federal benefits and services targeted to low-income populations. This report is the latest update in a series of CRS reports that attempt to identify and provide information about federal spending targeted to this population. The report series does not discuss social insurance programs such as Social Security, Medicare, or Unemployment Insurance, but includes only programs with an explicit focus on low-income people or communities. Tax provisions, other than the refundable portion of two tax credits, are excluded. Past reports in this series include the following:
- CRS Report R44574, Federal Benefits and Services for People with Low Income: Overview of Spending Trends, FY2008-FY2015, and
- CRS Report R43863, Federal Benefits and Services for People with Low Income: Programs and Spending, FY2008-FY2013.
This current report is intended to provide a brief update of federal spending during FY2008-FY2018 for programs or activities identified in past reports. This report has not been updated to include information on new programs or activities; it simply provides information on the programs or activities that had previously been identified. Over the course of the 11-year period examined, federal spending on people with low income increased by 64% in nominal terms, peaking at nearly $918 billion in FY2018. Increases in recent years were largely driven by spending on health care.
|
Federal Spending on Benefits and Services for People with Low Income, FY2008-FY2018 |
 |
|
Source: Prepared by the Congressional Research Service (CRS) from information contained in federal budget documents for President's budget submissions, FY2010 through FY2020. Notes: ARRA = American Recovery and Reinvestment Act of 2009 (P.L. 111-5). |
Key findings include the following:
- No single label best describes all programs with a low-income focus, and no single trait characterizes those who benefit. Programs are highly diverse in their purpose, design, and target population. Readers should use caution in making generalizations about the programs described in this report.
- Total federal spending on low-income programs in nominal terms rose sharply between FY2008 and FY2009 as the Great Recession took hold. Spending stabilized in FY2011, but it has increased at a fairly steady pace since FY2012 largely due to increases in health care spending.
- The peak spending year in this window was FY2018, when federal spending on low-income populations totaled $918 billion. This represents a nominal increase of 64% from FY2008.
- Health care is the single largest category of low-income spending and tends to drive overall trends. In each year, spending on health care has accounted for roughly half of all spending; since FY2015, it has accounted for just over half of all spending. The single largest program within the health category is Medicaid.
- After health care, cash aid and food assistance are the next largest categories, with food assistance seeing a 59% nominal increase over the 11-year period. Other categories (in descending size based on FY2018 spending) are housing and development, education, social services, employment and training, and energy assistance.
- Most low-income spending is classified in budgetary terms as mandatory (or direct), which means the amount spent is a function of eligibility and payment rules established in authorizing laws. The amount spent for the remaining discretionary programs is controlled through the annual appropriations process. In some cases, programs receive both mandatory and discretionary funding. In FY2018, 81% of low-income spending was mandatory-only, 15% was discretionary-only, and 4% was spent on programs receiving both mandatory and discretionary funding.
- Four programs accounted for 68% of low-income spending in FY2018 and ten programs made up 82%. Medicaid alone represented 48% of the total. In addition to Medicaid, the top four include the Supplemental Nutrition Assistance Program (SNAP), the refundable portion of the Earned Income Tax Credit (EITC), and Supplemental Security Income (SSI).
Introduction
The Congressional Research Service (CRS) regularly receives requests about spending on programs and activities that target low-income individuals and families for benefits and services. CRS has produced a series of reports that identify these programs and provides their spending amounts and recent spending trends.1 This current report provides an interim update of the federal spending for programs and activities identified in CRS Report R44574, Federal Benefits and Services for People with Low Income: Overview of Spending Trends, FY2008-FY2015, extending the spending analysis through FY2018, the most recent year for which federal spending data were available as of January 2020.
In FY2018, the federal government spent $917.8 billion on benefits and services for people with low income. This was an increase of 2.2% compared to FY2017, which was less than the rate of economic growth (5.4%) and nearly equal to the rate of inflation (2.3%) during FY2018.2
|
Concepts Used in this Report, and Caveats In general, programs were included in this report series if they (1) have provisions that base an individual's eligibility or priority for service on a measure (or proxy) of low income; (2) target resources in some way (e.g., through allocation formulas, variable matching rates) using a measure (or proxy) of low income; or (3) prioritize services to low-income segments of a larger target population. The programs in this report also had spending of $100 million or more. Programs that did not reach $100 million in at least one year covered by this analysis are not included in the aggregate spending numbers presented in this report. In cases where programs in this report reached the $100 million threshold for some but not all of the fiscal years between FY2008 and FY2018, spending in the years that were below the threshold are represented as $0 in the report tables and are not included in the spending aggregates. Additionally, please consider the following:
|
While the programs in this report share the common feature of an explicit low-income focus, the individual programs are highly diverse in their purpose, design, and target population. They were established at different times, in response to different policy challenges. In terms of target population, the largest portion of low-income assistance goes to families with children with working parents and the disabled (see CRS In Focus IF10355, Need-Tested Benefit Receipt by Families and Individuals).
Trends in Federal Spending on Benefits and Services for People with Low Income
Figure 1 shows the trend in federal spending in nominal terms on benefits and services for people with low income for FY2008 through FY2018. The early portion, FY2008 through FY2011, represents a period of time where spending increased because of automatic or legislated responses to the recession of 2007 through 2009. The largest low-income assistance programs are entitlements, and their spending increased automatically as more people became eligible for their benefits as incomes fell due to the recession. Additionally, Congress and the President responded to the recession with time-limited expansions or funding increases in some of these programs in the American Recovery and Reinvestment Act of 2009 (ARRA, P.L. 111-5). Total spending on these programs increased by 36% over this period.
Federal spending on benefits and services for low-income people stabilized in FY2011 and FY2012 as ARRA expired and other spending increases associated with the recession abated. However, from FY2012 through FY2018, spending for these programs increased at a steady pace, stemming from increases in spending on health care for low-income people.
|
Figure 1. Federal Spending on Benefits and Services for People with Low Income, FY2008-FY2018 |
 |
|
Source: Prepared by the Congressional Research Service (CRS) from information contained in federal budget documents for President's budget submissions, FY2010 through FY2020. Notes: ARRA = American Recovery and Reinvestment Act of 2009 (P.L. 111-5). |
Federal Spending on Benefits and Services for Low-Income People by Category
CRS's series of reports on benefits and services for low-income people divides spending for the programs into eight categories:
- health care,
- cash aid,
- food aid,
- education,
- housing and development,
- social services,
- employment and training, and
- energy assistance.
Table 1 shows federal spending for the programs by category for FY2008 through FY2018. The categories are sorted by the amount of their spending in FY2018, with the largest (health care) first and the smallest (energy aid) last. Health care represents more than half of total spending for the programs in FY2018 and more than three times the amount of the next largest category, cash aid. The two smallest categories are employment and training programs (exclusive of education spending) and energy assistance.
Table 1. Federal Spending on Benefits and Services for People with Low Income, by Category, FY2008-FY2018
Billions of dollars
|
2008 |
2009 |
2010 |
2011 |
2012 |
2013 |
2014 |
2015 |
2016 |
2017 |
2018 |
|
|
Health Care |
$259.2 |
$318.8 |
$347.0 |
$352.2 |
$328.1 |
$344.0 |
$389.2 |
$444.2 |
$467.6 |
$495.7 |
$518.2 |
|
Cash Aid |
116.4 |
129.6 |
145.3 |
149.1 |
142.4 |
150.3 |
155.3 |
154.6 |
158.8 |
152.6 |
145.6 |
|
Food Aid |
58.9 |
77.6 |
93.9 |
101.4 |
104.8 |
107.1 |
102.0 |
103.1 |
100.7 |
97.8 |
93.7 |
|
Housing and Development |
39.7 |
60.0 |
51.8 |
46.2 |
44.0 |
41.4 |
45.1 |
44.6 |
46.3 |
45.8 |
53.5 |
|
Education |
41.9 |
58.2 |
58.6 |
66.5 |
58.6 |
55.1 |
53.7 |
52.2 |
53.7 |
53.5 |
52.2 |
|
Social Services |
36.0 |
43.9 |
39.7 |
37.0 |
36.7 |
36.7 |
38.1 |
38.4 |
39.7 |
40.7 |
43.2 |
|
Employment and Training |
6.2 |
8.6 |
7.7 |
6.5 |
6.1 |
6.0 |
6.5 |
7.0 |
6.8 |
7.9 |
7.4 |
|
Energy Assistance |
2.9 |
10.3 |
5.6 |
4.9 |
3.6 |
3.4 |
3.6 |
3.7 |
3.6 |
3.7 |
3.9 |
|
Total |
561.2 |
707.2 |
749.7 |
763.7 |
724.3 |
744.1 |
793.6 |
847.8 |
877.3 |
897.7 |
917.8 |
Source: Prepared by the Congressional Research Service (CRS) from information contained in federal budget documents for President's budget submissions, FY2010 through FY2020. Totals may not sum due to rounding.
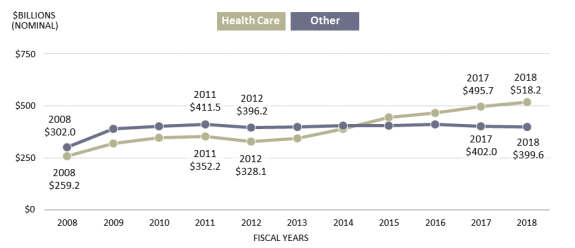
Figure 2 breaks out total federal spending on benefits and services for people with low income into two groups: health programs and all other programs. As shown in the figure, the increase in nominal spending in the earlier portion of the period (affected by recession-related spending) stemmed from increases in both health and other program spending. However, since FY2012 the increase is attributable to higher spending on health care. Spending on all other programs (collectively) has decreased each year since FY2016. Much of the increase in health spending is from the Medicaid program, and since FY2014 reflects increases in spending due to the Patient Protection and Affordable Care Act's (ACA, P.L. 111-148 as amended)3 Medicaid expansion.4
Mandatory and Discretionary Spending
The largest programs providing benefits and services to low-income people are mandatory spending programs. These are programs where spending is controlled by the terms of their authorizing laws—such as entitlements either to individuals or states—rather than the annual appropriation process. Discretionary spending is generally determined through annual appropriations.
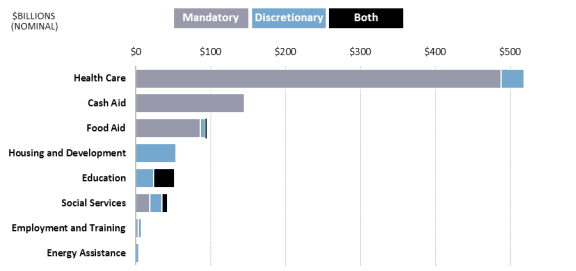
Figure 3 shows federal spending in FY2018 on benefits and services for people with low income by category and budget classification (mandatory, discretionary, or some programs have spending classified as both). The largest categories (health, cash aid, and food aid) are dominated by mandatory spending. Housing is almost entirely discretionary spending, determined through annual appropriations. Education is split between discretionary spending and the Pell Grant program, which has both mandatory and discretionary components. Social services and employment and training have a mix of mandatory spending (much of it coming from the broad-based Temporary Assistance for Needy Families (TANF) block grant) and discretionary funding. Energy assistance is entirely discretionary.
Of the $917.8 billion spent by the federal government on benefits and services for people with low income in FY2018, $741.2 billion (81%) was spent on programs or activities receiving only mandatory funding and $139.7 billion (15%) was spent on programs or activities receiving only discretionary funding. The remaining $37.0 billion of spending occurred in programs receiving both mandatory and discretionary funding.5 Health care is a major source of mandatory spending: 94% of all health care spending discussed in this report was mandatory spending in FY2018.
Federal Spending on Benefits and Services for Low-Income People by Program
Table 2 shows spending for federal benefits and services to low-income persons by program for FY2008 to FY2018. The programs were classified into the eight categories of spending noted above, and are ranked within each category by FY2018 spending. Note that in many categories, spending is dominated by a few large programs. For example, in FY2018, Medicaid accounted for 85% of health care spending, Supplemental Security Income and two refundable tax credits for low-income workers (the Earned Income Tax Credit and the refundable portion of the Child Tax Credit) accounted for 93% of all cash aid, Supplemental Nutrition Assistance Program (SNAP) accounted for 67% of all food aid, and Pell Grants plus aid to school districts with large shares of disadvantaged children accounted for 81% of all education aid.
Most programs had spending that was classified in a single category. The exceptions are the broad-purpose TANF block grant and SNAP. TANF is best known as a program that provides cash assistance to needy families with children. TANF accounted for $5.2 billion in federal spending on cash aid in FY2018, making it the fourth-largest cash program and representative of 4% of cash spending. In contrast, TANF spending on social services made it the second-largest social services program (behind only Head Start), and its employment and training expenditures made it the largest employment and training program. SNAP spending was divided into its food assistance and its employment and training components. SNAP was the largest food assistance program ($63 billion in food assistance in FY2018), but it also contributed $441 million in employment and training expenditures in FY2018.
Table 2. Federal Spending on Benefits and Services for Low-Income People, by Program, FY2008-FY2018
(Dollars in millions)
|
Program |
FY08 |
FY09 |
FY10 |
FY11 |
FY12 |
FY13 |
FY14 |
FY15 |
FY16 |
FY17 |
FY18 |
|
Health Care |
|||||||||||
|
Medicaid |
$214,015 |
$265,058 |
$290,461 |
$295,836 |
$270,914 |
$286,920 |
$329,019 |
$378,896 |
$398,217 |
$422,045 |
$441,392 |
|
Medicare Part D Prescription Drug Benefit—Low-Income Subsidy |
18,100 |
19,600 |
21,100 |
22,200 |
22,500 |
23,200 |
24,300 |
25,600 |
26,400 |
27,300 |
28,600 |
|
State Children's Health Insurance Program (CHIP) |
6,360 |
9,534 |
10,717 |
8,740 |
9,362 |
9,357 |
10,111 |
11,353 |
14,069 |
15,966 |
17,489 |
|
Medical Care for Veterans without Service-Connected Disabilitya |
10,246 |
11,201 |
11,780 |
12,000 |
11,970 |
11,737 |
11,921 |
13,087 |
13,130 |
15,715 |
15,644 |
|
Indian Health Service |
4,347 |
5,416 |
5,668 |
5,544 |
5,729 |
5,661 |
5,910 |
6,074 |
5,207 |
5,398 |
5,711 |
|
Consolidated Health Centers |
2,021 |
3,665 |
3,049 |
3,295 |
3,384 |
2,882 |
3,587 |
4,701 |
5,040 |
5,188 |
5,562 |
|
Ryan White HIV/AIDS Program |
2,141 |
2,227 |
2,286 |
2,310 |
2,367 |
2,220 |
2,290 |
2,318 |
2,266 |
2,339 |
2,355 |
|
Maternal and Child Health Block Grant |
666 |
662 |
661 |
656 |
639 |
605 |
632 |
637 |
637 |
640 |
650 |
|
Family Planning |
300 |
307 |
316 |
298 |
294 |
278 |
286 |
286 |
286 |
286 |
286 |
|
Transitional Cash and Medical Services for Refugees |
296 |
282 |
353 |
353 |
323 |
401 |
391 |
383 |
532 |
490 |
245 |
|
Breast/Cervical Cancer Early Detection |
201 |
206 |
210 |
206 |
213 |
197 |
207 |
207 |
209 |
210 |
218 |
|
State Grants and Demonstrations |
556 |
625 |
418 |
758 |
416 |
534 |
524 |
680 |
1,559 |
111 |
0 |
|
Total Health Care |
259,249 |
318,783 |
347,019 |
352,196 |
328,111 |
343,992 |
389,178 |
444,222 |
467,553 |
495,688 |
518,152 |
|
Cash Aid |
|||||||||||
|
Earned Income Tax Credit (EITC) (refundable component) |
40,600 |
42,418 |
54,712 |
55,652 |
54,890 |
57,513 |
60,087 |
60,084 |
60,580 |
59,749 |
58,640 |
|
Supplemental Security Income (SSI) |
48,926 |
52,446 |
54,463 |
59,854 |
53,773 |
59,756 |
62,159 |
62,055 |
66,751 |
62,544 |
57,934 |
|
Additional Child Tax Credit (refundable portion) |
16,690 |
24,284 |
22,659 |
22,691 |
22,106 |
21,608 |
21,490 |
20,592 |
20,188 |
19,408 |
18,597 |
|
Temporary Assistance for Needy Families (TANF) |
6,364 |
6,341 |
9,118 |
6,594 |
6,737 |
6,263 |
6,340 |
6,404 |
5,856 |
5,562 |
5,247 |
|
Pensions for Needy Veterans |
3,777 |
4,134 |
4,345 |
4,294 |
4,892 |
5,195 |
5,258 |
5,497 |
5,468 |
5,386 |
5,230 |
|
Total Cash Aid |
116,357 |
129,623 |
145,297 |
149,085 |
142,398 |
150,335 |
155,334 |
154,632 |
158,843 |
152,649 |
145,648 |
|
Food Aid |
|||||||||||
|
Supplemental Nutrition Assistance Program (SNAP) |
37,179 |
53,396 |
68,192 |
74,943 |
77,828 |
79,365 |
73,721 |
73,615 |
70,406 |
67,545 |
63,111 |
|
National School Lunch Program (free/reduced price components) |
7,863 |
8,498 |
9,462 |
9,831 |
9,984 |
10,549 |
10,801 |
11,515 |
11,777 |
11,830 |
12,270 |
|
Special Supplemental Nutrition Program for Women, Infants and Children (WIC) |
6,400 |
7,028 |
7,245 |
7,300 |
7,168 |
6,945 |
7,019 |
6,774 |
6,864 |
6,665 |
6,039 |
|
School Breakfast Program (free/reduced price components) |
2,307 |
2,513 |
2,811 |
2,987 |
3,256 |
3,514 |
3,618 |
3,956 |
4,135 |
4,278 |
4,531 |
|
Child and Adult Care Food Program (lower-income components) |
2,029 |
2,217 |
2,358 |
2,499 |
2,616 |
2,799 |
2,920 |
3,154 |
3,259 |
3,450 |
3,550 |
|
Nutrition Assistance for Puerto Rico |
1,623 |
2,000 |
2,000 |
2,001 |
2,000 |
2,001 |
1,903 |
1,951 |
1,959 |
1,949 |
1,919 |
|
Nutrition Program for the Elderly |
756 |
905 |
817 |
820 |
814 |
765 |
807 |
812 |
834 |
833 |
895 |
|
Summer Food Service Program |
312 |
356 |
374 |
377 |
400 |
437 |
464 |
517 |
540 |
506 |
512 |
|
The Emergency Food Assistance Program (TEFAP) |
240 |
425 |
359 |
298 |
309 |
312 |
318 |
370 |
374 |
245 |
350 |
|
Commodity Supplemental Food Program |
141 |
165 |
183 |
196 |
189 |
187 |
180 |
198 |
223 |
206 |
246 |
|
Fresh Fruit and Vegetable Program |
0 |
0 |
0 |
115 |
157 |
165 |
166 |
139 |
167 |
184 |
175 |
|
Food Distribution Program on Indian Reservations (FDPIR) |
0 |
119 |
114 |
0 |
103 |
100 |
119 |
143 |
145 |
145 |
145 |
|
Total Food Aid |
58,850 |
77,622 |
93,915 |
101,367 |
104,824 |
107,139 |
102,036 |
103,144 |
100,683 |
97,836 |
93,743 |
|
Housing |
|||||||||||
|
Section 8 Housing Choice Vouchers |
15,552 |
16,289 |
18,071 |
18,510 |
18,316 |
17,897 |
19,181 |
19,333 |
19,634 |
20,313 |
21,698 |
|
Section 8 Project-Based Rental Assistance |
7,004 |
9,390 |
8,991 |
9,444 |
9,311 |
8,818 |
9,870 |
9,810 |
10,680 |
11,108 |
11,623 |
|
Public Housing |
6,894 |
10,843 |
7,360 |
6,999 |
5,847 |
5,954 |
6,383 |
6,421 |
5,954 |
5,930 |
7,680 |
|
Community Development Block Grants |
3,645 |
4,733 |
3,956 |
3,341 |
3,245 |
2,971 |
3,213 |
2,664 |
3,193 |
1,990 |
3,989 |
|
Homeless Assistance Grants |
1,538 |
2,861 |
1,813 |
1,888 |
2,079 |
2,086 |
1,957 |
2,109 |
2,137 |
2,218 |
2,487 |
|
Home Investment Partnerships Program (HOME) |
1,647 |
1,911 |
1,857 |
1,485 |
1,208 |
919 |
1,023 |
848 |
961 |
572 |
1,486 |
|
Rural Rental Assistance Program |
479 |
902 |
979 |
954 |
905 |
837 |
1,110 |
1,088 |
1,390 |
1,365 |
1,345 |
|
Water and Waste Disposal for Rural Communities |
685 |
1,370 |
1,443 |
648 |
583 |
524 |
685 |
604 |
622 |
672 |
1,084 |
|
Indian Housing Block Grants |
556 |
1,149 |
762 |
663 |
691 |
627 |
665 |
653 |
670 |
652 |
684 |
|
Supportive Housing for the Elderly |
778 |
800 |
580 |
509 |
1,056 |
389 |
362 |
456 |
437 |
535 |
626 |
|
Housing Opportunities for Persons with AIDS (HOPWA) |
310 |
318 |
314 |
352 |
352 |
302 |
349 |
290 |
342 |
163 |
494 |
|
Supportive Housing for Persons with Disabilities |
256 |
284 |
216 |
149 |
243 |
102 |
209 |
207 |
189 |
149 |
155 |
|
Public Works and Economic Development |
170 |
285 |
149 |
115 |
129 |
0 |
133 |
101 |
111 |
121 |
138 |
|
Grants to States for Low-Income Housing in Lieu of Low-Income Housing Credit Allocations |
0 |
2,465 |
3,083 |
160 |
0 |
0 |
0 |
0 |
0 |
0 |
0 |
|
Single-Family Rural Housing Loans |
178 |
279 |
277 |
0 |
0 |
0 |
0 |
0 |
0 |
0 |
0 |
|
Neighborhood Stabilization Program-1 (NSP-1) |
0 |
3,920 |
1,980 |
969 |
0 |
0 |
0 |
0 |
0 |
0 |
0 |
|
Tax Credit Assistance Program |
0 |
2,250 |
0 |
0 |
0 |
0 |
0 |
0 |
0 |
0 |
0 |
|
Total Housing |
39,692 |
60,049 |
51,831 |
46,186 |
43,965 |
41,426 |
45,140 |
44,584 |
46,320 |
45,788 |
53,489 |
|
Education |
|||||||||||
|
Federal Pell Grants |
18,000 |
26,019 |
32,905 |
41,458 |
34,308 |
31,887 |
29,808 |
28,153 |
29,106 |
28,565 |
26,514 |
|
Education for the Disadvantaged—Grants to Local Educational Agencies (Title I-A) |
13,352 |
21,495 |
14,526 |
14,472 |
14,490 |
13,757 |
14,383 |
14,410 |
14,893 |
15,474 |
15,758 |
|
Improving Teacher Quality State Grants |
2,946 |
2,687 |
2,955 |
2,460 |
2,450 |
2,334 |
2,341 |
2,370 |
2,325 |
2,117 |
2,050 |
|
21st Century Community Learning Centers |
1,082 |
1,127 |
1,166 |
1,157 |
1,150 |
1,091 |
1,146 |
1,149 |
1,163 |
1,191 |
1,210 |
|
Federal Work-Study |
989 |
1,156 |
995 |
986 |
986 |
934 |
978 |
990 |
990 |
990 |
1,130 |
|
Federal TRIO Programs |
885 |
905 |
910 |
883 |
840 |
796 |
838 |
840 |
900 |
950 |
1,010 |
|
Indian Education |
684 |
699 |
784 |
753 |
803 |
766 |
747 |
808 |
835 |
856 |
914 |
|
Higher Education—Institutional Aid and Developing Institutions |
755 |
801 |
764 |
833 |
816 |
780 |
792 |
777 |
818 |
825 |
906 |
|
Federal Supplemental Educational Opportunity Grant |
759 |
760 |
759 |
740 |
738 |
698 |
736 |
733 |
733 |
733 |
840 |
|
Adult Basic Education Grants to States |
569 |
585 |
641 |
607 |
606 |
576 |
575 |
593 |
597 |
589 |
634 |
|
Title I Migrant Education Program |
380 |
395 |
395 |
394 |
393 |
373 |
375 |
375 |
375 |
375 |
375 |
|
Gaining Early Awareness and Readiness for Undergraduate Programs (GEAR-UP) |
303 |
313 |
323 |
303 |
302 |
286 |
302 |
302 |
323 |
340 |
350 |
|
Preschool Development Grants |
0 |
0 |
0 |
497 |
133 |
370 |
250 |
250 |
250 |
250 |
248 |
|
Rural Education Achievement Program |
172 |
174 |
175 |
175 |
179 |
170 |
170 |
170 |
176 |
177 |
181 |
|
Indian Education Grants to Local Educational Agencies |
0 |
0 |
104 |
104 |
106 |
100 |
100 |
100 |
100 |
100 |
105 |
|
Mathematics and Science Partnerships |
182 |
176 |
180 |
179 |
148 |
141 |
150 |
152 |
153 |
0 |
0 |
|
Reading First and Early Reading First |
560 |
129 |
0 |
0 |
0 |
0 |
0 |
0 |
0 |
0 |
0 |
|
College Access Challenge Grants |
0 |
0 |
145 |
150 |
128 |
0 |
0 |
0 |
0 |
0 |
0 |
|
Academic Competitiveness and Smart Grant Program |
297 |
690 |
918 |
350 |
0 |
0 |
0 |
0 |
0 |
0 |
0 |
|
Education for Homeless Children and Youth |
0 |
135 |
0 |
0 |
0 |
0 |
0 |
0 |
0 |
0 |
0 |
|
Total Education |
41,915 |
58,246 |
58,645 |
66,501 |
58,576 |
55,059 |
53,691 |
52,172 |
53,737 |
53,532 |
52,225 |
|
Social Services |
|||||||||||
|
Head Start |
6,877 |
9,077 |
8,757 |
7,559 |
7,968 |
7,573 |
8,105 |
8,717 |
9,119 |
9,554 |
9,556 |
|
Temporary Assistance for Needy Families (TANF) |
9,411 |
10,594 |
9,837 |
8,828 |
8,913 |
9,491 |
9,295 |
8,742 |
8,939 |
8,641 |
8,896 |
|
Child Care and Development Fund |
4,979 |
7,034 |
5,083 |
5,152 |
5,218 |
5,140 |
5,288 |
5,379 |
5,712 |
5,798 |
8,178 |
|
Foster Care |
4,525 |
4,705 |
4,603 |
4,456 |
4,180 |
4,133 |
4,746 |
4,669 |
4,815 |
5,363 |
5,054 |
|
Child Support Enforcement |
4,585 |
4,719 |
5,044 |
4,671 |
4,179 |
4,278 |
4,324 |
4,347 |
4,379 |
4,454 |
4,429 |
|
Adoption Assistance |
2,038 |
2,324 |
2,438 |
2,362 |
2,296 |
2,278 |
2,450 |
2,473 |
2,587 |
2,706 |
2,785 |
|
Social Services Block Grant |
1,700 |
2,300 |
1,700 |
1,700 |
1,700 |
1,613 |
1,577 |
1,576 |
1,584 |
1,583 |
1,588 |
|
Community Services Block Grant |
654 |
1,692 |
708 |
678 |
677 |
635 |
667 |
674 |
715 |
707 |
715 |
|
Legal Services Corporation |
351 |
392 |
422 |
406 |
351 |
343 |
368 |
378 |
387 |
387 |
427 |
|
Maternal, Infant, and Early Childhood Home Visiting Program |
0 |
0 |
100 |
250 |
344 |
378 |
394 |
430 |
391 |
408 |
411 |
|
Older Americans Act Grants for Supportive Services and Senior Centers |
351 |
361 |
368 |
369 |
367 |
348 |
348 |
348 |
348 |
349 |
384 |
|
Older Americans Act National Family Caregiver Support Program |
153 |
154 |
154 |
154 |
154 |
146 |
145 |
146 |
151 |
150 |
180 |
|
Guardianship |
0 |
0 |
0 |
0 |
0 |
0 |
0 |
101 |
120 |
145 |
155 |
|
Indian Human Services |
118 |
115 |
118 |
115 |
110 |
100 |
135 |
150 |
145 |
147 |
150 |
|
Chafee Foster Care Independence Program |
140 |
140 |
140 |
140 |
140 |
140 |
140 |
140 |
140 |
140 |
140 |
|
Emergency Food and Shelter Programb |
153 |
300 |
200 |
120 |
120 |
114 |
120 |
120 |
120 |
120 |
120 |
|
Total Social Services |
36,035 |
43,907 |
39,672 |
36,961 |
36,717 |
36,710 |
38,102 |
38,390 |
39,652 |
40,652 |
43,168 |
|
Employment and Training |
|||||||||||
|
Temporary Assistance for Needy Families (TANF) |
1,694 |
1,826 |
2,682 |
1,845 |
1,683 |
1,579 |
1,696 |
2,255 |
2,510 |
2,914 |
2,976 |
|
Job Corps |
1,558 |
1,804 |
1,713 |
1,777 |
1,735 |
1,718 |
1,984 |
1,751 |
1,552 |
1,773 |
1,492 |
|
Workforce Investment Act (WIA) Youth Activities |
984 |
2,218 |
994 |
946 |
902 |
856 |
898 |
906 |
875 |
1,033 |
946 |
|
Workforce Investment Act (WIA) Adult Activities |
827 |
1,357 |
862 |
766 |
773 |
731 |
766 |
775 |
813 |
813 |
843 |
|
Supplemental Nutrition Assistance Program (SNAP) |
351 |
367 |
344 |
354 |
334 |
368 |
400 |
630 |
427 |
437 |
441 |
|
Community Service Employment for Older Americans |
504 |
708 |
820 |
454 |
448 |
429 |
440 |
384 |
321 |
570 |
404 |
|
Social Services and Targeted Assistance for Refugeesc |
203 |
203 |
203 |
202 |
152 |
198 |
198 |
198 |
223 |
203 |
202 |
|
Foster Grandparents |
109 |
109 |
111 |
111 |
111 |
105 |
108 |
108 |
108 |
108 |
108 |
|
Total Employment and Training |
6,230 |
8,592 |
7,729 |
6,455 |
6,138 |
5,984 |
6,490 |
7,007 |
6,829 |
7,851 |
7,412 |
|
Energy Assistance |
|||||||||||
|
Low-Income Home Energy Assistance Program (LIHEAP) |
2,590 |
5,100 |
5,100 |
4,701 |
3,472 |
3,255 |
3,401 |
3,395 |
3,372 |
3,394 |
3,641 |
|
Weatherization Assistance Program |
291 |
5,240 |
517 |
234 |
126 |
182 |
234 |
255 |
270 |
287 |
301 |
|
Total Energy Assistance |
2,881 |
10,340 |
5,617 |
4,935 |
3,598 |
3,437 |
3,635 |
3,650 |
3,642 |
3,681 |
3,942 |
|
Totals |
561,209 |
707,162 |
749,725 |
763,686 |
724,327 |
744,082 |
793,606 |
847,801 |
877,259 |
897,677 |
917,779 |
Source: Prepared by the Congressional Research Service (CRS) from information contained in federal budget documents for President's budget submissions, FY2010 through FY2020. Totals may not sum due to rounding.
Note: Sources and methods used for numbers in this report are consistent with past reports in this series, with limited exceptions noted below. Recall that this report displays obligations that were less than $100 million in a given fiscal year as $0, and does not include obligations from those years in aggregate spending totals.
a. Between FY2008 and FY2016, the budget figures for the Medical Care for Veterans without Service-Connected Disability program were from expenditure data provided by the Department of Veterans Affairs to CRS. For FY2017 and FY2018, the budget figures are obligations listed in publically available agency budget documents.
b. Previous reports in this series used obligations data for the Emergency Food and Shelter budgetary figures. Because obligations for the program were not available in source documents for FY2017 or FY2018, this report now uses budget authority for the FY2008-FY2018 figures.
c. Prior to FY2018, the figure for Social Services and Targeted Assistance for Refugees was a combination of Refugee Social Services and Refugee Targeted Assistance Grants. However, in FY2018 the enacted appropriation combined these activities with the Preventative Health program into a single budget line. Thus, the FY2018 figure includes this additional activity.
Author Contact Information
Acknowledgments
Karen Spar, former CRS Specialist in Domestic Social Policy and Division Research Coordinator, produced earlier reports in this series and was instrumental in developing the methods underlying the current report. Amber Wilhelm, CRS Visual Information Specialist, produced the graphics in this report.
Footnotes
| 1. |
Recent reports in the series include CRS Report R43863, Federal Benefits and Services for People with Low Income: Programs and Spending, FY2008-FY2013; and CRS Report R44574, Federal Benefits and Services for People with Low Income: Overview of Spending Trends, FY2008-FY2015. |
| 2. |
The rate of inflation used here is the Gross Domestic Product (GDP) price index. The rate of economic growth is the growth in the GDP in nominal terms, because the spending increase was not adjusted for price inflation. Both of these figures are drawn from the January 2020 Historical Data and Economic Projections published by the Congressional Budget Office, and reflect changes over the period of a federal fiscal year rather than a calendar year. |
| 3. |
See CRS In Focus IF10399, Overview of the ACA Medicaid Expansion. |
| 4. |
The major factors other than the Patient Protection and Affordable Care Act's (ACA, P.L. 111-148 as amended) Medicaid expansion affecting health expenditures and Medicaid spending are population growth, changes in the use of health care services, and changes in the prices of health care services. See Office of the Actuary, Centers for Medicare and Medicaid Services, United States Department of Health and Human Services, 2017 Actuarial Report on the Financial Outlook for Medicaid, 2017, pp. 9-10. |
| 5. |
Totals may not sum due to rounding. Due to data limitations, CRS cannot separate obligations for these programs into mandatory and discretionary components. |