Social Security: Demographic Trends and the Funding Shortfall
The Social Security program pays monthly benefits to retired or disabled workers and their families and to the family members of deceased workers. Social Security, or Old-Age, Survivors, and Disability Insurance (OASDI), is intended to operate primarily as a pay-as-you-go system, where program revenues cover program costs. The OASDI program’s revenues and costs are largely determined by economic and demographic factors. The Social Security program is experiencing rising costs and relatively stable income, a trend that is projected to continue for several decades. Although economic and program-specific factors affect the balance between program revenues and costs, research has shown demographic factors to be one of the leading contributors to the increasing imbalance between costs and revenues.
The U.S. population has been experiencing a shift in age structure toward older ages and an increase in the median age, termed demographic aging. Two demographic effects have contributed to this aging over time: decreasing fertility and increasing longevity. While aging reflects a society’s shared advances in medical, social, and economic matters, it strains the very social insurance systems that provide social support to the aging population. The post-World War II baby boom generation’s effect on OASDI highlights this point. Baby boomers, the relatively large cohort resulting from higher fertility rates from 1946 through 1964, have started to exit the paid labor force and collect Social Security benefits. They are being replaced in the workforce by relatively smaller cohorts resulting from lower fertility rates in subsequent generations. Program costs are also rising as an increasing number of retirees collects benefits for longer time periods. According to the Board of Trustees of the OASDI Trust Funds, costs are expected to rise throughout the 75-year projection period, 2019-2093.
The Social Security population’s changing age distribution is creating a situation in which fewer workers in covered employment are supporting a growing number of people collecting benefits. This relationship is temporarily sustainable, as the OASDI program can draw upon the $2.89 trillion in asset reserves held in the trust funds to augment annual program revenues and fulfill all scheduled benefit payments. However, the OASDI program’s ability to pay 100% of scheduled benefits becomes unsustainable when these asset reserves are depleted.
The Board of Trustees, which oversees the OASDI Trust Funds, projects the funds’ assets to be depleted in 2035 due in part to the cumulative strain placed upon the system by an older age distribution. After this, the OASDI program would operate as a strict pay-as-you-go system that can only pay out in benefits what it receives in revenue. Under current laws and projections, the trustees estimate sufficient revenues to be able to pay about 80% of scheduled benefits after asset reserves are depleted. The Social Security program’s ability to cover 100% of scheduled benefits depends upon a combination of increased revenues and decreased benefits.
One set of policy options to address the funding shortfall includes increasing the full retirement age (the age at which a beneficiary is entitled to full benefits) or the earliest eligibility age (the age at which a beneficiary is first entitled to benefits). This set of policy options uses a demographic solution for a largely demographic issue: the projected imbalance between program costs and income.
Measures that include increasing the retirement ages are estimated to improve the program’s long-range financial status but not to prevent trust funds depletion by themselves. Although these adjustments help to reduce rising costs, those costs would still be projected to exceed revenues. This suggests that efforts to avoid depleting the OASDI Trust Funds throughout the trustees’ projection period would also be improved by including a revenue-increasing mechanism. In addition, increases in life expectancy are not shared equally within the population; disparities exist when life expectancies are analyzed by sex, race, and income levels. A policy measure that increases Social Security eligibility ages may disproportionally help some beneficiaries and disadvantage others.
Social Security: Demographic Trends and the Funding Shortfall
Jump to Main Text of Report
Contents
- Introduction
- The Social Security Population Is Growing Older
- Dependency Ratios
- Youth Dependency
- Aged Dependency
- Total Dependency
- Decreasing Fertility Rates
- Causes for the Decrease in Fertility Rates
- Decreasing Mortality and Longer Life Expectancy
- Causes of Death
- Decreasing Mortality
- Longer Life Expectancy at Retirement
- Rising Costs and Program Financial Shortfalls
- An Increasing Number of Beneficiaries per Covered Worker
- Rising Costs and the Program's Funding Challenge
- Demographically Driven Policy Options to Address the Financial Shortfall
- Extend Social Security Benefits for Childcare
- Incorporate Childcare in the Social Security Benefit Formula
- Increase the Full Retirement Age
- Encourage Delayed Claiming
- Conclusion
Figures
- Figure 1. Historical and Projected OASDI Annual Income and Cost as Percentage of Taxable Payroll, 1970-2095
- Figure 2. Social Security Population Dependency Ratios, 1945-2095
- Figure 3. Historical and Projected Fertility Rates, 1910-2095
- Figure 4. Historical and Projected Mortality Rates, 1910-2095
- Figure 5. Historical and Projected Period Life Expectancy at 65 Years of Age, 1945-2095
- Figure 6. Historical and Projected OASDI Beneficiaries per 100 Covered Workers, 1970-2095
- Figure 7. Comparison of OASDI Cost and Beneficiaries per 100 Covered Workers, 1970-2095
- Figure A-1. Social Security Age Distribution, 1945-2095
- Figure B-1. Birth Rates, by Age Group, 1940-2015
- Figure B-2. Female Labor Force Participation Rate, by Age, 1948-2018
- Figure C-1. Major Causes of Death in the United States, 1900-2017
Tables
Summary
The Social Security program pays monthly benefits to retired or disabled workers and their families and to the family members of deceased workers. Social Security, or Old-Age, Survivors, and Disability Insurance (OASDI), is intended to operate primarily as a pay-as-you-go system, where program revenues cover program costs. The OASDI program's revenues and costs are largely determined by economic and demographic factors. The Social Security program is experiencing rising costs and relatively stable income, a trend that is projected to continue for several decades. Although economic and program-specific factors affect the balance between program revenues and costs, research has shown demographic factors to be one of the leading contributors to the increasing imbalance between costs and revenues.
The U.S. population has been experiencing a shift in age structure toward older ages and an increase in the median age, termed demographic aging. Two demographic effects have contributed to this aging over time: decreasing fertility and increasing longevity. While aging reflects a society's shared advances in medical, social, and economic matters, it strains the very social insurance systems that provide social support to the aging population. The post-World War II baby boom generation's effect on OASDI highlights this point. Baby boomers, the relatively large cohort resulting from higher fertility rates from 1946 through 1964, have started to exit the paid labor force and collect Social Security benefits. They are being replaced in the workforce by relatively smaller cohorts resulting from lower fertility rates in subsequent generations. Program costs are also rising as an increasing number of retirees collects benefits for longer time periods. According to the Board of Trustees of the OASDI Trust Funds, costs are expected to rise throughout the 75-year projection period, 2019-2093.
The Social Security population's changing age distribution is creating a situation in which fewer workers in covered employment are supporting a growing number of people collecting benefits. This relationship is temporarily sustainable, as the OASDI program can draw upon the $2.89 trillion in asset reserves held in the trust funds to augment annual program revenues and fulfill all scheduled benefit payments. However, the OASDI program's ability to pay 100% of scheduled benefits becomes unsustainable when these asset reserves are depleted.
The Board of Trustees, which oversees the OASDI Trust Funds, projects the funds' assets to be depleted in 2035 due in part to the cumulative strain placed upon the system by an older age distribution. After this, the OASDI program would operate as a strict pay-as-you-go system that can only pay out in benefits what it receives in revenue. Under current laws and projections, the trustees estimate sufficient revenues to be able to pay about 80% of scheduled benefits after asset reserves are depleted. The Social Security program's ability to cover 100% of scheduled benefits depends upon a combination of increased revenues and decreased benefits.
One set of policy options to address the funding shortfall includes increasing the full retirement age (the age at which a beneficiary is entitled to full benefits) or the earliest eligibility age (the age at which a beneficiary is first entitled to benefits). This set of policy options uses a demographic solution for a largely demographic issue: the projected imbalance between program costs and income.
Measures that include increasing the retirement ages are estimated to improve the program's long-range financial status but not to prevent trust funds depletion by themselves. Although these adjustments help to reduce rising costs, those costs would still be projected to exceed revenues. This suggests that efforts to avoid depleting the OASDI Trust Funds throughout the trustees' projection period would also be improved by including a revenue-increasing mechanism. In addition, increases in life expectancy are not shared equally within the population; disparities exist when life expectancies are analyzed by sex, race, and income levels. A policy measure that increases Social Security eligibility ages may disproportionally help some beneficiaries and disadvantage others.
Introduction
The Social Security program, or Old-Age, Survivors, and Disability Insurance (OASDI), pays monthly benefits to retired or disabled workers and their families and to the family members of deceased workers. The OASDI program's ability to meet scheduled benefit payments rests upon sufficient revenues from payroll taxes, taxation on Social Security benefits, and interest earned on trust funds assets. The year 2020 marks the first since 1982 in which the OASDI program's total cost is projected to be greater than its total income. Because of annual cash surpluses amassed in the Old-Age and Survivors Insurance Trust Fund and the Disability Insurance Trust Fund in the period spanning 1983 through 2019, the OASDI program is able to meet its benefit obligations by drawing on these assets to supplement annual revenues.1 The Board of Trustees of the Federal Old-Age and Survivors Insurance and Federal Disability Insurance Trust Funds estimates that drawing down the trust funds can augment OASDI program revenues and allow it to pay full benefits until 2035.2 Should the trust funds be depleted in 2035, as the trustees project, the OASDI program would have tax revenues sufficient to pay about 80% of scheduled benefits.3
The OASDI program, and its financing, are affected by economic, program-specific, and demographic factors. Economic factors include issues such as productivity, price inflation, unemployment, and gross domestic product; program-specific factors include issues such as covered and taxable earnings, revenues from taxation of benefits, and average benefits indexed to growth in average national wages. Demographic factors include fertility, mortality, and immigration. This report focuses on two demographic factors—specifically fertility and mortality—and how they interact to affect the program's ability to pay full scheduled benefits. The trustees' 2019 Annual Report states the following:
Projected OASDI cost increases more rapidly than projected non-interest income through 2040 primarily because the retirement of the baby-boom generation will increase the number of beneficiaries much faster than the number of covered workers increases, as subsequent lower-birth-rate generations replace the baby-boom generation at working ages. From 2040 to 2051, the cost rate (the ratio of program cost to taxable payroll) generally declines because the aging baby-boom generation is gradually replaced at retirement ages by subsequent lower-birth-rate generations. Thereafter, increases in life expectancy cause OASDI cost to increase generally relative to non-interest income, but more slowly than between 2010 and 2040.4
A remaining demographic factor—immigration—is not examined in this report because the Board of Trustees analysis shows that combined changes in fertility and mortality are the leading causes of financial pressure on the OASDI program.5
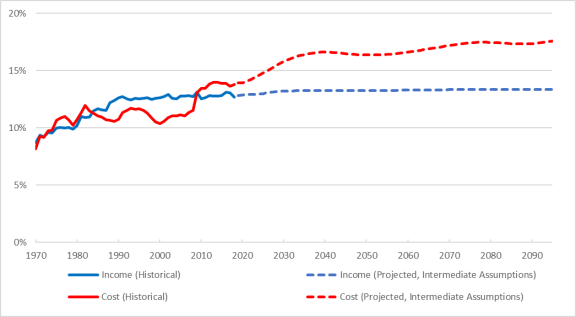
The Social Security population, both covered workers paying into the system and those collecting benefits, is experiencing shifts in age distribution.6 Decreased fertility rates for generations after the baby boomers (those born between 1946 and 1964) are contributing to an overall older population.7 In addition, increases in average life expectancy are also contributing to the aging of the U.S. population. The combination of decreasing fertility and longer life expectancies results in higher costs, as presented in Figure 1, which shows OASDI costs increasing as a percentage of taxable payroll.8 As costs remain above income, the trust funds' assets are used to fulfill scheduled monthly benefit payments. The Board of Trustees projects this process will continue into 2034, after which the trust funds' assets are exhausted and reserves no longer exist.
The OASDI program can pay scheduled benefits while operating with a cash flow deficit (i.e., costs exceed revenues) during periods of positive trust funds balances because assets held in the trust funds can be redeemed to augment continuing income. However, this process cannot last indefinitely. As shown in Figure 1, a cash flow deficit is projected to persist throughout the 75-year projection period (2019-2093). This report presents data showing that the projected deficits are the result of rising costs associated with demographic changes, outlines how these demographic changes will impact the OASDI program's ability to fulfill benefit payments, and discusses some options policymakers have to address the program's financial shortfall.
|
Figure 1. Historical and Projected OASDI Annual Income and Cost as Percentage of Taxable Payroll, 1970-2095 |
 |
|
Source: Prepared by the Congressional Research Service (CRS) from 2019 Annual Report data, Table VI.G2, pp. 206-207, intermediate projections, and the Supplemental Single-Year tables, at https://www.ssa.gov/oact/TR/2019/lr6g2.html. Notes: Income for each year is the sum of tax revenues from the payroll tax and the taxation of benefits. The cost for each year is the sum of benefits scheduled and administrative expenses. The income excludes interest income. Taxable payroll is the sum of all taxable wages and taxable self-employment income. |
The Social Security Population Is Growing Older
Driven by reduced fertility rates and increasing longevity, the Social Security population is aging. In other words, the percentage of the Social Security population at the older end of the age distribution is increasing. This point is underscored by considering three broad age subgroups: (1) those aged 65 and older; (2) those aged 20 through 64; and (3) those under age 20. Analyzing the population using these broad age groups highlights the concentration of those likely to be retired or close to retirement (i.e., aged 65 and older), those in ages commonly seen as prime working years (i.e., aged 20 through 64), and those generally considered not yet in the paid workforce (i.e., under age 20).
Table 1 shows population growth rates for the 70-year period from 1945 to 2015, the first and the most recent years, respectively, for which the trustees publish historical data. It also shows the trustees' projections for growth in the population, and its subgroups, for the ensuing 70-year period of 2015 through 2085. From 1945 through 2015, the Social Security population more than doubled.
Table 1 shows that, although the population grew by 120% over this period, growth in major age groups varied. On a percentage-change basis, the largest growth was observed in the 65 and over age group. From 1945 through 2015, this age group grew by 338%, indicating that the number of people in the United States aged 65 and older more than tripled. This demographic trend underscores the degree to which the United States is growing older; in 1945, those 65 and older accounted for 7% of the total population, whereas in 2015, those 65 and older accounted for about 15% of the total population.
This trend has implications for the Social Security program's ability to meet all of its projected scheduled benefits as the younger and slower-growing age groups of working age (i.e., those aged 20 to 64) are paying into the system while the older and faster-growing age groups (i.e., those aged 65 and older) are likely to be collecting benefits. The right-hand column in Table 1 shows that the trustees projected future years will continue to see growth in the 65 and older age group outpace that of the overall population. By 2085, the 65 and older age group is projected to make up about 22% of the total population. As this trend persists, which it is projected to do under the trustees' intermediate assumptions, it will cause OASDI program costs to rise more rapidly than revenues, thereby degrading the program's ability to pay full scheduled benefits.
|
Population in thousands (Percentage of Total Population) |
Percentage Change in Population |
||||
|
1945 |
2015 |
2085a |
1945-2015 |
2015-2085a |
|
|
Total Population |
148,130 |
325,993 |
474,688 |
120% |
46% |
|
Under 20 |
49,121 (33%) |
84,688 (26%) |
113,842 (24%) |
72% |
34% |
|
20-64 |
88,109 (59%) |
193,518 (59%) |
254,297 (54%) |
120% |
31% |
|
65 and Older |
10,900 (7%) |
47,786 (15%) |
106,550 (22%) |
338% |
123% |
Source: Table prepared by CRS from data provided in the 2019 Annual Report, Table V.A3, pp. 92-93, at https://www.ssa.gov/oact/TR/2019/tr2019.pdf.
Notes: Figures for the "Percentage of Total Population" may not sum to 100 due to rounding. The age of 65 is commonly associated with retirement. The full retirement age—the age a covered worker is entitled to full benefits without a reduction for claiming age—depends on year of birth. See Table 2.
a. Figures for 2085 are projected under the intermediate assumptions in the 2019 Annual Report of the Board of Trustees.
Table 1 also shows how the working-age population is projected to be a smaller percentage of the overall population. This is an essential consequence of an aging population. That is, as the percentage of those aged 65 and older is increasing, the percentages in the other age group (i.e., working ages between 20 and 64) are decreasing. This point is reinforced by examining dependency ratios.
Dependency Ratios
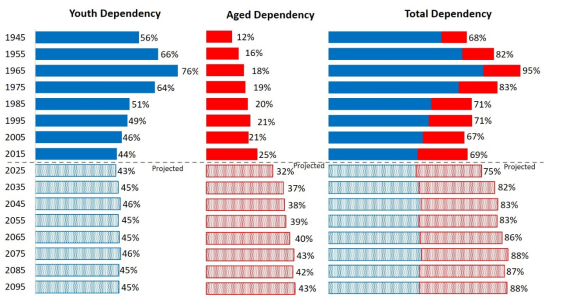
The changes in the Social Security population's composition can also be expressed as dependency ratios. Dependency ratios indicate a dependent population's burden on the working-age population.9 Table 1 shows that in 1945, about 59% of the total population was working age, between the ages of 20 and 64. The next-largest age group was the under 20 age group, which accounted for about 33% of the population. In 1945, the United States could be described as youth dependent because the working-age population was supporting the next-larger, under 20 population. The same could be said for the United States in 2015, when the 20 to 64 age group was about 59% of the total population and those in the under 20 age group accounted for 26% of the total population (Table 1). That is, from 1945 to 2015, the United States became less youth dependent. Over this time period, the percentage of the total population aged 65 and older increased from 7% to 15%, indicating that the United States was becoming more aged dependent. The United States is projected to age from a youth-dependent population to an aged-dependent population, where the working-age population will be supporting the next-larger, 65 and older population.10 The transition to a more aged-dependent population is important for Social Security purposes because the program's ability to continue to pay beneficiaries relies on taxes paid by current workers. As discussed, the dependency ratios have changed over time and are projected to continue to change.11 Figure 2 presents a more detailed look at the dependency ratios and shows how they have changed in a historical context and how they are projected to change throughout the trustees' 75-year projection period.
Youth Dependency
Figure 2 shows the youth dependency ratio, which is the ratio of the population under 20 to the population aged 20-64. It is an approximate measure of how many young persons are supported by those in working ages. For instance, in 1945 the youth dependency ratio was 56%, suggesting that every 100 people in working ages were supporting 56 youths. From 1945 to 1965, the youth population increased relative to the working-age population, resulting in an increasing youth dependency ratio. As the baby boom generation attained working ages (the oldest of the baby boom generation turned 20 in 1966), the working-age population increased relative to the youth population and this ratio began to decrease. By 1985, when all of the baby boom generation had reached working age (the youngest of the baby boom generation turned 20 in 1984), this ratio had decreased to 51%, a level comparable to that observed prior to the baby boomers (i.e., in 1945 the youth dependency ratio was 56%).12
Aged Dependency
Figure 2 also shows the aged dependency ratio. The aged dependency ratio is the ratio of the population aged 65 and older to the population aged 20-64. Although the age at which a beneficiary can collect Social Security benefits varies by birth year, this ratio is an approximate indicator of the number of people likely to be collecting benefits relative to those still working. For instance, in 1945 the aged dependency ratio was 12%, suggesting that for every 100 working-age people there were 12 people collecting benefits. The increase in this ratio highlights the aging of the population. As shown, this ratio increased from 12% in 1945 to 25% in 2015. That is, the number of people collecting benefits versus the number of people still working doubled over this period. Throughout the trustees' 75-year projection period, this ratio will continue to increase under the intermediate projections, due in large part to the baby boomers' continued retirement from the work force, relative to the numbers in the working-age population. The trustees project the aged dependency ratio to exceed 35% by 2025 and 40% by 2065. This projected tripling of the aged dependency ratio reflects the aged population's faster growth compared with that of the working-age population.
Total Dependency
The total dependency ratio is the ratio of those aged 65 and above and those aged under 20 to those aged 20-64. Thus, the ratio is an approximate measure of the number of people not of working age to the number of working-age people. The beginning of the baby boom generation is indicated by the rising total dependency ratio as shown in Figure 2. The total dependency ratio remained relatively stable from the mid-1980s to the early 2010s as the baby boomers remained in working ages. The oldest baby boomers reached full retirement age in 2012, making it the first year that a baby boomer could retire with full benefits.13 Thus, as the baby boom generation began to exit the paid labor force in the 2010s, the ratio can be seen to rise slightly. The ratio is projected to increase as more of that generation enters retirement age.
|
Figure 2. Social Security Population Dependency Ratios, 1945-2095 |
 |
|
Source: Figure prepared by CRS from data provided in the 2019 Annual Report, Table V.A3, pp. 92-93, at https://www.ssa.gov/oact/TR/2019/tr2019.pdf. Notes: The youth dependency ratio is the number of population under 20 for every 100 persons aged 20 to 64. The aged dependency ratio is the ratio of population 65 and older for every 100 persons aged 20 to 64. The total dependency ratio is the sum of those under 20 and those 65 and older for every 100 persons aged 20 to 64. Projections for future years use the trustees' intermediate assumptions in the 2019 Annual Report. Figures for the total dependency ratio may not equal the sum of the youth dependency ratio and the aged dependency ratio due to rounding. |
Owing to the sustained decrease in total fertility rates since the 1970s, the aged dependency and total dependency ratios are projected to increase even after the last baby boomers have reached full retirement age in 2031. The demographic trends that created the baby boomers led to an imbalance between the number of people who have or will retire (i.e., present and potential beneficiaries) and the number of people in working ages (i.e., present and potential covered workers).14 Specifically, as the baby boom generation ages, those aged 65 and older will make up a larger portion of the total population. The transition from a youth-dependent population to an aged-dependent population means the number of beneficiaries will increase faster than the number of covered workers. As a result, the trustees project that OASDI costs will rise relative to revenues.
Decreasing Fertility Rates
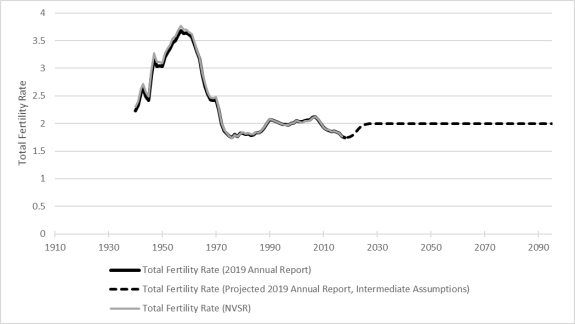
The aging of the Social Security population is partially driven by a decline in the total fertility rate after 1965. The total fertility rate (TFR) is the average number of children that would be born to a woman throughout her lifetime if she were to experience, at each age of her life, the birth rate observed in that year.15 In 1920, the TFR was 3.26 children per woman. By 1940, the TFR was comparatively lower, at a rate of 2.23 children per woman; this was the lowest TFR that had been observed to date. This decrease was reversed within the decade when a period of high fertility created the baby boom generation, those born between 1946 and 1964 (Appendix A). This period of high fertility is shown in Figure 3 and is marked on either side by periods of low fertility. In fact, fertility rates after 1964 (i.e., immediately following the baby boomers) decreased to the lowest levels recorded in the United States. Much of what makes the baby boom generation so impactful is that the cohort was both preceded and followed by low fertility rates. Figure 3 shows the historical fertility rates as measured by the National Center for Health Statistics (Centers for Disease Control and Prevention) and the trustees, as well as the trustees' projected fertility rates under their intermediate assumptions.
|
Figure 3. Historical and Projected Fertility Rates, 1910-2095 Average Children per Woman |
 |
|
Source: Table prepared by CRS from 2019 Annual Report data, Table V.A1, pp. 84-85, at https://www.ssa.gov/oact/TR/2019/lr_5a1.html, Vital Statistics of the United States, Table 1.7 (https://www.cdc.gov/nchs/products/vsus/vsus_1980_2003.htm), and National Vital Statistics Report (NVSR), Births Final Data 2004-2017 (https://www.cdc.gov/nchs/products/nvsr.htm). Notes: The total fertility rate for a year is defined as the average number of children that would be born to a woman in her lifetime, at each age of her life, if she were to experience the birth rate observed for a specified year (the 2019 Annual Report). |
The U.S. TFR reached a minimum of 1.77 children per woman in 1975. The TFR has remained at relatively low levels in the years that followed, a trend that is projected to continue. The Board of Trustees projects that the TFR will remain close to 2.0 children per woman throughout the 75-year projection period.16
Causes for the Decrease in Fertility Rates
Research suggests that there are many contributing factors for the decline in fertility rates.17 For instance, changes in fertility rates have been closely linked to changes in personal income and changes in the employment rate.18 This perhaps explains why a decrease in fertility coincided with the 2008-2009 financial crisis, before which the fertility rate was increasing. Additional research reinforces economic and financial uncertainty's effect on fertility and birth rates. Studies have shown that those who worried more frequently about future job prospects were more likely to have doubts about having children and expected to have them later in life.19 Research has also suggested that a mother's postponement of childbearing increases her children's socioeconomic opportunities.20
Costs associated with raising children may have effects as well. From 1960 to 2015, the average cost of raising a single child from birth to age 17 for a middle-income, married couple increased 16% in real terms.21 Over this period, the portions of costs attributable to housing, food, transportation, and clothing have decreased. However, costs associated with healthcare doubled as a percentage of total cost and costs associated with child care and education increased from 2% of total costs to 16%.22 To the degree parents contribute to the costs of higher education, the increasing trend in child care costs may be understated.23
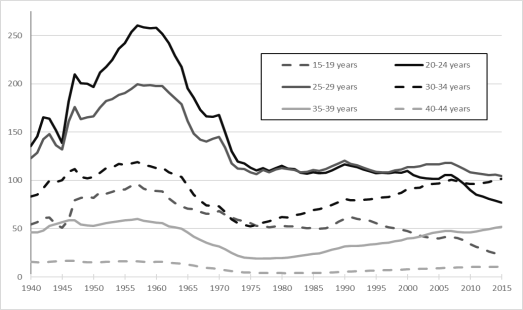
The decision to have children later in life is reflected in historical data. Specifically, the decline in fertility among women has not been shared uniformly across age groups. In fact, since the mid-1970s fertility among women aged 30-34 and 34-39 has been increasing (Figure B-1). These data suggest that although the desire to have children remains, the age at which it is done has increased. This postponement of childbearing results in a lower overall fertility rate.
Decreasing Mortality and Longer Life Expectancy
On average, the Social Security population is living longer.24 This demographic trend is observed in two complementary measures: a decreasing mortality rate and increasing life expectancy. More individuals within the Social Security population are surviving to retirement age, and once in retirement they are collecting benefits for a greater number of years than previous generations of beneficiaries. For instance, in 1945, one year before the baby boom began, a male at birth could expect to live on average for 62.9 years. In 1965, one year after the baby boom ended, a male at birth could expect to live 66.8 years on average, an increase of almost 4 years. During that same period, the average life expectancy for a female at birth increased by 5.4 years.
Causes of Death
The trustees cite several developments over the past century that contributed to the lower mortality rates, including
- access to primary medical care for the general population,
- discovery and general availability of antibiotics and immunizations,
- clean water supply and waste removal, and
- the rapid rate of growth in the general standard of living.25
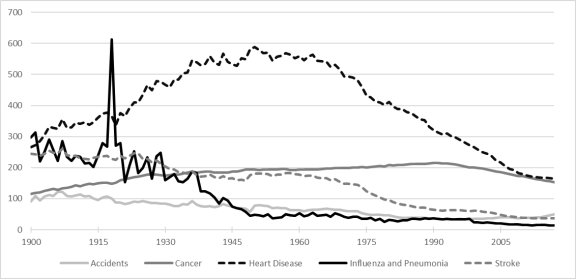
Changes in the leading causes of death support the effectiveness of the developments cited by the trustees. In 1900, the leading cause of death in the United States was infectious diseases, such as influenza or tuberculosis (see Appendix C). From 1900 to 1940, the decline in infectious disease as a major cause of death was largely attributed to nutritional improvements and public health measures; the subsequent development of medical treatments further reduced infectious disease as a leading cause of death.26 As deaths due to infectious diseases declined, deaths due to diseases of old age increased. From 1900 to 1940, diseases associated with old age—cardiovascular disease and cancer—became the two leading causes of death.27 By 1950, cardiovascular disease alone led to more deaths than the next four leading causes.28 However, owing to improvements in medical treatments and access to those treatments, the age-adjusted death rate for cardiovascular disease decreased by more than 70% by 2015.29 In addition, this time period overlaps with the 1965 creation of Medicare, which has provided older Americans with better access to health care.
Decreasing Mortality
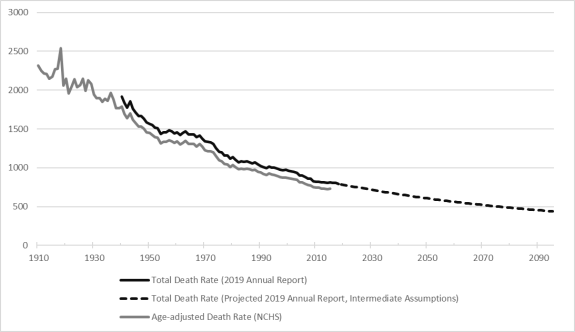
Figure 4 shows how the developments cited by the trustees combined to decrease mortality rates in the Social Security population. From 1945 to 2015, the death rate declined from 1,716.6 persons per 100,000 to 815.8 persons per 100,000, an approximate decline of 52%.30 This trend underscores the aging of the Social Security population, that is, more and more people covered by Social Security are surviving to retirement age. The trustees project this trend of decreasing mortality rates will continue throughout the projection period.31 Figure 4 shows historical death rates as measured by the National Center for Health Statistics (Centers for Disease Control and Prevention) and the trustees, and the trustees' projected death rates under their intermediate assumptions.
|
Figure 4. Historical and Projected Mortality Rates, 1910-2095 Deaths per 100,000 Persons |
 |
|
Source: Figure prepared by CRS from the 2019 Annual Report data, Table V.A1, pp. 84-85, at https://www.ssa.gov/oact/TR/2019/lr_5a1.html and Vera Tejada et al., Mortality Trends in the United States, National Center for Health Statistics, 1900-2015, 2017. Notes: The total death rate is the age-sex adjusted death rates based on the enumerated total population (those persons having a Social Security number) as of April 1, 2010, if that population were to experience the death rate by age and sex observed in, or assumed for, the selected year. The total death rate is adjusted for age and sex to show the effects of changes in death rates unobscured by changing age-sex distributions (the 2019 Annual Report). The age-adjusted death rate is only adjusted for age (National Center for Health Statistics). |
Longer Life Expectancy at Retirement
The decrease in mortality rates from 1945 to 2015 translated into higher average life expectancies for Social Security-covered individuals, both those currently working and those collecting benefits. A main measure of life expectancy is period life expectancy: an individual's expected average remaining life at a selected age, assuming no future changes in death rates.32
In 1945, the period life expectancy at birth was 62.9 years for a male and 68.4 years for a female. This indicates that in 1945, shortly after Social Security began regular monthly payments, the average newborn male was not expected to reach full retirement age and the average female was not expected to live more than a few years beyond full retirement age (in 1945 the full retirement age was 65, see Table 2). 33 In 2015, the period life expectancy at birth was 76.2 years for a male and 81.0 years for a female.34 Thus, males and females born in 2015 can expect at birth to live approximately 13 years longer than those born in 1945.
Decreasing age-specific mortality rates at the older ages also translate into longer period life expectancy at age 65, an age commonly associated with retirement. In 1945, shortly after Social Security began regular monthly payments, a 65-year-old female could expect to live another 14.4 years on average and a 65-year-old male could expect to live another 12.6 years. In 2015, those life expectancies were 20.4 years and 17.8 years, respectively.35 In 2015, more of the population survived to the age at which they were eligible for Social Security benefits than in 1945. In addition, individuals reaching eligibility age in 2015 exhibited longer period life expectancies than in 1945. As shown in Figure 5, the trustees project this trend to continue throughout the projection period, thereby contributing to the OASDI program's rising costs.
|
Figure 5. Historical and Projected Period Life Expectancy at 65 Years of Age, In Years |
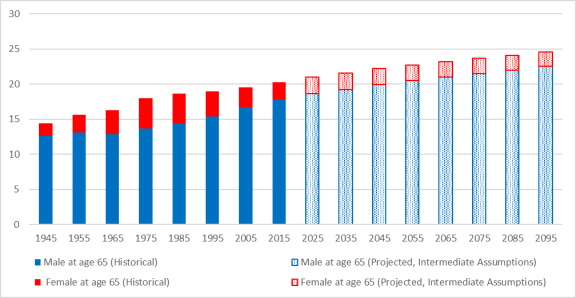 |
|
Source: Figure prepared by CRS from 2019 Annual Report data, Table V.A4, p. 95, at https://www.ssa.gov/oact/TR/2019/tr2019.pdf. Notes: The period life expectancy at a given age for a given year is the average remaining number of years expected prior to death for a person at that exact age, born on January 1, using the mortality rates for that year over the course of his or her remaining life. |
Rising Costs and Program Financial Shortfalls
Population aging has consequences for the Social Security system's financial sustainability. As a result of lower fertility rates and increased life expectancy, in 2035 the Social Security system is projected to experience aged dependency ratios (Figure 2) not observed during the program's history. The aged dependency ratios are projected to trend higher as the baby boom generation retires. In 2018, approximately 10,200 baby boomers per day attained age 65; this figure is expected to reach 11,000 per day by 2029.36 This demographic trend suggests that the ratio of persons collecting benefits—or soon to be—to those paying into Social Security will increase. The more this ratio increases, the more strain is placed on the OASDI program's financial position.
An Increasing Number of Beneficiaries per Covered Worker
An alternative measure of OASDI program sustainability is the ratio of beneficiaries per 100 covered workers. For example, a ratio of 30 indicates that for every 30 beneficiaries (i.e., individuals collecting benefits) there are 100 workers in covered employment (i.e., individuals subject to the payroll tax). Increases in this ratio suggest that those in covered employment are supporting an increasing number of people collecting benefits. Figure 6 displays ratios of historical and projected beneficiaries per 100 covered workers.
|
Figure 6. Historical and Projected OASDI Beneficiaries per 100 Covered Workers, 1970-2095 |
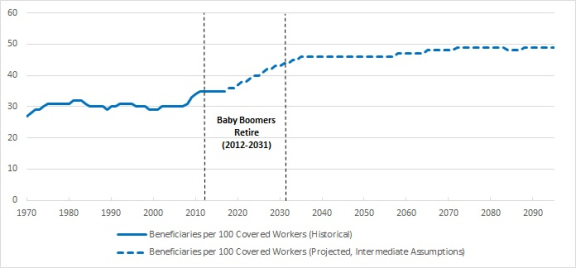 |
|
Source: Figure prepared by CRS 2019 Annual Report data, Table IV.B3, pp. 60-61, at https://www.ssa.gov/oact/TR/2019/tr2019.pdf. Data are consistent with the Supplemental Single Year tables at https://www.ssa.gov/oact/TR/2019/lr4b3.html. Notes: A beneficiary is any person who is collecting benefits. A covered worker is any person who has earnings from covered employment or covered self-employment that are creditable for Social Security. The youngest baby boomers reached full retirement age in 2012; the oldest baby boomers will reach full retirement age in 2031. |
The ratio of beneficiaries per 100 covered workers through year 2031 will be largely influenced by the baby boom generation. The oldest of the baby boomers turned 20 in 1966 and started to enter the paid labor force, becoming covered employees. From 1970 to 2008, a period in which most baby boomers were working age, the ratio of beneficiaries per 100 covered workers remained around 30. In this period, the ratio never fell below 27 or rose above 31.
From 2009 to 2017, the period in which the oldest of the baby boomers reached full retirement age, the number of beneficiaries per 100 covered workers increased from 31 to 35. The trustees project this ratio to rise steadily, reaching 44 in 2031, the year in which the youngest baby boomers will reach full retirement age. When the youngest baby boomers, those born in 1964, reach 70 years of age in 2035, the ratio of beneficiaries per 100 covered workers is projected to be 46. Previous research suggested that under the current tax rates and benefit schedule, the OASDI program requires a ratio of 35 beneficiaries to 100 covered workers to maintain itself as a pay-as-you-go program.37
Rising Costs and the Program's Funding Challenge
The line representing the ratio of beneficiaries per 100 covered workers in Figure 6 corresponds to the OASDI cost as a percentage of taxable payroll line shown in Figure 1. The trustees state the following:
This similarity emphasizes the extent to which the cost rate [annual cost as a percentage of taxable payroll] is determined by the age distribution of the population. The cost rate is essentially the product of the number of beneficiaries and their average benefit, divided by the product of the number of covered workers and their average taxable earnings.38
When these lines are graphed together, this relationship becomes more evident. Figure 7 highlights how the rise in the number of beneficiaries per 100 covered workers closely mirrors that of OASDI annual costs. Both measures remained relatively stable from the 1970s through the 2000s, a period in which a majority of the baby boomers were considered to be of prime working ages. Both measures have increased in the 2010s, and they are projected to continue to do so as the baby boomers transition from prime working ages into retirement.
|
Figure 7. Comparison of OASDI Cost and Beneficiaries per 100 Covered Workers, 1970-2095 |
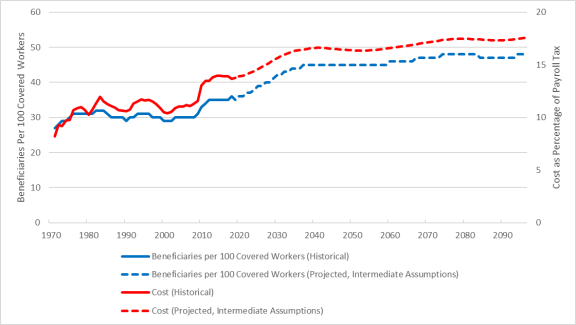 |
|
Source: Figure prepared by CRS. Cost data provided in the 2019 Annual Report, Table VI.G2, pp. 206-207, intermediate projections, and the Supplemental Single-Year tables, at https://www.ssa.gov/oact/TR/2019/lr6g4.html. Beneficiary data provided in the 2019 Annual Report, Table IV.B3, pp. 60-61, at https://www.ssa.gov/oact/TR/2019/tr2019.pdf. Data are consistent with the Supplemental Single Year tables at https://www.ssa.gov/oact/TR/2019/lr4b3.html. Notes: The cost for each year is the sum of benefits scheduled and administrative expenses. Taxable payroll is the sum of all taxable wages and taxable self-employment income. A beneficiary is any person who is collecting benefits. A covered worker is any person who has earnings from covered employment or covered self-employment that are creditable for Social Security. |
The effects of aging on the Social Security program are already evident when considering only the Disability Insurance (DI) program. In a 2014 testimony before Congress, the Chief Actuary stated that the effects of aging had already contributed to rising costs in the DI program. As they entered young adulthood, more baby boomers entered the workforce than received disability benefits. This trend reversed as the baby boomers entered the disability-prone ages of 45 to 64. 39 The trend is projected to continue as baby boomers approach retirement. As explained by the Board of Trustees,
From 2019 to 2038, the OASI cost rate [annual cost as a percentage of taxable payroll] rises rapidly because the retirement of the baby-boom generation will continue to increase the number of beneficiaries much faster than the number of workers increases, as subsequent lower-birth-rate generations replace the baby-boom generation at working ages.40
Figure 1 graphs OASDI annual costs along with annual income, expressed as a percentage of taxable payroll. Figure 1 shows that costs are rising while incomes are relatively stable and that costs are projected to exceed income for the duration of the projection period.41 The persistence of this imbalance will strain the OASDI program's long-range financial position.
As a primarily pay-as-you-go program, the OASDI is self-financing. It is funded primarily through a payroll tax on covered earnings up to an annual limit and by federal income taxes paid by some beneficiaries on a portion of their OASDI benefits. In addition, from 1984 through 2009, annual income from tax revenues exceeded annual costs. This resulted in annual cash surpluses that were invested in federal government securities held in the OASDI Trust Funds, where they earned interest, thus providing the system a third income source.42
A program with contingency reserves may experience periods of cash deficits, in which annual costs are greater than annual income. With sufficient reserves, such a program need not operate as a strict pay-as-you-go program. However, a pay-as-you-go program cannot operate with indefinite annual cash deficits. As shown in Figure 1, annual costs are projected to exceed annual income throughout the 75-year projection period. Although the OASDI program can draw upon assets in the trust funds to fulfill scheduled payments temporarily, the program cannot do so indefinitely. The trustees project there to be sufficient trust funds reserves to augment tax revenues and pay all scheduled benefits through 2034. The trustees estimate that trust funds reserves will be exhausted sometime in 2035. Once the trust funds are exhausted, the program must operate as a strict pay-as-you-go system, meaning it will only be able to pay out in benefits what it receives in revenues. At the point of OASDI Trust Funds depletion, program revenues will provide the OASDI program funding to pay only 80% of scheduled benefits.43
Demographically Driven Policy Options to Address the Financial Shortfall
Policy measures seeking to improve trust funds solvency can generally be categorized as reducing benefits or increasing revenues. For illustrative purposes, the trustees estimate changes to the current payroll tax rates and benefit schedule that would maintain trust funds solvency throughout the 75-year projection period. To give a sense of the funding shortfall's magnitude, if measures to maintain trust funds solvency were enacted in 2019, they would require a permanent increase in the payroll tax from its current rate of 12.40% to 15.10%, or a reduction in scheduled benefits of 17% for all current and future beneficiaries, or a combination of both.44 The increasing costs associated with the OASDI program indicate that more substantial measures are necessary as time elapses. If similar policies were enacted in 2035, the projected year of trust funds depletion, the permanent payroll tax rate needed to restore solvency would increase to 16.05%. Similarly, the necessary permanent reduction of scheduled benefits would increase to 23%. Lawmakers have a wide range of policy options at their disposal to address the projected funding shortfall. This section highlights several policy options that address the funding shortfall's demographic drivers.
Extend Social Security Benefits for Childcare
As discussed, research suggests that economic and financial uncertainty may be a large driver behind many people's decision to postpone childbearing, thus reducing fertility. Social Security is designed as a social insurance program that protects workers and their families against a loss in earnings due to old age, disability, and death. Understanding the large financial burden that childbearing requires, some proposals argue for Social Security benefits to be extended to cover childcare in times of birth or adoption.45 While not specifically intended to increase fertility, these proposals recognize the hardships that accompany childbearing and aim to reduce financial pressures around that decision. By seeking to reduce one of the larger impediments to fertility—financial stress—such proposals could result in increased fertility.
Incorporate Childcare in the Social Security Benefit Formula
The Social Security benefit formula is used to compute a worker's Primary Insurance Amount (PIA), which is the worker's basic monthly benefit amount payable at the full retirement age.46 To compute the PIA, the formula first indexes a worker's lifetime covered earnings to reflect changes in national wage levels, as measured by the Social Security Administration's average wage index (AWI).47 The indexing process ensures a worker's or family member's benefit will reflect increases in average wage growth observed over the worker's earning history.48 After indexing, the highest 35 years of earnings are summed, and the total is divided by 420 (the number of months in 35 years) to determine a worker's average indexed monthly earnings (AIME). Brackets of a worker's AIME are replaced at different rates, the sum of which is the PIA.49
Exiting the paid workforce to have children can impact a worker's future Social Security benefit. For instance, if a worker has fewer than 35 years of covered earnings, years of zero earnings are entered in the calculation. That is, if a worker forgoes covered earnings to have children, the worker's earnings record will reflect no income for that time. Recognizing the benefit formula's adverse effect for years of no earnings due to childcare, some proposals would reduce the number of computation years used in the benefit formula.50 Such a proposal would allow one parent per household to claim dropout years for years in which that parent had no earnings and provided care for a child under 6 years of age. For example, the benefit formula for a parent with no earnings for two years due to childcare would use the highest 33 years of earnings in the calculation.
Childcare credits are another option that would incorporate childcare into the Social Security benefit formula. Proponents of this method argue that childcare is essentially unpaid work and seek to ensure parents with young children are credited for their caregiving.51 Under such a proposal, wage credits would be set at one-half the average wage index for that year (e.g., one-half of the AWI for 2018 is $25,947). Parents earning less than the childcare credit level would have their earnings records increased to that level. Parents earning more than the childcare credit level would not receive any credit.
The effects of policy changes that may result in increased fertility are uncertain. As shown in Figure 3, the projected fertility rate is expected to be stable around 2 children per woman. Under current law and the trustees' intermediate assumptions, each increase of 0.1 in the fertility rate decreases the projected funding shortfall by about 7.6%.52 This suggests a 65% increase in childbearing (i.e., to approximately 3.3 children per woman) would be needed, absent other changes, to avoid trust fund depletion.
Increase the Full Retirement Age
Some policymakers have proposed increasing the eligibility ages to address changing demographics and their effects on the OASDI program's solvency. For instance, a policy measure that increases the full retirement age (FRA) would be categorized as a provision that reduces benefits, as beneficiaries would then collect benefits for a shorter duration of time or accept a higher actuarial reduction in their monthly benefits by claiming at the age they originally intended.53
Previous Congresses have addressed increasing the FRA.54 Facing a funding shortfall, Congress gradually raised the FRA, from age 65 to age 67, as part of the Social Security Amendments of 1983 (P.L. 98-21).55 Increasing the earliest eligibility age (EEA), a benefit-reducing mechanism, was one of many measures included in this legislation that sought to address previous solvency issues. The Social Security Amendments of 1983 also enacted measures that increased revenues, including provisions that increased the payroll tax and made a portion of Social Security benefits themselves subject to taxation.56
Table 2 shows the gradual increase in the FRA depending on year of birth.
|
Year of Birth |
Full Retirement Age |
Year of Birth |
Full Retirement Age |
|
1937 or earlier |
65 |
1955 |
66 and 2 months |
|
1938 |
65 and 2 months |
1956 |
66 and 4 months |
|
1939 |
65 and 4 months |
1957 |
66 and 6 months |
|
1940 |
65 and 6 months |
1958 |
66 and 8 months |
|
1941 |
65 and 8 months |
1959 |
66 and 10 months |
|
1943 |
65 and 10 months |
1960 or later |
67 |
|
1943-1954 |
66 |
Source: Social Security Administration, at https://www.ssa.gov/planners/retire/retirechart.html.
Note: Persons born on January 1 of any year should refer to the previous year of birth.
The Social Security program is once again facing projected long-range funding shortfalls. Similar to 1983, a common proposal is to increase the EEA or to further increase the FRA. On one hand, some argue that the average increases in life expectancies indicate that people work until older ages, and thus collect benefits at an older age. On the other hand, those opposed to raising the FRA argue that increases in average life expectancies are not shared equally among covered workers.
The SSA's Office of the Chief Actuary (OCACT) publishes estimates for policy provisions that affect claiming ages and are routinely included in legislative proposals.57 These policy options include provisions that would affect the FRA and provisions that would affect both the FRA and the EEA.58 Each provision's efficacy can be assessed by its effect on the projected solvency date and its reduction in the long-range actuarial balance, shown for each option in its respective table.59 For illustrative purposes, a provision that would gradually increase the full retirement age to 68 is estimated to improve the long-range actuarial balance by 16% (compared to current law) and extend solvency to 2035, one year later than under current law.
OCACT projects none of the numerous policy provisions raising eligibility ages to result in trust funds solvency throughout the projection period or to completely eliminate the long-range funding shortfall. A 2015 CBO report found similar results in its analysis of four policy measures: (1) an increase in the FRA of one year; (2) an increase in the FRA of three years; (3) an increase in the FRA by one month per birth year; and (4) an increase in the FRA and EEA by one month per birth year. CBO's findings largely mirror OCACT's in showing that an increase in either one or both of the FRA and EEA reduces Social Security program costs.60 However, a policy measure adjusting only the age at which benefits could be claimed would not be sufficient to offset the funding shortfall.61 This outcome suggests that policy measures only addressing demographic changes via eligibility ages are limited in their ability to resolve the effects of rising OASDI program costs.
Research suggests that raising the FRA or EEA would negatively affect certain segments of the population. Although average life expectancy in the United States is increasing, the increases are not equally shared among the population. For instance, women have a longer life expectancy than men and whites have a longer life expectancy than blacks. Life expectancy is also stratified by income level. Numerous studies show that life expectancy is positively related to income and that the gap itself—the difference in life expectancies between high earners and low earners—is also increasing.62 Social Security benefits are based on the overall population's average life expectancies, suggesting that groups with longer average life expectancies (e.g., higher-income individuals) will collect more lifetime benefits than groups with shorter average life expectancies (e.g., lower-income individuals). Any provision to increase claiming ages may very well exacerbate this difference in lifetime benefits.
A method of increasing the FRA could be to index the FRA for changes in life expectancies. One possible approach would be to index the FRA to maintain a constant ratio of expected retirement years (i.e., life expectancy at FRA) to potential work years (i.e., FRA less 20 years). Another policy option would be to simply adjust the FRA so as to hold the number of expected retirement years constant based on projected life expectancies. As discussed above, life expectancies across different segments of the population can differ by factors such as gender, race, and income. In pursuing options involving indexing the FRA, policymakers would need to address differences in projected life expectancies.
Policy options that would index the FRA can be categorized as cost-reduction measures, because they would decrease total benefits as a means to account for longer life expectancies. Although both options discussed above would reduce the projected funding shortfall, neither would eliminate it completely.63 Similar to options that may address fertility or a straightforward increase in the FRA, the projected effects of indexing the FRA for changes in life expectancies alone would not eliminate the projected funding shortfall.
Encourage Delayed Claiming
A range of policy options exists that would address the increases in longevity by encouraging delayed claiming. One such option would be to increase the number of years used in the benefit formula. For instance, under current law, the benefit formula uses a worker's highest 35 years of earnings to compute the primary insurance amount (PIA). Including more years of earnings in the benefit formula (e.g., 40 years) would likely include years of low earnings from the start of a worker's earning history or years of no earnings.64 Under such a policy, a worker could choose to work for more years (i.e., to replace years of low earnings with years of high earnings) or take advantage of delayed retirement credits to attain a PIA that would have been earned had the benefit formula not changed. That is, to maintain the benefit scheduled under current law a person would need to work longer, delay claiming, or a combination of both.
Under current law, workers can receive their full PIA once they reach FRA. However, a worker can elect to delay payment of benefits and, in doing so, collect delayed retirement credits. For those born in 1960 and later, a credit is worth 8% of a worker's PIA for each year of delayed claiming. For instance, a worker born in 1960 who reaches FRA at 67 is entitled to 100% of his or her PIA. That same worker could collect 124% of his or her PIA if claiming is delayed three years (at age 70).65 Any reduction in the benefit formula that would result in a decrease of benefits would then require some use of delayed claiming so as to collect the same PIA as under current law.
A provision that would incentivize workers to delay claiming, perhaps through an increase in the number of computation years, could have a negative earnings impact on some workers. For instance, such a provision would favor those earning at high levels later in their careers (so as to replace years of low earnings with years of higher earnings). In addition to possibly favoring higher earners, such a provision could adversely affect certain types of labor. That is, such a policy proposal would essentially favor those who could still work. Workers with careers in more arduous work who were unable to continue working beyond the current FRA would receive a lower PIA under such a proposal.
Conclusion
On average, increases in life expectancy have allowed current Social Security beneficiaries to collect benefits for a longer period of time. However, the increase in life expectancies, when paired with low fertility rates, will negatively impact the program's long-range financial position and weaken its ability to pay all scheduled benefits as projected under current law. These demographic trends—increasing life expectancy and decreasing fertility—have resulted in an aging Social Security population. As the baby boom generation retires, the ratio of beneficiaries relative to people in covered employment will grow. As this ratio rises, Social Security costs rise as well. The rising ratio of beneficiaries to covered workers can exist so long as trust funds assets remain to supplement the program's annual tax revenues. Rising costs are projected to deplete trust funds reserves in 2035. After such time, Social Security program revenues will no longer be sufficient to pay full benefits. Under current law, the Social Security program's sustainability, and its ability to pay full benefits, is largely a demographic issue. Policy measures aimed at addressing the changing demographics, specifically those increasing retirement ages to reflect increasing life expectancy, improve the program's solvency and long-range financial status. Such policy measures are estimated to reduce program costs. However, the reduction in benefits implied by such measures would not be evenly distributed across all segments of the population. In addition, increasing eligibility ages (i.e., reducing costs) alone is not projected to restore solvency throughout the projection period. Given the magnitude of the OASDI program's projected long-range funding shortfall, policy measures that include both a revenue-increasing and a benefit-reducing mechanism to restore solvency increase the likelihood that full benefits will be maintained.
Appendix A. The Baby Boomers in the United States
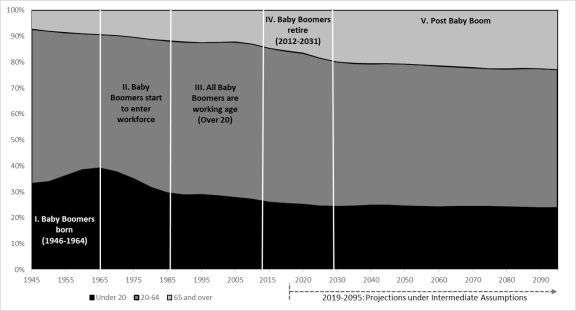
The first baby boomers were born in 1946; the last baby boomers were born in 1964.66 The period of 1946-1964 is marked on either side by low birth rates. As a result of the low fertility rates that followed the baby boomers, they are being replaced in the workforce by cohorts resulting from lower fertility rates.
The baby boom's births spanned nearly two decades, denoted with I in Figure A-1. The older baby boomers started to enter the workforce as the youngest were just being born (II in the figure below). Time period III denotes the stage at which all baby boomers are at least 20 years of age, an age commonly associated with working age. In period IV, baby boomers are attaining full retirement age and beginning to exit the workforce. In period V, all baby boomers are eligible for retirement with full benefits.
In 1945, a year before the first baby boomer was born, 7.3% of the Social Security population was aged 65 or older. In 2035, after all baby boomers are eligible for Social Security, 20.5% of the population will be aged 65 or older.
 |
|
Source: Figure prepared by CRS from 2019 Annual Report data, Table V.A3, pp. 92-93, at https://www.ssa.gov/oact/TR/2019/tr2019.pdf. |
The demographic forces that created an aging population evolved over decades. This is important to policymakers because demographic trends in the Social Security population are contributing to rising costs. These demographic trends result in an imbalance between costs and revenues and are projected to continue beyond the baby-boom generation. This imbalance can also be thought of as a persistent imbalance between those in covered employment and those collecting benefits.
Appendix B. Birth Rates, by Age Group
 |
|
Source: Brady Hamilton, et al., Natality Trends in the United States, 1909-2015, National Center for Health Statistics, 2017. Note: Birth rate is defined as the number of births per 1,000 females in the specified age group. |
|
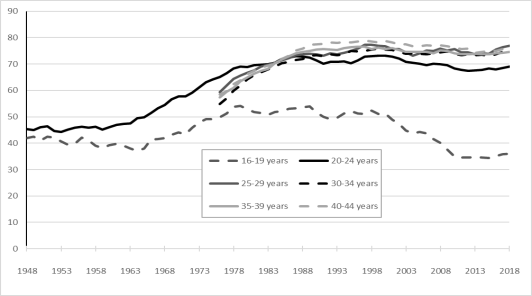
Figure B-2. Female Labor Force Participation Rate, by Age, 1948-2018 |
 |
|
Source: Prepared by CRS. Data available from the Bureau of Labor Statistics, at https://www.bls.gov/cps/lfcharacteristics.htm. Note: The labor force participation rate is the labor force (employed and unemployed) as a percentage of the civilian noninstitutional population (i.e., excludes active duty military and persons confined in correctional institutions and care facilities). Data collection for several subgroups did not begin until 1976. |
|
Cause |
1900 |
1950 |
2000 |
2017 |
|
Top Five |
||||
|
Heart Disease |
27,427 (5) |
535,705 (1) |
710,760 (1) |
647,457 (1) |
|
Cancer |
- |
210,733 (2) |
553,091 (2) |
599,108 (2) |
|
Accidents |
- |
91,249 (4) |
97,900 (5) |
169,936 (3) |
|
Chronic Respiratory Diseases |
- |
- |
122,009 (4) |
160,201 (4) |
|
Stroke |
21,353 (4) |
- |
167,661 (3) |
146,383 (5) |
|
Other |
||||
|
Certain Diseases of Infancy |
- |
60,989 (5) |
- |
|
|
Influenza/Pneumonia |
40,362 (1) |
- |
- |
|
|
Tuberculosis |
38,820 (2) |
- |
- |
|
|
Diarrhea/Enteritis/Ulcerative Colitis |
28,491 (3) |
- |
- |
|
|
Vascular Lesions |
- |
156,751 (3) |
- |
Source: Vera Tejada et al., Mortality Trends in the United States, National Center for Health Statistics, 1900-2015, 2017, and National Vital Statistics Report (Deaths: Final Data for 2017, Table B), National Center for Health Statistics.
Notes: Data are shown only if the cause was among the top five causes of death for that year. The data show causes such as influenza or tuberculosis being leading causes of death in 1900 but not among the top five causes by 1950. Heart disease, a disease associated with old age, is shown to increase from 1900 to 2000.
Author Contact Information
Footnotes
| 1. |
The Board of Trustees, Federal Old-Age and Survivors Insurance and Federal Disability Insurance Trust Funds, or the trustees, manages the Federal Old-Age and Survivors Insurance (OASI) Trust Fund and the Federal Disability Insurance (DI) Trust Fund, or the Trust Funds. Although the OASI Trust Fund and DI Trust Fund operate separately, for the purposes of this report they are discussed as the combined OASDI Trust Funds. |
| 2. |
The OASDI Trust Funds exhaustion date of 2035 represents the trustees' intermediate projections. In the 2019 Annual Report, the trustees present three alternative (intermediate, low-cost, and high-cost) sets of assumptions for demographic, economic, and program-specific factors. The intermediate set of assumptions represents the trustees' best estimate of likely future conditions. The Board Of Trustees, Federal Old-Age And Survivors Insurance And Federal Disability Insurance Trust Funds, The 2019 Annual Report Of The Board Of Trustees Of The Federal Old-Age And Survivors Insurance and Federal Disability Insurance Trust Funds, April 25, 2019, p. 5, at https://www.ssa.gov/oact/TR/2019/tr2019.pdf. (Hereinafter The Board of Trustees, 2019 Annual Report.) |
| 3. |
For more information on possible scenarios of trust fund depletion, see CRS Report RL33514, Social Security: What Would Happen If the Trust Funds Ran Out? |
| 4. |
The Board of Trustees, 2019 Annual Report, pp. 3-4. |
| 5. |
As presented in Table VI.D3 of the 2019 Annual Report, scenarios of high, medium, and low immigration demonstrate a relatively small change in OASDI income, costs, and the projected years of the trust funds' solvency. (The Board of Trustees, 2019 Annual Report, p. 180.) |
| 6. |
The Social Security population is composed of the 50 states and the District of Columbia; civilian residents of Puerto Rico, the Virgin Islands, Guam, American Samoa, and the Northern Mariana Islands; federal civilian employees and U.S. Armed Forces and their dependents abroad; noncitizens living abroad who are insured for Social Security benefits; and U.S. citizens abroad (The Board of Trustees, 2019 Annual Report, p. 242). In contrast, the Census Bureau's estimates for the U.S. resident population exclude people whose residence is outside the United States, as well as residents of Puerto Rico, the Virgin Islands, Guam, American Samoa, and the Northern Mariana Islands (see https://www.census.gov/glossary/#term_Residentpopulation). As such, the Social Security population is larger than the resident population. |
| 7. |
Baby boomers refers to those of the baby boom generation, a cohort of individuals born from 1946 through 1964. Sandra L. Colby and Jennifer M. Ortman, The Baby Boom Cohort in the United States: 2012 to 2060, United States Census Bureau, P25-1141, May 2014, p. 2, at https://www.census.gov/prod/2014pubs/p25-1141.pdf. |
| 8. |
Taxable payroll is the sum of all Social Security taxable wages and taxable self-employment income. When Social Security taxable payroll is multiplied by the Social Security payroll tax rate, the result is the total amount of Social Security payroll taxes (The Board of Trustees, 2019 Annual Report, p. 244). Payroll taxes are the largest source of income for the OASDI program; in 2018, payroll taxes accounted for 88.2% of program revenues (The Board of Trustees, 2019 Annual Report, p. 6). As measured by the taxable ratio, the growth of taxable payroll itself is decreasing. The taxable ratio, measuring the relationship of taxable payroll to covered earnings, has decreased from 88.7% in 1984 to 83.2% in 2017 (The Board of Trustees, 2019 Annual Report, p. 143). |
| 9. |
Jonathan Vespa, David M. Armstrong, and Lauren Medina, Demographic Turning Points for the United States: Population Projections for 2020 to 2060, U.S. Census Bureau, P25-1144, March 1, 2018, pp. 5-6, at https://www.census.gov/content/dam/Census/library/publications/2018/demo/P25_1144.pdf. (Hereinafter Vespa et al., Demographic Turning Points.) |
| 10. |
Vespa et al., Demographic Turning Points, pp. 6-7. |
| 11. |
Policy considerations for youth-dependent populations necessarily differ from that of aged-dependent populations. Generally speaking policies addressing youth-dependent populations are conducted on the state and local level, such as education. Conversely, policies addressing aged-dependent populations are managed on the federal level, such as through Social Security. Policy consideration are discussed in a later section: "Demographically Driven Policy Options to Address the Financial Shortfall." |
| 12. |
In the early 1980s, with the majority of the baby boom generation in the workforce, the program faced a funding crisis. As discussed later in the report, the Social Security Amendments of 1983 enacted several measures to improve the program's financial position. For the program to pay full scheduled benefits, the amendments used revenue-increasing measures and benefit-reduction measures to improve the program's financial position. That is, under the income and cost structure at that time, a large workforce alone was not enough to ensure full scheduled payments could be made. |
| 13. |
The full retirement age (FRA) is the age at which a person who has qualified for benefits is entitled to receive those benefits without any reduction based on age. This is commonly referred to as the normal retirement age, or NRA. For those born in 1960 and later, the full retirement age is 67. |
| 14. |
This trend is further exacerbated by decreasing mortality rates (see "Decreasing Mortality"). Declining mortality rates mean the larger number of people surviving to retirement are also expected to live longer. |
| 15. |
Samuel H. Preston, Patrick Heuveline, and Michel Guillot, Demography: Measuring and Modeling Population Processes (Malden, MA: Blackwell Publishers, 2001), p. 95. |
| 16. |
A total fertility rate of 2.1 is commonly referenced as replacement-level fertility. This is the TFR necessary for a country with low mortality and negligible immigration to maintain constant population. Samuel H. Preston, Patrick Heuveline, and Michel Guillot, Demography: Measuring and Modeling Population Processes (Malden, MA: Blackwell Publishers, 2001), p. 115. |
| 17. |
The United States is not alone in experiencing a decline in fertility rates. World Bank data show that a majority of countries experienced a decline in fertility rates from 1960 to 2015 (see https://data.worldbank.org/indicator/sp.dyn.tfrt.in). |
| 18. |
Paul Taylor, Gretchen Livingston, and Seth Motel, In a Down Economy, Fewer Births, Pew Research Center: Social & Demographic Trends, October 12, 2011, p. 4, at https://www.pewresearch.org/wp-content/uploads/sites/3/2011/10/REVISITING-FERTILITY-AND-THE-RECESSION-FINAL.pdf. |
| 19. |
Sarah R. Brauner-Otto and Claudia Geist, "Uncertainty, Doubts, and Delays: Economic Circumstances and Childbearing Expectations Among Emerging Adults," Journal of Family and Economic Issues, vol. 39, no. 1 (March 2018), p. 100. |
| 20. |
M. Myrskyla, K. Barclay, and A. Goisis, Advantages of Later Motherhood, Max Planck Institute for Demographic Research, August 29, 2017, p. 769, at https://link.springer.com/content/pdf/10.1007%2Fs00129-017-4124-1.pdf. |
| 21. |
Mark Lino, Kevin Kuczynski, and Nestor Rodriguez, et al., Expenditures on Children by Families, United States Department of Agriculture (USDA), Miscellaneous Report No. 1528-2015, January 2017, p. 21, https://fns-prod.azureedge.net/sites/default/files/crc2015_March2017_0.pdf. (Hereinafter USDA, Expenditures on Children by Families.) |
| 22. |
USDA, Expenditures on Children by Families, p. 21. |
| 23. |
For example, the College Board found that in-state tuition at public four-year institutions increased at an average of 3.1% beyond inflation from 2008 to 2018. College Board, Trends in College Pricing 2018, 2018, p. 3, https://trends.collegeboard.org/sites/default/files/2018-trends-in-college-pricing.pdf. |
| 24. |
The U.S. population has generally exhibited year-over-year increases in life expectancy, on average. However, in 2017, the National Center for Health Statistics published a data brief acknowledging a decrease in life expectancy at birth from 2016 to 2017. The same data brief did show an increase in the average life expectancy at age 65. Sherry L. Murphy et al., Mortality in the United States, National Center for Health Statistics, No. 328, November 2018, at https://www.cdc.gov/nchs/data/databriefs/db328-h.pdf. |
| 25. |
Social Security Administration (SSA), Office of the Chief Actuary (OCACT), The Long-Range Demographic Assumptions For The 2019 Trustees Report, April 22, 2019, p. 5, at https://www.ssa.gov/oact/TR/2019/2019_Long-Range_Demographic_Assumptions.pdf. (Hereinafter The Board of Trustees, The 2019 Long-Range Demographic Assumptions.) |
| 26. |
David M. Cutler and Ellen Meara, Changes in the Age Distribution of Mortality Over the 20th Century, National Bureau of Economic Research (NBER), Working Paper no. 8556, October 1, 2001, p. 12. |
| 27. |
Centers for Disease Control and Prevention (CDC), National Center for Health Statistics (NCHS), National Vital Statistics System (NVSS), Historical Data, 1900-1998, at https://www.cdc.gov/nchs/nvss/mortality_historical_data.htm; CDC, NCHS, NVSS, , Mortality Data at http://www.cdc.gov/nchs/deaths.htm. |
| 28. |
CDC, NCHS, NVSS, Historical Data, 1900-1998, at https://www.cdc.gov/nchs/nvss/mortality_historical_data.htm; CDC, NCHS, NVSS, Mortality Data, at http://www.cdc.gov/nchs/deaths.htm. |
| 29. |
CDC, NCHS, NVSS, Historical Data, 1900-1998, at https://www.cdc.gov/nchs/nvss/mortality_historical_data.htm; CDC/NCHS/NVSS, Mortality Data at http://www.cdc.gov/nchs/deaths.htm. |
| 30. |
The Board of Trustees, 2019 Annual Report, pp. 84-85. |
| 31. |
While the trustees project decreasing mortality rates, the rate at which the trustees project mortality to decline has decreased (see Human Longevity and Implications for Social Security Actuarial Status at https://www.ssa.gov/OACT/NOTES/pdf_notes/note158.pdf). Death rates from major causes of death such as heart disease, stroke, and cancer have levelled off (see Figure C-1) while death rates from "deaths of despair" have increased (see Joint Economic Committee's Long-Term Trends in Deaths of Despair at https://www.jec.senate.gov/public/index.cfm/republicans/2019/9/long-term-trends-in-deaths-of-despair). This combination resulted in a decrease in life expectancy at birth from 2016 to 2017 (see Mortality in the United States, 2017 at https://www.cdc.gov/nchs/data/databriefs/db328-h.pdf). |
| 32. |
Samuel H. Preston, Patrick Heuveline, and Michel Guillot, Demography: Measuring and Modeling Population Processes (Malden, MA: Blackwell Publishers, 2001), p. 42. |
| 33. |
The first recurring monthly Social Security payments began in 1940. SSA, "Frequently Asked Questions," at https://www.ssa.gov/history/hfaq.html. |
| 34. |
The Board of Trustees, 2019 Annual Report, p. 95. |
| 35. |
The Board of Trustees, 2019 Annual Report, p. 95. |
| 36. |
U.S. Government Accountability Office, The Nation's Retirement System: A Comprehensive Re-Evaluation Needed to Better Promote Future Retirement Security, GAO-19-342T, 2019, p. 6, at https://www.gao.gov/assets/700/696766.pdf. The age of 65 is commonly associated with retirement. As discussed later in this report, the full retirement age varies by year of birth. Thus, age 65 can be a useful indicator for those eligible to collect Social Security benefits. |
| 37. |
Gayle L. Reznik, Dave Shoffner, and David A. Weaver, "Coping with the Demographic Challenge: Fewer Children and Living Longer," Social Security Bulletin, vol. 66, no. 4 (2005), p. 40. This research presented the statistic as 2.8, representing the worker-to-beneficiary ratio. This is approximately equivalent to 35 beneficiaries per 100 covered workers. |
| 38. |
The Board of Trustees, 2019 Annual Report, p. 62. |
| 39. |
Stephen C. Goss, Testimony Before the Subcommittee on Social Security, Pensions, and Family Policy of the Senate Committee on Finance, Social Security Administration, May 21, 2014, at https://www.ssa.gov/legislation/testimony_052114.html. |
| 40. |
The Board of Trustees, 2019 Annual Report, p. 51. This quote specifically mentions OASI costs, not the combined OASDI costs. However, the OASI costs are the predominant costs of the combined OASDI program. In 2018, OASI expenditures account for approximately 85% of overall OASDI expenditures (The Board of Trustees, 2019 Annual Report, p. 6). |
| 41. |
OASDI income presented as a percentage of taxable payroll will always remain close to 12.4%. The main income source for the OASDI program is the 12.4% payroll tax, providing 88.2% of program revenues in 2018. Interest income from the OASDI Trust Funds is projected to steadily decrease from 8.3% of revenues in 2018 to 0.0% in 2035, the trust funds depletion date projected under the trustees' intermediate projections. In 2018, taxation of benefits accounted for 3.5% of revenues. The Board of Trustees, 2019 Annual Report, p. 6. |
| 42. |
For more background on the trust funds' sources of financing, see CRS Report RL33028, Social Security: The Trust Funds. |
| 43. |
The Board of Trustees, 2019 Annual Report, p. 4. |
| 44. |
The increase in payroll tax from 12.40% to 15.10% is an increase of 2.70 percentage points; this differs from the actuarial balance of 2.78%. The actuarial balance presumes a trust funds balance at the end of the projection period equal to one year's cost. The 2.78 percentage point increase also includes behavioral responses to tax rate changes (The Board of Trustees, 2019 Annual Report, p. 4). |
| 45. | |
| 46. |
42 U.S.C. §415(a). |
| 47. |
SSA, OCACT, "National Average Wage Index," at https://www.ssa.gov/oact/cola/AWI.html. |
| 48. |
Earnings through the age of 60 are indexed to average wage growth. Earnings from the age of 61 and later are counted at nominal value. |
| 49. |
For additional information on computing a worker's PIA, see CRS Report R43542, How Social Security Benefits Are Computed: In Brief. |
| 50. |
H.R. 4529, 114th Congress. For an actuarial estimate on the project long-range financial effects of such a proposal see https://www.ssa.gov/OACT/solvency/provisions/charts/chart_run200.html. |
| 51. |
Childcare credits can take many forms. For an example discussed in this report, see Virginia P. Reno and Joni Lavery, Fixing Social Security: Adequate Benefits, Adequate Financing, National Academy of Social Insurance, October 2009, https://www.nasi.org/research/2009/fixing-social-security. For an actuarial estimate on the project long-range financial effects of such a proposal, see https://www.ssa.gov/OACT/solvency/provisions/charts/chart_run225.html. |
| 52. |
The Board of Trustees, 2019 Annual Report, p. 178. An increase of 0.1 in the fertility rate would increase the long-range actuarial balance by 0.21% of taxable payroll. Under the 2019 Annual Report's intermediate assumptions, the long-range actuarial balance is -2.78% of taxable payroll. |
| 53. |
On average, previous increases in the full retirement age led covered workers to claim benefits at an older age. Joyce Manchester and Jae G. Song, "What Can We Learn from Analyzing Historical Data on Social Security Entitlements?," Social Security Bulletin, vol. 71, no. 4 (2011). |
| 54. |
The full retirement age (FRA) is the age at which a person first becomes entitle to retirement benefits without reduction based on age. The earliest eligibility age (EEA) is the age, currently 62, at which a fully insured individual first becomes eligible to receive retired-worker benefits. This is also known as the retirement eligibility age. CRS Report R43542, How Social Security Benefits Are Computed: In Brief. |
| 55. |
98th Congress, H.R. 1900. |
| 56. |
For more background on the Social Security Amendments of 1983, see CRS Report RL30920, Social Security: Major Decisions in the House and Senate Since 1935. |
| 57. |
See SSA, "Provisions Affecting Retirement Age," at https://www.ssa.gov/OACT/solvency/provisions/retireage.html. |
| 58. |
The actuarial balance is the difference between the summarized income and the summarized costs as a percentage of taxable payroll over a given valuation period (The Board of Trustees, 2019 Annual Report, p. 230). The trustees define long-range as 75 years, the length of their projection period. The trustees used this duration because it approximately covers the lifespan of all current Social Security participants (The Board of Trustees, 2019 Annual Report, p. 238). Under current law and the trustees' intermediate projections, the long-term actuarial balance is estimated to be -2.78% of taxable payroll. The long-range actuarial balance of -2.78% of taxable payroll differs from the necessary tax rate increase of 2.70%. This is primarily because the long-range actuarial balance incorporates a trust funds balance equal to one year's cost at the end of the projection period whereas the necessary tax does not. In addition, the necessary tax rate reflects behavioral responses to tax rate changes whereas the long-term actuarial balance does not. |
| 59. |
A policy option that would extend the projected solvency would result in beneficiaries receiving all of their scheduled benefits for a longer period. A policy option that reduces the long-term actuarial balance improves the program's financial status throughout the 75-year projection period. During periods with no trust funds balance to draw upon, where revenues from taxes determine the percentage of scheduled benefits that can be paid, an actuarial balance closer to zero implies that beneficiaries would receive a larger percentage of their scheduled benefits. An actuarial balance of 0% means OASDI costs are equal to OASDI revenues; the program would be operating as a perfectly pay-as-you-go program where all scheduled benefits are paid. |
| 60. |
Congressional Budget Office (CBO), Social Security Policy Options, 2015, December 2015, pp. 55-61, 96, https://www.cbo.gov/sites/default/files/114th-congress-2015-2016/reports/51011-SSOptions_OneCol-2.pdf. (Hereinafter CBO, Social Security Policy Options.) |
| 61. |
CBO, Social Security Policy Option, pp. 55-61, 96. |
| 62. |
CRS Report R44846, The Growing Gap in Life Expectancy by Income: Recent Evidence and Implications for the Social Security Retirement Age. |
| 63. |
See SSA, OCACT, "Provisions Affecting Retirement Age," at https://www.ssa.gov/OACT/solvency/provisions/retireage.html. |
| 64. |
Steven H. Sandell, Howard M. Iams, and Daniel Fanaras, "The Distributional Effects of Changing the Averaging Period and Minimum Benefits Provided," Social Security Bulletin, vol. 62, no. 2 (1999), p. 5. |
| 65. |
CRS Report R43542, How Social Security Benefits Are Computed: In Brief. Under current law, delayed retirement credits are not awarded past the age of 70. |
| 66. |
Sandra L. Colby and Jennifer M. Ortman, The Baby Boom Cohort in the United States: 2012 to 2060, United States Census Bureau, P25-1141, May 2014, p. 2, at https://www.census.gov/prod/2014pubs/p25-1141.pdf. |