Recent Violent Crime Trends in the United States
Media accounts of increasing violent crime rates, especially homicides, in some cities raise broad concerns about decreasing levels of public safety.
This report provides an analysis of changes in violent crime since 1960, with a focus on changes from 2014 to 2016 in violent crime and homicide rates in the 48 largest cities in the United States for which violent crime and homicide data were submitted to the Federal Bureau of Investigation’s Uniform Crime Reporting Program. The results of the analysis suggest the following:
At the national level, violent crime and homicide rates increased from 2014 to 2015 and again from 2015 to 2016, but both rates remain near historical lows.
Violent crime and homicide rates for the 48 largest cities in the United States with available data generally followed national-level trends, with some exceptions. For example, violent crime rates in cities of 500,000-999,999 people and 250,000-499,999 people decreased from 2014 to 2015, and the homicide rate in small cities of 50,000-99,999 people decreased from 2015 to 2016.
Some of the largest cities in the United States saw increases in violent crime rates, homicide rates, or both from 2014 to 2015 and/or 2015 to 2016. For some of these cities, violent crime or homicide rates were the highest they have been in the past 20 years.
Recent increases in violent crime and homicide in large cities have received a great deal of attention, but in smaller communities violent crime and homicide rates also increased from 2014 to 2015 and again from 2015 to 2016, although not as much as in the largest cities.
The “Ferguson effect” is one of the more widely discussed, and controversial, explanations for the recent increases in violent crime. It refers to the assertion that crime has increased recently because police are avoiding proactive policing tactics out of fear of repercussions for the use of aggressive tactics. There is a small but growing body of literature on the Ferguson effect, and the evidence is mixed. For example, recent research conducted by a Johns Hopkins University sociologist found some evidence of a post-Ferguson decrease in arrests and a post-Ferguson increase in crime in Baltimore. However, the research did not reveal a causal link between the decreasing arrests and increasing crime. Additionally, studies of the Ferguson effect have generally focused on a single state or specific cities, which make the results of these studies non-generalizable to other jurisdictions.
Policymakers might consider various options to assist cities that have seen an increase in violent crime and homicide rates. These include providing additional assistance to local governments through existing grant programs such as the Edward Byrne Memorial Justice Assistance Grant, Byrne Criminal Justice Innovation, and Community Oriented Policing Services’ hiring programs; authorizing and appropriating funding for a new grant program that would provide assistance to local governments to implement evidence-based violent crime prevention programs; or providing additional resources to allow the Department of Justice to expand its National Public Safety Partnership.
Recent Violent Crime Trends in the United States
Jump to Main Text of Report
Contents
- National Trends in Violent Crime and Homicide
- Local Trends in Violent Crime and Homicide
- Trends by the Size of the Jurisdiction
- Trends in Large Cities in the United States
- Is There a "Ferguson Effect"?
- Select Policy Options
- Additional Grant Funding
- The National Public Safety Partnership
Figures
- Figure 1. National Violent Crime Rate, 1960-2016
- Figure 2. National Homicide Rate, 1960-2016
- Figure 3. Annual Percentage Change in the Violent Crime Rate, 1960-2016
- Figure 4. Annual Percentage Change in the Homicide Rate, 1960-2016
- Figure 5. Violent Crime Rates, by City Size, 1990-2016
- Figure 6. Homicide Rates, by City Size, 1990-2016
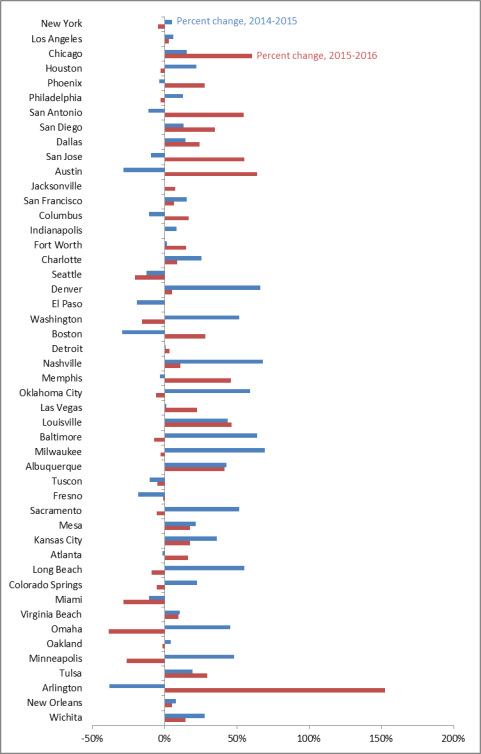
- Figure 7. Percentage Change in Violent Crime Rates in the 48 Largest Cities in the United States, 2014-2015 and 2015-2016
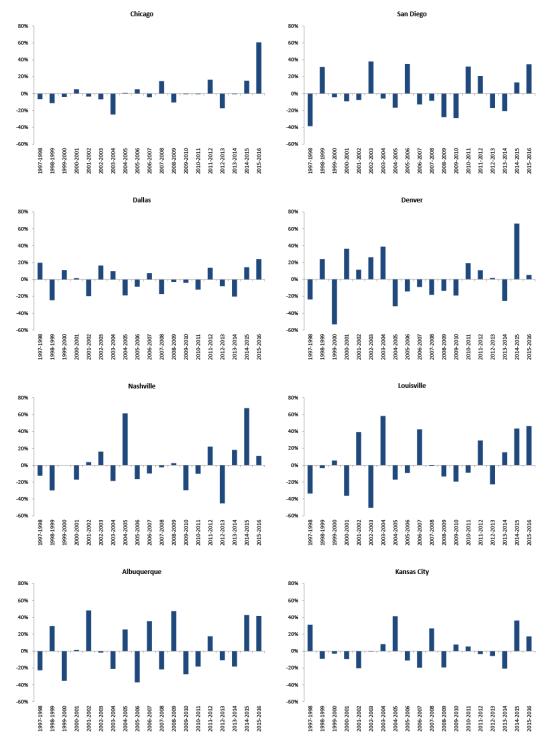
- Figure 8. Changes in Violent Crime Rates in Select Cities, 1997-2016
- Figure 9. Percentage Change in Homicide Rates in the 48 Largest Cities in the United States, 2014-2015 and 2015-2016
- Figure 10. Changes in Homicide Rates in Select Cities, 1997-2016
Tables
- Table B-1. National Violent Crime and Homicide Rates, 1960-2016
- Table B-2. Violent Crime and Homicide Rates, by Size of Jurisdiction, 1990-2016
- Table B-3. Violent Crime Rates for the 50 Largest Cities in the United States, 1997-2006
- Table B-4. Violent Crime Rates for the 50 Largest Cities in the United States, 2007-2016
- Table B-5. Homicide Rates for the 50 Largest Cities in the United States, 1997-2006
- Table B-6. Homicide Rates for the 50 Largest Cities in the United States, 2007-2016
Summary
Media accounts of increasing violent crime rates, especially homicides, in some cities raise broad concerns about decreasing levels of public safety.
This report provides an analysis of changes in violent crime since 1960, with a focus on changes from 2014 to 2016 in violent crime and homicide rates in the 48 largest cities in the United States for which violent crime and homicide data were submitted to the Federal Bureau of Investigation's Uniform Crime Reporting Program. The results of the analysis suggest the following:
- At the national level, violent crime and homicide rates increased from 2014 to 2015 and again from 2015 to 2016, but both rates remain near historical lows.
- Violent crime and homicide rates for the 48 largest cities in the United States with available data generally followed national-level trends, with some exceptions. For example, violent crime rates in cities of 500,000-999,999 people and 250,000-499,999 people decreased from 2014 to 2015, and the homicide rate in small cities of 50,000-99,999 people decreased from 2015 to 2016.
- Some of the largest cities in the United States saw increases in violent crime rates, homicide rates, or both from 2014 to 2015 and/or 2015 to 2016. For some of these cities, violent crime or homicide rates were the highest they have been in the past 20 years.
- Recent increases in violent crime and homicide in large cities have received a great deal of attention, but in smaller communities violent crime and homicide rates also increased from 2014 to 2015 and again from 2015 to 2016, although not as much as in the largest cities.
The "Ferguson effect" is one of the more widely discussed, and controversial, explanations for the recent increases in violent crime. It refers to the assertion that crime has increased recently because police are avoiding proactive policing tactics out of fear of repercussions for the use of aggressive tactics. There is a small but growing body of literature on the Ferguson effect, and the evidence is mixed. For example, recent research conducted by a Johns Hopkins University sociologist found some evidence of a post-Ferguson decrease in arrests and a post-Ferguson increase in crime in Baltimore. However, the research did not reveal a causal link between the decreasing arrests and increasing crime. Additionally, studies of the Ferguson effect have generally focused on a single state or specific cities, which make the results of these studies non-generalizable to other jurisdictions.
Policymakers might consider various options to assist cities that have seen an increase in violent crime and homicide rates. These include providing additional assistance to local governments through existing grant programs such as the Edward Byrne Memorial Justice Assistance Grant, Byrne Criminal Justice Innovation, and Community Oriented Policing Services' hiring programs; authorizing and appropriating funding for a new grant program that would provide assistance to local governments to implement evidence-based violent crime prevention programs; or providing additional resources to allow the Department of Justice to expand its National Public Safety Partnership.
Accounts of increasing violent crime, especially homicides, in some cities1 have raised questions about whether the United States has reached the end of the "great American crime decline;"2 the decrease in crime rates during the 1990s and 2000s that was the longest and largest since World War II. The decline occurred across both violent and nonviolent offenses, all regions of the country, and major demographic groups. Some policymakers might be concerned about the recent increases in violent crime rates because public safety is viewed as an important measure of quality of life in cities and towns across the country. If public safety is deteriorating, policymakers might have an interest in what Congress can do to promote safer communities.
This report describes changes in violent crime since 1960, with a focus on changes in the violent crime rates since 2014, especially in large cities. The analysis suggests three broad points: (1) after nearly two decades of decreasing crime rates, violent crime rates in the United States increased from 2014 to 2015, and again from 2015 to 2016, (2) violent crime rates, even after accounting for the recent increases, remain near historical lows, and (3) while there were increases in violent crime (particularly homicides) in some cities, these increases are not indicative of a sweeping national crime wave. The report also provides a review of research on whether increases in violent crime in some cities can be attributed to a "Ferguson effect." The report concludes with a discussion about select policy options that Congress could consider for providing assistance to cities that are experiencing increases in violent crime.
National Trends in Violent Crime and Homicide
The most recent crime data published by the Federal Bureau of Investigation (FBI) from its Uniform Crime Reporting (UCR) program3 indicate that after many years of nearly uninterrupted declines, the national rates for violent crime and homicide increased from 2014 to 2016.4 The violent crime rate increased from 361.6 per 100,000 people in 2014 to 373.7 per 100,000 in 2015, and increased again to 386.3 per 100,000 in 2016 (see Figure 1 and Appendix B). Likewise, the homicide rate increased from 4.4 per 100,000 in 2014 to 4.9 per 100,000 in 2015, and to 5.3 per 100,000 in 2016 (see Figure 2 and Appendix B).
|
UCR Offense Definitions Under the UCR's Summary Reporting System, which provides the data used in this report, "violent crime" consists of homicide, rape, robbery, and aggravated assault. These offenses are defined as follows:
|
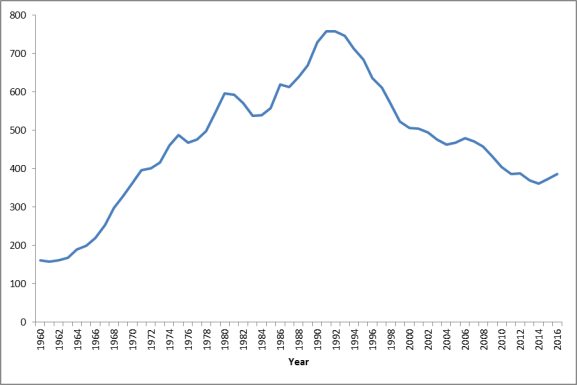
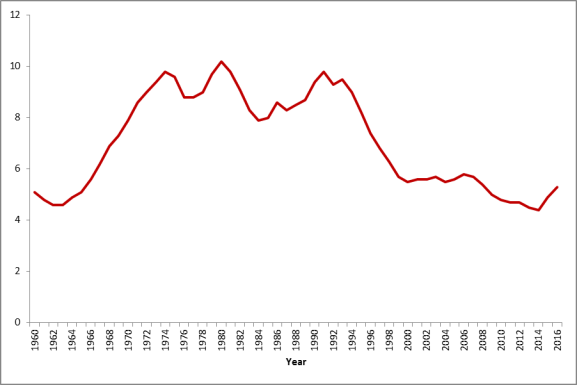
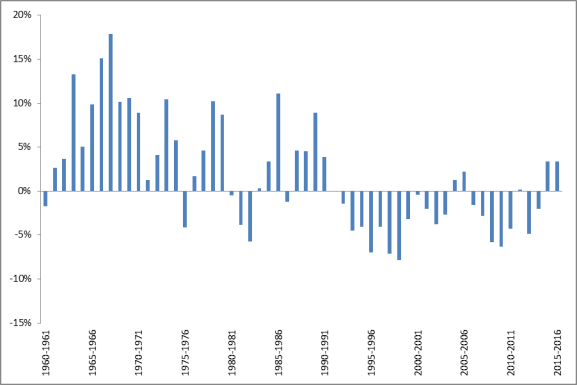
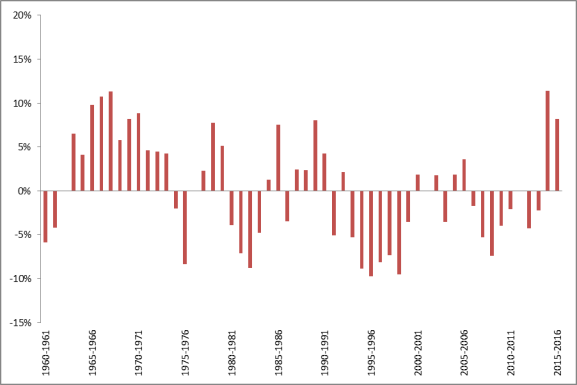
The increases in both the violent crime and homicide rates from 2014 to 2016 are in contrast to long-term general declines in these rates since the early 1990s, but it was the large percentage increase in the homicide rate during this time that stands out. From both 2014 to 2015 and 2015 to 2016, the violent crime rate increased by approximately 3% (see Figure 3). While this is not historically unprecedented—the violent crime rate had larger year-to-year percentage increases in the 1960s, 1970s, and 1980s—it does break with recent trends that saw violent crime rates decrease for most of the 1990s and 2000s. In contrast, the homicide rate increased 11% from 2014 to 2015 and 8% from 2015 to 2016. The 11% increase in the homicide rate in 2015 was the largest year-to-year percentage increase since 1968 (see Figure 4).
While short-term increases in crime grab headlines, these changes should generally be viewed in the context of longer time periods to determine whether the changes reveal short-term change or long-term trends.5 Evaluating crime data in short intervals can amplify the "noise"6 in the data and make it harder to distinguish the underlying trend.7
Violent crime and homicide rates have generally trended downward since the early 1990s. Even though the violent crime and homicide rates increased from 2014 to 2015 and again from 2015 to 2016, both rates remained at levels not seen since the mid-1960s. The 2016 violent crime and homicide rates are approximately half their post-1960 highs of 758.2 per 100,000 and 10.2 per 100,000.
Even though violent crime and homicide rates have generally declined since the early 1990s, there were years when either one or both increased, before resuming the long-term decline in subsequent years. For example, the national violent crime rate increased from 2004 to 2005 and again from 2005 to 2006 before declining nearly every year thereafter.8 Similarly, the national homicide rate increased in four of the six years from 2000 to 2006, though the year-to-year increases in the rate during this span (usually 0.1 homicides per 100,000) was not as substantial as the increase from 2014 to 2015 (0.5 homicides per 100,000) or from 2015 to 2016 (0.4 homicides per 100,000).
Local Trends in Violent Crime and Homicide
An analysis of violent crime and homicide data at a local level can provide insight into whether trends observed in national data are widespread or the result of changes in jurisdictions of a certain size, or even a handful of cities.
Trends by the Size of the Jurisdiction
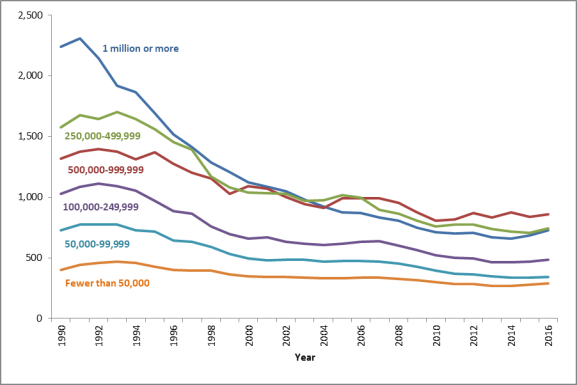
Violent crime trends in U.S. cities generally drive national trends, but there were some exceptions. From 2014 to 2015, violent crime rates
- increased 4% in cities of 1 million or more people, which was similar to but slightly greater than the increase in the national violent crime rate (3%);
- decreased (-4% and -1%, respectively) in cities of 500,000-999,999 people and 250,000-499,999 people;
- increased in some smaller cities, but at a rate that was slightly less than the national rate (2% for cities of 100,000-249,999 people and 1% for cities of 50,000-99,999 people); and
- increased by 5% in cities of fewer than 50,000 people, which was greater than the increase in the national crime rate.
From 2015 to 2016, the violent crime rates increased for cities of all sizes. Specifically, the violent crime rates
- increased 6% in cities of 1 million or more people, which was double the increase in the national violent crime rate (3%);
- increased 3% in cities of 500,000-999,999 people;
- increased 5% in cities of 250,000-499,999 people;
- increased 3% in cities of 100,000-249,999 people;
- increased by 1% in cities of 50,000-99,999 people; and
- increased by 3% in cities of fewer than 50,000 people.
Figure 5 presents data on violent crime rates from 1990 to 2016 by city size.
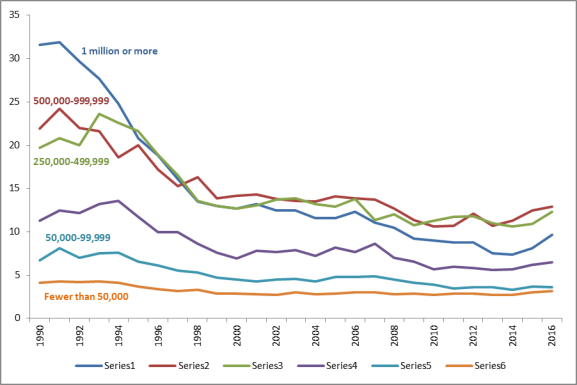
Homicide trends in U.S. cities also generally drive the national trend. Homicide rates increased in cities of all sizes from 2014 to 2015. Specifically, homicide rates
- increased 9% in cities of 1 million or more people, which was slightly below the increase in the national homicide rate (11%);
- increased 11% in cities of 500,000-999,999 people;
- increased 3% in cities of 250,000-499,999 people;
- increased 9% in cities of 100,000-249,999 people;
- increased 12% in cities of 50,000-99,999 people; and
- increased 11% in cities of fewer than 50,000 people.
From 2015 to 2016, homicide rates increased in cities with populations of less than 50,000 and 100,000 or more . Specifically, the homicide rates
- increased 20% in cities of 1 million or more people (20%), which was greater than the increase in the national homicide rate (8%);
- increased 3% in cities of 500,000-999,999 people;
- increased 13% in cities of 250,000-499,999 people;
- increased 5% in cities of 100,000-249,999 people;
- decreased 3% in cities of 50,000-99,999 people; and
- increased 7% in cities of fewer than 50,000 people.
Figure 6 presents data on homicide rates from 1990 to 2016 by the size of the city.
|
Figure 6. Homicide Rates, by City Size, 1990-2016 Rate per 100,000 people |
 |
|
Source: Federal Bureau of Investigation, Crime in the United States, 1990-2016. |
Trends in Large Cities in the United States
Much of the increase in violent crime in the largest cities in the United States from 2014 to 2016 was driven by increases in a handful of cities.9 From 2014 to 2015, there was a net increase of 14,464 violent crimes in the 48 largest cities10 in the United States for which violent crime and homicide data were available; three cities (Los Angeles, Las Vegas, and Baltimore) accounted for 60% of the net increase.11 The 10 cities with the largest increases in the number of violent crimes from 2014 to 2015 (Los Angeles, Las Vegas, Baltimore, Wichita, Charlotte, San Antonio, Kansas City, Milwaukee, Sacramento, and Denver) accounted for 97% of the net increase in the number of violent crimes among the 48 cities. From 2015 to 2016, there was a net increase of 24,218 violent crimes in these cities.12 Increases in violent crime in Chicago, Los Angeles, San Antonio, and Houston accounted for 55% of the net increase, while the 10 cities with the largest increases in violent crime from 2015 to 2016 (Chicago, Los Angeles, San Antonio, Houston, Detroit, Baltimore, Phoenix, Kansas City, Dallas, and Albuquerque) accounted for 87% of the net increase.
Similar results were found in year-to-year changes in homicide in these same 48 cities. From 2014 to 2015, there was a net increase of 685 homicides in the 48 largest cities for which data were available.13 The increase in the number of homicides in Baltimore alone during this time accounted for 19% of the net increase, while the increase in the number of homicides in Baltimore, Chicago, Houston, Washington, DC, and Milwaukee together accounted for 54% of the net increase. The 10 cities with the largest increase in the number of homicides from 2014 to 2015 (Baltimore, Chicago, Houston, Washington, Milwaukee, Philadelphia, Kansas City, Nashville, Oklahoma City, and Louisville) accounted for 76% of the net increase. From 2015 to 2016, there was a net increase of 632 homicides in these same cities.14 The increase in the number of homicides in Chicago during this time accounted for 45% of the net increase. The 10 cities with the largest increase in the number of homicides from 2015 to 2016 (Chicago, Memphis, San Antonio, Louisville, Dallas, Phoenix, Las Vegas, Kansas City, Albuquerque, and San Jose) accounted for 94% of the net increase during that time.
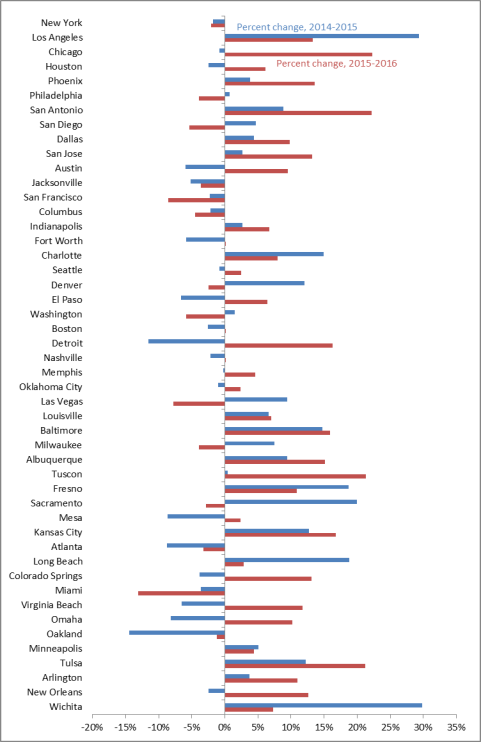
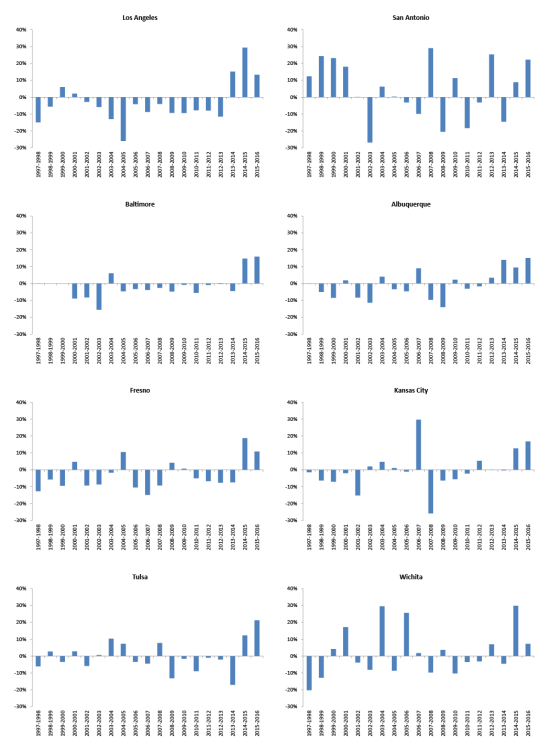
In nearly half of the 48 largest cities in the United States for which violent crime and homicide data were available, violent crime rates increased from 2014 to 2015 or from 2015 to 2016 (see Figure 7). Data going back to 1997 reveal it is common for city-level violent crime rates to fluctuate from year-to-year. The charts in Figure 8 are illustrative of this point. The cities included in Figure 8 were selected because their violent crime rates increased in both 2015 and 2016 and the percentage increase from 2014 to 2015 or from 2015 to 2016 was large relative to other cities. Data indicate that the year-to-year increases in violent crime rates, similar to those which recently occurred in many large cities, are not unusual and do not always portend continued increases. For example, the violent crime rate in Kansas City increased 30% from 2006 to 2007, followed by a 36% decrease from 2008 to 2011. For other cities, recent increases in violent crime rates broke with long-term historical trends. For example, the violent crime rate in Los Angeles increased by 13% or more in each of the past three years. Prior to that, the violent crime rate had decreased in 14 of the 16 years since 1997—and when it did increase, it was a much smaller percentage increase (6% in 2000 and 2% in 2001) than more recent increases.
For many cities, even though violent crime rates increased from 2014 to 2015 and/or from 2015 to 2016, the 2016 rates were still lower than their peak violent crime rates during the last 20 years. There were two cities—Milwaukee and Wichita—where increases in violent crime rates from 2014 to 2015 and/or from 2015 to 2016 resulted in these cities experiencing their highest violent crime rates since before 1997.
Of the 48 largest cities in the United States for which the data are available, UCR data show that from 2014 to 2016 more cities experienced an increase in their homicide rate than experienced an increase in their violent crime rates.
Scale bears upon evaluation of percentage changes in homicide rates. Because there are far fewer homicides per 100,000 relative to violent crimes overall, small numerical changes in homicide rates can result in large percentage changes. The largest year-to-year percentage increase in the violent crime rate in any of the 48 largest cities with available data was an approximately 30% increase from 2014 to 2015 in Los Angeles and Wichita. In comparison, 13 cities saw their homicide rates increase by 50% or more during this same time, with the homicide rate in Arlington, TX, increasing by approximately 150% from 2015 to 2016 (Figure 9). However, Arlington's homicide rate increased from 2.1 per 100,000 in 2015 to 5.3 per 100,000 in 2016 because of an increase from 8 homicides in 2015 to 21 in 2016. Even with the increase, Arlington still had one of the lowest homicide rates amongst major U.S. cities. In comparison, Atlanta experienced a similar increase in the rate of homicides per 100,000 people (from 20.2 in 2015 in 2015 to 23.5 per 100,000 in 2016), which only resulted in a 16% increase in Atlanta's homicide rate.
An examination of trends going back to 1997 shows that, like violent crime rates, it is common for homicide rates to fluctuate from year-to-year and that recent increases experienced by some cities run counter to long-term trends. Data on homicide trends in eight cities presented in Figure 10 illustrate these points. The cities included in Figure 10 were selected because their homicide rates increased from 2014 to 2015 and from 2015 to 2016, and the percentage increase in one or both years was large relative to increases in other cities. Homicide rates in Albuquerque and Kansas City, for example, increased by approximately 40% from either 2014 to 2015 or 2015 to 2016, but both cities had experienced comparable increases in the past that were followed by decreases in the city's homicide rate. On the other hand, increases in homicide rates in some cities broke with longer-term trends. For example, the homicide rates in Nashville and Louisville increased three years in a row from 2014 to 2016, something that has not happened since before 1997, but both of these cities also had several years of decreases in their homicide rates that resulted in their 2016 homicide rates to still be less than they were in 1997.
As with violent crime rates, even though the homicide rates for many of the 48 largest cities for which data were available increased from 2014 to 2015 and/or from 2015 to 2016, their homicide rates remained lower than they were at any time since 1997. However, six cities—Chicago, Baltimore, Omaha, Memphis, San Antonio, and Milwaukee—reached a 20-year high for their homicide rates in either 2015 or 2016.
In summary, data on violent crime and homicide rates, with a focus on the 48 largest U.S. cities for which data were available, suggest that while recent increases in violent crime and homicide rates are cause for concern in many large cities, the country as a whole is not in the midst of a sweeping national violent crime wave. It is common for violent crime and homicide rates to fluctuate from year-to-year, and crime rates are generally higher in large cities than in the rest of the United States. There were some cities that experienced increases in violent crime and homicide from 2014 to 2015 and again from 2015 to 2016, but in many other large cities, violent crime and/or homicide rates only increased in one of those years, or they decreased in both.
Is There a "Ferguson Effect"?
There are many theories about why crime increases or decreases,15 but recently, the discussion of a "Ferguson effect" has grabbed the attention of scholars and policymakers alike.16 The Ferguson effect is one of the more widely discussed and controversial explanations for the recent increases in violent crime in some cities. There are two explanations for how the events that occurred in Ferguson, MO, might be associated with an increase in violent crime. The first is "de-policing," whereby law enforcement, in light of negative publicity and public protest over allegations of overly aggressive and discriminatory police practices, withdraw from engaging in proactive policing efforts due to concerns about public criticism of officers' behavior and associated lawsuits. The second is that high-profile incidents, such as the shooting of Michael Brown by police in Ferguson, may be interpreted by the public to mean that justice is not being administered fairly, which empowers some individuals to engage in behaviors that directly challenge the legitimacy of law enforcement and others not to turn to law enforcement for help when crime occurs.
There is a small but growing body of research on whether the Ferguson effect has contributed to increasing violent crime rates. A study sponsored by the National Institute of Justice finds mixed evidence of a Ferguson effect.17 The study cites data from the Pew Research Center that suggests that police officers have altered their behavior in response to high-profile use of force incidents in a manner consistent with de-policing.18 However, the Pew data had significant limitations (e.g., the Pew survey asked officers to report on other officers' behavior; only officers from agencies with at least 100 officers were surveyed19; the survey asked about "high profile incidents involving blacks and the police" rather than the specific events in Ferguson, MO; and data were not collected pre-and post-Ferguson that would have allowed for a causal inference to be made), which make it hard to determine how much, if at all, police officers' behaviors have changed in response to Ferguson or other similar incidents. The study also notes that the ratio of arrests to reported offenses (i.e., the clearance rate20) decreased modestly from 2014 to 2015 in cities with populations over 100,000, which coincided with an increase in homicides in many of these same cities. Declining clearance rates are consistent with decreases in proactive policing; however, the clearance rate was decreasing prior to 2014, before the events in Ferguson, MO, and at a time when homicide rates were declining. A similar pattern emerged when looking at clearance rates for serious and minor offenses separately: the clearance rates for serious and minor offenses have been decreasing for several years prior to 2015 when violent crime and homicide rates were also decreasing. The study found some evidence that increases in homicides could be tied to decreasing police legitimacy, and increasing distrust of the police resulting from high-profile use of force cases. For example, the study notes that calls to the police in Milwaukee decreased significantly after the police beat and badly injured a black man, and the decline was more pronounced in predominately black neighborhoods. However, it is not clear whether other cities saw decreases in calls for police service post-Ferguson, nor is it clear to what degree decreased reliance on the police contributed to increases in violent crime.
Two additional studies provide further insight into the Ferguson effect. The first examined changes in violent21 and property22 crime rates for 81 cities with populations greater than 200,000 for evidence of a post-Ferguson crime increase.23 The researchers concluded that there was no systematic change (i.e., across all cities) in the total,24 violent, and property crime rates post-Ferguson. But, when they disaggregated violent and property crime rates into individual offense rates, they found evidence of increases in robbery rates after Ferguson, but no statistically significant increase in crime rates for any other property or violent offense. The authors noted that their analysis could not discern the extent to which de-policing or a crisis in police legitimacy occurred after Ferguson, and what effect it might have had on crime rates, but "[w]hat we do know, however, is that if de-policing or a legitimacy crisis are occurring, neither is impacting crime rates systematically across large U.S. cities."25
The second study attempted to address some of the shortcomings of the first by using traffic stop and crime data for jurisdictions in Missouri to evaluate the link between de-policing and crime rates.26 Their analysis found that police made about 67,000 fewer stops in 2015 compared to 2014, but the reduction in the number of stops did not correspond with a decrease in the number of searches or arrests. However, police did increase their hit rates (i.e., searches that resulted in the discovery of contraband) in 2015, which suggests that they were making "better stops and conducting searches that more consistently yielded contraband."27 They also found that, in jurisdictions with a higher proportion of African-Americans, police made fewer stops, searches, and arrests in 2015 compared to 2014, which suggests that the racial composition of cities can shape de-policing behavior. Finally, their analysis did not uncover a link between reduced stops and crime rates.
Researchers at Johns Hopkins University also tested for a Ferguson effect by examining changes in crime rates and arrests in Baltimore after the events in Ferguson, and after the unrest stemming from the death of Freddie Gray while he was in the custody of the Baltimore Police Department.28 The researchers conclude that, after adjusting for seasonal variation in crime rates, there was little evidence of a Ferguson effect during the period after the events in Ferguson but before Freddie Gray's death. They did find evidence of a spike in crime after Freddie Gray's death, which only partly abated after the appointment of a new police commissioner. However, the researchers concluded that it is not clear the post-Freddie Gray crime spike is evidence of a Ferguson effect.
After the arrest of Freddie Gray, evaluation of the Ferguson effect is challenging.... [T]he Gray effect is fundamentally entangled with the Ferguson effect narrative, and it is not surprising therefore that the debate on the Ferguson effect picked up momentum shortly after the unrest in Baltimore.
One reasonable interpretation of these entangled effects is that the crime spike in the Gray period could be a Ferguson effect that would have remained dormant had it not been ignited by a localized Gray effect. However, the size and duration of the crime spike is almost certainly attributable to particular features of the unrest, possibly including an increase in gang-related conflict over drug distribution as well as a police pullback in protest of the city's leadership. These accelerants have little or no connection to the core narrative of the conjectured Ferguson effect, and as a result at least some portion of the crime spike is probably a genuine Gray effect that cannot be attributed to the Ferguson effect narrative championed by some commentators.29
The Johns Hopkins study did find some evidence of a potential Ferguson effect in the arrest data. Arrests declined after Ferguson, and they continued to decrease after Freddie Gray's death before increasing after the appointment of a new police commissioner. The researchers noted that arrests decreased for lower-level crimes where police have some discretion about whether to arrest a suspect; arrests for violent crimes, such as homicide and robbery, remained steady. The analysis does not attempt to draw a link between declining arrests and increased crime. However, the researchers offer a conclusion, which they note "entail[s] reasoning that is beyond the empirical analysis that we can offer," that "the composition of the crime spike that began [after Freddie Gray's death] is more likely attributable to the particular features of the unrest and how it was handled than by the decline in discretionary arrests that proceeded it."30
In conclusion, there is some evidence that police in Baltimore made fewer arrests post-Ferguson at the same time that there was an increase in violent crime. However, there is little evidence of a link between de-policing and increases in violent crime. There are only a handful of studies that have evaluated this phenomenon, and two of the studies, which were more methodologically rigorous in evaluating the link between de-policing and crime, use state- and city-level data and are not generalizable to all states and cities. In addition, a post-Ferguson decrease in arrests might not be a detriment to Baltimore communities if the decrease did not result in an increase in crime and the reduction was in arrests that generate tensions between minority communities and the police. As the authors of the study in Baltimore noted:
The decline in arrests that is interpretable as a Ferguson effect in the period of time before the arrest of Freddie Gray can be considered a positive development for the Baltimore community. This conclusion would follow from the position that a decline in discretionary arrests is a desired goal, following a period in Baltimore during which many residents and their local leaders concluded that the robust policing of struggling communities is not helpful for their redevelopment.31
Select Policy Options
While available data suggest that the country is not in the grip of national violent crime wave, there is evidence that some U.S. cities are experiencing substantial increases in violent crime, particularly homicides. Policymakers may consider congressional action to support efforts to reduce violent crime in some of the most affected cities.
Additional Grant Funding
Most federal efforts to reduce violent crime involve providing grant funds to state and local governments to support crime-reduction efforts. Along these lines, policymakers could consider providing more funding to the Edward Byrne Memorial Justice Assistance Grant (JAG) program.32 Because of the breadth of the program, local governments could use their grant funds for a variety of crime-prevention efforts, including programs that address issues that might be giving rise to increases in violent crime. However, because JAG is a formula grant program, additional funding would not be limited to only the cities that have experienced recent increases in rates of violent crime and homicides. Should Congress increase appropriations for the JAG program, the additional funds would be distributed to all eligible state and local governments per the statutorily defined formula.33 Also, local governments would not be required to use any additional funding they might receive for violent crime-prevention programs. Thus, Congress might also consider amending 34 U.S.C. §10157(b) so that the Department of Justice (DOJ) would be required to set aside a proportion of the annual JAG appropriation to help local governments "combat, address, or otherwise respond to precipitous or extraordinary increases in crime, or in a type or types of crime."34
Policymakers could also consider providing additional funding to discretionary grant programs such as the Community Oriented Policing Services' (COPS) hiring program,35 the Byrne Criminal Justice Innovation program,36 or Project Safe Neighborhoods.37 In addition, Congress could consider authorizing and appropriating funding for a new grant program that supports investment in evidence-based policing strategies or crime prevention program, such as "hot-spots" policing."38 However, while discretionary grant programs can be more targeted than formula grant programs, the Administration ultimately makes the decision about which entities will receive funding. Congress could influence grant awards by placing conditions on appropriated funding. For example, Congress could direct DOJ to award grants to cities with violent crime rates above the national violent crime rate or to cities that have had a certain minimum percentage increase in homicide rate from one year to the next.
The National Public Safety Partnership
Congress might also consider providing resources to help DOJ expand the National Public Safety Partnership (PSP). DOJ established PSP in response to an Executive Order issued by President Trump on February 9, 2017, that required DOJ to take the lead on promoting public safety by coordinating with state, local, and tribal law enforcement agencies.39 PSP builds upon lessons learned from a similar DOJ initiative, the Violence Reduction Network (VRN).40 PSP is an initiative whereby DOJ assists state, local, and tribal law enforcement with developing programs to investigate, prosecute, and deter violent crime, especially violent crime related to gangs, gun violence, and drug trafficking. Sites that participate in PSP develop their own violence reduction strategies and DOJ provides them with specialized training and technical assistance to help them implement their strategies.
PSP has faced criticism. It is argued that the most recent round of cities that DOJ chose to participate in PSP were not the cities with the greatest need for assistance.41 Cities such as Baltimore, Chicago, Detroit, Nashville, and Washington, DC—which have struggled with increasing rates of violent crime over the past couple years or which have relatively high violent crime rates—were not chosen to participate in PSP.42 Also, while DOJ provides training and technical assistance through PSP, cities selected to participate in the program do not receive additional funding to help implement their violence reduction strategies.43
Currently, PSP is a DOJ-initiated program with no authorizing legislation dictating its parameters. Authorizing legislation could provide an opportunity for policymakers to set criteria for how cities are chosen for participation in the program. Congress could also choose to authorize funding for the program so DOJ could provide financial assistance to selected cities to help them implement their violence reduction strategies.
Appendix A. Uniform Crime Reporting (UCR) Program
The FBI UCR program is comprised of four subprograms: the Summary Reporting System (SRS), the National Incident Based Reporting System (NIBRS), the Law Enforcement Officers Killed and Assaulted Program, and the Hate Crime Statistics Program. The FBI, through the SRS, collects data on the number of offenses known to police, the number and characteristics of persons arrested, and the number of "clearances"44 for eight different offenses collectively referred to as Part I offenses. Part I offenses include four "violent" offenses (murder and non-negligent manslaughter, forcible rape,45 robbery, and aggravated assault) and four "property" offenses (burglary, larceny-theft, motor vehicle theft, and arson). The FBI collects data on the number of arrests made for the eight Part I offenses and 21 other offenses, known as Part II offenses. The UCR, with the exception of NIBRS, is a summary system, meaning that offense data submitted to the FBI by local law enforcement agencies show the total number of known Part I offenses.46 Likewise, UCR arrest data show the total number of persons arrested by reporting law enforcement agencies.
Law enforcement agencies voluntarily submit crime data to the FBI for inclusion in the UCR. Such data are submitted monthly either directly to the FBI or via a state UCR program, which in turn submits data to the FBI.47 Even though participation is voluntary, most law enforcement agencies participate. In 2016, approximately 18,400 law enforcement agencies reported data to the UCR.48 These agencies' jurisdictions contain about 323.4 million people,49 meaning that over 99% of the country's population was served by a law enforcement agency that reported crime data to the FBI.50
While UCR crime data published by the FBI is usually considered to be the official measure of crime in the United States, these data have limitations that should be considered when using them to evaluate crime trends.
- Limited Offense Data. The UCR SRS collects offense data on a limited number of crimes (i.e., Part I crimes only). Known offense data are not available for Part II crimes, which tend to be committed at a greater frequency than Part I crimes. Currently, the UCR SRS does not collect known offense data on crimes commonly covered by the media, such as kidnapping, bribery, or child pornography.
- Unreported Crimes. The UCR collects data on the number of offenses known to law enforcement. However, not all crimes that occur are known to the police. For example, in 2016 only 42% of violent victimizations were reported to the police.51 In some cases, the victim(s) or witness(es) to a crime might not report the incident to the police because of fear of reprisal, the belief that the police would not or could not do anything to help, or a belief that the crime was a personal issue or too trivial to report.52
- The Reporting Practices of Law Enforcement. UCR data can be affected by the reporting practices of local law enforcement. In some instances, the number of reported offenses might be a product of how assiduously local law enforcement follow the FBI's definitions for crimes under the UCR.53 For example, if a local law enforcement agency does not closely follow UCR definitions, the agency might, for example, classify an assault against a woman as an attempted rape, or a trespass as a burglary.
- The Organizational Practices of Law Enforcement Agencies. The number of reported offenses might increase as local law enforcement agencies become more effective.54 If a law enforcement agency puts more officers on patrol, there is a greater chance for offenses, which might have gone undetected with fewer officers, to come to the attention of law enforcement. If law enforcement agencies work to develop a better relationship with the citizens they serve, the reported number of offenses could increase because citizens might report more crimes. The number of reported offenses might also increase as law enforcement agencies develop better record-keeping systems and as they assign more employees to do dispatching, record keeping, and criminal incident reporting.55
- The Hierarchy Rule. Per the FBI's requirements, law enforcement agencies must employ the hierarchy rule when classifying and recording summary data submitted to the UCR program.56 The hierarchy rule states that when multiple Part I offenses occur in a single criminal incident, only the most serious offense is scored and reported to the FBI. For example, if an offender raped and then murdered a victim, the reporting law enforcement agency would submit only the murder to the UCR.57 Therefore, for some incidents the hierarchy rule reduces the number of offenses reported by law enforcement. However, the FBI reports that approximately 85% of criminal incidents involve only one offense.58
- Imputing Missing Data. If a law enforcement agency does not report UCR data to the FBI for the entire year, the FBI uses imputation techniques to estimate the law enforcement agency's missing data. The methodology differs depending on the number of months for which crime data were reported. If the law enforcement agency has submitted three to 11 months of data, the FBI estimates the total annual number of crimes for the jurisdiction by calculating the mean for the months of acceptable data an applying this mean to the missing months.59 Agencies that submit one or two months of data are treated as "non-reporters" and their data are imputed as follows:
- 1. Each reporting agency is grouped in strata defined by its metropolitan status (i.e., metropolitan statistical area, other cities, rural counties) and its population.
- 2. Only agencies that submitted 12 months of data are used as a basis for imputation.
- 3. The estimated crime volume for each stratum is calculated based on data submitted by agencies that reported for all 12 months.
- 4. The annual crime rate for the stratum is then applied to non-reporting agencies population to obtain the imputed number of offenses.
- 5. If no comparable agencies are available, the previous year's data non-reporting agencies are used as an estimate. In addition, the missing data from agencies with no associated population figures such as state police agencies or park police are not imputed.60
Imputation methods used by the FBI to estimate crime in jurisdictions that have not reported for the full year or non-reporting jurisdictions make assumptions that might not be valid. The imputation method used by the FBI to estimate a full year's worth of data for jurisdictions that report three to 11 months of data implicitly assumes that the crime rate for non-reported months is the same as the average crime rate for reported months.61 If the crime rates in the months for which data were not reported differ from the rates in the months for which data were reported, then the imputation procedure could either overestimate or underestimate the jurisdiction's annual crime rate. The imputation procedure used to estimate the crime rate for non-reporting jurisdictions assumes that cities and towns with similar sized populations are also similar in other factors that might affect the city or town's crime rate, such as income distribution, unemployment rates, population density, and racial composition.62
Appendix B. Violent Crime and Homicide Data
|
Year |
Violent Crime Rate |
Homicide Rate |
|
1960 |
160.9 |
5.1 |
|
1961 |
158.1 |
4.8 |
|
1962 |
162.3 |
4.6 |
|
1963 |
168.2 |
4.6 |
|
1964 |
190.6 |
4.9 |
|
1965 |
200.2 |
5.1 |
|
1966 |
220.0 |
5.6 |
|
1967 |
253.2 |
6.2 |
|
1968 |
298.4 |
6.9 |
|
1969 |
328.7 |
7.3 |
|
1970 |
363.5 |
7.9 |
|
1971 |
396.0 |
8.6 |
|
1972 |
401.0 |
9.0 |
|
1973 |
417.4 |
9.4 |
|
1974 |
461.1 |
9.8 |
|
1975 |
487.8 |
9.6 |
|
1976 |
467.8 |
8.8 |
|
1977 |
475.9 |
8.8 |
|
1978 |
497.8 |
9.0 |
|
1979 |
548.9 |
9.7 |
|
1980 |
596.6 |
10.2 |
|
1981 |
593.5 |
9.8 |
|
1982 |
570.8 |
9.1 |
|
1983 |
538.1 |
8.3 |
|
1984 |
539.9 |
7.9 |
|
1985 |
558.1 |
8.0 |
|
1986 |
620.1 |
8.6 |
|
1987 |
612.5 |
8.3 |
|
1988 |
640.6 |
8.5 |
|
1989 |
669.9 |
8.7 |
|
1990 |
729.6 |
9.4 |
|
1991 |
758.2 |
9.8 |
|
1992 |
757.7 |
9.3 |
|
1993 |
747.1 |
9.5 |
|
1994 |
713.6 |
9.0 |
|
1995 |
684.5 |
8.2 |
|
1996 |
636.6 |
7.4 |
|
1997 |
611.0 |
6.8 |
|
1998 |
567.6 |
6.3 |
|
1999 |
523.0 |
5.7 |
|
2000 |
506.5 |
5.5 |
|
2001 |
504.5 |
5.6 |
|
2002 |
494.4 |
5.6 |
|
2003 |
475.8 |
5.7 |
|
2004 |
463.2 |
5.5 |
|
2005 |
469.0 |
5.6 |
|
2006 |
479.3 |
5.8 |
|
2007 |
471.8 |
5.7 |
|
2008 |
458.6 |
5.4 |
|
2009 |
431.9 |
5.0 |
|
2010 |
404.5 |
4.8 |
|
2011 |
387.1 |
4.7 |
|
2012 |
387.8 |
4.7 |
|
2013 |
369.1 |
4.5 |
|
2014 |
361.6 |
4.4 |
|
2015 |
373.7 |
4.9 |
|
2016 |
386.3 |
5.3 |
Source: Sourcebook of Criminal Justice Statistics, Table 3.106.2012; Federal Bureau of Investigation, Crime in the United States 2016, Table 1.
Notes: "Violent crime" includes homicide, rape, robbery, and aggravated assault. Violent crime rates for 1960-2012 include data using the "legacy" rape definition. See the text box on "UCR Offense Definitions" for more details.
Table B-2. Violent Crime and Homicide Rates, by Size of Jurisdiction, 1990-2016
Rate per 100,000 people
|
1,000,000 and over |
500,000-999,999 |
250,000-499,999 |
100,000-249,999 |
50,000-99,999 |
||||||
|
Year |
Violent Crime Rate |
Homicide Rate |
Violent Crime Rate |
Homicide Rate |
Violent Crime Rate |
Homicide Rate |
Violent Crime Rate |
Homicide Rate |
Violent Crime Rate |
Homicide Rate |
|
1990 |
2,243.1 |
31.6 |
1,319.6 |
21.9 |
1,577.8 |
19.7 |
1,030.3 |
11.3 |
727.8 |
6.7 |
|
1991 |
2,311.4 |
31.9 |
1,378.5 |
24.2 |
1,676.3 |
20.8 |
1,085.7 |
12.5 |
772.9 |
8.1 |
|
1992 |
2,147.4 |
29.7 |
1,397.2 |
22.0 |
1,647.7 |
20.0 |
1,110.5 |
12.2 |
773.9 |
7.0 |
|
1993 |
1,920.0 |
27.7 |
1,376.5 |
21.6 |
1,705.2 |
23.6 |
1,093.1 |
13.2 |
773.4 |
7.5 |
|
1994 |
1,866.3 |
24.8 |
1,311.1 |
18.6 |
1,643.0 |
22.6 |
1,053.3 |
13.6 |
726.7 |
7.6 |
|
1995 |
1,691.5 |
20.8 |
1,370.3 |
20.0 |
1,559.0 |
21.6 |
972.5 |
11.7 |
717.7 |
6.6 |
|
1996 |
1,517.8 |
18.8 |
1,276.1 |
17.2 |
1,457.2 |
18.9 |
887.5 |
10.0 |
644.3 |
6.1 |
|
1997 |
1,412.4 |
16.1 |
1,200.6 |
15.3 |
1,394.6 |
16.5 |
863.5 |
10.0 |
633.3 |
5.5 |
|
1998 |
1,286.8 |
13.5 |
1,153.9 |
16.3 |
1,168.1 |
13.6 |
758.2 |
8.6 |
589.7 |
5.3 |
|
1999 |
1,207.4 |
13.0 |
1,027.5 |
13.9 |
1,082.1 |
13.0 |
694.6 |
7.6 |
531.5 |
4.7 |
|
2000 |
1,124.0 |
12.7 |
1,091.7 |
14.2 |
1,037.6 |
12.7 |
656.5 |
6.9 |
493.8 |
4.5 |
|
2001 |
1,084.1 |
13.2 |
1,070.5 |
14.3 |
1,035.1 |
13.1 |
668.3 |
7.8 |
479.8 |
4.3 |
|
2002 |
1,048.3 |
12.5 |
1,003.0 |
13.8 |
1,025.7 |
13.7 |
633.7 |
7.7 |
484.4 |
4.5 |
|
2003 |
980.0 |
12.5 |
944.6 |
13.6 |
969.2 |
13.9 |
616.2 |
7.9 |
482.7 |
4.6 |
|
2004 |
923.3 |
11.6 |
910.8 |
13.5 |
974.0 |
13.2 |
603.7 |
7.2 |
468.5 |
4.3 |
|
2005 |
874.1 |
11.6 |
991.5 |
14.1 |
1,015.0 |
12.9 |
616.2 |
8.2 |
474.4 |
4.8 |
|
2006 |
868.9 |
12.3 |
993.6 |
13.9 |
995.6 |
13.8 |
633.7 |
7.7 |
475.7 |
4.8 |
|
2007 |
831.8 |
11.1 |
989.3 |
13.7 |
896.6 |
11.4 |
635.6 |
8.6 |
467.6 |
4.9 |
|
2008 |
808.2 |
10.5 |
956.4 |
12.7 |
863.7 |
12.0 |
599.2 |
7.0 |
451.3 |
4.5 |
|
2009 |
748.9 |
9.2 |
877.8 |
11.4 |
805.4 |
10.8 |
563.5 |
6.6 |
425.8 |
4.1 |
|
2010 |
712.6 |
9.0 |
806.6 |
10.6 |
757.7 |
11.3 |
519.6 |
5.7 |
394.6 |
3.9 |
|
2011 |
702.3 |
8.8 |
819.6 |
10.7 |
773.1 |
11.7 |
498.5 |
6.0 |
367.7 |
3.5 |
|
2012 |
705.6 |
8.8 |
869.2 |
12.1 |
777.3 |
11.8 |
494.1 |
5.8 |
364.5 |
3.6 |
|
2013 |
672.1 |
7.5 |
831.1 |
10.7 |
739.5 |
11.0 |
462.9 |
5.6 |
346.2 |
3.6 |
|
2014 |
658.7 |
7.4 |
874.4 |
11.3 |
717.9 |
10.6 |
461.8 |
5.7 |
335.1 |
3.3 |
|
2015 |
687.1 |
8.1 |
836.0 |
12.5 |
708.2 |
10.9 |
471.0 |
6.2 |
337.9 |
3.7 |
|
2016 |
729.7 |
9.7 |
861.9 |
12.9 |
745.5 |
12.3 |
485.3 |
6.5 |
342.2 |
3.6 |
Source: Federal Bureau of Investigation, Crime in the United States, 1990-2016.
Notes: "Violent crime" includes homicide, rape, robbery, and aggravated assault. Violent crime rates for 1990-2012 include data using the "legacy" rape definition. See the text box on "UCR Offense Definitions" for more details.
Table B-3. Violent Crime Rates for the 50 Largest Cities in the United States, 1997-2006
Rate per 100,000 people
|
City |
1997 |
1998 |
1999 |
2000 |
2001 |
2002 |
2003 |
2004 |
2005 |
2006 |
|
Mesa, AZ |
728.5 |
661.8 |
578.5 |
603.7 |
613.6 |
684.9 |
537.4 |
561.8 |
504.0 |
453.3 |
|
Phoenix, AZ |
884.9 |
832.3 |
832.0 |
738.4 |
770.7 |
727.6 |
692.8 |
662.4 |
729.1 |
737.8 |
|
Tucson, AZ |
1,052.8 |
1,033.6 |
913.9 |
933.2 |
958.0 |
909.8 |
915.0 |
932.7 |
953.4 |
855.7 |
|
Fresno, CA |
1,205.0 |
1,052.2 |
992.2 |
898.6 |
940.3 |
852.6 |
779.1 |
765.6 |
845.8 |
757.4 |
|
Long Beach, CA |
944.5 |
859.7 |
744.9 |
696.8 |
726.0 |
757.8 |
749.7 |
780.8 |
708.5 |
715.1 |
|
Los Angeles, CA |
1,596.5 |
1,358.5 |
1,283.2 |
1,359.8 |
1,388.2 |
1,349.5 |
1,271.8 |
1,107.3 |
820.6 |
786.9 |
|
Oakland, CA |
2,184.5 |
1,862.0 |
1,550.0 |
1,261.1 |
1,309.9 |
1,366.9 |
1,379.1 |
1,276.8 |
1,420.8 |
1,905.3 |
|
Sacramento, CA |
968.2 |
877.6 |
752.0 |
765.8 |
798.2 |
840.6 |
777.6 |
1,050.0 |
1,151.2 |
1,206.4 |
|
San Diego, CA |
827.7 |
725.2 |
598.4 |
585.3 |
594.2 |
567.1 |
578.7 |
528.7 |
519.0 |
504.5 |
|
San Francisco, CA |
1,133.5 |
989.7 |
866.3 |
836.7 |
— |
752.4 |
741.5 |
757.1 |
798.9 |
875.6 |
|
San Jose, CA |
736.6 |
599.3 |
580.9 |
550.6 |
609.1 |
445.6 |
371.3 |
371.8 |
383.5 |
386.8 |
|
Colorado Springs, CO |
502.8 |
539.8 |
525.0 |
455.0 |
485.1 |
507.8 |
462.4 |
431.2 |
478.5 |
568.7 |
|
Denver, CO |
672.3 |
572.5 |
570.8 |
520.2 |
539.6 |
534.2 |
624.0 |
796.5 |
795.9 |
760.6 |
|
Washington, DC |
2,023.8 |
1,718.5 |
1,627.7 |
1,507.2 |
1,736.2 |
1,595.6 |
1,568.9 |
1,325.3 |
1,401.6 |
1,445.8 |
|
Jacksonville, FL |
1,343.3 |
1,153.6 |
1,034.2 |
1,115.7 |
979.0 |
915.6 |
866.7 |
825.9 |
829.9 |
837.2 |
|
Miami, FL |
2,812.4 |
2,548.6 |
2,105.0 |
2,173.1 |
1,938.9 |
1,906.9 |
1,875.3 |
1,677.4 |
1,579.7 |
1,509.4 |
|
Atlanta, GA |
3,048.5 |
3,047.3 |
2,729.5 |
2,781.2 |
2,534.0 |
2,289.1 |
1,969.6 |
1,841.8 |
1,674.8 |
1,553.7 |
|
Chicago, IL |
— |
— |
— |
— |
— |
— |
— |
— |
— |
— |
|
Indianapolis, IN |
2,077.2 |
1,135.2 |
1,016.2 |
862.1 |
930.5 |
935.0 |
883.2 |
882.7 |
993.1 |
960.0 |
|
Wichita, KS |
833.4 |
665.3 |
579.9 |
604.4 |
707.9 |
680.8 |
625.9 |
810.5 |
740.8 |
930.4 |
|
Louisville, KY |
1,112.2 |
942.9 |
862.9 |
795.8 |
743.0 |
785.1 |
521.5 |
525.1 |
624.6 |
612.8 |
|
New Orleans, LA |
1,720.3 |
1,461.9 |
1,273.2 |
1,063.6 |
1,213.5 |
937.1 |
967.3 |
948.3 |
— |
523.0 |
|
Baltimore, MD |
2,420.3 |
2,419.8 |
— |
2,457.6 |
2,239.5 |
2,054.9 |
1,735.0 |
1,839.4 |
1,754.5 |
1,696.5 |
|
Boston, MA |
1,420.8 |
1,327.1 |
1,302.1 |
1,242.8 |
1,243.5 |
1,166.2 |
1,216.2 |
1,192.4 |
1,317.7 |
1,339.5 |
|
Detroit, MI |
2,151.5 |
2,442.8 |
2,253.9 |
2,324.5 |
2,190.5 |
2,072.8 |
2,018.2 |
1,740.4 |
2,358.2 |
2,418.5 |
|
Minneapolis, MN |
1,850.1 |
1,525.4 |
1,388.7 |
1,151.0 |
1,060.4 |
1,056.1 |
1,193.1 |
1,256.1 |
1,702.2 |
1,698.4 |
|
Kansas City, MO |
1,895.5 |
1,867.6 |
1,749.1 |
1,626.3 |
1,593.9 |
1,352.4 |
1,379.3 |
1,443.8 |
1,459.2 |
1,443.7 |
|
Omaha, NE |
1,385.4 |
1,314.6 |
1,238.8 |
811.3 |
693.5 |
717.9 |
654.0 |
642.2 |
564.6 |
601.1 |
|
Las Vegas, NV |
— |
776.0 |
664.9 |
598.7 |
675.4 |
778.6 |
770.0 |
789.1 |
743.5 |
982.9 |
|
Albuquerque, NM |
1,317.1 |
1,316.9 |
1,250.7 |
1,144.9 |
1,165.8 |
1,068.7 |
947.0 |
985.2 |
951.8 |
908.3 |
|
New York, NY |
1,268.4 |
1,167.4 |
1,062.6 |
945.2 |
927.5 |
789.6 |
734.1 |
687.4 |
673.1 |
637.9 |
|
Charlotte, NC |
1,630.8 |
1,454.6 |
1,345.3 |
1,201.0 |
1,221.6 |
1,172.3 |
1,076.9 |
1,099.1 |
1,171.6 |
1,076.9 |
|
Raleigh, NC |
907.5 |
826.3 |
772.2 |
742.1 |
778.9 |
688.9 |
646.1 |
580.1 |
617.6 |
638.2 |
|
Columbus, OH |
933.5 |
816.8 |
854.6 |
843.0 |
897.4 |
908.0 |
855.9 |
813.7 |
849.3 |
813.6 |
|
Oklahoma City, OK |
1,073.0 |
995.6 |
859.3 |
780.6 |
824.2 |
822.3 |
889.8 |
822.9 |
853.5 |
802.4 |
|
Tulsa, OK |
1,204.3 |
1,131.4 |
1,162.1 |
1,122.3 |
1,153.7 |
1,086.3 |
1,092.6 |
1,204.7 |
1,292.7 |
1,248.2 |
|
Portland, OR |
1,604.4 |
1,372.1 |
1,236.6 |
1,076.9 |
848.3 |
828.5 |
813.5 |
741.8 |
713.9 |
714.2 |
|
Philadelphia, PA |
1,259.8 |
1,464.4 |
1,604.5 |
1,503.2 |
1,409.7 |
1,315.9 |
1,378.4 |
1,408.3 |
1,467.1 |
1,562.5 |
|
Memphis, TN |
1,856.7 |
1,498.9 |
1,410.5 |
1,479.2 |
1,658.3 |
1,572.4 |
1,577.1 |
1,546.8 |
1,861.2 |
1,991.3 |
|
Nashville, TN |
1,746.7 |
1,631.3 |
1,607.3 |
1,623.0 |
1,631.4 |
1,549.1 |
1,501.6 |
1,551.9 |
1,611.0 |
1,527.2 |
|
Arlington, TX |
797.4 |
607.6 |
627.5 |
647.8 |
625.2 |
633.1 |
524.2 |
524.4 |
648.4 |
731.2 |
|
Austin, TX |
645.7 |
540.6 |
497.9 |
471.9 |
473.6 |
467.1 |
462.1 |
525.1 |
489.6 |
515.3 |
|
Dallas, TX |
1,383.8 |
1,465.4 |
1,414.3 |
1,349.7 |
1,462.4 |
1,370.8 |
1,370.8 |
1,315.7 |
1,254.1 |
1,206.4 |
|
El Paso, TX |
791.3 |
700.4 |
686.0 |
779.9 |
760.9 |
661.1 |
597.2 |
545.9 |
435.5 |
393.5 |
|
Fort Worth, TX |
902.5 |
869.6 |
851.1 |
713.7 |
706.6 |
759.7 |
650.8 |
636.0 |
639.2 |
657.4 |
|
Houston, TX |
1,174.5 |
1,123.1 |
1,187.3 |
1,100.1 |
1,172.1 |
1,223.1 |
1,175.3 |
1,146.4 |
1,172.5 |
1,169.4 |
|
San Antonio, TX |
401.7 |
451.4 |
561.0 |
690.9 |
815.5 |
817.1 |
598.0 |
635.2 |
637.2 |
617.4 |
|
Virginia Beach, VA |
239.7 |
227.0 |
238.5 |
221.7 |
194.5 |
219.1 |
212.1 |
226.7 |
254.9 |
283.4 |
|
Seattle, WA |
914.1 |
831.6 |
767.3 |
769.1 |
725.1 |
705.4 |
684.4 |
659.6 |
709.4 |
711.2 |
|
Milwaukee, WI |
1,053.0 |
1,002.0 |
1,043.4 |
956.7 |
908.6 |
954.8 |
890.2 |
784.8 |
1,027.6 |
1,342.8 |
Source: Data taken from the Federal Bureau of Investigation's Uniform Crime Report (UCR) data tool.
Notes: Violent crime rates for 1997-2006 include data using the "legacy" rape definition. See the text box on "UCR Offense Definitions" for more details. During the period 1997-2006, the FBI did not report a violent crime total for Chicago because the data collection methodology for rape offenses did not comply with national UCR program guidelines. Violent crime rates for Las Vegas were calculated based on violent crimes and the population of the jurisdiction served by the Las Vegas Metropolitan Police Department, which includes the city of Las Vegas and other parts of Clark County, NV.
Table B-4. Violent Crime Rates for the 50 Largest Cities in the United States, 2007-2016
Rate per 100,000 people
|
City |
2007 |
2008 |
2009 |
2010 |
2011 |
2012 |
2013 |
2014 |
2015 |
2016 |
|
Mesa, AZ |
489.2 |
501.1 |
424.8 |
407.7 |
412.8 |
399.7 |
396.1 |
458.6 |
418.7 |
428.8 |
|
Phoenix, AZ |
723.7 |
659.9 |
546.5 |
553.5 |
551.7 |
636.7 |
631.9 |
571.9 |
593.8 |
674.4 |
|
Tucson, AZ |
784.1 |
803.9 |
649.7 |
640.4 |
652.2 |
724.5 |
640.9 |
652.9 |
655.5 |
795.4 |
|
Fresno, CA |
644.5 |
584.8 |
609.3 |
613.3 |
582.4 |
543.1 |
501.5 |
464.2 |
551.2 |
610.9 |
|
Long Beach, CA |
722.8 |
676.2 |
681.3 |
588.4 |
610.9 |
575.7 |
499.5 |
489.0 |
580.7 |
597.3 |
|
Los Angeles, CA |
718.4 |
689.5 |
625.4 |
566.5 |
522.4 |
481.1 |
426.0 |
490.7 |
634.8 |
719.0 |
|
Oakland, CA |
1,917.8 |
1,968.4 |
1,679.1 |
1,603.9 |
1,682.7 |
1,993.3 |
1,976.8 |
1,685.4 |
1,442.5 |
1,425.7 |
|
Sacramento, CA |
1,113.5 |
997.7 |
885.6 |
881.5 |
710.6 |
738.6 |
656.0 |
614.8 |
737.4 |
716.3 |
|
San Diego, CA |
502.1 |
475.5 |
451.1 |
429.6 |
387.6 |
413.1 |
393.0 |
380.9 |
398.6 |
377.2 |
|
San Francisco, CA |
874.1 |
845.0 |
735.7 |
713.7 |
659.6 |
704.2 |
847.1 |
795.1 |
776.8 |
710.6 |
|
San Jose, CA |
402.2 |
385.4 |
360.5 |
339.9 |
335.0 |
363.3 |
324.0 |
321.1 |
329.6 |
373.1 |
|
Colorado Springs, CO |
530.9 |
525.9 |
490.0 |
470.9 |
440.2 |
455.3 |
429.3 |
455.6 |
438.3 |
495.8 |
|
Denver, CO |
615.3 |
566.6 |
574.4 |
564.4 |
607.3 |
615.9 |
630.7 |
601.5 |
673.9 |
657.4 |
|
Washington, DC |
1,347.0 |
1,374.5 |
1,265.2 |
1,241.1 |
1,130.3 |
1,177.9 |
1,219.0 |
1,185.3 |
1,202.6 |
1,132.0 |
|
Jacksonville, FL |
1,021.6 |
996.4 |
836.0 |
664.4 |
621.0 |
617.3 |
620.3 |
683.7 |
648.3 |
625.1 |
|
Miami, FL |
1,491.5 |
1,334.7 |
1,188.7 |
1,221.4 |
1,197.6 |
1,172.0 |
1,181.9 |
1,060.0 |
1,021.3 |
887.5 |
|
Atlanta, GA |
1,623.8 |
1,388.9 |
1,150.1 |
1,368.8 |
1,432.8 |
1,379.0 |
1,223.0 |
1,227.4 |
1,119.6 |
1,083.6 |
|
Chicago, IL |
— |
— |
— |
— |
— |
— |
— |
910.7 |
903.8 |
1,105.5 |
|
Indianapolis, IN |
1,234.3 |
1,204.3 |
1,199.7 |
1,160.2 |
1,100.8 |
1,185.5 |
1,232.5 |
1,254.7 |
1,288.0 |
1,374.4 |
|
Wichita, KS |
946.4 |
854.1 |
885.4 |
794.5 |
766.6 |
742.5 |
794.1 |
758.5 |
984.8 |
1,056.7 |
|
Louisville, KY |
679.1 |
683.8 |
597.1 |
565.3 |
614.3 |
598.8 |
543.0 |
592.4 |
631.8 |
675.8 |
|
New Orleans, LA |
1,564.3 |
1,019.4 |
777.0 |
754.2 |
792.0 |
815.2 |
786.4 |
973.9 |
949.6 |
1,069.7 |
|
Baltimore, MD |
1,631.1 |
1,588.5 |
1,512.9 |
1,500.3 |
1,417.6 |
1,405.2 |
1,401.2 |
1,338.5 |
1,535.9 |
1,780.4 |
|
Boston, MA |
1,155.2 |
1,104.4 |
992.0 |
942.2 |
845.2 |
835.0 |
782.4 |
725.7 |
706.8 |
707.4 |
|
Detroit, MI |
2,287.0 |
1,985.2 |
1,991.8 |
2,377.9 |
2,137.4 |
2,122.9 |
2,071.9 |
1,989.5 |
1,759.6 |
2,046.5 |
|
Minneapolis, MN |
1,503.1 |
1,268.5 |
1,108.7 |
1,062.3 |
965.4 |
992.2 |
1,019.2 |
1,012.0 |
1,062.9 |
1,109.1 |
|
Kansas City, MO |
1,871.7 |
1,388.6 |
1,300.4 |
1,227.3 |
1,199.7 |
1,263.2 |
1,262.3 |
1,257.9 |
1,417.3 |
1,654.6 |
|
Omaha, NE |
597.0 |
605.6 |
533.4 |
556.0 |
559.6 |
594.5 |
576.1 |
560.6 |
515.0 |
567.3 |
|
Las Vegas, NV |
1,017.1 |
984.6 |
946.7 |
874.5 |
741.4 |
784.0 |
758.0 |
841.1 |
920.7 |
849.2 |
|
Albuquerque, NM |
990.0 |
894.5 |
769.3 |
786.1 |
762.2 |
749.7 |
774.9 |
882.8 |
965.8 |
1,112.1 |
|
New York, NY |
613.8 |
580.3 |
551.8 |
593.1 |
623.6 |
639.3 |
623.9 |
596.7 |
585.8 |
573.4 |
|
Charlotte, NC |
986.4 |
931.8 |
723.3 |
627.4 |
606.4 |
647.9 |
608.0 |
589.8 |
677.6 |
731.8 |
|
Raleigh, NC |
571.5 |
577.6 |
492.9 |
430.8 |
421.5 |
423.2 |
392.3 |
— |
— |
— |
|
Columbus, OH |
856.3 |
778.6 |
707.8 |
695.3 |
658.3 |
— |
544.6 |
558.5 |
546.3 |
521.7 |
|
Oklahoma City, OK |
850.6 |
977.5 |
930.3 |
914.5 |
871.4 |
919.1 |
826.1 |
773.8 |
765.6 |
783.4 |
|
Tulsa, OK |
1,193.3 |
1,285.3 |
1,116.0 |
1,098.2 |
999.7 |
990.0 |
970.1 |
805.1 |
903.6 |
1,095.3 |
|
Portland, OR |
687.7 |
622.9 |
553.6 |
522.6 |
514.8 |
517.2 |
482.8 |
472.8 |
— |
492.6 |
|
Philadelphia, PA |
1,475.4 |
1,441.3 |
1,238.2 |
1,214.6 |
1,193.3 |
1,160.1 |
1,099.3 |
1,021.4 |
1,029.0 |
988.9 |
|
Memphis, TN |
1,952.1 |
1,925.3 |
1,808.8 |
1,607.8 |
1,583.5 |
1,750.3 |
1,655.8 |
1,743.7 |
1,740.1 |
1,820.0 |
|
Nashville, TN |
1,508.9 |
1,389.1 |
1,140.5 |
1,124.3 |
1,181.3 |
1,216.0 |
1,048.8 |
1,125.4 |
1,101.0 |
1,102.3 |
|
Arlington, TX |
695.6 |
601.9 |
614.6 |
526.8 |
502.2 |
503.3 |
485.0 |
484.1 |
502.1 |
557.2 |
|
Austin, TX |
540.0 |
522.2 |
523.3 |
479.5 |
430.1 |
408.8 |
363.5 |
396.2 |
372.5 |
407.9 |
|
Dallas, TX |
1,069.2 |
894.8 |
792.2 |
764.8 |
681.1 |
675.0 |
663.7 |
664.7 |
694.2 |
762.4 |
|
El Paso, TX |
417.8 |
461.3 |
457.3 |
440.7 |
431.2 |
423.2 |
371.0 |
392.6 |
366.6 |
390.3 |
|
Fort Worth, TX |
667.5 |
659.7 |
586.8 |
580.3 |
603.7 |
587.6 |
562.7 |
558.1 |
525.4 |
526.3 |
|
Houston, TX |
1,132.2 |
1,106.8 |
1,125.6 |
1,071.3 |
974.6 |
992.5 |
962.7 |
991.4 |
966.7 |
1,026.4 |
|
San Antonio, TX |
556.4 |
717.8 |
570.9 |
635.4 |
519.3 |
503.1 |
630.7 |
539.3 |
587.2 |
717.6 |
|
Virginia Beach, VA |
248.7 |
239.5 |
205.4 |
189.7 |
175.1 |
169.4 |
163.8 |
147.9 |
138.3 |
154.5 |
|
Seattle, WA |
626.7 |
576.3 |
640.8 |
577.5 |
592.7 |
597.6 |
584.9 |
603.7 |
598.7 |
613.2 |
|
Milwaukee, WI |
1,406.3 |
1,229.6 |
1,101.6 |
1,065.2 |
999.1 |
1,294.5 |
1,363.8 |
1,484.7 |
1,596.1 |
1,533.0 |
Source: 2007-2014 data taken from the Federal Bureau of Investigation's Uniform Crime Report (UCR) data tool. 2015 and 2016 data taken from Crime in the United States for each respective year.
Notes: Violent crime rates for 2007-2012 include data using the "legacy" rape definition. See the text box on "UCR Offense Definitions" for more details. During the period 2007-2013, the FBI did not report a violent crime total for Chicago because the data collection methodology for rape offenses did not comply with national UCR program guidelines. Violent crime rates for Las Vegas were calculated based on violent crimes and the population of the jurisdiction served by the Las Vegas Metropolitan Police Department, which includes the city of Las Vegas and other parts of Clark County, NV.
Table B-5. Homicide Rates for the 50 Largest Cities in the United States, 1997-2006
Rate per 100,000 people
|
City |
1997 |
1998 |
1999 |
2000 |
2001 |
2002 |
2003 |
2004 |
2005 |
2006 |
|
Mesa, AZ |
3.7 |
3.0 |
2.4 |
3.8 |
4.1 |
5.2 |
3.2 |
4.9 |
6.4 |
5.7 |
|
Phoenix, AZ |
14.9 |
15.1 |
17.5 |
11.5 |
15.3 |
12.6 |
17.2 |
14.1 |
15.0 |
15.5 |
|
Tucson, AZ |
10.3 |
9.6 |
7.6 |
12.3 |
8.3 |
9.1 |
9.1 |
10.5 |
10.4 |
9.5 |
|
Fresno, CA |
15.1 |
8.9 |
6.4 |
5.6 |
9.2 |
9.5 |
8.2 |
11.6 |
10.6 |
11.2 |
|
Long Beach, CA |
12.6 |
8.8 |
10.5 |
10.6 |
10.4 |
14.0 |
10.3 |
10.0 |
8.8 |
8.6 |
|
Los Angeles, CA |
16.3 |
11.8 |
11.6 |
14.9 |
15.6 |
17.1 |
13.4 |
13.4 |
12.6 |
12.4 |
|
Oakland, CA |
26.3 |
19.1 |
16.2 |
20.0 |
20.6 |
26.1 |
26.8 |
20.6 |
23.2 |
36.4 |
|
Sacramento, CA |
10.7 |
8.1 |
13.2 |
9.6 |
9.6 |
11.1 |
9.8 |
11.1 |
11.4 |
12.4 |
|
San Diego, CA |
5.7 |
3.5 |
4.6 |
4.4 |
4.0 |
3.7 |
5.1 |
4.8 |
4.0 |
5.4 |
|
San Francisco, CA |
7.8 |
7.8 |
8.5 |
7.6 |
— |
8.4 |
8.9 |
11.6 |
12.8 |
11.5 |
|
San Jose, CA |
5.1 |
3.4 |
2.9 |
2.1 |
2.4 |
2.8 |
3.2 |
2.6 |
2.9 |
3.2 |
|
Colorado Springs, CO |
7.1 |
2.2 |
6.8 |
4.2 |
3.8 |
6.6 |
4.5 |
3.7 |
3.2 |
4.0 |
|
Denver, CO |
13.1 |
10.0 |
12.4 |
5.8 |
7.9 |
8.8 |
11.1 |
15.4 |
10.5 |
9.0 |
|
Washington, DC |
56.9 |
49.7 |
46.4 |
41.8 |
40.6 |
45.9 |
44.0 |
35.8 |
35.4 |
29.1 |
|
Jacksonville, FL |
10.7 |
10.5 |
11.8 |
10.7 |
9.9 |
11.7 |
11.8 |
13.1 |
11.4 |
13.8 |
|
Miami, FL |
25.0 |
23.1 |
16.9 |
18.2 |
17.7 |
17.1 |
19.4 |
17.9 |
13.9 |
19.6 |
|
Atlanta, GA |
35.6 |
36.0 |
34.8 |
32.2 |
33.8 |
34.9 |
34.3 |
25.8 |
20.9 |
22.6 |
|
Chicago, IL |
27.4 |
25.6 |
22.7 |
21.8 |
22.9 |
22.1 |
20.6 |
15.5 |
15.6 |
16.4 |
|
Indianapolis, IN |
31.2 |
18.8 |
14.9 |
12.1 |
14.0 |
13.9 |
13.1 |
13.6 |
13.5 |
17.5 |
|
Wichita, KS |
10.1 |
9.4 |
8.1 |
9.0 |
4.9 |
5.8 |
5.1 |
8.1 |
3.4 |
7.3 |
|
Louisville, KY |
22.4 |
14.9 |
14.4 |
15.2 |
9.7 |
13.5 |
6.7 |
10.6 |
8.8 |
8.0 |
|
New Orleans, LA |
54.7 |
48.8 |
33.9 |
42.1 |
44.0 |
53.1 |
57.7 |
56.0 |
— |
37.6 |
|
Baltimore, MD |
43.4 |
47.3 |
— |
40.1 |
38.7 |
37.7 |
41.9 |
43.5 |
42.0 |
43.3 |
|
Boston, MA |
7.7 |
6.1 |
5.6 |
6.6 |
11.0 |
10.1 |
6.6 |
10.5 |
12.9 |
13.3 |
|
Detroit, MI |
45.9 |
43.0 |
42.6 |
41.6 |
41.3 |
41.8 |
39.4 |
42.1 |
39.5 |
47.6 |
|
Minneapolis, MN |
15.9 |
16.0 |
13.2 |
13.1 |
11.1 |
12.0 |
12.1 |
14.1 |
12.5 |
15.2 |
|
Kansas City, MO |
22.1 |
29.0 |
26.4 |
25.6 |
23.2 |
18.5 |
18.4 |
19.9 |
28.1 |
25.0 |
|
Omaha, NE |
8.8 |
7.6 |
9.1 |
9.5 |
6.4 |
6.6 |
8.7 |
4.9 |
7.5 |
7.9 |
|
Las Vegas, NV |
— |
12.8 |
11.8 |
8.5 |
11.9 |
11.9 |
11.9 |
10.6 |
11.3 |
11.6 |
|
Albuquerque, NM |
11.4 |
8.8 |
11.4 |
7.4 |
7.5 |
11.1 |
10.9 |
8.6 |
10.8 |
6.8 |
|
New York, NY |
10.5 |
8.6 |
8.9 |
8.4 |
8.9 |
7.3 |
7.4 |
7.0 |
6.6 |
7.3 |
|
Charlotte, NC |
10.5 |
11.0 |
13.9 |
12.0 |
10.4 |
10.4 |
9.9 |
8.9 |
12.6 |
11.9 |
|
Raleigh, NC |
9.3 |
10.9 |
6.1 |
9.4 |
3.6 |
6.7 |
4.5 |
5.0 |
6.0 |
5.5 |
|
Columbus, OH |
13.1 |
11.8 |
10.5 |
9.4 |
11.4 |
11.3 |
15.0 |
10.7 |
14.1 |
11.6 |
|
Oklahoma City, OK |
12.5 |
12.1 |
11.8 |
7.5 |
8.9 |
7.4 |
9.4 |
7.4 |
10.2 |
10.3 |
|
Tulsa, OK |
10.5 |
9.8 |
10.7 |
8.4 |
8.6 |
6.5 |
15.5 |
12.3 |
15.0 |
13.7 |
|
Portland, OR |
9.7 |
5.3 |
6.9 |
3.6 |
3.9 |
3.7 |
5.0 |
5.3 |
3.7 |
3.7 |
|
Philadelphia, PA |
27.4 |
23.3 |
20.3 |
21.0 |
20.4 |
18.9 |
23.3 |
22.2 |
25.6 |
27.8 |
|
Memphis, TN |
21.6 |
19.0 |
19.3 |
22.6 |
24.1 |
22.5 |
19.3 |
16.4 |
20.3 |
21.9 |
|
Nashville, TN |
21.1 |
18.5 |
13.0 |
13.0 |
10.8 |
11.2 |
13.0 |
10.6 |
17.1 |
14.3 |
|
Arlington, TX |
4.0 |
4.2 |
3.5 |
4.2 |
4.4 |
4.0 |
2.5 |
3.9 |
6.6 |
3.8 |
|
Austin, TX |
7.3 |
5.7 |
3.7 |
4.9 |
3.9 |
3.6 |
4.0 |
3.8 |
3.8 |
2.8 |
|
Dallas, TX |
19.4 |
23.2 |
17.5 |
19.4 |
19.7 |
15.8 |
18.4 |
20.2 |
16.4 |
15.0 |
|
El Paso, TX |
3.9 |
2.7 |
2.2 |
3.5 |
3.5 |
2.4 |
3.6 |
1.9 |
2.3 |
2.1 |
|
Fort Worth, TX |
15.5 |
12.9 |
13.4 |
11.4 |
12.3 |
9.5 |
9.9 |
8.7 |
9.8 |
7.8 |
|
Houston, TX |
14.1 |
14.1 |
13.3 |
11.8 |
13.4 |
12.5 |
13.6 |
13.3 |
16.3 |
18.2 |
|
San Antonio, TX |
9.2 |
8.1 |
8.5 |
7.4 |
8.5 |
8.4 |
7.0 |
7.6 |
6.8 |
9.2 |
|
Virginia Beach, VA |
4.3 |
3.2 |
2.7 |
2.6 |
2.8 |
0.7 |
5.5 |
3.4 |
4.3 |
4.3 |
|
Seattle, WA |
9.0 |
9.1 |
8.3 |
6.4 |
4.4 |
4.5 |
5.6 |
4.2 |
4.3 |
5.1 |
|
Milwaukee, WI |
19.4 |
18.9 |
21.3 |
20.4 |
21.1 |
18.3 |
18.5 |
14.7 |
20.6 |
17.7 |
Source: Data taken from the Federal Bureau of Investigation's Uniform Crime Report (UCR) data tool.
Notes: Homicide rates for Las Vegas were calculated based on violent crimes and the population of the jurisdiction served by the Las Vegas Metropolitan Police Department, which includes the city of Las Vegas and other parts of Clark County, NV.
Table B-6. Homicide Rates for the 50 Largest Cities in the United States, 2007-2016
Rate per 100,000 people
|
City |
2007 |
2008 |
2009 |
2010 |
2011 |
2012 |
2013 |
2014 |
2015 |
2016 |
|
Mesa, AZ |
4.8 |
3.5 |
3.0 |
3.4 |
4.0 |
3.1 |
4.8 |
2.8 |
3.4 |
4.0 |
|
Phoenix, AZ |
13.8 |
10.5 |
7.6 |
8.0 |
7.9 |
8.3 |
7.9 |
7.5 |
7.2 |
9.2 |
|
Tucson, AZ |
9.4 |
12.3 |
6.4 |
9.8 |
9.7 |
8.1 |
8.9 |
6.6 |
5.9 |
5.6 |
|
Fresno, CA |
11.0 |
8.4 |
8.7 |
9.1 |
7.0 |
10.1 |
7.9 |
9.2 |
7.5 |
7.4 |
|
Long Beach, CA |
8.9 |
8.6 |
8.6 |
6.9 |
5.3 |
6.8 |
7.2 |
4.9 |
7.6 |
6.9 |
|
Los Angeles, CA |
10.2 |
10.0 |
8.1 |
7.7 |
7.7 |
7.8 |
6.5 |
6.7 |
7.1 |
7.3 |
|
Oakland, CA |
30.3 |
28.6 |
25.7 |
23.0 |
26.3 |
31.8 |
22.3 |
19.5 |
20.3 |
20.0 |
|
Sacramento, CA |
9.6 |
10.5 |
6.4 |
7.1 |
7.6 |
7.1 |
7.1 |
5.8 |
8.8 |
8.3 |
|
San Diego, CA |
4.7 |
4.3 |
3.1 |
2.2 |
2.9 |
3.5 |
2.9 |
2.3 |
2.6 |
3.5 |
|
San Francisco, CA |
13.6 |
12.3 |
5.6 |
6.0 |
6.1 |
8.4 |
5.8 |
5.3 |
6.1 |
6.5 |
|
San Jose, CA |
3.5 |
3.3 |
2.9 |
2.1 |
4.1 |
4.6 |
3.8 |
3.2 |
2.9 |
4.5 |
|
Colorado Springs, CO |
7.2 |
6.3 |
3.7 |
4.8 |
6.1 |
4.2 |
6.0 |
4.5 |
5.5 |
5.2 |
|
Denver, CO |
8.2 |
6.7 |
5.8 |
4.7 |
5.6 |
6.2 |
6.3 |
4.7 |
7.8 |
8.2 |
|
Washington, DC |
30.8 |
31.4 |
24.0 |
21.9 |
17.5 |
13.9 |
15.9 |
15.9 |
24.1 |
20.3 |
|
Jacksonville, FL |
15.4 |
14.3 |
12.2 |
9.7 |
8.5 |
11.1 |
11.0 |
11.2 |
11.2 |
12.0 |
|
Miami, FL |
19.0 |
14.7 |
14.1 |
17.0 |
16.8 |
16.7 |
17.0 |
19.2 |
17.1 |
12.2 |
|
Atlanta, GA |
25.9 |
19.7 |
14.5 |
22.1 |
20.7 |
19.0 |
18.4 |
20.5 |
20.2 |
23.5 |
|
Chicago, IL |
15.7 |
18.0 |
16.1 |
16.0 |
15.9 |
18.5 |
15.3 |
15.2 |
17.5 |
28.1 |
|
Indianapolis, IN |
14.3 |
14.1 |
12.2 |
11.1 |
11.5 |
11.6 |
15.2 |
15.8 |
17.1 |
17.1 |
|
Wichita, KS |
11.2 |
8.3 |
6.8 |
4.2 |
6.5 |
6.0 |
3.9 |
5.4 |
6.9 |
7.9 |
|
Louisville, KY |
11.4 |
11.3 |
9.8 |
7.9 |
7.2 |
9.3 |
7.2 |
8.3 |
11.9 |
17.4 |
|
New Orleans, LA |
94.7 |
63.6 |
51.7 |
50.9 |
57.6 |
53.2 |
41.4 |
38.7 |
41.7 |
43.8 |
|
Baltimore, MD |
45.2 |
36.9 |
37.3 |
35.9 |
31.4 |
34.9 |
37.4 |
33.8 |
55.4 |
51.4 |
|
Boston, MA |
11.0 |
10.3 |
8.0 |
11.8 |
10.1 |
9.0 |
6.1 |
8.1 |
5.7 |
7.3 |
|
Detroit, MI |
45.5 |
35.7 |
40.0 |
43.4 |
48.2 |
54.6 |
45.2 |
43.5 |
43.8 |
45.2 |
|
Minneapolis, MN |
12.7 |
9.8 |
4.7 |
9.7 |
8.3 |
10.0 |
9.1 |
7.7 |
11.4 |
8.4 |
|
Kansas City, MO |
20.1 |
25.5 |
20.6 |
22.2 |
23.4 |
22.6 |
21.3 |
16.9 |
23.0 |
27.0 |
|
Omaha, NE |
9.7 |
10.1 |
6.8 |
8.3 |
10.4 |
9.8 |
9.9 |
7.3 |
10.6 |
6.5 |
|
Las Vegas, NV |
8.9 |
8.9 |
8.1 |
7.4 |
5.6 |
5.1 |
6.5 |
8.0 |
8.1 |
9.9 |
|
Albuquerque, NM |
9.2 |
7.2 |
10.6 |
7.7 |
6.3 |
7.4 |
6.6 |
5.4 |
7.7 |
10.9 |
|
New York, NY |
6.0 |
6.3 |
5.6 |
6.6 |
6.3 |
5.1 |
4.0 |
3.9 |
4.1 |
3.9 |
|
Charlotte, NC |
10.4 |
10.9 |
7.5 |
7.8 |
7.1 |
6.4 |
7.0 |
5.5 |
6.9 |
7.5 |
|
Raleigh, NC |
6.3 |
8.7 |
3.4 |
3.5 |
4.2 |
4.0 |
2.8 |
— |
— |
— |
|
Columbus, OH |
10.7 |
13.3 |
10.8 |
12.1 |
11.0 |
— |
9.6 |
10.2 |
9.1 |
10.6 |
|
Oklahoma City, OK |
10.7 |
10.3 |
11.7 |
9.3 |
9.9 |
14.3 |
10.2 |
7.3 |
11.6 |
10.9 |
|
Tulsa, OK |
14.4 |
13.1 |
17.7 |
13.8 |
12.4 |
10.5 |
15.2 |
11.5 |
13.7 |
17.7 |
|
Portland, OR |
4.1 |
4.7 |
3.4 |
3.8 |
3.4 |
3.3 |
2.3 |
4.2 |
— |
2.2 |
|
Philadelphia, PA |
27.3 |
23.0 |
19.5 |
20.1 |
21.2 |
21.5 |
15.9 |
15.9 |
17.9 |
17.4 |
|
Memphis, TN |
19.6 |
20.5 |
19.8 |
13.8 |
17.9 |
20.2 |
19.0 |
21.2 |
20.5 |
29.9 |
|
Nashville, TN |
12.9 |
12.6 |
12.9 |
9.1 |
8.2 |
10.0 |
5.5 |
6.5 |
10.9 |
12.1 |
|
Arlington, TX |
3.5 |
6.1 |
3.2 |
4.4 |
5.9 |
4.5 |
4.8 |
3.4 |
2.1 |
5.3 |
|
Austin, TX |
4.2 |
3.1 |
2.9 |
4.8 |
3.5 |
3.7 |
3.0 |
3.5 |
2.5 |
4.1 |
|
Dallas, TX |
16.1 |
13.3 |
12.9 |
12.4 |
10.9 |
12.4 |
11.4 |
9.1 |
10.4 |
12.9 |
|
El Paso, TX |
2.8 |
2.8 |
1.9 |
0.8 |
2.4 |
3.4 |
1.5 |
3.1 |
2.5 |
2.5 |
|
Fort Worth, TX |
8.6 |
7.0 |
6.1 |
8.5 |
6.3 |
5.8 |
6.2 |
6.6 |
6.7 |
7.7 |
|
Houston, TX |
16.2 |
13.1 |
12.6 |
12.8 |
9.2 |
10.0 |
9.8 |
10.9 |
13.3 |
12.9 |
|
San Antonio, TX |
9.3 |
8.6 |
7.2 |
6.0 |
6.6 |
6.4 |
5.1 |
7.2 |
6.4 |
9.9 |
|
Virginia Beach, VA |
3.7 |
3.2 |
4.4 |
3.2 |
3.4 |
4.7 |
3.8 |
3.8 |
4.2 |
4.6 |
|
Seattle, WA |
4.1 |
4.8 |
3.7 |
3.1 |
3.2 |
3.7 |
2.8 |
3.9 |
3.4 |
2.7 |
|
Milwaukee, WI |
18.3 |
11.8 |
11.9 |
16.0 |
14.2 |
15.2 |
17.3 |
14.3 |
24.2 |
23.5 |
Source: 2007-2014 data taken from the Federal Bureau of Investigation's Uniform Crime Report (UCR) data tool. 2015 and 2016 data taken from Crime in the United States for each respective year.
Notes: Homicide rates for Las Vegas were calculated based on violent crimes and the population of the jurisdiction served by the Las Vegas Metropolitan Police Department, which includes the city of Las Vegas and other parts of Clark County, NV.
Author Contact Information
Footnotes
| 1. |
See, for example, Mark Berman, "Violent Crimes and Murders Increased in 2016 For a Second Consecutive Year, FBI Says." Washington Post, September 25, 2017; Timothy Williams, "Violent Crime in the U.S. Rises For the Second Consecutive Year," New York Times, September 25, 2017. |
| 2. |
Franklin E. Zimring, The Great American Crime Decline (New York: Oxford University Press, 2007). |
| 3. |
An overview of the UCR program, including critiques of the data, is provided in Appendix A. |
| 4. |
The UCR is widely considered to be the official measure of crime in the United States. UCR data published by the FBI lag by a year. The FBI traditionally releases annual UCR data in the fall of the following year (e.g., 2016 UCR data were released in September 2017). |
| 5. |
Tracey L Meares, "Crime Statistics Don't Show That the Sky Is Falling," New York Times, June 4, 2015 (updated). |
| 6. |
"Noise" can be defined as transient increases and decreases attributable to happenstance or short-run shocks. |
| 7. |
Matthew Friedman's blog post on recent violent crime trends provides an example of how the interval used (i.e., monthly, quarterly, or annually) can affect the visual presentation of homicide data and how this can influence the conclusions drawn from the data. Matthew Friedman, "Just Facts: America's Non-Existent 'Spike in Crime'," in a blog by the Brennan Center for Justice, August 10, 2015. |
| 8. |
In October 2006, the Police Executive Research Forum released a report warning about how "American law enforcement finds itself once again facing a tipping point in violence on its streets, and it is spreading from city to city. While the nation has understandably focused on homeland security, it must recognize that there is a gathering storm of violent crime that threatens to erode the considerable crime reductions of the past." This assessment was based on an increase in the violent crime rate from 2005 to 2006. The violent crime rate then decreased in seven of the eight following years. This report highlights the fact that sometimes short-term changes in violent crime rates do not foretell the end of a long-term trend. See Police Executive Research Forum, The Gathering Storm—Violent Crime in America, Washington, DC, October 2006. |
| 9. |
The analysis presented in this paragraph is based on data taken from Table 8 in the 2014 and 2015 editions of Crime in the United States and Table 6 of Crime in the United States, 2016. Data for 2014 for Tucson, AZ, Wichita, KS, and Ft. Worth, TX were taken from the FBI's UCR data tool. The data are on file with the author. |
| 10. |
Completed violent crime data for two of the largest 50 cities in the United States were not available for one or more years from 2014 to 2016. The FBI did not publish data on the number of homicides in Portland, OR in 2015 and the number of homicides in Raleigh, NC in 2015 and 2016. |
| 11. |
28 cities had an increase of 19,259 violent crimes from 2014 to 2015, while 19 cities had a decrease of 4,795 violent crimes from 2014 to 2015 (one city had no change). |
| 12. |
35 cities had an increase of 29,047 violent crimes from 2015 to 2016, while 13 cities had a decrease of 4,829 violent crimes from 2015 to 2016. |
| 13. |
34 cities had an increase of 767 homicides from 2014 to 2015, while 14 cities had a decrease of 82 homicides from 2014 to 2015. |
| 14. |
29 cities had an increase of 777 homicides from 2015 to 2016, while 15 cities had a decrease of 145 homicides from 2015 to 2016 (four cities had no change). |
| 15. |
See, for example, Richard Rosenfeld, "Changing Crime Rates," in Crime and Public Policy, ed. James Q. Wilson and Joan Petersilia, 2nd ed. (New York: Oxford University Press, 2011), pp. 559-588. |
| 16. |
The Ferguson Effect was named after the events in Ferguson, MO, where Michael Brown, an unarmed black teenager, was shot and killed by a white police officer. Michael Brown's death prompted a series of protests in the area that lasted several weeks. |
| 17. |
Richard Rosenfeld, Shytierra Gaston, and Howard Spivak, et al., Assessing and Responding to the Recent Homicide Rise in the United States, U.S. Department of Justice, Office of Justice Programs, National Institute of Justice, NCJ 251067, Washington, DC, November 2017. |
| 18. |
Rich Morin, Kim Parker, and Renee Stepler, et al., "Behind the Badge: Amid Protests and Calls for Reform, How Police View Their Jobs, Key Issues and Recent Fatal Encounters Between Blacks and Police," Pew Research Center, January 11, 2017, http://www.pewsocialtrends.org/2017/01/11/behind-the-badge/. |
| 19. |
According to the Bureau of Justice Statistics, in 2013 only 5.3 % of local police departments had 100 or more full time employees, https://www.bjs.gov/content/pub/pdf/lpd13ppp.pdf. |
| 20. |
According to the FBI, offenses are "cleared" by an arrest or by exceptional means, which includes the death of the offender, the victim's refusal to cooperate with the prosecution after the offender had been identified, or the denial or extradition because the offender is being prosecuted in another jurisdiction for another crime. |
| 21. |
"Violent crimes" included murder, rape, robbery, and aggravated assault. |
| 22. |
"Property crimes" included burglary, larceny, and motor vehicle theft. |
| 23. |
David C. Pyrooz, Scott H. Decker, and Scott E. Wolfe, et al., "Was There a Ferguson Effect on Crime Rates in Large U.S. Cities?" Journal of Criminal Justice, vol. 46 (2016), pp. 1-8. |
| 24. |
The total crime rate is the sum of violent and property crime rates. |
| 25. |
Ibid., pp. 5-6. |
| 26. |
John A. Sharback, David C. Pyrooz, and Scott E. Wolfe, et al., "De-Policing and Crime in the Wake of Ferguson: Racialized Changes in the Quantity and Quality of Policing Among Missouri Police Departments," Journal of Criminal Justice, vol. 50 (2017), pp. 42-52. |
| 27. |
Ibid., p. 50. |
| 28. |
Freddie Gray died in police custody after suffering a spinal cord injury while being transported in a Baltimore City Police Department van. His death sparked days of protests in Baltimore. Stephen L. Morgan and Joel A. Pally, Ferguson, Gray, and Davis: An Analysis of Recorded Crime Incidents and Arrests in Baltimore City, March 2010 through December 2015, Johns Hopkins University, Baltimore, MD, March 15, 2016, https://socweb.soc.jhu.edu/faculty/morgan/papers/MorganPally2016.pdf. |
| 29. |
Ibid., p. 46. |
| 30. |
Ibid., p. 68. |
| 31. |
Ibid. |
| 32. |
For more information on the JAG program, see CRS Report RS22416, Edward Byrne Memorial Justice Assistance Grant (JAG) Program: In Brief, by [author name scrubbed] (available upon request to CRS). |
| 33. |
See 34 U.S.C. §10156. |
| 34. |
Under 34 U.S.C. §10157(b), the Attorney General may reserve not more than 5% of the annual appropriation for the JAG program to be "granted to 1 or more States or units of local government, for 1 or more of the purposes specified in [34 U.S.C. § 10152], pursuant to his determination that the same is necessary—(1) to combat, address, or otherwise respond to precipitous or extraordinary increases in crime, or in a type or types of crime; or (2) to prevent, compensate for, or mitigate significant programmatic harm resulting from operation of the formula established under [34 U.S.C. §10156]." |
| 35. |
The COPS hiring program provides grants to help state, local, and tribal governments hire or re-hire career law enforcement officers to engage in community policing activities and enhance crime prevention efforts. For more information on the COPS program, see CRS Report RL33308, Community Oriented Policing Services (COPS): In Brief, by [author name scrubbed]. |
| 36. |
The Byrne Criminal Justice Innovation program is a place-based crime-prevention program that brings together law enforcement, government agencies, and service providers that use evidence-based strategies to address crime issues in a specific area. |
| 37. |
Project Safe Neighborhoods provides grants, training, and technical assistance to support interagency teams headed by the local United States Attorney's office. Grant funds can be used to hire additional prosecutors and research partners, support investigators, implement effective crime reduction strategies, deter juvenile gun crime, and develop and promote community outreach efforts. |
| 38. |
For more information on evidence-based policing strategies and crime prevention programs, see the Office of Justice Programs' website at https://www.crimesolutions.gov. |
| 39. |
U.S. Department of Justice, Public Safety Partnership Backgrounder, https://www.justice.gov/opa/press-release/file/974946/download. See also, Executive Order 13776, "Task Force on Crime Reduction and Public Safety," 82 Federal Register 10699-10700, February 14, 2017. |
| 40. |
National Partnership for Public Safety, https://www.nationalpublicsafetypartnership.org/#about. |
| 41. |
DOJ selected 12 cities to receive assistance under PSP: Birmingham, AL; Indianapolis, IN; Memphis, TN; Toledo, OH; Baton Rouge, LA; Buffalo, NY; Cincinnati, OH; Houston, TX; Jackson, TN; Kansas City, MO; Lansing, MI; and Springfield, IL. |
| 42. |
Ames Grawert, "The Justice Department Paints Violent Crime with Too Broad a Brush," in a blog by the Brennan Center for Justice, August 9, 2017. |
| 43. |
It was reported that the police chief of the Springfield (IL) Police Department was surprised to learn that the city's selection as a PSP site did not include any additional funding; Jason Nevel, "Springfield Among 12 Cities to Receive Federal Aid to Lower Crime," The State-Journal Register, June 21, 2017. |
| 44. |
A "clearance" is when a known offense is "solved" through either an arrest or through exceptional means. An offense is cleared through an arrest when at least one person is (1) arrested, (2) charged with the commission of the offense, and (3) turned over to the court for prosecution. In some cases, law enforcement cannot follow the three steps to clear an offense by arrest. In these cases, law enforcement might be able to clear an arrest through exceptional means. An offense is cleared through exceptional means when a law enforcement agency can answer all of the following questions in the affirmative: Has the investigation definitively established the identity of the offender? Is there enough information to support an arrest, charge, and turning over to the court for prosecution? Is the exact location of the offender known so that the subject could be taken into custody now? Is there some reason outside the law enforcement control that precludes arresting, charging, and prosecuting the offender? (UCR handbook, pp. 78-82.) |
| 45. |
In 2013 the FBI changed the definition of "rape" under the SRS. Prior to 2013, rape was considered to be "the carnal knowledge of a female forcibly and against her will." Since 2013, the FBI defines "rape" as "penetration, no matter how slight, of the vagina or anus with any body part or object, or oral penetration by a sex organ of another person, without the consent of the victim. Attempts or assaults to commit rape are also included; however, statutory rape and incest are excluded." The FBI reports data for rape using both the "legacy" and "revised" definitions. |
| 46. |
Law enforcement agencies that submit data to the FBI must apply the hierarchy rule when classifying and scoring data. The hierarchy rule states that when multiple Part I offenses occur in a single criminal incident, only the most serious offense is scored and reported to the FBI. As such, not all Part I offenses that come to the attention of law enforcement are reported to the FBI. |
| 47. |
Mississippi does not have a state UCR program. Participating law enforcement agencies in Mississippi submit their data directly to the FBI. The Ohio UCR program collects and submits data for law enforcement agencies that report data via the National Incident Based Reporting System. Law enforcement agencies in Ohio that submit summary UCR data submit their data directly to the FBI. U.S. Department of Justice, Federal Bureau of Investigation, State UCR Program Contacts, https://ucr.fbi.gov/state-ucr-program-contacts-1. |
| 48. |
U.S. Department of Justice, Federal Bureau of Investigation, Crime in the United States, 2016, About CUIS, https://ucr.fbi.gov/crime-in-the-u.s/2016/crime-in-the-u.s.-2016/resource-pages/about-cius. |
| 49. |
Ibid. |
| 50. |
This calculation is based on the Census Bureau's estimated population for the United States as of July 1, 2017 (325,719,178). |
| 51. |
Violent victimizations exclude homicides. Rachael E. Morgan, "Criminal Victimization, 2016," U.S. Department of Justice, Office of Justice Programs, Bureau of Justice Statistics, NCJ 251150, December, 2017, p. 1. |
| 52. |
Ibid., p. 7. |
| 53. |
Larry J. Siegel, Criminology (9th ed.) (Belmont, CA: Thompson and Wadsworth, 2006), p. 35; C.J. Mosher et al., The Mismeasure of Crime, p. 35. |
| 54. |
Ibid. |
| 55. |
Ibid. |
| 56. |
Classifying criminal offenses refers to the process of translating offense titles used in local and state criminal codes into the standard UCR definitions for Part I and Part II offenses. Scoring criminal offenses refers to counting the number of offenses after they have been classified. |
| 57. |
There are exceptions to the hierarchy rule. The hierarchy rule does not apply to cases of arson, which are always scored and reported to the FBI, even if other Part I offenses are committed during the incident. Another exception involves motor vehicle theft. If a motor vehicle is stolen and, by extension, the contents of the vehicle constitute a larceny-theft, only the motor vehicle theft is scored and reported to the FBI, even though larceny-theft ranks higher on the hierarchy of Part I offenses. The final exception to the hierarchy rule involves justifiable homicide. In cases of justifiable homicide, two offenses are scored and reported: one for the felonious offense connected with the offender and one for the justifiable homicide, which is reported as an unfounded murder/nonnegligent manslaughter. |
| 58. |
U.S. Department of Justice, Federal Bureau of Investigation, Summary Reporting System (SRS) User Manual, version 1.0, June 20, 2013, p. 24, https://ucr.fbi.gov/nibrs/summary-reporting-system-srs-user-manual. |
| 59. |
James P. Lynch and John P. Jarvis, "Missing Data and Imputation in the Uniform Crime Reports and the Effects on National Estimates," Journal of Contemporary Criminal Justice, vol. 24, no. 1 (February 2008), p. 76. |
| 60. |
Ibid., p. 77. |
| 61. |
Clayton J. Mosher, Terance D. Miethe, and Dretha M. Phillips, The Mismeasure of Crime (Thousand Oaks, CA: Sage Publications, 2002), p. 89. |
| 62. |
Ibid., p. 90. |