Analysis of the Elementary and Secondary Education Act Title I-A Allocation Formulas: Factors, Design Elements, and Allocation Patterns
The Elementary and Secondary Education Act (ESEA) is the primary source of federal aid to elementary and secondary education. The ESEA was last reauthorized by the Every Student Succeeds Act (ESSA; P.L. 114-95) in 2015. The Title I-A program has always been the largest grant program authorized under the ESEA. Title I-A grants provide supplementary educational and related services to low-achieving and other students attending elementary and secondary schools with relatively high concentrations of students from low-income families.
The U.S. Department of Education (ED) determines Title I-A grants to local educational agencies (LEAs) based on four separate funding formulas: Basic Grants, Concentration Grants, Targeted Grants, and Education Finance Incentive Grants (EFIG). The current four-formula strategy has evolved over time, beginning with the Basic Grant formula when the ESEA was originally enacted in 1965. The Concentration Grant formula was added in the 1970s in an attempt to provide additional funding for LEAs with concentrations of poverty. During consideration of ESEA reauthorization in the early 1990s, there was an attempt to replace the two existing formulas with a new formula that would target Title I-A funds more effectively to areas with concentrations of poverty. Both the House and the Senate developed formulas intended to accomplish this goal (Targeted Grants and EFIG, respectively). A compromise on a single new formula was not reached; nor was there agreement on eliminating the existing formulas. As a result, funds are allocated through four formulas under current law.
Title I-A grant amounts are primarily driven by the number of “formula children”—principally children from low-income families—in an LEA, although all four formulas also include an expenditure factor based on education expenditures, minimum grant provisions, and hold harmless provisions. Since the initial enactment of Title I-A in 1965, the formula(s) have been criticized for being more favorable to more densely populated and typically urban areas due to how children from low-income families are counted, and for being more favorable to wealthier states due to the inclusion of factors based on education expenditures.
This report analyzes issues related to three of the major debates surrounding the Title I-A formulas: (1) the effect of different formula factors and provisions on grant amounts, (2) whether the formulas are more favorable to certain types of LEAs and states, and (3) how effectively the Title I-A formulas target funds on concentrations of poverty. The report is intended to complement CRS Report R44898, History of the ESEA Title I-A Formulas, which provides a detailed examination of the history of the Title I-A formulas and of the underlying tensions in the policy debates about the design of the formulas from enactment of the original ESEA through enactment of the ESSA. Some of the themes highlighted in this report are as follows.
All four Title I-A formulas include both formula child counts and state average per pupil expenditures (APPE) as factors used to determine LEA grant amounts. Based on regression analysis, formula child counts are estimated to explain 95% of the variance in overall LEA grant amounts, while APPE is estimated to explain less than 1% of it. A similar pattern is found for each of the individual formulas, with formula child counts estimated to explain between 90% and 98% of the variance in grant amounts under each formula.
The state minimum grant and LEA hold harmless provisions that are included in each of the four formulas provide a relatively large increase in overall grant amounts and grant amounts per formula child to the states and LEAs benefitting from these provisions, but result in a relatively small decrease in the Title I-A grant amounts of other states and LEAs.
There has been an ongoing debate about whether the Title I-A formulas are more favorable to densely or less densely populated areas. This debate has centered on the relative emphasis that should be placed on the percentage of formula children versus the count of formula children in an LEA. Under current law, the debate is reflected in the two formula child weighting scales used in the determination of grants under the Targeted Grant and EFIG formulas. An LEA’s grant is calculated using whichever weighting scale is more favorable. Both formulas were introduced to enhance targeting toward concentrations of low-income students and both apply weights based on the number of formula children served by LEAs or the percentage of an LEA’s students that formula children comprise. The percentage weighting scale (intended to be more favorable to less densely populated areas) applies larger weights than the numbers weighting scale (intended to be more favorable to densely populated areas). This has the appearance of being advantageous to less densely populated areas. However, because the top category in each weighting scale is open-ended, LEAs with large numbers of formula children are often able to apply the highest weights in the scale to larger proportions of formula children. As a result, in general, LEAs whose weighted formula child counts are calculated using the numbers scale receive a higher grant per formula child than LEAs whose grants are calculated using the percentage scale.
The expenditure factor used in the Title I-A formulas to account for differences in cost of living has changed over time. Historical changes that have placed bounds on the extent to which variation across states’ APPE can influence allocations have resulted in the expenditure factor being more closely tied to national APPE. These changes have generally benefitted states with a state APPE that is less than the national APPE and not benefitted states with a state APPE that exceeds the national APPE. When changes to the expenditure factor that would loosen or remove bounds are examined, such changes typically allow it to vary more closely with state APPE and would favor states with relatively high APPEs and be disadvantageous to those with relatively low APPEs. Current expenditure factors allow for some consideration of variation across states’ APPE in allocations but also limit the effect of variation on allocations.
Since its initial enactment, the Title I-A program has been intended to address the effects that concentrations of low-income families have on the ability of LEAs to provide “adequate” educational programs. While there are clearly some concerns about whether having a high number or high percentage of formula children should result in larger LEA grants per formula child, there has also been a broader debate about how much to target Title I-A funds on areas with concentrations of poverty and how best to do so. While Title I-A funds currently reach LEAs with varying concentrations of formula children, a proxy measure for concentrations of poverty, the targeting of Title I-A funds on the basis of higher concentrations of formula children has increased over time (measured by either numbers or percentage of such children in LEAs) . The addition of Concentration Grants, Targeted Grants, and EFIG to Title I-A did, to some extent, improve the targeting of funds to LEAs in this manner. Among the four Title I-A formulas, the newest formulas (Targeted Grants and EFIG), which are allocating growing shares of Title I-A funds in recent years, appear to be most effective at targeting funds toward higher concentrations of poverty.
Analysis of the Elementary and Secondary Education Act Title I-A Allocation Formulas: Factors, Design Elements, and Allocation Patterns
Jump to Main Text of Report
Contents
- Introduction
- Historical Overview of the Title I-A Formulas
- Title I-A Formula Factors and Selected Design Elements Under Current Law
- Formula Child Counts and the Expenditure, Equity, and Effort Factors
- State Minimum Grant and LEA Hold Harmless Provisions
- Title I-A Allocation Patterns
- Formula Child Counts and Rates: Densely Populated Versus Less Densely Populated Areas
- State Expenditures on Public Education: High-Spending States Versus Low-Spending States
- Targeting Title I-A Funds on Concentrations of Poverty
- Effectiveness of the Different Title I-A Formulas at Targeting
- Effect of State Minimum Grant and Hold Harmless Provisions on Targeting
Figures
- Figure 1. Title I-A Formulas: Years in Which Appropriations Were Authorized and Appropriations Were Provided, FY1965 to FY2017
- Figure 2. LEA Formula Child Counts, Expenditure Factors, Equity Factors, and Effort Factors Compared to Total FY2016 Title I-A Grant Amounts
- Figure 3. Estimated FY2016 Title I-A State Grants Per Formula Child Using Different Expenditure Factors in Select States
- Figure 4. Targeting of FY2016 Title I-A Funds to LEAs Based on Formula Child Rates Under Current Law, Assuming All Funds Are Allocated Via Basic Grants, and Assuming All Funds Are Allocated Via Basic Grants and Concentration Grants
- Figure 5. Targeting of FY2016 Title I-A Funds to LEAs Under Current Law Based on Formula Child Rates for Each of the Title I-A Formulas
- Figure 6. Title I-A Appropriations by Formula, FY1980 through FY2017
- Figure 7. Targeting of FY2016 Title I-A Funds to LEAs Based on Formula Child Rates Under Current Law, and Assuming No Hold Harmless and/or Minimum Grant Provisions Are Applied
Tables
- Table 1. Effect of the State Minimum Grant and LEA Hold Harmless Provisions On Title I-A Grant Amounts, FY2016
- Table 2. Weights Applied to Formula Child Counts in the Calculation of ESEA Title I-A Targeted Grants
- Table 3. ESEA Title I-A Grant Amount Per Formula Child for LEAs Using the Numbers-Based Weighting Scale and Percentage-Based Weighting Scale, FY2016
- Table A-1. Estimated FY2016 Title I-A Grants to States Assuming No State Minimum Grant Provisions Are Applied and/or Assuming No LEA Hold Harmless Provisions Are Applied
- Table A-2. Estimated FY2016 Grants to LEAs Under Title I-A Assuming No Hold Harmless Provisions Are Applied: 10 LEAs with the Largest Estimated Losses
- Table A-3. Estimated FY2016 Grants to LEAs Under Title I-A Assuming No Hold Harmless Provisions Are Applied: 10 LEAs with the Largest Estimated Gains
- Table A-4. Estimated FY2016 Grants to LEAs Under Title I-A Assuming No State Minimum Grant Provisions Are Applied: 10 LEAs with the Largest Estimated Losses
- Table A-5. Estimated FY2016 Grants to LEAs Under Title I-A Assuming No State Minimum Grant Provisions Are Applied: 10 LEAs with the Largest Estimated Gains
- Table A-6. Estimated FY2016 Title I-A Grants to States Assuming the Expenditure Factor Was Calculated (1) Under Current Law, (2) as 50% of State APPE, and (3) as 50% of the Greater of State or National APPE
- Table A-7. Estimated FY2016 Title I-A Grants to States Assuming the Expenditure Factor Was Calculated (1) Under Current Law, (2) Assuming All Funds Are Allocated via Basic Grants Only, and (3) Assuming All Funds Are Allocated via Basic Grants and Concentration Grants Only
- Table B-1. Targeting of FY2016 Title I-A Funds to LEAs Under Current Law Based on Formula Child Counts for Each of the Title I-A Formulas
- Table C-1. Title I-A Appropriations, FY1980 through FY2017
- Table C-2. Title I-A Appropriations by Formula, FY1980 through FY2017
- Table D-1. Variance in Title I-A Grants to LEAs Explained by Each Formula Factor Included in the Basic Grant, Concentration Grant, and Targeted Grant Formulas
- Table D-2. Variance in Title I-A State Grant Amounts Explained by Each Formula Factor Included in the Education Finance Incentive Grant (EFIG) Formula
Summary
The Elementary and Secondary Education Act (ESEA) is the primary source of federal aid to elementary and secondary education. The ESEA was last reauthorized by the Every Student Succeeds Act (ESSA; P.L. 114-95) in 2015. The Title I-A program has always been the largest grant program authorized under the ESEA. Title I-A grants provide supplementary educational and related services to low-achieving and other students attending elementary and secondary schools with relatively high concentrations of students from low-income families.
The U.S. Department of Education (ED) determines Title I-A grants to local educational agencies (LEAs) based on four separate funding formulas: Basic Grants, Concentration Grants, Targeted Grants, and Education Finance Incentive Grants (EFIG). The current four-formula strategy has evolved over time, beginning with the Basic Grant formula when the ESEA was originally enacted in 1965. The Concentration Grant formula was added in the 1970s in an attempt to provide additional funding for LEAs with concentrations of poverty. During consideration of ESEA reauthorization in the early 1990s, there was an attempt to replace the two existing formulas with a new formula that would target Title I-A funds more effectively to areas with concentrations of poverty. Both the House and the Senate developed formulas intended to accomplish this goal (Targeted Grants and EFIG, respectively). A compromise on a single new formula was not reached; nor was there agreement on eliminating the existing formulas. As a result, funds are allocated through four formulas under current law.
Title I-A grant amounts are primarily driven by the number of "formula children"—principally children from low-income families—in an LEA, although all four formulas also include an expenditure factor based on education expenditures, minimum grant provisions, and hold harmless provisions. Since the initial enactment of Title I-A in 1965, the formula(s) have been criticized for being more favorable to more densely populated and typically urban areas due to how children from low-income families are counted, and for being more favorable to wealthier states due to the inclusion of factors based on education expenditures.
This report analyzes issues related to three of the major debates surrounding the Title I-A formulas: (1) the effect of different formula factors and provisions on grant amounts, (2) whether the formulas are more favorable to certain types of LEAs and states, and (3) how effectively the Title I-A formulas target funds on concentrations of poverty. The report is intended to complement CRS Report R44898, History of the ESEA Title I-A Formulas, which provides a detailed examination of the history of the Title I-A formulas and of the underlying tensions in the policy debates about the design of the formulas from enactment of the original ESEA through enactment of the ESSA. Some of the themes highlighted in this report are as follows.
- All four Title I-A formulas include both formula child counts and state average per pupil expenditures (APPE) as factors used to determine LEA grant amounts. Based on regression analysis, formula child counts are estimated to explain 95% of the variance in overall LEA grant amounts, while APPE is estimated to explain less than 1% of it. A similar pattern is found for each of the individual formulas, with formula child counts estimated to explain between 90% and 98% of the variance in grant amounts under each formula.
- The state minimum grant and LEA hold harmless provisions that are included in each of the four formulas provide a relatively large increase in overall grant amounts and grant amounts per formula child to the states and LEAs benefitting from these provisions, but result in a relatively small decrease in the Title I-A grant amounts of other states and LEAs.
- There has been an ongoing debate about whether the Title I-A formulas are more favorable to densely or less densely populated areas. This debate has centered on the relative emphasis that should be placed on the percentage of formula children versus the count of formula children in an LEA. Under current law, the debate is reflected in the two formula child weighting scales used in the determination of grants under the Targeted Grant and EFIG formulas. An LEA's grant is calculated using whichever weighting scale is more favorable. Both formulas were introduced to enhance targeting toward concentrations of low-income students and both apply weights based on the number of formula children served by LEAs or the percentage of an LEA's students that formula children comprise. The percentage weighting scale (intended to be more favorable to less densely populated areas) applies larger weights than the numbers weighting scale (intended to be more favorable to densely populated areas). This has the appearance of being advantageous to less densely populated areas. However, because the top category in each weighting scale is open-ended, LEAs with large numbers of formula children are often able to apply the highest weights in the scale to larger proportions of formula children. As a result, in general, LEAs whose weighted formula child counts are calculated using the numbers scale receive a higher grant per formula child than LEAs whose grants are calculated using the percentage scale.
- The expenditure factor used in the Title I-A formulas to account for differences in cost of living has changed over time. Historical changes that have placed bounds on the extent to which variation across states' APPE can influence allocations have resulted in the expenditure factor being more closely tied to national APPE. These changes have generally benefitted states with a state APPE that is less than the national APPE and not benefitted states with a state APPE that exceeds the national APPE. When changes to the expenditure factor that would loosen or remove bounds are examined, such changes typically allow it to vary more closely with state APPE and would favor states with relatively high APPEs and be disadvantageous to those with relatively low APPEs. Current expenditure factors allow for some consideration of variation across states' APPE in allocations but also limit the effect of variation on allocations.
- Since its initial enactment, the Title I-A program has been intended to address the effects that concentrations of low-income families have on the ability of LEAs to provide "adequate" educational programs. While there are clearly some concerns about whether having a high number or high percentage of formula children should result in larger LEA grants per formula child, there has also been a broader debate about how much to target Title I-A funds on areas with concentrations of poverty and how best to do so. While Title I-A funds currently reach LEAs with varying concentrations of formula children, a proxy measure for concentrations of poverty, the targeting of Title I-A funds on the basis of higher concentrations of formula children has increased over time (measured by either numbers or percentage of such children in LEAs) . The addition of Concentration Grants, Targeted Grants, and EFIG to Title I-A did, to some extent, improve the targeting of funds to LEAs in this manner. Among the four Title I-A formulas, the newest formulas (Targeted Grants and EFIG), which are allocating growing shares of Title I-A funds in recent years, appear to be most effective at targeting funds toward higher concentrations of poverty.
Introduction
The Elementary and Secondary Education Act (ESEA) is the primary source of federal aid to elementary and secondary education. The ESEA was last reauthorized by the Every Student Succeeds Act (ESSA; P.L. 114-95) in 2015.1 The Title I-A program has always been the largest grant program authorized under the ESEA and is funded at $15.5 billion for FY2017. Since its enactment in 1965, Title I-A has provided assistance to meet the special needs of educationally disadvantaged children. Title I-A grants provide supplementary educational and related services to low-achieving and other students attending elementary and secondary schools with relatively high concentrations of students from low-income families. In recent years, Title I-A has also become a vehicle to which a number of requirements affecting broad aspects of public elementary and secondary education for all students have been attached as conditions for receiving Title I-A grants.
The U.S. Department of Education (ED) determines Title I-A grants to local educational agencies (LEAs) based on four separate funding formulas: Basic Grants, Concentration Grants, Targeted Grants, and Education Finance Incentive Grants (EFIG). The Title I-A formulas have somewhat distinct allocation patterns, providing varying shares of funds to different types of LEAs or states (e.g., LEAs with high poverty rates or states with comparatively equal levels of spending per pupil among their LEAs).2 The Basic Grant formula is the original Title I-A formula, and has received appropriations each year since FY1966. The Basic Grant formula is the primary vehicle for providing Title I-A funds: it is the formula under which the largest share of funds are allocated (42% of FY2017 appropriations) and under which the largest proportion of LEAs receive funds. Over time, the Concentration Grant, Targeted Grant, and EFIG formulas have been added to Title I-A to provide additional funds to areas with high numbers or percentages of children from low-income families. As the share of Title I-A funds allocated under these three additional formulas has grown, Title I-A grants have become increasingly targeted on areas with concentrations of poverty.
Title I-A grant amounts are primarily driven by the number of children from low-income families in an LEA, although all four formulas also include an expenditure factor based on education expenditures, minimum state grant provisions, and LEA hold harmless provisions.3 Thus, while almost any change to the Title I-A formulas has an effect on grant amounts, changes to the counts of children included in the formulas generally have the largest effect on grant amounts.
This report analyzes issues related to three of the major debates surrounding the Title I-A formulas: (1) the effect of different formula factors and provisions on grant amounts, (2) whether the formulas are more favorable to certain types of LEAs and states, and (3) how effectively the Title I-A formulas target funds on concentrations of poverty. The report is intended to complement CRS Report R44898, History of the ESEA Title I-A Formulas, which provides a detailed examination of the history of the Title I-A formulas and of the underlying tensions in the policy debates about the design of the formulas from enactment of the original ESEA through enactment of the ESSA. This report does not provide a detailed discussion of how the Title I-A formulas operate. For a discussion of how Title I-A funds are allocated under each of the four formulas under current law, see CRS Report R44461, Allocation of Funds Under Title I-A of the Elementary and Secondary Education Act, by [author name scrubbed] and [author name scrubbed].
This report begins with a brief overview of the history of the Title I-A formulas. The next section is an examination of the role of the formula factors and other elements included in the design of the formulas that are used to determine grant amounts. This is followed by an analysis of the Title I-A allocation patterns, and then a discussion of the targeting of Title I-A funds. The report concludes with several appendices that provide additional data to support the analyses it discusses. Appendix A examines FY2016 Title I-A state grant amounts and state grants per child included in the formulas. Appendix B provides supplemental analysis of the extent to which grants are targeted based on concentrations of poverty. Appendix C provides historical appropriations data for the Title I-A formulas dating back to FY1980. Appendix D presents more information on an analysis of the effect of different formula factors on Title I-A grant amounts.
Historical Overview of the Title I-A Formulas
Since the program's inception, Title I-A funds have been intended to serve poor children in both public and private schools. Congress initially accomplished this by allocating Title I-A funds through one formula—Basic Grants. The original Basic Grant formula was based on (1) the number of children from low-income families (commonly referred to as formula children)4 and (2) each state's average per pupil expenditures (APPE) for public elementary and secondary education.5
Over time, Congress added three additional formulas that essentially provide supplemental funding to LEAs that serve areas with concentrations of poverty. The Concentration Grant formula was added in the 1970s in an attempt to provide additional funding for LEAs with concentrations of poverty. During the consideration of ESEA reauthorization in the early 1990s, the House and the Senate proposed formulas (Targeted Grants and EFIG, respectively) intended to target concentrations of poverty more effectively by providing more funding per child to LEAs with higher numbers or percentages of formula children. As both of these formulas were enacted into law, and the Basic Grant and Concentration Grant formulas were retained, funds are allocated through four formulas under current law. Title I-A has also periodically included a Special Incentive Grant formula, intended to incentivize state and local education spending on elementary and secondary education. This formula was last funded in FY1975.6
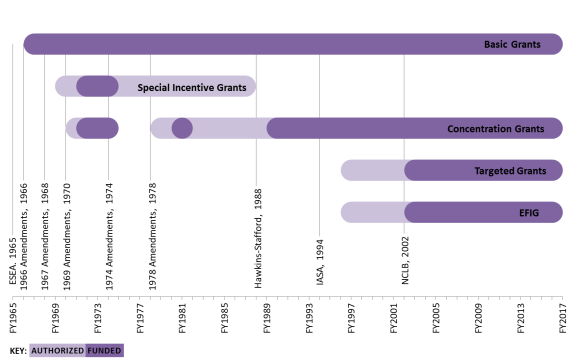
Figure 1 shows the years in which the four formulas were authorized and funded. The figure also indicates the ESEA reauthorizations that made substantial changes to them. In some instances, formulas have been funded every year they have been authorized to receive appropriations, as well as in years in which the authorization of appropriations has expired (e.g., Basic Grants).7 In other instances, formulas were not funded until a subsequent reauthorization made substantial changes to the originally enacted formulas (e.g., EFIG).
|
Figure 1. Title I-A Formulas: Years in Which Appropriations Were Authorized and Appropriations Were Provided, FY1965 to FY2017 |
 |
|
Source: Figure prepared by the Congressional Research Service (CRS) based on CRS analysis of the Elementary and Secondary Education Act (ESEA) and appropriations laws. Notes: The figure indicates reauthorizations of the ESEA that made substantial changes to the Title I-A formulas. The ESEA originally authorized Special Incentive Grants for FY1967; however, this authorization was repealed in the 1966 amendments and thus is not included in the figure. Additionally, from FY1970 through FY1975 the ESEA included a Special Grant program similar in purpose and scope to the Concentration Grant program. Thus, for the purposes of this figure, Special Grants are considered to be the same program as Concentration Grants. While the Every Student Succeeds Act (ESSA; P.L. 114-95) most recently comprehensively amended the ESEA in 2015, it did not make substantial changes to the Title I-A formulas. In some cases, formulas were authorized but not funded until a subsequent reauthorization made substantial changes to the originally enacted formulas. For example, the figure shows that Targeted Grants and Education Finance Incentive Grants (EFIG) were initially authorized in FY1996; however, no funds were appropriated for these formulas until FY2002, after the No Child Left Behind Act of 2001 (NCLB) made changes to the formulas. |
Since FY1966, every formula under the program has included some type of population factor and expenditure factor. Over the years, the children included in the determination of the population factor (referred to as formula children) have changed. The expenditure factors have been altered as well. Changes in both areas have substantial implications for state and LEA grant amounts. In addition, while continuing to focus on the targeting of Title I-A dollars on areas with the greatest concentrations of poverty, Congress has periodically taken steps to help provide smaller states with additional funding to run Title I-A programs through state minimum grant provisions. Congress has also modified the Title I-A allocation formulas over time to include hold harmless provisions to prevent LEAs from losing more than a certain amount of funding from year-to-year, provided appropriations are sufficient to make hold harmless payments.
Title I-A Formula Factors and Selected Design Elements Under Current Law
Under each formula, Title I-A grants are initially calculated by multiplying a formula child count by an expenditure factor. Because these are the two preeminent formula factors used to determine grants across the Title I-A formulas, they are the primary focus of the ensuing examination of the role different formula factors play in determining allocation levels. Other factors also based on expenditures per student—the equity and effort factors, which are used in one of the allocation formulas—are discussed as well.
As previously discussed, formula child counts consist primarily of estimated numbers of school-age children in poor families,8 and expenditure factors are based on state APPE.9 The EFIG formula also includes two additional measures of state and local funding: an effort factor that is based on a state's education spending relative to personal income, and an equity factor based on the variation in education spending among LEAs within a state.
|
Key Title I-A Formula Terms Formula child count: Based on the number of children ages 5-17: (1) in poor families; (2) in institutions for neglected or delinquent children or in foster homes; and (3) in families receiving Temporary Assistance for Needy Families (TANF) payments above the poverty income level for a family of four. Formula child rate: Percentage of children ages 5-17 residing in a given LEA who are formula children. It is calculated by dividing the number of formula children in an LEA by the number of children ages 5-17 who reside in the LEA. Expenditure factor: State average expenditures per pupil (APPE) for public elementary and secondary education, subject to a minimum of 80% and maximum of 120% of the national average per pupil expenditure, further multiplied by 0.40 for Basic Grants, Concentration Grants, and Targeted Grants. For EFIG grants, state APPE for public elementary and secondary education is subject to a minimum of 85% and maximum of 115% of the national average per pupil expenditure. Effort factor: Calculated based on average per pupil expenditures for public elementary and secondary education as a share of personal income per capita for each state compared to a comparable calculation for the nation as a whole. Equity factor: Determined based on variations in average per pupil expenditures among the LEAs in a given state. |
Under three of the Title I-A allocation formulas—Basic Grants, Concentration Grants, and Targeted Grants—funds are initially calculated at the LEA level. State grants are the total of grant allocations for all LEAs in the state, adjusted for state minimum grant provisions.10 Under EFIG, grants are first calculated for each state overall and then state funds are subsequently suballocated to LEAs within the state using a different formula.
In addition, two of the preeminent design elements in each of the Title I-A allocation formulas, state minimum grant and LEA hold harmless provisions, are the primary focus of the ensuing examination of the role selected formula design elements play in determining allocation levels. They have been chosen for analysis because they are core elements in the design of the formulas, and they are known to have a sizable effect on allocations to certain states and LEAs.
In each of the formulas, after initial grant awards are calculated through multiplying a formula child count by at least one expenditure factor, grant amounts are reduced to equal the level of available appropriations for each formula, taking into account a variety of state and LEA minimum grant and hold harmless provisions. LEAs must also have a minimum number and/or percentage of formula children to be eligible to receive a grant under a specific formula. While these thresholds are important elements in the design of the allocation formulas, this section does not examine their effects on allocations.11
This section begins by examining the role of separate formula factors in determining Title I-A grant amounts. It then examines the role of the LEA hold harmless and state minimum grant provisions.
Formula Child Counts and the Expenditure, Equity, and Effort Factors
While there have been numerous debates about the inclusion of and changes to different formula factors and provisions,12 CRS analyses (some of which are presented here) generally suggest that Title I-A grant amounts are primarily driven by formula child counts. The initial estimates of the effects of formula factors discussed here are based on regression analyses presented in Appendix D.13
One way regression analysis can be used to illuminate the extent to which various formula factors contribute to grant calculations is by examining how much variance in grant amounts is "explained" by each formula factor (Table D-1 and Table D-2).14 With respect to formula child counts and APPE, formula child counts are estimated to explain 95% of the variance in overall LEA grant amounts, while APPE is estimated to explain less than 1% of it. A similar pattern is found for each of the individual formulas, with formula child counts estimated to explain between 90% and 98% of the variance in grant amounts in independent examinations of each of the formulas. For the EFIG formula, which is initially calculated, formula child counts are estimated to explain over 97% of the variance in state grants made under the EFIG formula. The other factors (APPE, equity, and effort) account for less than 4% of the variance in the EFIG grant amounts. This again suggests that formula child counts are the primary driver of Title I-A grant amounts.15
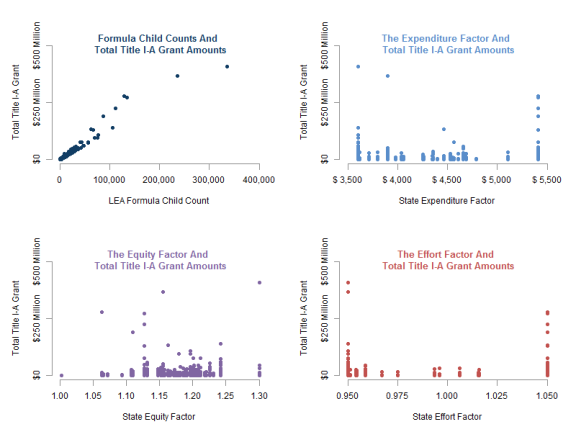
The relationship between the formula factors and Title I-A grant amounts is further examined in Figure 2. More specifically, Figure 2 shows each LEA's formula child count, expenditure factor, equity factor, and effort factor compared to its overall Title I-A grant amount. LEAs with higher formula child counts generally have higher grant amounts. Conversely, there are numerous LEAs with the same expenditure factor (as expenditure factors vary by state, not LEA), but the Title I-A grant amounts for LEAs with the same expenditure factor can range substantially. Similarly, many LEAs have the same effort and equity factors, which are also calculated at the state (not LEA) level, but grant amounts for LEAs with the same effort or equity factor can also range greatly. That is, with respect to the expenditure, equity, and effort factors, there is not a consistent relationship between the value of the factor and an LEA's grant amount.
It would be expected that formula child counts play the dominant role in allocations given that the primary aim of Title I-A is to provide support to schools serving high concentrations of low-income students. From a formula design standpoint, one reason that formula child counts are the primary driver of Title I-A grant amounts may be that once grant eligibility threshold level requirements are met, the counts are not bounded (i.e., there are no minimums or maximums placed on formula child counts in the determination of Title I-A grants). They can be substantially different from LEA to LEA. Formula child counts vary at the LEA level, not the state level.
The expenditure, equity, and effort factors, on the other hand, are all calculated at the state level so they are the same for all LEAs in a state. In addition, a state's expenditure and effort factors are bounded, limiting the range in which they may vary. And, while there are no bounds placed on the equity factor, it is calculated in such a way that it does not vary much from state to state.16
As a result, formula child counts range from no formula children to over 350,000 formula children while expenditure factors range from approximately $3,600 to $5,400, equity factors range from about 1.0 to 1.3, and effort factors range from 0.95 to 1.05 (Figure 2). Additionally, formula child counts are a factor in all four formulas while the equity and effort factors are only included in the EFIG formula, which limits their impact on overall LEA grant amounts.
Because formula child counts are the dominant factor in grant determinations, in the aggregate states and LEAs with large numbers of formula children will generally get more funding under the formulas. Additionally, while the current formulas do somewhat benefit states with higher expenditure, effort, and equity factors, an increase in the number of formula children in an LEA will likely have a larger effect on grant amounts than an increase in state and local spending on education. However, it should be noted that almost any formula factor change will cause a shift in Title I-A grant amounts. The size of the shift will depend on which factor changes and by how much.
As will be discussed next, other design elements of the formulas also have an effect on grant allocations. These effects can be quite substantial for some states and LEAs.
State Minimum Grant and LEA Hold Harmless Provisions
Under current law, all of the Title I-A formulas include both state minimum grant provisions and LEA hold harmless provisions. State minimum grant provisions increase the amount of funding provided to small states to enable them to operate more robust Title I-A programs. State minimum grant provisions are funded by reducing the amount of funding provided to all the other states in order to support the smaller states. LEA hold harmless provisions prevent LEAs from losing more than a certain percentage of funding from year-to-year to provide some stability in grant amounts, provided appropriations are sufficient to make hold harmless payments.17 As with the state minimum grant provisions, however, LEAs that receive grants in excess of their hold harmless amounts have their grant amounts reduced to provide other LEAs with a hold harmless grant amount. State minimum grant and LEA hold harmless provisions have also been included in formulas to mitigate losses to states and LEAs that may result from changes in the Title I-A formulas.18
The minimum grant and hold harmless provisions provide a relatively large increase in overall grant amounts and grant amounts per formula child to the states and LEAs receiving them but cause a relatively small decrease in the Title I-A grant amounts of other states and LEAs. To estimate the effect of these provisions, CRS compared Title I-A grant amounts and grant amounts per formula child with and without them.
Table 1 provides summary statistics on the effect of the state minimum grant and LEA hold harmless provisions on overall Title I-A grant amounts. The estimated grant amounts for all states and the LEAs that would gain and lose the most funds when these provisions are removed are included in Appendix A.
While approximately 1 in 10 LEAs are in states benefitting from the state minimum grant provisions, removing these provisions shifts less than 1% of Title I-A funds. That is, an estimated 11% of LEAs (1,456) are in states that receive a minimum grant under at least one of the four Title I-A formulas. If the minimum grant provisions were removed, an estimated 1,281 of these LEAs would see a decrease in their Title I-A grant amounts.19 The total decrease in funds for these LEAs would be an estimated $64.7 million, which is 0.44% of total Title I-A grant amounts. This indicates that state minimum grant provisions have a relatively small effect on overall Title I-A grant amounts. However, the LEAs that would lose funds when these provisions are removed would see an estimated average decrease of $51,000, or 15.03%. The losses for an individual LEA would range from approximately $10 to $4.3 million, while the average grant per formula child is estimated to decrease by about $210. It is also worth noting that while 11% of LEAs benefit from the state minimum grant provisions, less than 3% of all formula children (305,801) reside within these LEAs.
Over half of all LEAs receiving Title I-A funds benefit from the hold harmless provisions, but removing these provisions is estimated to shift less than 2% of funds. More specifically, an estimated 64% of LEAs (8,327), within which approximately one-third (4.2 million) of all formula children reside, received a hold harmless amount in FY2016. If the hold harmless provisions were removed, 4,317 of these LEAs are estimated to see a decrease in their Title I-A grant amounts, averaging $66,000, or 17.43%, per LEA.20 However, losses for an individual LEA would range from less than $10 to $19.1 million, while the average grant per formula child is estimated to decrease by about $60. The total decrease in funds for these LEAs would be an estimated $283.8 million, which is 1.92% of overall Title I-A funds. This indicates that while a large percentage of LEAs benefit from the hold harmless provisions, they have a relatively small effect on overall Title I-A grant amounts.
If both the state minimum grant and LEA hold harmless provisions were removed, 5,000 of the 8,749 LEAs benefitting from either or both of these provisions would see a decrease in their grant amounts. These LEAs would see an estimated average decrease of $73,000, or 20.98%, of funding per LEA. Losses for an individual LEA would range from less than $10 to $16.0 million, while the average grant per formula child is estimated to decrease by about $70. The total decrease in funds for these LEAs would be an estimated $366.7 million, which is 2.49% of total grant amounts. This indicates that while the elimination of both state minimum grant provisions and LEA hold harmless provisions is estimated to have a relatively small effect on overall Title I-A grant allocations, the effect on locales that would lose funds without them could be substantial.
Table 1. Effect of the State Minimum Grant and LEA Hold Harmless Provisions On Title I-A Grant Amounts, FY2016
|
Effect of Removing Provision(s) for LEAs that Previously Benefitted from Provision(s) |
||||||||||
|
Provision from Which an LEA Benefits |
Count of LEAs Benefitting from the Provision |
Count of Formula Children in LEAs Benefitting from the Provision |
Average Grant Per Formula Child in LEAs Benefitting from This Provision (national average grant per formula child = $1,300) |
Count of LEAs That Would Lose Funds |
Range of Losses in LEA Grant Amounts |
Average Decrease in LEA Grant Amounts |
Average Percentage Decrease in LEA Grant Amounts |
Average Grant Per Formula Child Without Provision(s) |
Total LEA Losses of LEAs That Benefit from the Provision(s) |
Total Share of Title I-A Funds Lost by LEAs That Benefit from the Provision(s) |
|
State Minimum Grant |
1,456 |
305,801 |
$1,750 |
1,281 |
$10 to $4,277,000 |
$51,000 |
15.03% |
$1,540 |
$64,742,000 |
0.44% |
|
LEA Hold Harmless |
8,327 |
4,195,768 |
$1,270 |
4,317 |
Less than $10 to $19,100,000 |
$66,000 |
17.43% |
$1,210 |
$283,830,000 |
1.92% |
|
State Minimum Grant, LEA Hold Harmless, or Both |
8,749 |
4,347,180 |
$1,290 |
5,000 |
Less than $10 to $16,000,000 |
$73,000 |
20.98% |
$1,220 |
$366,654,000 |
2.49% |
Source: Table prepared by the Congressional Research Service (CRS) based on unpublished data from the U.S. Department of Education (ED), Budget Service.
Notes: Percentages were calculated based on unrounded values. In estimating grants, CRS is only able to estimate grants based on the LEAs for which ED calculates Title I-A grants. These are all LEAs included in the Small Area Income and Poverty Estimates (SAIPE) dataset maintained by the U.S. Census Bureau. SAIPE does not include data on all LEAs. For example, it does not include data on independent charter school LEAs. There are a total of 13,093 LEAs estimated to receive funds in the SAIPE data. Approximately 11.4 million formula children reside in these LEAs. LEAs receiving a hold harmless under at least one of the Title I-A formulas were counted as benefitting from the hold harmless provisions under current law. LEAs in states receiving minimum grant amounts were counted as benefitting from the state minimum grant provisions under current law. LEAs not receiving Title I-A funds under current law were not included in this analysis. For estimated state grant amounts as well as estimated grant amounts for the LEAs losing and gaining the most funds as a result of the removal of the hold harmless and minimum grant provisions, see Appendix A.
Although state minimum grant and LEA hold harmless provisions have a relatively small effect on overall grant allocations, they can have a more pronounced effect on grants per formula child. The estimated average national grant per formula child is $1,300. Under current law, LEAs in states receiving a minimum grant amount have above average grants per formula child. LEAs benefitting from the state minimum grant provisions receive, on average, an estimated $450 more per formula child ($1,750 compared to $1,300 for all LEAs). On the other hand, LEAs receiving hold harmless provisions (but not in states receiving a minimum grant) receive, on average, an estimated $30 less per formula child ($1,270 compared to $1,300 for all LEAs).21 LEAs in states receiving the minimum grant provision, receiving a hold harmless provision, or both receive, on average, an estimated $10 less per formula child ($1,290 compared to $1,300 for all LEAs).
Removing the state minimum grant provision, the hold harmless provision, or both, however, would reduce estimated per formula grant amounts for LEAs that benefit from one or both of the provisions. For LEAs in states that currently receive the minimum grant amount, it is estimated that average grants per formula child would be reduced by $210 with the removal of the provision. Average grants per formula child in these LEAs would still be $240 over the $1,300 per formula child for all LEAs as these LEAs could benefit from the hold harmless provisions, partially mitigating their losses from the removal of the state minimum grant provisions. If the hold harmless provisions were removed, estimated average grants per formula child in LEAs that receive the benefit under current law are estimated to be reduced by $60 to $1,210. If both provisions were removed, estimated average grants per formula child in LEAs that are currently in states receiving a state minimum grant, receiving an LEA hold harmless, or both are estimated to fall by $70 to $1,220.
There is a similar pattern at the state level with respect to the state minimum grant provisions.22 For example, for FY2016 Wyoming (which receives a minimum grant under all four formulas) is estimated to have the highest grant per formula child under current law ($2,650). If the minimum grant provisions were removed, Wyoming's estimated grant per formula child would decrease to $2,030. If the minimum grant and hold harmless provisions were removed, Wyoming's estimated grant per formula child would decrease to $1,410.23
It is worth noting that the effect of the hold harmless provisions depends on the appropriations level for Title I-A. Because an LEA's hold harmless level is based on its prior-year Title I-A grant amount and not the Title I-A appropriations level for the current fiscal year, the hold harmless provisions will have a larger effect on grant amounts in years where the Title I-A appropriations level decreases.
Title I-A Allocation Patterns
Since the initial enactment of Title I-A in 1965, the formulas have been criticized for being more favorable to more densely populated and typically urban areas due to how formula child counts are calculated, and for being more favorable to wealthier states due to the inclusion of factors based on education expenditures.24 To address these concerns, Congress has made changes to formula child counts and the expenditure factor over time. With these tensions in mind, this section of the report examines Title I-A allocation patterns to LEAs and states and discusses how these patterns have changed over time.
Formula Child Counts and Rates: Densely Populated Versus Less Densely Populated Areas
There has been an ongoing debate about whether the Title I-A formulas are more favorable to densely populated or less densely populated areas. For example, changes made to the count of children in families receiving Aid to Families with Dependent Children (AFDC) used in the determination of the number of formula children in the 1970s were a direct response to this debate. When AFDC children were first included in formula child counts in 1965, they were counted in full. During the 1970s, the inclusion of eligible AFDC children in formula child counts was viewed as favoring urban areas, resulting in changes to the Title I-A formulas to include only two-thirds of the actual number of eligible AFDC children in the formula child counts.25 This new approach was subsequently viewed as being unfavorable to urban areas, so the formula was changed once again to include the full count of eligible AFDC children.26
A debate over the relative emphasis that should be placed on the percentage versus the count of formula children in an LEA has also been consistently present and continues to exist regarding the current law formulas. Under current law, the debate is reflected in two formula child weighting scales used in the determination of grants under the Targeted Grant and EFIG formulas, the newer Title I-A formulas that were introduced to enhance targeting to LEAs serving concentrations of low-income students. These scales have not been changed since the Targeted Grant and EFIG formulas were first funded in FY2002.27 One scale is based on formula child rates (determined by dividing an LEA's number of formula children by the number of children ages 5-17 residing in the LEA); the other is based on formula child counts. The weights under both scales are applied in a stepwise manner, rather than the highest relevant weight being applied to all formula children in the LEA. More specifically, there are five sets of weights that apply to an LEA's formula child count and the LEA's percentage of formula children. These weights correspond to five ranges of formula child counts and five ranges of formula child rates.28 The ranges and associated weights under the Targeted Grant formula are shown in Table 2.
Table 2. Weights Applied to Formula Child Counts in the Calculation of ESEA Title I-A Targeted Grants
|
A. Weights Based on LEA Numbers of Formula Children (Number Weighting) |
|
|
Population Range |
Weight Applied to Formula Children in This Range |
|
0-691 |
1.0 |
|
692-2,262 |
1.5 |
|
2,263-7,851 |
2.0 |
|
7,852-35,514 |
2.5 |
|
35,515 or more |
3.0 |
|
B. Weights Based on LEA Formula Children as a Percentage of Total School-Age Population (Percentage Weighting) |
|
|
Population Range |
Weight Applied to Formula Children in This Range |
|
0%-15.58% |
1.0 |
|
15.58%-22.11% |
1.75 |
|
22.11%-30.16% |
2.5 |
|
30.16%-38.24% |
3.25 |
|
Above 38.24% |
4.0 |
Source: Table prepared by the Congressional Research Service (CRS), based on CRS analysis of current law.
Notes: The population ranges are based on the actual distribution of Title I-A formula children among the nation's LEAs according to the latest available data in 2001, which is when the No Child Left Behind Act (NCLB; P.L. 107-110) was being considered. Each range includes roughly 20% of all formula children included in the determination of FY2001 Title I-A grants. For example, 20% of all formula children lived in LEAs that had 0-691 formula children. Similarly, 20% of all formula children lived in LEAs in which up to 15.58% of all children ages 5-17 were formula children.
The smallest weight is applied to formula children falling within the first range; a larger weight is applied to all remaining formula children falling within the second range, and so on. Two weighted formula child counts are calculated, one based on numbers and the other on percentages of formula children. The larger of the two weighted formula child counts is then used to determine grant amounts.
For example, assume an LEA has 2,000 formula children and the total school-age population is 10,000; the formula child rate is 20%. The following calculations demonstrate how an LEA's weighted child count would be calculated under number weighting and percentage weighting in this example:29
Numbers Scale:
Step 1: 691 * 1.0 = 691
The first 691 formula children are weighted at 1.0.
Step 2: (2,000 - 691) = 1,309 * 1.5 = 1,963
For an LEA with a total number of formula children falling within the second step of the numbers scale, the number of formula children above 691 (the maximum for the first step) is weighted at 1.5.
Total (Numbers Scale) = 691 + 1,963.5 = 2,654.5
The weighted formula child counts from Steps 1 and 2 are combined.
Percentage Scale:
Step 1: 15.58% * 10,000 = 1,558 * 1.0 = 1,558
The number of formula children constituting up to 15.58% of the LEA's total school-age population is weighted at 1.0.
Step 2: (20% - 15.58%) = 4.42% * 10,000 = 442 * 1.75 = 773.5
For an LEA with a formula child rate falling within the second step of the percentage scale, the number of formula children above 15.58% of the LEA's total school-age population (the maximum for the first step) is weighted at 1.75.
Total (Percentage Scale) = 1,558 + 773.5 = 2,331.5
The weighted formula child counts from Steps 1 and 2 are combined. Because the numbers scale weighted count of 2,654.5 exceeds the percentage scale weighted count of 2,331.5, the numbers scale count would be used as the population factor for this LEA in the calculation of its Title I-A grant.
Based on the statutorily specified weights used in determining weighted child counts, the weighting process might seem to favor less densely populated LEAs; however, in actuality it can often be more beneficial to more heavily populated LEAs. That is, under current law higher weights are applied to the LEAs with the highest formula child rates than are applied to the LEAs with the highest formula child counts (Table 2). Thus, at first glance the weighting process would appear to favor LEAs with higher formula child rates (often rural LEAs) over LEAs with higher numbers of formula children (typically urban LEAs); however, it often does not.
As shown above, the top category in each weighting scale is open-ended. Because of this, LEAs with large numbers of formula children are often able to apply the highest weights to larger proportions of their formula children than smaller LEAs with relatively high percentages of formula children can.
As intended, the weights result in higher grants per formula child to LEAs with high numbers of formula children, high percentages of formula children, or both. However, LEAs with high numbers of formula children generally receive more per formula child than LEAs with high percentages of such children. The effect of the weighting scales on grants per formula child is illustrated in Table 3 below.
Table 3 shows the estimated FY2016 Title I-A grants per formula child by weighting scale. Of the LEAs receiving a Title I-A grant that did not receive a hold harmless grant and were not located in a state receiving a minimum state grant amount, 82.2% had their Targeted Grant and EFIG amounts determined based on the percentage weighting scale. Thus, the majority of the LEAs included in the analysis have a higher weighted formula child count based on the percentage weighting scale versus the number weighting scale. However, in general, LEAs whose weighted formula child counts are calculated using the numbers scale received a higher grant per formula child than LEAs whose weighted formula child counts are calculated using the percentage scale. More specifically, LEAs using the numbers weighting scale to determine their formula child counts had an estimated average grant per formula child of $1,340 in FY2016, while LEAs using the percentage weighting scale had an estimated average grant per formula child of $1,220.
Table 3. ESEA Title I-A Grant Amount Per Formula Child for LEAs Using the Numbers-Based Weighting Scale and Percentage-Based Weighting Scale, FY2016
|
LEAs |
Number of LEAs |
Average Unweighted Formula Child Count |
Average Formula Child Rate |
Average Grant Per Formula Child |
|
LEAs using the numbers weighting scale |
750 |
6,580 |
21.55% |
$1,340 |
|
LEAs using the percentage weighting scale |
3,474 |
601 |
25.56% |
$1,220 |
Source: Table prepared by the Congressional Research Service (CRS) based on unpublished data provided by the U.S. Department of Education (ED), Budget Service.
Notes: Estimated grant per Title I-A formula child amounts have been rounded to the nearest $10. The average grant per formula child was calculated by dividing the total grant amount for LEAs in each category by the total number of formula children in each category. LEAs that received a hold harmless amount or that benefitted from the state minimum grant provisions in FY2016 were not included in this analysis. Additionally, LEAs with formula child counts and rates that did not reach the second range on the numbers-based or the percentage-based scales (and thus received a weight of one for all of the formula children on both scales) were not included in this analysis.
State Expenditures on Public Education: High-Spending States Versus Low-Spending States
Every Title I-A formula includes a factor that accounts for how much money states spend on public elementary and secondary education. From the start, proponents of including an expenditure factor argued that it was needed to compensate states where the cost of educating a child was higher.30 The expenditure factor was also intended to compensate states with a higher cost of living.31 Opponents argued that including an expenditure factor disproportionately benefitted wealthy states and counties.32 In part, the debate also focused on whether Title I-A funds should be spread broadly across the country or concentrated in the areas of greatest need.33 Additionally, it pitted the higher-spending states that argued their costs of education and living were higher against the lower-spending states that argued they could not afford to spend more on education and therefore needed more Title I-A funding.34 For the first two years of the Title I-A program, the expenditure factor was calculated as a percentage of state APPE.35 In the late 1960s, Congress added a minimum to the expenditure factor, which increased the expenditure factor used in grant determinations for low-spending states. More specifically, if a state's APPE was less than the national average then that state could use national APPE to determine its expenditure factor. In the mid-1970s, Congress put an upper bound on the expenditure factor, which reduced the expenditure factor used in grant determinations for high-spending states, and lowered the expenditure factor minimum. State APPE was subject to a minimum of 80% and a maximum of 120% of the national APPE. If a state's APPE was less than 80% of the national APPE, the state's APPE was automatically raised to 80% of the national APPE; if a state's APPE was more than 120% of the national APPE, the state's APPE was automatically reduced to 120% of the national APPE. The expenditure factor added in the mid-1970s is still used under current law to calculate grants.36
In addition to the debate over the bounds placed on the expenditure factor, there has been debate over the use of APPE as a measure of spending for public elementary and secondary education. In 1994, Congress created two additional Title I-A formulas (Targeted Grant and EFIG) that were intended to target Title I-A funds more effectively on LEAs with concentrations of poverty. When the EFIG formula was initially enacted, it did not include the same expenditure factor used in the other three formulas. Rather, the EFIG formula included two new factors to account for state spending on public education: an effort factor and an equity factor. The effort factor is based on a state's education spending relative to personal income, essentially considering the share of available resources a state is dedicating to public elementary and secondary education. The equity factor is based on variation in education spending among LEAs within a state. The more equitable spending is among LEAs in a given state, the higher a state's grant will be.37 These factors were included in the formulas due to concerns about disparities in funds and resources among LEAs in many states and to provide an incentive for states to reduce those disparities.38 The new EFIG formula was enacted in tandem with the new Targeted Grant formula, which included the same expenditure factor that was being used in the determination of Basic Grants and Concentration Grants. However, concerns were raised that the new EFIG formula compromise disadvantaged the southern states (traditionally lower-spending states).39 In addition, prior to funding of the Targeted Grant and EFIG formulas in FY2002, the EFIG formula was changed to include an expenditure factor similar to that used in the other three formulas. Thus, the EFIG formula incorporates state spending on public elementary and secondary education in three ways, while the other three formulas account for it only through an expenditure factor.
While overall consideration of APPE in the formulas is more beneficial to higher-spending states than to lower-spending states, some of this benefit has been mitigated over time. Lower-spending states have generally benefitted from the changes to the expenditure factor over time. Adding upper and lower bounds to the expenditure factor effectively provided a beneficial adjustment to lower-spending states given that it raised their expenditure factor for purposes of grant determinations and capped the amount of spending that could be considered for higher-spending states (which meant that higher-spending states could not benefit from any spending in excess of the upper bound).
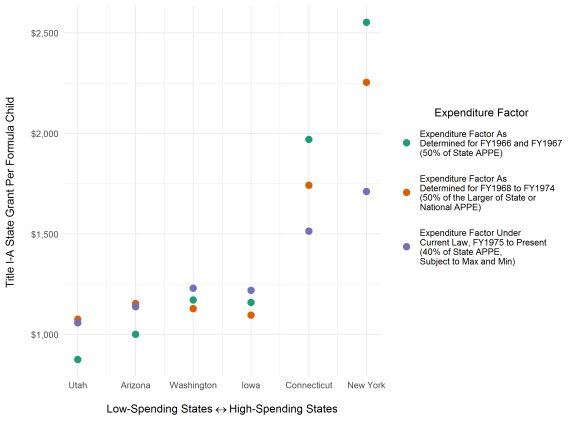
Figure 3 shows the estimated FY2016 Title I-A state grants per formula child for select states assuming the expenditure factor was calculated (1) as 50% of state APPE; (2) as 50% of the larger of state or national APPE; and (3) as 40% of state APPE, subject to a minimum and maximum. These expenditure factors correspond to (1) the expenditure factor that was originally included in the Title I-A formulas, (2) the expenditure factor used to determine Title I-A grants for FY1968 through FY1974, and (3) the expenditure factor under current law. The states included in Figure 3 are (1) the two states with the lowest state APPE that are not receiving minimum grants (Arizona and Utah); (2) the two states with state APPE closest to the median state APPE that are not receiving minimum grants (Iowa and Washington); and (3) the two states with the highest state APPE that are not receiving minimum grants (Connecticut and New York). The grant per formula child is the lowest for lower-spending states (Utah and Arizona) when the expenditure factor is unbounded, as it was for FY1966 and FY1967. In states where the APPE is close to the national average (Iowa and Washington), the grant per formula child decreases when a lower bound is added to the expenditure factor (as was the case beginning in FY1968) but increases when an upper bound is added to the expenditure factor, as it is under current law. Conversely, the grant per formula child is the lowest for higher-spending states (Connecticut and New York) when the expenditure factor has both upper and lower bounds, as is the case under current law.
The historical changes to the expenditure factors that tied them more closely to national APPE have benefitted any state with a state APPE that is less than the national APPE and not benefitted any state with a state APPE that exceeds the national APPE. Any change to the expenditure factor that allows it to vary more closely with state APPE only (e.g., no bounds) would favor states with relatively high APPEs and disadvantage those with relatively low APPEs. The current law expenditure factors are essentially a compromise between these two positions, providing an additional boost to lower-spending states while still allowing some variation in the expenditure factor based on state APPE.
|
Figure 3. Estimated FY2016 Title I-A State Grants Per Formula Child Using Different Expenditure Factors in Select States |
 |
|
Source: Figure prepared by the Congressional Research Service (CRS) based on unpublished data from the U.S. Department of Education (ED), Budget Service. Notes: Figure shows estimated grant amounts per formula child for (1) the two states with the lowest state APPE that are not receiving minimum grants (Arizona and Utah); (2) the two states with state APPE closest to the median state APPE that are not receiving minimum grants (Iowa and Washington); and (3) the two states with the highest state APPE that are not receiving minimum grants (Connecticut and New York). Estimated grant amounts for all states under each funding scenario are included in Table A-6. Under current law, the expenditure factor for all four Title I-A formulas is equal to state APPE for public elementary and secondary education, subject to a minimum and a maximum percentage of the national average, further multiplied by 0.40. State APPE is subject to a minimum of 80% and a maximum of 120% of the national APPE for Basic Grants, Concentration Grants, and Targeted Grants. That is, if a state's APPE is less than 80% of the national APPE, the state's APPE is automatically raised to 80% of the national APPE. If a state's APPE is more than 120% of the national APPE, the state's APPE is automatically reduced to 120% of the national APPE. For EFIG, the minimum and maximum thresholds for state APPE relative to national APPE are 85% and 115%, respectively. After adjustments, should they be needed, a state's APPE is multiplied by 0.40, as specified in statute. |
Targeting Title I-A Funds on Concentrations of Poverty
Since its initial enactment, the Title I-A program has been intended to address "the impact that concentrations of low-income families have on the ability of local educational agencies to support adequate educational programs."40 One issue that has attracted substantial attention is how to target Title I-A funds more effectively on LEAs with concentrations of poverty (either in terms of having a high number or a high percentage of formula children). While there are some concerns about whether having a high number or high percentage of formula children should result in larger LEA grants per formula child, as evidenced by the current debate among densely populated and less densely populated areas discussed above, there has also been a broader debate about how much to target Title I-A funds on areas with concentrations of poverty and how best to do so. This debate has played out over several decades through the addition of three formulas to the original Basic Grant formula.
The Education Amendments of 1978 (P.L. 95-561) added the Grants to LEAs in Counties with Especially High Concentrations of Children from Low Income Families. These grants are better known as Concentration Grants and were modeled on an earlier Title I-A grant program that essentially had the same purpose.41 As the title of the grants indicates, this formula was added to Title I-A to provide additional funding to areas with high concentrations of children from low-income families. In adding the formula, proponents argued that areas with concentrations of poverty needed "more intensive remedial effort than the average school district."42
Two additional formulas were added to the ESEA in 1994. The House Committee on Education and Labor added the Targeted Grant formula to target Title I-A funds more effectively on areas with concentrations of poverty, but it retained the Basic Grant and Concentration Grant formulas to continue to provide funding to "other less poor but still needy communities."43 The Senate Committee on Labor and Human Resources took a different approach, arguing that the Basic Grant and Concentration Grant formulas should be replaced by a new formula (EFIG) that would target funding more effectively on concentrations of poverty.44 Ultimately, both the Targeted Grant and EFIG formulas were added to the ESEA and the Basic Grant and Concentration Grant formulas were retained.
Effectiveness of the Different Title I-A Formulas at Targeting
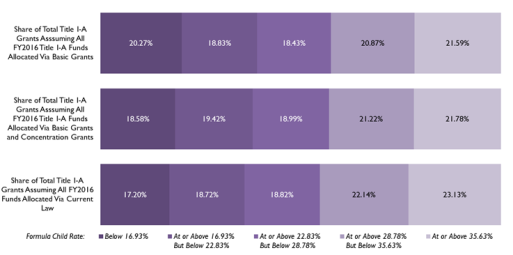
The addition of Concentration Grants, Targeted Grants, and EFIG to Basic Grants has resulted in more effective targeting of Title I-A funds on concentrations of poverty. To examine this targeting, CRS analyzed the share of Title I-A funds allocated to LEAs by an LEA's formula child rate.45 CRS divided LEAs into five groups or ranges based on their formula child rates. Each range contains roughly 20% of the formula children used to determine FY2016 grant amounts (i.e., approximately the same number of formula children, but not necessarily the same number of LEAs, is included in each range). Thus, if an equal amount of funding were allocated per formula child, each range would receive 20% of funds.46 If there were targeting of Title I-A funds on concentrations of formula children, then ranges containing LEAs with higher formula child rates would receive a larger share of funding. Figure 4 shows the targeting of Title I-A funds under current law compared to the targeting of Title I-A funds assuming funds are allocated only via the Basic Grant formula (as was generally the case prior to FY1989) and assuming funds are allocated only via the Basic Grant and Concentration Grant formulas (as was the case between FY1989 and FY2002).47
When all FY2016 Title I-A funds are allocated via the Basic Grant formula, LEAs with the highest formula child rates would receive the largest share of funds. LEAs with the highest formula child rates (4th and 5th ranges) would receive 42.47% of funds while LEAs with the lowest formula child rates (1st and 2nd ranges) would receive 39.10% of funds. However, LEAs in the 3rd range would receive the smallest share of funds (18.43%). The share of funds allocated to LEAs in a given range does not necessarily increase as the percentage of formula children increases. This distribution of funds indicates that there is some targeting of Basic Grants to LEAs with higher formula child rates.
When all FY2016 Title I-A funds are allocated via both the Basic Grant and Concentration Grant formulas, the targeting of Title I-A funds is improved. LEAs with the lowest formula child rates (1st and 2nd ranges) would receive 38.00% of funds and LEAs with the highest formula child rates (4th and 5th ranges) would receive 43.00% of funds. While this distribution indicates that the targeting of Title I-A funds is improved by the addition of Concentration Grants, it should be noted that LEAs in the 3rd range would receive a smaller share of funding than LEAs in the 2nd range, which have lower formula child rates (18.99% of funds compared to 19.42% of funds). Thus, targeting is improved only slightly with the addition of Concentration Grants.
Under current law, when FY2016 Title I-A funds are allocated under all four Title I-A formulas, the overall percentage of Title I-A funds provided to LEAs in a given range increases as the percentage of formula children increases. In FY2016, the estimated percentage share of total Title I-A funds spanned from 17.20% in range 1 to 18.82% in range 3 to 23.13% in range 5. Overall, LEAs with the lowest formula child rates (1st and 2nd ranges) received 35.92% of Title I-A funds while LEAs with the highest formula child rates (4th and 5th ranges) received 45.26% of Title I-A funds. This distribution indicates that Title I-A funds are targeted more to LEAs with higher formula child rates when funds are allocated via the Basic Grant, Concentration Grant, Targeted Grant, and EFIG formulas than when funds are allocated under just the Basic Grant formula or just the Basic Grant and Concentration Grant formulas.
|
Figure 4. Targeting of FY2016 Title I-A Funds to LEAs Based on Formula Child Rates Under Current Law, Assuming All Funds Are Allocated Via Basic Grants, and Assuming All Funds Are Allocated Via Basic Grants and Concentration Grants |
 |
|
Source: Prepared by the Congressional Research Service (CRS) based on unpublished data from the U.S. Department of Education, Budget Service. Notes: Each of the five formula child rate ranges contains 20% of the national total of formula children included in the determination of FY2016 Title I-A grants under current law (i.e., each range contains the same number of formula children but not necessarily the same number of LEAs). Thus, if an equal amount of funding were allocated per formula child, each range would receive 20% of Title I-A funds. The formula child rate is the percentage of children ages 5 to 17 residing in a given LEA who are formula children. It is calculated by dividing the number of formula children in an LEA by the number of children ages 5 to 17 who reside in the LEA. For estimated state grant amounts assuming all funds are allocated via Basic Grants and assuming all funds are allocated via Basic Grants and Concentration Grants, see Appendix A. |
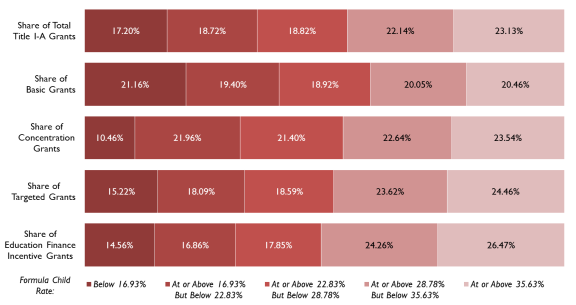
The reason that the current four formula strategy renders better targeting of Title I-A funds is because the Targeted Grant and EFIG formulas are more effective than the Basic Grant and Concentration Grant formulas at targeting funds to areas with concentrations of formula children, due in part to the use of the formula child weighting scales used in determining Targeted Grant and EFIG formula grant amounts. Figure 5 shows the targeting of FY2016 Title I-A funds under current law to LEAs for each of the four Title I-A formulas using the five formula child rate ranges described above.
The Basic Grant formula is the least effective at targeting funds on concentrations of poverty. In FY2016, LEAs with the lowest formula child rates (1st and 2nd ranges) received 40.56% of funds while LEAs with the highest formula child rates (4th and 5th ranges) received 40.51% of funds. LEAs in the 3rd range received the smallest share of Title I-A funds (18.92%). This distribution indicates that there is little targeting of Basic Grants to LEAs with higher formula child rates.
Unlike Basic Grants, the distribution of funds under Concentration Grants indicates that there is some targeting of funds to LEAs with concentrations of poverty. LEAs with the lowest formula child rates (1st and 2nd ranges) received 32.41% of funds while LEAs with the highest formula child rates (4th and 5th ranges) received 46.18% of funds. The relatively small share of Concentration Grants in the 1st range (10.46% of funds) is due, in part, to the high eligibility thresholds under this formula, which limit the number of LEAs in the 1st range receiving grants. It is worth noting, however, that LEAs in the 3rd range received a smaller share of funding than the LEAs in the 2nd range, which have lower formula child rates (21.96% of funds compared to 21.40% of funds).
The distribution of funds under the Targeted Grant and EFIG formulas is somewhat different than under Basic Grants and Concentration Grants. Under each of these formulas, the share of funding increases as formula child rates increase. Under Targeted Grants, the share of FY2016 funds spanned from 15.22% for LEAs in the 1st range to 24.46% for LEAs in the 5th range. Similarly, for EFIG, LEAs in the 1st range received 14.56% of funds while LEAs in the 5th range received 26.47% of funds. LEAs with the lowest formula child rates (1st and 2nd ranges) received 33.32% and 31.42% of Targeted Grants and EFIG funds, respectively. LEAs with the highest formula child rates (4th and 5th ranges) received 48.09% and 50.73% of Targeted Grants and EFIG funds, respectively. This indicates that Targeted Grants and EFIG are more effective than Basic Grants and Concentration Grants at targeting funds to areas with concentrations of formula children, which, as noted, is a proxy for concentrations of poverty.
|
Figure 5. Targeting of FY2016 Title I-A Funds to LEAs Under Current Law Based on Formula Child Rates for Each of the Title I-A Formulas |
 |
|
Source: Prepared by the Congressional Research Service (CRS) based on unpublished data from the U.S. Department of Education, Budget Service. Notes: Each of the five formula child rate ranges contains 20% of the national total of formula children included in the determination of FY2016 Title I-A grants under current law (i.e., each range contains the same number of formula children but not necessarily the same number of LEAs). Thus, if an equal amount of funding were allocated per formula child, each range would receive 20% of Title I-A funds. The formula child rate is the percentage of children ages 5 to 17 residing in a given LEA who are formula children. It is calculated by dividing the number of formula children in an LEA by the number of children ages 5 to 17 who reside in the LEA. This analysis focuses on the targeting of Title I-A funds to areas with high formula child rates. An analysis of the targeting of Title I-A funds to areas with high formula child counts (included in Appendix B) indicates a similar finding: the addition of the Concentration Grant, Targeted Grant, and EFIG formulas to Basic Grants has improved the targeting of Title I-A funds on concentrations of formula children, and the Targeted Grant and EFIG formulas are more effective than the Basic Grant and Concentration Grant formulas at targeting funds to areas with concentrations of formula children. |
These distributions of funds also indicate that the targeting of Title I-A funds on concentrations of poverty has increased over time. The addition of Concentration Grants, Targeted Grants, and EFIG to Title I-A did, to some extent, improve the targeting of funds to LEAs with higher formula child rates. Furthermore, the newest formulas (Targeted Grants and EFIG) are the most effective at targeting funds and, as exemplified in Figure 6, the share of Title I-A funds allocated via the Targeted Grant and EFIG formulas has generally increased since they were first funded in FY2002. If this funding trend continues, the overall targeting of Title I-A funds on LEAs with higher formula child rates would increase, as a larger share of Title I-A funds would be allocated through the more-targeted formulas.
|
Figure 6. Title I-A Appropriations by Formula, FY1980 through FY2017 Dollars in thousands |
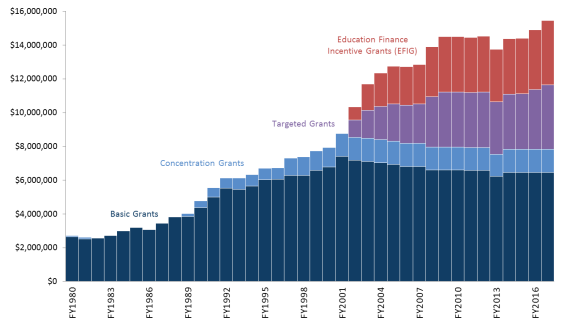 |
|
Source: Prepared by the Congressional Research Service (CRS) based on data available from the U.S. Department of Education, Budget Service. Appendix B provides an overview of Title I-A appropriations levels in recent years. Notes: Appropriations provided in current (not constant) dollars. Title I-A has been funded since FY1966. However, a consistent source of appropriations data is only available for FY1980 onward (the year in which ED was created). Thus, fiscal years prior to FY1980 were not included in this analysis. The appropriations level for FY2009 does not reflect the additional $10 billion for Title I-A appropriated through the American Recovery and Reinvestment Act (ARRA; P.L. 111-5). For FY1982 through FY1988, Title I-A funds were allocated solely through the Basic Grant formula. The No Child Left Behind Act (NCLB; P.L. 107-110) required that all funds in excess of the FY2001 appropriations levels for the Basic Grant and Concentration Grant formulas be provided to the Targeted Grant and EFIG formulas. The statutory language did not specify how the excess funds should be divided between the two formulas. Rather, these decisions have been made through the appropriations process. In addition, while the statutory language references the FY2001 funding levels for the Basic Grant and Concentration Grant formulas, appropriations for these formulas are currently below their FY2001 levels. In practice, since FY2002 the Targeted Grant and EFIG formulas have received all funds in excess of the amount actually appropriated for the Basic Grant and Concentration Grant formulas. For FY2002 and FY2003, two-thirds of these funds were provided to the Targeted Grant formula and one-third were provided to the EFIG formula. Beginning in FY2004, these funds were divided evenly between the Targeted Grant and EFIG formulas. Beginning in FY2017, the ESSA (P.L. 114-95) requires that all funds in excess of the FY2001 appropriations levels for Basic Grants and Concentration Grants be divided evenly between the Targeted Grant and EFIG formulas. If appropriations for the Basic Grant and Concentration Grant formulas remain below their FY2001 levels, it is possible that the Targeted Grant and EFIG formulas will each continue to receive half of the Title I-A appropriations in excess of what is provided for the Basic Grant and Concentration Grant formulas. |
Effect of State Minimum Grant and Hold Harmless Provisions on Targeting
State minimum grant and LEA hold harmless provisions were added to the Title I-A formula over time. The first hold harmless provision was added to the Basic Grant formula through the 1974 amendments, specifically to mitigate any losses that LEAs might experience due to the implementation of a new expenditure factor.48 When Concentration Grants were added to Title I-A in the 1978 amendments, the Senate Committee on Human Resources added a requirement that no state receive less than 0.25% of the amount appropriated for Concentration Grants to protect the amount of funding received by rural districts.49
By shifting the distribution of funds under the formulas, especially under the Concentration Grant, Targeted Grant, and EFIG formulas, the inclusion of state minimum grant and LEA hold harmless provisions may reduce the targeting of funds on LEAs with higher concentrations of poverty by reducing grant amounts to LEAs that would have otherwise received more funding. That is, state minimum grant provisions and LEA hold harmless provisions may disrupt the formula provisions enacted to target funds on LEAs with higher concentrations of poverty. At the same time, however, these provisions may serve other purposes valued by Congress, including providing small states with a larger grant than they would have otherwise received to run their Title I-A programs and providing LEAs with some stability in their grant amounts from year-to-year. In addition, both types of provisions have been used to gain support for changes to the Title I-A formulas by helping to mitigate any losses that may result from those changes.50
Figure 7 shows the targeting of estimated FY2016 Title I-A funds to LEAs based on formula child rates under four funding scenarios: (1) current law, (2) assuming no state minimum grant provisions are applied, (3) assuming no LEA hold harmless provisions are applied, and (4) assuming no state minimum grant or LEA hold harmless provisions are applied.51 Figure 7 groups LEAs into the five formula child rate ranges described above and indicates the share of Title I-A funds provided to each range under each funding scenario.
If state minimum grant provisions were not applied, the targeting of Title I-A funds would slightly increase. LEAs with the lowest formula child rates (1st and 2nd ranges) would receive a slightly smaller share of Title I-A funds (35.76% compared to 35.92% under current law) and the LEAs with the highest formula child rates (4th and 5th ranges) would receive a slightly larger share of Title I-A funds (45.37% compared to 45.26% under current law). Although this distribution indicates that the removal of the state minimum grant provisions would increase the targeting of Title I-A funds, the change is minimal. One reason state minimum grants do not play a large role in the targeting of Title I-A funds is that only five states received a minimum grant amount under all four formulas in FY2016.52
Conversely, if the LEA hold harmless provisions were removed, the targeting of Title I-A funds would decrease. LEAs with the lowest formula child rates (1st and 2nd ranges) would receive a larger share of Title I-A funds (36.09% compared to 35.92% under current law) and the LEAs with the highest formula child rates (4th and 5th ranges) would receive a smaller share of Title I-A funds (44.86% compared to 45.26% under current law). One reason why the removal of the hold harmless provisions may hinder the targeting of Title I-A funds is that, as previously discussed, LEAs with higher formula child rates receive higher hold harmless rates; thus, the hold harmless provisions may actually help to target Title I-A funds to areas with concentrations of formula children. However, the effect of removing the hold harmless provisions on the targeting of funds is relatively small, indicating that, like the minimum grant provisions, hold harmless provisions do not play a large role in it.
When both state minimum grant and LEA hold harmless provisions are removed, the targeting of Title I-A funds on areas with concentrations of poverty does not seem to improve. While LEAs with the lowest formula child rates (1st and 2nd ranges) would receive a smaller share of Title I-A funds (35.81% compared to 35.92% under current law), LEAs with the highest formula child rates (4th and 5th ranges) also would receive a smaller share of Title I-A funds (45.06% compared to 45.27% under current law). The reason that removing both provisions does not increase targeting is because, as discussed above, the hold harmless provisions slightly improve targeting and removing these provisions decreases the targeting of Title I-A funds. Again, however, the effect of removing both the minimum grant and hold harmless provisions on the targeting of funds is relatively small, indicating that these provisions do not play a large role in it.
|
Figure 7. Targeting of FY2016 Title I-A Funds to LEAs Based on Formula Child Rates Under Current Law, and Assuming No Hold Harmless and/or Minimum Grant Provisions Are Applied |
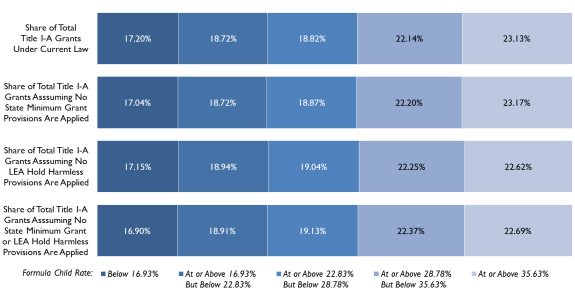 |
|
Source: Prepared by the Congressional Research Service (CRS) based on unpublished data from the U.S. Department of Education (ED), Budget Service. Notes: Each of the five formula child rate ranges contains 20% of the national total of formula children included in the determination of FY2016 Title I-A grants under current law (i.e., each range contains the same number of formula children but not necessarily the same number of LEAs). Thus, if an equal amount of funding were allocated per formula child, each range would receive 20% of Title I-A funds. The formula child rate is the percentage of children ages 5 to 17 residing in a given LEA who are formula children. It is calculated by dividing the number of formula children in an LEA by the number of children ages 5 to 17 who reside in the LEA. For estimated state grant amounts as well as estimated grant amounts for the LEAs losing and gaining the most funds as a result of the removal of the hold harmless and/or minimum grant provisions, see Appendix A. |
Appendix A. Estimated Title I-A Grants
Table A-1 shows the estimated FY2016 Title I-A grants to states and state grants per child included in the determination of Title I-A grants (formula children) under four funding scenarios: (1) current law, (2) assuming no state minimum grant provisions are applied, (3) assuming no LEA hold harmless provisions are applied, and (4) assuming no state minimum grant or LEA hold harmless provisions are applied. The formula child population used to determine Title I-A grants for the 50 states, the District of Columbia, and Puerto Rico consists of children ages 5 to 17 (1) living in poor families,53 (2) in institutions for neglected or delinquent children or in foster homes, and (3) in families receiving Temporary Assistance for Needy Families (TANF) payments above the poverty income level for a family of four. Children in poor families account for about 98% of the total formula child count. For the purposes of this analysis, all formula children in the state were included regardless of whether they were in an LEA that received a Title I-A grant or not (some LEAs that have formula children do not receive Title I-A grants).
Table A-2 and Table A-3 show the 10 LEAs estimated to see the largest losses and gains, respectively, assuming no hold harmless provisions are applied. Table A-4 and Table A-5 show the 10 LEAs estimated to see the largest losses and gains, respectively, assuming no minimum grant provisions are applied.
Table A-6 shows the estimated FY2016 Title I-A grants to states assuming the expenditure factor was calculated (1) as 50% of state average per pupil expenditures (APPE); (2) as 50% of the larger of state or national APPE; and (3) as 40% of state APPE, subject to a minimum and maximum. These expenditure factors correspond to (1) the expenditure factor that was originally included in the Title I-A formulas, (2) the expenditure factor used to determine FY1968 through FY1974 Title I-A grants, and (3) the expenditure factor under current law.54
Table A-7 shows the estimated FY2016 Title I-A grants to states and state grants per formula child under current law, assuming all Title I-A funds are allocated only via the Basic Grant formula (as was generally the case prior to FY1989), and assuming all Title I-A funds are allocated only via the Basic Grant and Concentration Grant formulas (as was the case between FY1989 and FY2002).55
FY2016 Title I-A grants under current law were calculated by ED. All other estimates were calculated by CRS. The Title I-A grant per formula child was calculated by dividing the state or LEA's total estimated Title I-A grant amount by the aforementioned formula child population.56 All estimated grants are provided solely to assist in comparisons of the relative impact of various formula factors and provisions. They are not intended to predict specific amounts that states or LEAs will receive. In addition, while the elimination of a provision may not result in a large change in a state's grant amount, the change in an LEA's grant amount could be more substantial.
Table A-1. Estimated FY2016 Title I-A Grants to States Assuming No State Minimum Grant Provisions Are Applied and/or Assuming No LEA Hold Harmless Provisions Are Applied
|
FY2016 Grant Under Current Law |
Estimated FY2016 Grant Assuming No State Minimum Grant Provisions Are Applied |
Estimated FY2016 Grant Assuming No LEA Hold Harmless Provisions Are Applied |
Estimated FY2016 Grant Assuming No State Minimum Grant or LEA Hold Harmless Provisions Are Applied |
|||||
|
State |
Total Title I-A Grant (Dollars in Thousands) |
Grant Per Formula Child |
Total Title I-A Grant (Dollars in Thousands) |
Grant Per Formula Child |
Total Title I-A Grant (Dollars in Thousands) |
Grant Per Formula Child |
Total Title I-A Grant (Dollars in Thousands) |
Grant Per Formula Child |
|
Alabama |
$237,845 |
$1,130 |
$238,915 |
$1,130 |
$237,603 |
$1,120 |
$239,468 |
$1,130 |
|
Alaska |
$41,704 |
$2,110 |
$34,338 |
$1,740 |
$41,704 |
$2,110 |
$31,678 |
$1,600 |
|
Arizona |
$333,848 |
$1,140 |
$335,313 |
$1,140 |
$329,056 |
$1,120 |
$331,673 |
$1,130 |
|
Arkansas |
$156,673 |
$1,240 |
$157,295 |
$1,240 |
$154,288 |
$1,220 |
$155,476 |
$1,230 |
|
California |
$1,768,117 |
$1,200 |
$1,776,580 |
$1,210 |
$1,772,832 |
$1,200 |
$1,787,024 |
$1,210 |
|
Colorado |
$150,815 |
$1,100 |
$151,504 |
$1,100 |
$150,999 |
$1,100 |
$152,179 |
$1,110 |
|
Connecticut |
$122,857 |
$1,520 |
$123,467 |
$1,520 |
$124,136 |
$1,530 |
$125,075 |
$1,540 |
|
Delaware |
$47,272 |
$1,810 |
$43,400 |
$1,660 |
$47,410 |
$1,810 |
$41,851 |
$1,600 |
|
District of Columbia |
$44,254 |
$1,970 |
$41,587 |
$1,850 |
$44,468 |
$1,980 |
$41,599 |
$1,850 |
|
Florida |
$813,175 |
$1,200 |
$817,266 |
$1,200 |
$823,885 |
$1,210 |
$830,709 |
$1,220 |
|
Georgia |
$523,928 |
$1,150 |
$526,252 |
$1,160 |
$523,654 |
$1,150 |
$527,845 |
$1,160 |
|
Hawaii |
$53,450 |
$1,660 |
$53,731 |
$1,670 |
$54,245 |
$1,690 |
$54,683 |
$1,700 |
|
Idaho |
$58,210 |
$1,050 |
$57,343 |
$1,030 |
$57,782 |
$1,040 |
$56,857 |
$1,020 |
|
Illinois |
$667,177 |
$1,610 |
$670,293 |
$1,620 |
$672,295 |
$1,630 |
$677,621 |
$1,640 |
|
Indiana |
$258,773 |
$1,130 |
$259,852 |
$1,140 |
$256,564 |
$1,130 |
$258,527 |
$1,130 |
|
Iowa |
$95,239 |
$1,220 |
$95,675 |
$1,230 |
$95,256 |
$1,220 |
$95,967 |
$1,230 |
|
Kansas |
$110,459 |
$1,220 |
$110,947 |
$1,230 |
$110,969 |
$1,230 |
$111,813 |
$1,240 |
|
Kentucky |
$214,924 |
$1,220 |
$215,847 |
$1,220 |
$213,739 |
$1,210 |
$215,409 |
$1,220 |
|
Louisiana |
$290,018 |
$1,370 |
$291,339 |
$1,380 |
$290,701 |
$1,370 |
$293,005 |
$1,380 |
|
Maine |
$52,575 |
$1,600 |
$50,642 |
$1,540 |
$52,630 |
$1,600 |
$49,124 |
$1,490 |
|
Maryland |
$219,633 |
$1,690 |
$220,774 |
$1,700 |
$223,215 |
$1,720 |
$225,019 |
$1,730 |
|
Massachusetts |
$233,674 |
$1,560 |
$234,659 |
$1,560 |
$232,440 |
$1,550 |
$234,215 |
$1,560 |
|
Michigan |
$491,739 |
$1,420 |
$493,509 |
$1,420 |
$470,849 |
$1,360 |
$474,537 |
$1,370 |
|
Minnesota |
$164,558 |
$1,280 |
$165,362 |
$1,280 |
$165,856 |
$1,290 |
$167,119 |
$1,300 |
|
Mississippi |
$185,585 |
$1,180 |
$186,180 |
$1,180 |
$177,272 |
$1,130 |
$178,668 |
$1,140 |
|
Missouri |
$240,375 |
$1,190 |
$241,343 |
$1,200 |
$238,387 |
$1,180 |
$240,205 |
$1,190 |
|
Montana |
$46,217 |
$1,530 |
$41,880 |
$1,390 |
$45,683 |
$1,510 |
$37,626 |
$1,240 |
|
Nebraska |
$70,623 |
$1,370 |
$70,958 |
$1,380 |
$70,636 |
$1,370 |
$71,178 |
$1,380 |
|
Nevada |
$119,835 |
$1,200 |
$120,457 |
$1,210 |
$121,774 |
$1,220 |
$122,800 |
$1,230 |
|
New Hampshire |
$43,219 |
$1,910 |
$36,477 |
$1,610 |
$43,022 |
$1,900 |
$31,946 |
$1,410 |
|
New Jersey |
$343,587 |
$1,550 |
$345,204 |
$1,560 |
$345,821 |
$1,560 |
$348,465 |
$1,570 |
|
New Mexico |
$113,409 |
$1,180 |
$113,855 |
$1,180 |
$111,454 |
$1,160 |
$112,340 |
$1,170 |
|
New York |
$1,137,874 |
$1,710 |
$1,143,440 |
$1,720 |
$1,148,243 |
$1,730 |
$1,157,659 |
$1,740 |
|
North Carolina |
$428,562 |
$1,130 |
$430,542 |
$1,140 |
$431,092 |
$1,140 |
$434,507 |
$1,150 |
|
North Dakota |
$36,580 |
$2,440 |
$26,963 |
$1,800 |
$36,580 |
$2,440 |
$19,060 |
$1,270 |
|
Ohio |
$575,181 |
$1,400 |
$577,757 |
$1,400 |
$575,726 |
$1,400 |
$580,197 |
$1,410 |
|
Oklahoma |
$161,050 |
$1,090 |
$161,778 |
$1,090 |
$160,775 |
$1,080 |
$162,014 |
$1,090 |
|
Oregon |
$146,714 |
$1,210 |
$147,375 |
$1,210 |
$145,868 |
$1,200 |
$146,983 |
$1,210 |
|
Pennsylvania |
$575,866 |
$1,590 |
$578,555 |
$1,600 |
$577,798 |
$1,600 |
$582,311 |
$1,610 |
|
Puerto Rico |
$408,720 |
$1,220 |
$409,582 |
$1,220 |
$389,618 |
$1,160 |
$392,701 |
$1,170 |
|
Rhode Island |
$50,469 |
$1,650 |
$48,964 |
$1,600 |
$50,857 |
$1,660 |
$49,194 |
$1,610 |
|
South Carolina |
$239,695 |
$1,210 |
$240,859 |
$1,210 |
$242,898 |
$1,220 |
$244,809 |
$1,230 |
|
South Dakota |
$44,665 |
$1,800 |
$35,681 |
$1,440 |
$44,665 |
$1,800 |
$25,682 |
$1,030 |
|
Tennessee |
$301,750 |
$1,130 |
$303,203 |
$1,130 |
$305,339 |
$1,140 |
$307,765 |
$1,150 |
|
Texas |
$1,378,482 |
$1,140 |
$1,385,075 |
$1,140 |
$1,385,335 |
$1,140 |
$1,396,451 |
$1,150 |
|
Utah |
$87,840 |
$1,060 |
$88,279 |
$1,060 |
$89,035 |
$1,070 |
$89,732 |
$1,080 |
|
Vermont |
$35,332 |
$2,640 |
$26,573 |
$1,980 |
$35,332 |
$2,640 |
$19,041 |
$1,420 |
|
Virginia |
$262,980 |
$1,290 |
$264,238 |
$1,300 |
$266,178 |
$1,310 |
$268,231 |
$1,320 |
|
Washington |
$230,477 |
$1,230 |
$231,514 |
$1,240 |
$229,320 |
$1,220 |
$231,064 |
$1,230 |
|
West Virginia |
$89,625 |
$1,410 |
$90,016 |
$1,410 |
$88,454 |
$1,390 |
$89,126 |
$1,400 |
|
Wisconsin |
$216,376 |
$1,350 |
$217,448 |
$1,360 |
$218,267 |
$1,360 |
$219,958 |
$1,380 |
|
Wyoming |
$34,756 |
$2,650 |
$26,671 |
$2,030 |
$34,756 |
$2,650 |
$18,573 |
$1,410 |
Source: Table prepared by the Congressional Research Service (CRS) based on unpublished data provided by the U.S. Department of Education (ED), Budget Service. FY2016 Title I-A grants under current law were calculated by ED. All other estimates were calculated by CRS.
Notes: Estimated grant per Title I-A formula child amounts have been rounded to the nearest $10 amount.
Notice: These are estimated grants only. These estimates are provided solely to assist in an examination of various Title I-A formula factors and provisions. They are not intended to predict specific amounts states or LEAs will receive. In addition, while the elimination of a provision may not result in a large change in a state's grant amount, the change in an LEA's grant amount could be more substantial.
Table A-2. Estimated FY2016 Grants to LEAs Under Title I-A Assuming No Hold Harmless Provisions Are Applied: 10 LEAs with the Largest Estimated Losses
Dollars in thousands
|
State |
LEA |
FY2016 Grant Under Current Law |
Estimated FY2016 Grant Assuming No Hold Harmless Provisions Are Applied |
Difference from Current Law |
Percentage Difference |
|
MI |
Detroit City School District |
$132,683 |
$116,920 |
-$15,763 |
-11.88% |
|
GA |
Atlanta City School District |
$29,951 |
$26,731 |
-$3,221 |
-10.75% |
|
MI |
Saginaw City School District |
$8,270 |
$5,085 |
-$3,185 |
-38.51% |
|
IN |
Gary Community School Corporation |
$12,685 |
$10,241 |
-$2,444 |
-19.27% |
|
AZ |
Phoenix Elementary District |
$7,664 |
$5,352 |
-$2,312 |
-30.16% |
|
CA |
Modesto City Elementary School District |
$7,372 |
$5,508 |
-$1,864 |
-25.28% |
|
IL |
Decatur School District 61 |
$7,399 |
$5,550 |
-$1,849 |
-24.99% |
|
NM |
Deming Public Schools |
$3,702 |
$2,034 |
-$1,667 |
-45.04% |
|
NJ |
Camden City School District |
$14,392 |
$12,855 |
-$1,536 |
-10.68% |
|
TX |
Eagle Pass Independent School District |
$6,606 |
$5,122 |
-$1,485 |
-22.47% |
Source: Table prepared by the Congressional Research Service (CRS) based on unpublished data provided by the U.S. Department of Education (ED), Budget Service. FY2016 Title I-A grants under current law were calculated by ED. All other estimates were calculated by CRS.
Notes: Details may not add to totals due to rounding. Percentages are based on unrounded values.
Notice: These are estimated grants only. These estimates are provided solely to assist in an examination of various Title I-A formula factors and provisions. They are not intended to predict specific amounts states or LEAs will receive.
Table A-3. Estimated FY2016 Grants to LEAs Under Title I-A Assuming No Hold Harmless Provisions Are Applied: 10 LEAs with the Largest Estimated Gains
Dollars in thousands
|
State |
LEA |
FY2016 Grant Under Current Law |
Estimated FY2016 Grant Assuming No Hold Harmless Provisions Are Applied |
Difference from Current Law |
Percentage Difference |
|
CA |
Los Angeles Unified School District |
$367,156 |
$376,186 |
$9,030 |
2.46% |
|
IL |
Chicago Public School District 299 |
$279,553 |
$285,485 |
$5,932 |
2.12% |
|
NY |
Kings County |
$272,536 |
$278,291 |
$5,754 |
2.11% |
|
PA |
Philadelphia City School District |
$190,427 |
$195,239 |
$4,812 |
2.53% |
|
NY |
Bronx County |
$224,621 |
$229,375 |
$4,754 |
2.12% |
|
FL |
Dade County School District |
$140,977 |
$143,782 |
$2,805 |
1.99% |
|
NY |
Queens County |
$129,462 |
$132,229 |
$2,767 |
2.14% |
|
TX |
Houston Independent School District |
$108,905 |
$111,413 |
$2,508 |
2.30% |
|
TX |
Dallas Independent School District |
$96,382 |
$98,604 |
$2,222 |
2.31% |
|
NV |
Clark County School District |
$96,780 |
$98,675 |
$1,895 |
1.96% |
Source: Table prepared by the Congressional Research Service (CRS) based on unpublished data provided by the U.S. Department of Education (ED), Budget Service. FY2016 Title I-A grants under current law were calculated by ED. All other estimates were calculated by CRS.
Notes: Details may not add to totals due to rounding. Percentages are based on unrounded values.
Notice: These are estimated grants only. These estimates are provided solely to assist in an examination of various Title I-A formula factors and provisions. They are not intended to predict specific amounts states or LEAs will receive.
Table A-4. Estimated FY2016 Grants to LEAs Under Title I-A Assuming No State Minimum Grant Provisions Are Applied: 10 LEAs with the Largest Estimated Losses
Dollars in thousands
|
State |
LEA |
FY2016 Grant Under Current Law |
Estimated FY2016 Grant Assuming No State Minimum Grant Provisions Are Applied |
Difference from Current Law |
Percentage Difference |
|
AK |
Anchorage School District |
$16,477 |
$12,200 |
-$4,277 |
-25.96% |
|
SD |
Sioux Falls School District 49-5 |
$5,961 |
$4,095 |
-$1,866 |
-31.30% |
|
ND |
Grand Forks Public School District 1 |
$3,207 |
$1,833 |
-$1,375 |
-42.86% |
|
WY |
Laramie County School District 1 |
$5,465 |
$4,107 |
-$1,357 |
-24.84% |
|
WY |
Natrona County School District 1 |
$4,898 |
$3,640 |
-$1,258 |
-25.68% |
|
ND |
Fargo Public School District 1 |
$3,690 |
$2,436 |
-$1,253 |
-33.97% |
|
DE |
Christina School District |
$10,139 |
$8,908 |
-$1,231 |
-12.14% |
|
AK |
Matanuska-Susitna Borough School District |
$4,664 |
$3,483 |
-$1,181 |
-25.32% |
|
ND |
Belcourt Public School District 7 |
$2,290 |
$1,505 |
-$785 |
-34.27% |
|
ND |
West Fargo Public School District 6 |
$2,289 |
$1,551 |
-$738 |
-32.23% |
Source: Table prepared by the Congressional Research Service (CRS) based on unpublished data provided by the U.S. Department of Education (ED), Budget Service. FY2016 Title I-A grants under current law were calculated by ED. All other estimates were calculated by CRS.
Notes: Details may not add to totals due to rounding. Percentages are based on unrounded values.
Notice: These are estimated grants only. These estimates are provided solely to assist in an examination of various Title I-A formula factors and provisions. They are not intended to predict specific amounts states or LEAs will receive.
Table A-5. Estimated FY2016 Grants to LEAs Under Title I-A Assuming No State Minimum Grant Provisions Are Applied: 10 LEAs with the Largest Estimated Gains
Dollars in thousands
|
State |
LEA |
FY2016 Grant Under Current Law |
Estimated FY2016 Grant Assuming No State Minimum Grant Provisions Are Applied |
Difference from Current Law |
Percentage Difference |
|
CA |
Los Angeles Unified School District |
$367,156 |
$369,388 |
$2,232 |
0.61% |
|
NY |
Kings County |
$272,536 |
$274,139 |
$1,603 |
0.59% |
|
IL |
Chicago Public School District 299 |
$279,553 |
$281,145 |
$1,592 |
0.57% |
|
NY |
Bronx County |
$224,621 |
$225,937 |
$1,315 |
0.59% |
|
PA |
Philadelphia City School District |
$190,427 |
$191,632 |
$1,206 |
0.63% |
|
FL |
Dade County School District |
$140,977 |
$141,780 |
$803 |
0.57% |
|
NY |
Queens County |
$129,462 |
$130,206 |
$744 |
0.57% |
|
TX |
Houston Independent School District |
$108,905 |
$109,562 |
$657 |
0.60% |
|
TX |
Dallas Independent School District |
$96,382 |
$96,961 |
$579 |
0.60% |
|
NV |
Clark County School District |
$96,780 |
$97,310 |
$529 |
0.55% |
Source: Table prepared by the Congressional Research Service (CRS) based on unpublished data provided by the U.S. Department of Education (ED), Budget Service. FY2016 Title I-A grants under current law were calculated by ED. All other estimates were calculated by CRS.
Notes: Details may not add to totals due to rounding. Percentages are based on unrounded values.
Notice: These are estimated grants only. These estimates are provided solely to assist in an examination of various Title I-A formula factors and provisions. They are not intended to predict specific amounts states or LEAs will receive.
Table A-6. Estimated FY2016 Title I-A Grants to States Assuming the Expenditure Factor Was Calculated (1) Under Current Law, (2) as 50% of State APPE, and (3) as 50% of the Greater of State or National APPE
Dollars in thousands
|
State |
FY2016 Grant Under Current Law |
Estimated FY2016 Grant Assuming Expenditure Factor Equal to 50% of State APPE |
Estimated FY2016 Grant Assuming Expenditure Factor Equal to 50% of the Greater of State or National APPE |
|
Alabama |
$237,845 |
$218,237 |
$241,021 |
|
Alaska |
$41,704 |
$44,772 |
$41,793 |
|
Arizona |
$333,848 |
$293,480 |
$338,297 |
|
Arkansas |
$156,673 |
$150,406 |
$150,392 |
|
California |
$1,768,117 |
$1,670,463 |
$1,698,232 |
|
Colorado |
$150,815 |
$142,911 |
$150,208 |
|
Connecticut |
$122,857 |
$159,793 |
$141,305 |
|
Delaware |
$47,272 |
$46,261 |
$46,077 |
|
District of Columbia |
$44,254 |
$59,293 |
$52,339 |
|
Florida |
$813,175 |
$728,117 |
$825,884 |
|
Georgia |
$523,928 |
$489,818 |
$530,685 |
|
Hawaii |
$53,450 |
$50,240 |
$46,456 |
|
Idaho |
$58,210 |
$54,091 |
$58,765 |
|
Illinois |
$667,177 |
$662,591 |
$621,432 |
|
Indiana |
$258,773 |
$247,896 |
$255,188 |
|
Iowa |
$95,239 |
$90,610 |
$85,703 |
|
Kansas |
$110,459 |
$104,967 |
$100,257 |
|
Kentucky |
$214,924 |
$205,354 |
$208,250 |
|
Louisiana |
$290,018 |
$277,954 |
$266,118 |
|
Maine |
$52,575 |
$52,815 |
$49,925 |
|
Maryland |
$219,633 |
$226,352 |
$200,266 |
|
Massachusetts |
$233,674 |
$260,664 |
$234,477 |
|
Michigan |
$491,739 |
$476,159 |
$456,782 |
|
Minnesota |
$164,558 |
$154,817 |
$140,201 |
|
Mississippi |
$185,585 |
$173,604 |
$186,766 |
|
Missouri |
$240,375 |
$231,625 |
$229,843 |
|
Montana |
$46,217 |
$46,010 |
$45,946 |
|
Nebraska |
$70,623 |
$66,781 |
$61,859 |
|
Nevada |
$119,835 |
$106,453 |
$121,850 |
|
New Hampshire |
$43,219 |
$43,216 |
$43,136 |
|
New Jersey |
$343,587 |
$443,534 |
$392,777 |
|
New Mexico |
$113,409 |
$108,159 |
$114,500 |
|
New York |
$1,137,874 |
$1,693,598 |
$1,496,680 |
|
North Carolina |
$428,562 |
$383,858 |
$434,527 |
|
North Dakota |
$36,580 |
$36,580 |
$36,580 |
|
Ohio |
$575,181 |
$549,560 |
$517,422 |
|
Oklahoma |
$161,050 |
$140,925 |
$163,252 |
|
Oregon |
$146,714 |
$139,792 |
$137,942 |
|
Pennsylvania |
$575,866 |
$572,717 |
$522,208 |
|
Puerto Rico |
$408,720 |
$386,580 |
$408,432 |
|
Rhode Island |
$50,469 |
$54,824 |
$50,462 |
|
South Carolina |
$239,695 |
$226,918 |
$230,656 |
|
South Dakota |
$44,665 |
$44,665 |
$44,665 |
|
Tennessee |
$301,750 |
$272,353 |
$306,268 |
|
Texas |
$1,378,482 |
$1,265,350 |
$1,398,914 |
|
Utah |
$87,840 |
$72,622 |
$89,245 |
|
Vermont |
$35,332 |
$35,332 |
$35,332 |
|
Virginia |
$262,980 |
$248,061 |
$228,254 |
|
Washington |
$230,477 |
$219,550 |
$211,727 |
|
West Virginia |
$89,625 |
$85,800 |
$80,914 |
|
Wisconsin |
$216,376 |
$205,478 |
$191,792 |
|
Wyoming |
$34,756 |
$34,756 |
$34,756 |
Source: Table prepared by the Congressional Research Service (CRS) based on unpublished data provided by the U.S. Department of Education (ED), Budget Service. FY2016 Title I-A grants under current law were calculated by ED. All other estimates were calculated by CRS.
Notes: Details may not add to totals due to rounding. An expenditure factor equal to 50% of state APPE corresponds to the expenditure factor that was originally included in the Title I-A formulas. An expenditure factor equal to 50% of the greater of state or national APPE corresponds to the expenditure factor used to determine FY1968 through FY1974 Title I-A grants. Under current law, the expenditure factor for all four Title I-A formulas is equal to state APPE for public elementary and secondary education, subject to a minimum and a maximum percentage of the national average, further multiplied by 0.40. State APPE is subject to a minimum of 80% and a maximum of 120% of the national APPE for Basic Grants, Concentration Grants, and Targeted Grants. If a state's APPE is less than 80% of the national APPE, the state's APPE is automatically raised to 80% of the national APPE. If a state's APPE is more than 120% of the national APPE, the state's APPE is automatically reduced to 120% of the national APPE. For EFIG, the minimum and maximum thresholds for state APPE relative to national APPE are 85% and 115%, respectively. After adjustments, should they be needed, a state's APPE is multiplied by 0.40, as specified in statute.
Notice: These are estimated grants only. These estimates are provided solely to assist in an examination of various Title I-A formula factors and provisions. They are not intended to predict specific amounts states or LEAs will receive. In addition, while the elimination of a provision may not result in a large change in a state's grant amount, the change in an LEA's grant amount could be more substantial.
Table A-7. Estimated FY2016 Title I-A Grants to States Assuming the Expenditure Factor Was Calculated (1) Under Current Law, (2) Assuming All Funds Are Allocated via Basic Grants Only, and (3) Assuming All Funds Are Allocated via Basic Grants and Concentration Grants Only
|
FY2016 Grant Under Current Law |
Estimated FY2016 Grant Assuming All Funds Are Allocated via Basic Grants Only |
Estimated FY2016 Grant Assuming All Funds Are Allocated via Basic Grants and Concentration Grants Only |
||||
|
State |
Total Title I-A Grant (Dollars in Thousands) |
Grant Per Formula Child |
Total Title I-A Grant (Dollars in Thousands) |
Grant Per Formula Child |
Total Title I-A Grant (Dollars in Thousands) |
Grant Per Formula Child |
|
Alabama |
$237,845 |
$1,130 |
$230,914 |
$1,090 |
$235,594 |
$1,120 |
|
Alaska |
$41,704 |
$2,110 |
$41,523 |
$2,100 |
$40,061 |
$2,030 |
|
Arizona |
$333,848 |
$1,140 |
$329,386 |
$1,120 |
$332,332 |
$1,130 |
|
Arkansas |
$156,673 |
$1,240 |
$157,250 |
$1,240 |
$159,749 |
$1,260 |
|
California |
$1,768,117 |
$1,200 |
$1,764,493 |
$1,200 |
$1,779,878 |
$1,210 |
|
Colorado |
$150,815 |
$1,100 |
$156,524 |
$1,140 |
$152,050 |
$1,110 |
|
Connecticut |
$122,857 |
$1,520 |
$131,764 |
$1,630 |
$126,380 |
$1,560 |
|
Delaware |
$47,272 |
$1,810 |
$44,551 |
$1,700 |
$43,264 |
$1,650 |
|
District of Columbia |
$44,254 |
$1,970 |
$44,146 |
$1,960 |
$43,200 |
$1,920 |
|
Florida |
$813,175 |
$1,200 |
$732,055 |
$1,080 |
$749,205 |
$1,100 |
|
Georgia |
$523,928 |
$1,150 |
$500,367 |
$1,100 |
$510,608 |
$1,120 |
|
Hawaii |
$53,450 |
$1,660 |
$47,754 |
$1,490 |
$49,415 |
$1,540 |
|
Idaho |
$58,210 |
$1,050 |
$59,714 |
$1,070 |
$60,334 |
$1,080 |
|
Illinois |
$667,177 |
$1,610 |
$719,417 |
$1,740 |
$712,493 |
$1,720 |
|
Indiana |
$258,773 |
$1,130 |
$270,551 |
$1,190 |
$269,359 |
$1,180 |
|
Iowa |
$95,239 |
$1,220 |
$99,956 |
$1,280 |
$97,314 |
$1,250 |
|
Kansas |
$110,459 |
$1,220 |
$115,917 |
$1,280 |
$113,837 |
$1,260 |
|
Kentucky |
$214,924 |
$1,220 |
$213,731 |
$1,210 |
$216,629 |
$1,230 |
|
Louisiana |
$290,018 |
$1,370 |
$283,475 |
$1,340 |
$289,472 |
$1,370 |
|
Maine |
$52,575 |
$1,600 |
$52,666 |
$1,600 |
$52,526 |
$1,600 |
|
Maryland |
$219,633 |
$1,690 |
$205,668 |
$1,580 |
$205,469 |
$1,580 |
|
Massachusetts |
$233,674 |
$1,560 |
$246,567 |
$1,640 |
$239,675 |
$1,600 |
|
Michigan |
$491,739 |
$1,420 |
$522,500 |
$1,500 |
$518,052 |
$1,490 |
|
Minnesota |
$164,558 |
$1,280 |
$174,316 |
$1,350 |
$166,001 |
$1,290 |
|
Mississippi |
$185,585 |
$1,180 |
$187,659 |
$1,190 |
$189,871 |
$1,210 |
|
Missouri |
$240,375 |
$1,190 |
$251,600 |
$1,250 |
$251,741 |
$1,250 |
|
Montana |
$46,217 |
$1,530 |
$44,551 |
$1,470 |
$43,511 |
$1,440 |
|
Nebraska |
$70,623 |
$1,370 |
$71,282 |
$1,380 |
$70,495 |
$1,370 |
|
Nevada |
$119,835 |
$1,200 |
$108,396 |
$1,090 |
$109,816 |
$1,100 |
|
New Hampshire |
$43,219 |
$1,910 |
$44,213 |
$1,950 |
$41,282 |
$1,820 |
|
New Jersey |
$343,587 |
$1,550 |
$365,388 |
$1,650 |
$353,704 |
$1,600 |
|
New Mexico |
$113,409 |
$1,180 |
$112,261 |
$1,170 |
$113,689 |
$1,180 |
|
New York |
$1,137,874 |
$1,710 |
$1,133,918 |
$1,710 |
$1,125,158 |
$1,700 |
|
North Carolina |
$428,562 |
$1,130 |
$408,207 |
$1,080 |
$419,010 |
$1,110 |
|
North Dakota |
$36,580 |
$2,440 |
$36,725 |
$2,450 |
$34,594 |
$2,310 |
|
Ohio |
$575,181 |
$1,400 |
$594,533 |
$1,450 |
$589,950 |
$1,430 |
|
Oklahoma |
$161,050 |
$1,090 |
$162,113 |
$1,090 |
$162,886 |
$1,100 |
|
Oregon |
$146,714 |
$1,210 |
$148,452 |
$1,220 |
$149,487 |
$1,230 |
|
Pennsylvania |
$575,866 |
$1,590 |
$602,785 |
$1,670 |
$591,618 |
$1,640 |
|
Puerto Rico |
$408,720 |
$1,220 |
$397,570 |
$1,180 |
$397,570 |
$1,180 |
|
Rhode Island |
$50,469 |
$1,650 |
$52,020 |
$1,700 |
$50,766 |
$1,660 |
|
South Carolina |
$239,695 |
$1,210 |
$231,993 |
$1,170 |
$237,862 |
$1,200 |
|
South Dakota |
$44,665 |
$1,800 |
$44,551 |
$1,790 |
$42,198 |
$1,700 |
|
Tennessee |
$301,750 |
$1,130 |
$289,894 |
$1,090 |
$295,381 |
$1,110 |
|
Texas |
$1,378,482 |
$1,140 |
$1,340,397 |
$1,110 |
$1,354,713 |
$1,120 |
|
Utah |
$87,840 |
$1,060 |
$88,531 |
$1,070 |
$86,311 |
$1,040 |
|
Vermont |
$35,332 |
$2,640 |
$35,026 |
$2,610 |
$33,764 |
$2,520 |
|
Virginia |
$262,980 |
$1,290 |
$272,377 |
$1,340 |
$269,089 |
$1,320 |
|
Washington |
$230,477 |
$1,230 |
$237,097 |
$1,270 |
$234,901 |
$1,250 |
|
West Virginia |
$89,625 |
$1,410 |
$88,963 |
$1,400 |
$91,016 |
$1,430 |
|
Wisconsin |
$216,376 |
$1,350 |
$226,012 |
$1,410 |
$220,776 |
$1,380 |
|
Wyoming |
$34,756 |
$2,650 |
$35,040 |
$2,670 |
$32,708 |
$2,490 |
Source: Table prepared by the Congressional Research Service (CRS) based on unpublished data provided by the U.S. Department of Education (ED), Budget Service. FY2016 Title I-A grants under current law were calculated by ED. All other estimates were calculated by CRS.
Notes: Details may not add to totals due to rounding.
Notice: These are estimated grants only. These estimates are provided solely to assist in an examination of various Title I-A formula factors and provisions. They are not intended to predict specific amounts states or LEAs will receive. In addition, while the elimination of a provision may not result in a large change in a state's grant amount, the change in an LEA's grant amount could be more substantial.
Appendix B. Targeting of Title I-A Funds to Areas with High Numbers of Formula Children
The targeting analysis included in this report focuses on the targeting of Title I-A funds to LEAs with high percentages of formula children. Examining the targeting of Title I-A funds to LEAs with relatively high numbers of formula children indicates a similar pattern: the addition of Concentration Grants, Targeted Grants, and EFIG to Basic Grants has resulted in more effective targeting of Title I-A funds on concentrations of formula children, a proxy for concentrations of poverty.57
Table B-1 shows the targeting of FY2016 Title I-A funds to LEAs under each of the four Title I-A formulas using five formula child count ranges. For each formula, Table B-1 indicates the share of Title I-A funds under current law provided to each formula child count range.58 The formula child count ranges were calculated in the same manner as the formula child rate ranges discussed previously: CRS divided LEAs into five groups or ranges based on their formula child counts. Each range contains 20% of the formula children used to determine FY2016 grant amounts (i.e., approximately the same number of formula children, but not necessarily the same number of LEAs, is included in each range). Thus, if an equal amount of funding were allocated per formula child, each range would receive 20% of funds.59 If there were targeting of Title I-A funds on concentrations of formula children then ranges containing LEAs with higher formula child counts would receive a larger share of funding.
The Basic Grant formula is the least effective formula at targeting funds on concentrations of formula children. In FY2016, LEAs with the lowest formula child counts (1st and 2nd ranges) received 41.69% of funds while LEAs with the highest formula child counts (4th and 5th ranges) received 39.03% of funds. LEAs in the 4th range received the smallest share of Title I-A funds (19.13%). This distribution indicates that there is little targeting of Basic Grants to LEAs on the basis of having higher formula child counts.
The distribution of funds under the Concentration Grant, Targeted Grant, and EFIG formulas is somewhat different than Basic Grants. Under each of these formulas, the share of funding increases as formula child counts increase. Under Concentration Grants, the share of funds spanned from 17.32% for LEAs in the 1st range to 22.72% for LEAs in the 5th range. Under Targeted Grants, the share of funds spanned from 15.41% for LEAs in the 1st range to 27.53% for LEAs in the 5th range. Similarly, under EFIG LEAs in the 1st range received 14.85% of funds while LEAs in the 5th range received 27.98% of funds.
While this distribution of funds indicates that the Concentration Grant, Targeted Grant, and EFIG formulas all target funds to LEAs with higher counts of formula children, the Targeted Grant and EFIG formulas appear to target funds more effectively than Concentration Grants. This is demonstrated in the distribution of funds across the ranges—LEAs with the highest formula child counts received a larger share of funds and LEAs with the lowest formula child counts received a smaller share of funds under Targeted Grants and EFIG as compared to Concentration Grants. Under Concentration Grants, LEAs with the lowest formula child counts (1st and 2nd ranges) received 36.16% of funds while LEAs with the highest formula child counts (4th and 5th ranges) received 44.34% of funds. Under Targeted Grants, LEAs with the lowest formula child counts (1st and 2nd ranges) received 31.87% of funds while LEAs with the highest formula child counts (4th and 5th ranges) received 49.69% of funds. Under EFIG, LEAs with the lowest formula child counts (1st and 2nd ranges) received 31.00% of funds while LEAs with the highest formula child counts (4th and 5th ranges) received 50.85% of funds.
Table B-1. Targeting of FY2016 Title I-A Funds to LEAs Under Current Law Based on Formula Child Counts for Each of the Title I-A Formulas
|
Formula Child Count Range |
|||||
|
Below 823 |
Between 823 |
Between 2,633 |
Between 7,677 |
At Least 25,577 |
|
|
Share of Total |
18.22% |
18.09% |
18.83% |
20.97% |
23.90% |
|
Share of |
21.80% |
19.89% |
19.28% |
19.13% |
19.91% |
|
Share of |
17.32% |
18.84% |
19.50% |
21.62% |
22.72% |
|
Share of |
15.41% |
16.47% |
18.43% |
22.16% |
27.53% |
|
Share of |
14.85% |
16.15% |
18.15% |
22.87% |
27.98% |
Source: Table prepared by the Congressional Research Service (CRS) based on unpublished data from the U.S. Department of Education, Budget Service.
Notes: Each of the five formula child count ranges contains 20% of the national total of formula children included in the determination of FY2016 Title I-A grants under current law (i.e., each range contains the same number of formula children, but not necessarily the same number of LEAs). Thus, if an equal amount of funding were allocated per formula child, each range would receive 20% of Title I-A funds.
Appendix C. Title I-A Appropriations
Annual appropriations bills specify portions of each year's Title I-A appropriation to be allocated to LEAs and states under each of the Title I-A formulas. In FY2017, about 42% of Title I-A appropriations will be allocated through the Basic Grant formula, 9% through the Concentration Grant formula, and 25% through each of the Targeted Grant and EFIG formulas. Once funds reach LEAs, the amounts allocated under the four formulas are combined and used jointly.
Table C-1 provides the appropriations level for Title I-A in current and constant dollars since FY1980. Following a decrease in the early 1980s, there has generally been an upward trend in Title I-A appropriations. The largest percentage increases since FY1980 occurred in the early 1990s and 2000s.
Table C-2 provides the appropriations level and share by Title I-A formula since FY1980. As previously discussed, all post-FY2001 increases in Title I-A appropriations have been divided between Targeted Grants and EFIG. Thus, the share of appropriations allocated via the Targeted Grant and EFIG formulas has been steadily increasing while the share of appropriations allocated via the Basic Grant and Concentration Grant formulas has been steadily decreasing.60
|
Current Dollars |
Constant FY2017 Dollars |
|||||
|
Fiscal Year |
Appropriations Level |
Difference from Prior Year |
Percentage Difference from Prior Year |
Appropriations Level |
Difference from Prior Year |
Percentage Difference from Prior Year |
|
1980 |
$2,731,651 |
― |
― |
$8,113,169 |
― |
― |
|
1981 |
$2,611,317 |
-$120,334 |
-4.41% |
$7,030,533 |
-$1,082,636 |
-13.34% |
|
1982 |
$2,562,753 |
-$48,564 |
-1.86% |
$6,499,381 |
-$531,152 |
-7.55% |
|
1983 |
$2,727,588 |
$164,835 |
6.43% |
$6,702,116 |
$202,736 |
3.12% |
|
1984 |
$3,003,680 |
$276,092 |
10.12% |
$7,075,069 |
$372,952 |
5.56% |
|
1985 |
$3,200,000 |
$196,320 |
6.54% |
$7,278,305 |
$203,236 |
2.87% |
|
1986 |
$3,062,400 |
-$137,600 |
-4.30% |
$6,838,233 |
-$440,072 |
-6.05% |
|
1987 |
$3,453,500 |
$391,100 |
12.77% |
$7,440,012 |
$601,779 |
8.80% |
|
1988 |
$3,829,600 |
$376,100 |
10.89% |
$7,922,481 |
$482,468 |
6.48% |
|
1989 |
$4,026,100 |
$196,500 |
5.13% |
$7,946,125 |
$23,644 |
0.30% |
|
1990 |
$4,768,258 |
$742,158 |
18.43% |
$8,928,463 |
$982,338 |
12.36% |
|
1991 |
$5,557,678 |
$789,420 |
16.56% |
$9,986,397 |
$1,057,934 |
11.85% |
|
1992 |
$6,134,240 |
$576,562 |
10.37% |
$10,700,292 |
$713,895 |
7.15% |
|
1993 |
$6,125,923 |
-$8,317 |
-0.14% |
$10,375,194 |
-$325,098 |
-3.04% |
|
1994 |
$6,336,000 |
$210,077 |
3.43% |
$10,463,079 |
$87,885 |
0.85% |
|
1995 |
$6,698,356 |
$362,356 |
5.72% |
$10,756,619 |
$293,540 |
2.81% |
|
1996 |
$6,730,348 |
$31,992 |
0.48% |
$10,498,013 |
-$258,606 |
-2.40% |
|
1997 |
$7,295,232 |
$564,884 |
8.39% |
$11,123,888 |
$625,875 |
5.96% |
|
1998 |
$7,375,232 |
$80,000 |
1.10% |
$11,073,391 |
-$50,497 |
-0.45% |
|
1999 |
$7,732,397 |
$357,165 |
4.84% |
$11,358,780 |
$285,389 |
2.58% |
|
2000 |
$7,941,397 |
$209,000 |
2.70% |
$11,286,422 |
-$72,358 |
-0.64% |
|
2001 |
$8,762,721 |
$821,324 |
10.34% |
$12,109,130 |
$822,708 |
7.29% |
|
2002 |
$10,350,000 |
$1,587,279 |
18.11% |
$14,079,970 |
$1,970,839 |
16.28% |
|
2003 |
$11,688,664 |
$1,338,664 |
12.93% |
$15,546,749 |
$1,466,779 |
10.42% |
|
2004 |
$12,342,309 |
$653,645 |
5.59% |
$15,990,314 |
$443,565 |
2.85% |
|
2005 |
$12,739,571 |
$397,262 |
3.22% |
$15,964,124 |
-$26,190 |
-0.16% |
|
2006 |
$12,713,125 |
-$26,446 |
-0.21% |
$15,433,141 |
-$530,983 |
-3.33% |
|
2007 |
$12,838,125 |
$125,000 |
0.98% |
$15,153,287 |
-$279,854 |
-1.81% |
|
2008 |
$13,898,875 |
$1,060,750 |
8.26% |
$15,798,727 |
$645,440 |
4.26% |
|
2009a |
$14,492,401 |
$593,526 |
4.27% |
$16,532,201 |
$733,474 |
4.64% |
|
2010 |
$14,492,401 |
$0 |
0.00% |
$16,265,403 |
-$266,798 |
-1.61% |
|
2011 |
$14,442,927 |
-$49,474 |
-0.34% |
$15,713,864 |
-$551,539 |
-3.39% |
|
2012 |
$14,516,457 |
$73,530 |
0.51% |
$15,473,645 |
-$240,219 |
-1.53% |
|
2013 |
$13,760,219 |
-$756,238 |
-5.21% |
$14,455,799 |
-$1,017,846 |
-6.58% |
|
2014 |
$14,384,802 |
$624,583 |
4.54% |
$14,870,724 |
$422,854 |
2.93% |
|
2015 |
$14,409,802 |
$25,000 |
0.17% |
$14,878,908 |
$39,332 |
0.26% |
|
2016 |
$14,909,802 |
$500,000 |
3.47% |
$15,203,392 |
$309,695 |
2.08% |
|
2017 |
$15,459,802 |
$550,000 |
3.69% |
$15,459,802 |
$177,249 |
1.17% |
Source: Table prepared by the Congressional Research Service (CRS) based on data available from the U.S. Department of Education, Budget Service. Appropriations levels in constant FY2017 dollars were calculated by CRS based on the Consumer Price Index for All Urban Consumers (CPI-U), available from the U.S. Department of Labor, Bureau of Labor Statistics. For 2017, May 2017 data were used.
Notes: Title I-A has been funded since FY1966. However, a consistent source of appropriations data is only available for FY1980 onward (the year in which ED was created). Thus, fiscal years prior to FY1980 were not included in this analysis.
a. Does not include the additional $10 billion for Title I-A appropriated through the American Recovery and Reinvestment Act (ARRA; P.L. 111-5).
|
Fiscal Year |
Appropriations Level or Share of Total Appropriations |
Basic Grants |
Concentration Grants |
Targeted Grants |
Education Finance Incentive Grants (EFIG) |
|
1980 |
Appropriations |
$2,633,326 |
$98,325 |
― |
― |
|
Share of Total |
96.40% |
3.60% |
― |
― |
|
|
1981 |
Appropriations |
$2,511,317 |
$100,000 |
― |
― |
|
Share of Total |
96.17% |
3.83% |
― |
― |
|
|
1982 |
Appropriations |
$2,562,753 |
― |
― |
― |
|
Share of Total |
100.00% |
― |
― |
― |
|
|
1983 |
Appropriations |
$2,727,588 |
― |
― |
― |
|
Share of Total |
100.00% |
― |
― |
― |
|
|
1984 |
Appropriations |
$3,003,680 |
― |
― |
― |
|
Share of Total |
100.00% |
― |
― |
― |
|
|
1985 |
Appropriations |
$3,200,000 |
― |
― |
― |
|
Share of Total |
100.00% |
― |
― |
― |
|
|
1986 |
Appropriations |
$3,062,400 |
― |
― |
― |
|
Share of Total |
100.00% |
― |
― |
― |
|
|
1987 |
Appropriations |
$3,453,500 |
― |
― |
― |
|
Share of Total |
100.00% |
― |
― |
― |
|
|
1988 |
Appropriations |
$3,829,600 |
― |
― |
― |
|
Share of Total |
100.00% |
― |
― |
― |
|
|
1989 |
Appropriations |
$3,853,200 |
$172,900 |
― |
― |
|
Share of Total |
95.71% |
4.29% |
― |
― |
|
|
1990 |
Appropriations |
$4,373,146 |
$395,112 |
― |
― |
|
Share of Total |
91.71% |
8.29% |
― |
― |
|
|
1991 |
Appropriations |
$5,001,910 |
$555,768 |
― |
― |
|
Share of Total |
90.00% |
10.00% |
― |
― |
|
|
1992 |
Appropriations |
$5,524,310 |
$609,930 |
― |
― |
|
Share of Total |
90.06% |
9.94% |
― |
― |
|
|
1993 |
Appropriations |
$5,449,925 |
$675,998 |
― |
― |
|
Share of Total |
88.96% |
11.04% |
― |
― |
|
|
1994 |
Appropriations |
$5,642,000 |
$694,000 |
― |
― |
|
Share of Total |
89.05% |
10.95% |
― |
― |
|
|
1995 |
Appropriations |
$6,028,521 |
$669,835 |
― |
― |
|
Share of Total |
90.00% |
10.00% |
― |
― |
|
|
1996 |
Appropriations |
$6,046,266 |
$684,082 |
― |
― |
|
Share of Total |
89.84% |
10.16% |
― |
― |
|
|
1997 |
Appropriations |
$6,273,212 |
$1,022,020 |
― |
― |
|
Share of Total |
85.99% |
14.01% |
― |
― |
|
|
1998 |
Appropriations |
$6,273,212 |
$1,102,020 |
― |
― |
|
Share of Total |
85.06% |
14.94% |
― |
― |
|
|
1999 |
Appropriations |
$6,574,000 |
$1,158,397 |
― |
― |
|
Share of Total |
85.02% |
14.98% |
― |
― |
|
|
2000 |
Appropriations |
$6,783,000 |
$1,158,397 |
― |
― |
|
Share of Total |
85.41% |
14.59% |
― |
― |
|
|
2001 |
Appropriations |
$7,397,690 |
$1,365,031 |
― |
― |
|
Share of Total |
84.42% |
15.58% |
― |
― |
|
|
2002 |
Appropriations |
$7,172,971 |
$1,365,031 |
$1,018,499 |
$793,499 |
|
Share of Total |
69.30% |
13.19% |
9.84% |
7.67% |
|
|
2003 |
Appropriations |
$7,111,635 |
$1,365,031 |
$1,670,239 |
$1,541,759 |
|
Share of Total |
60.84% |
11.68% |
14.29% |
13.19% |
|
|
2004 |
Appropriations |
$7,037,592 |
$1,365,031 |
$1,969,843 |
$1,969,843 |
|
Share of Total |
57.02% |
11.06% |
15.96% |
15.96% |
|
|
2005 |
Appropriations |
$6,934,854 |
$1,365,031 |
$2,219,843 |
$2,219,843 |
|
Share of Total |
54.44% |
10.71% |
17.42% |
17.42% |
|
|
2006 |
Appropriations |
$6,808,408 |
$1,365,031 |
$2,269,843 |
$2,269,843 |
|
Share of Total |
53.55% |
10.74% |
17.85% |
17.85% |
|
|
2007 |
Appropriations |
$6,808,408 |
$1,365,031 |
$2,332,343 |
$2,332,343 |
|
Share of Total |
53.03% |
10.63% |
18.17% |
18.17% |
|
|
2008 |
Appropriations |
$6,597,946 |
$1,365,031 |
$2,967,949 |
$2,967,949 |
|
Share of Total |
47.47% |
9.82% |
21.35% |
21.35% |
|
|
2009a |
Appropriations |
$6,597,946 |
$1,365,031 |
$3,264,712 |
$3,264,712 |
|
Share of Total |
45.53% |
9.42% |
22.53% |
22.53% |
|
|
2010 |
Appropriations |
$6,597,946 |
$1,365,031 |
$3,264,712 |
$3,264,712 |
|
Share of Total |
45.53% |
9.42% |
22.53% |
22.53% |
|
|
2011 |
Appropriations |
$6,579,151 |
$1,359,726 |
$3,252,025 |
$3,252,025 |
|
Share of Total |
45.55% |
9.41% |
22.52% |
22.52% |
|
|
2012 |
Appropriations |
$6,577,904 |
$1,362,301 |
$3,288,126 |
$3,288,126 |
|
Share of Total |
45.31% |
9.38% |
22.65% |
22.65% |
|
|
2013 |
Appropriations |
$6,232,639 |
$1,293,919 |
$3,116,831 |
$3,116,831 |
|
Share of Total |
45.29% |
9.40% |
22.65% |
22.65% |
|
|
2014 |
Appropriations |
$6,459,401 |
$1,362,301 |
3,281,550 |
3,281,550 |
|
Share of Total |
44.90% |
9.47% |
22.81% |
22.81% |
|
|
2015 |
Appropriations |
$6,459,401 |
$1,362,301 |
$3,294,050 |
$3,294,050 |
|
Share of Total |
44.83% |
9.45% |
22.86% |
22.86% |
|
|
2016 |
Appropriations |
$6,459,401 |
$1,362,301 |
$3,544,050 |
$3,544,050 |
|
Share of Total |
43.32% |
9.14% |
23.77% |
23.77% |
|
|
2017 |
Appropriations |
$6,459,401 |
$1,362,301 |
$3,819,050 |
$3,819,050 |
|
Share of Total |
41.78% |
8.81% |
24.70% |
24.70% |
Source: Table prepared by the Congressional Research Service (CRS) based on data available from the U.S. Department of Education, Budget Service.
Notes: Appropriations provided in current (not constant) dollars. Percentages based on unrounded numbers. Title I-A has been funded since FY1966. However, a consistent source of appropriations data is only available for FY1980 onward (the year in which ED was created). Thus, fiscal years prior to FY1980 were not included in this analysis. NCLB required that all funds in excess of the FY2001 appropriations levels for the Basic Grant and Concentration Grant formulas be provided to Targeted Grant and EFIG formulas. The statutory language did not specify how the excess funds should be divided between the two formulas. Rather, these decisions have been made through the appropriations process. In addition, while the statutory language references the FY2001 funding levels for the Basic Grant and Concentration Grant formulas, appropriations for these formulas are currently below their FY2001 levels. In practice, since FY2002 the Targeted Grant and EFIG formulas have received all funds in excess of the amount actually appropriated for the Basic Grant and Concentration Grant formulas. For FY2002 and FY2003, two-thirds of these funds were provided to the Targeted Grant formula and one-third of the funds were provided to the EFIG formula. Beginning in FY2004, these funds were divided evenly between the Targeted Grant and EFIG formulas. Beginning in FY2017, the ESSA requires that all funds in excess of the FY2001 appropriations levels for Basic Grants and Concentration Grants be divided evenly between the Targeted Grant and EFIG formulas. If appropriations for the Basic Grant and Concentration Grant formulas remain below their FY2001 levels, it is possible that the Targeted Grant and EFIG formulas will each continue to receive half of the Title I-A appropriations in excess of what is provided for the Basic Grant and Concentration Grant formulas.
a. Does not include the additional $10 billion for Title I-A appropriated through the American Recovery and Reinvestment Act (ARRA; P.L. 111-5).
Appendix D. Impact of Different Formula Factors on Grant Amounts
Table D-1 and Table D-2 show the variance in Title I-A grant amounts explained by the different Title I-A formula factors. More specifically, Table D-1 and Table D-2 present information from regression analyses but look at the R squared values for each factor individually. As previously discussed, under the Basic Grant, Concentration Grant, and Targeted Grant formulas, funds are initially calculated at the LEA level, and state total grants are the total of allocations for LEAs in the state, adjusted to apply state minimum grant provisions. Under the EFIG formula, allocations are first calculated for each state overall, with state totals subsequently suballocated to LEAs using a different formula. Thus, for the purposes of this analysis, grants under the EFIG formula are examined at the state level while grants under the other three formulas are examined at the LEA level.
Table D-1 shows the R squared values for LEA grant amounts based on LEA formula child counts and the state expenditure factor for Basic Grants, Concentration Grants, and Targeted Grants, as well as for overall LEA Title I-A grant amounts. Table D-2 provides R squared values for state level grants under the EFIG formula based on state formula child counts, state APPE, the state effort factor, and the state equity factor. For each grant amount, each formula factor is examined individually. For example, the R squared values for formula child counts were determined by regressing Title I-A grant amounts on only formula child counts. Thus, the R squared value reflects the variance in Title I-A grant amounts explained solely by formula child counts.
Table D-1. Variance in Title I-A Grants to LEAs Explained by Each Formula Factor Included in the Basic Grant, Concentration Grant, and Targeted Grant Formulas
R Squared Values
|
Total Title I-A Grants |
Basic |
Concentration Grants |
Targeted Grants |
|
|
Formula Child Count |
0.9505 |
0.9752 |
0.9770 |
0.9090 |
|
Average Per Pupil Expenditures (APPE) |
0.0004 |
0.0005 |
0.0000 |
0.0001 |
Source: Table prepared by the Congressional Research Service (CRS) based on unpublished data provided by the U.S. Department of Education (ED), Budget Service.
Notes: R squared values were calculated by regressing FY2016 grant amounts on a single formula factor. Only LEAs receiving Title I-A funds were included in this analysis. Unweighted formula child counts were used in this analysis.
Table D-2. Variance in Title I-A State Grant Amounts Explained by Each Formula Factor Included in the Education Finance Incentive Grant (EFIG) Formula
R Squared Values
|
State Grants |
|
|
Formula Child Count |
0.9710 |
|
Average Per Pupil Expenditures (APPE) |
0.0062 |
|
Effort Factor |
0.0320 |
|
Equity Factor |
0.0006 |
Source: Table prepared by the Congressional Research Service (CRS) based on unpublished data provided by the U.S. Department of Education (ED), Budget Service.
Notes: R squared values were calculated by regressing FY2016 EFIG amounts on a single formula factor. As previously discussed, formula child counts are unweighted in the determination of state grants. Thus, the formula child counts included in this analysis were unweighted. State formula child counts are the sum of formula child counts for all LEAs in the state receiving a grant under the EFIG formula (i.e., formula child counts for LEAs not receiving funds under EFIG were not included in state totals).
Appendix E. Selected Acronyms Used in This Report
AFDC: Aid to Families with Dependent Children
APPE: Average per pupil expenditures
ARRA: American Recovery and Reinvestment Act
BIA: Bureau of Indian Affairs
BIE: Bureau of Indian Education
ED: U.S. Department of Education
EFIG: Education Finance Incentive Grants
ESEA: Elementary and Secondary Education Act
ESSA: Every Student Succeeds Act
LEA: Local educational agency
NCLB: No Child Left Behind Act
NDEA: National Defense Education Act
NIE: National Institute of Education
SAIPE: Small Area Income and Poverty Estimates
SEA: State educational agency
TANF: Temporary Assistance to Needy Families
Author Contact Information
Footnotes
| 1. |
For more information on the ESSA, see CRS Report R44297, Reauthorization of the Elementary and Secondary Education Act: Highlights of the Every Student Succeeds Act, by [author name scrubbed] and [author name scrubbed]. |
| 2. |
For more information on the allocation patterns for each formula, see CRS Report R44486, FY2016 State Grants Under Title I-A of the Elementary and Secondary Education Act (ESEA), by [author name scrubbed] and [author name scrubbed], or CRS Report R44873, FY2017 State Grants Under Title I-A of the Elementary and Secondary Education Act (ESEA), by [author name scrubbed] and [author name scrubbed]. |
| 3. |
For a detailed discussion of the Title I-A formulas under current law, see CRS Report R44461, Allocation of Funds Under Title I-A of the Elementary and Secondary Education Act, by [author name scrubbed] and [author name scrubbed]. |
| 4. |
While Title I-A grants are always discussed in terms of grants to LEAs, in practice grants were calculated at the county level under all Title I-A formulas until FY1999, when LEA-level data became available. |
| 5. |
Although the reasons for considering APPE in the allocation formula(s) have expanded over time, the initial reason for including an expenditure factor based on APPE was to compensate states where the cost of educating a child was higher and states with a higher cost of living. For a more comprehensive discussion of the use of APPE in the formulas over time, see CRS Report R44898, History of the ESEA Title I-A Formulas, by [author name scrubbed] and [author name scrubbed]. |
| 6. |
While the Special Incentive Grant formula last received appropriations in FY1975, it was authorized through FY1988. |
| 7. |
For example, the authorization of appropriations for the Title I-A program expired in FY2008 and the ESEA was not reauthorized until December 10, 2015. However, during this time all four Title I-A formulas (Basic Grants, Concentration Grants, Targeted Grants, and EFIG) continued to receive annual appropriations and were considered implicitly authorized. |
| 8. |
The formula child population used to determine Title I-A grants for the 50 states, the District of Columbia, and Puerto Rico consists of children ages 5 to 17 (1) in poor families, according to estimates for LEAs from the Census Bureau's Small Area Income and Poverty Estimates (SAIPE) program; (2) in institutions for neglected or delinquent children or in foster homes; and (3) in families receiving Temporary Assistance for Needy Families (TANF) payments above the poverty income level for a family of four. Children in poor families account for about 98% of the total formula child count. Each element of the formula child count is updated annually. |
| 9. |
The expenditure factor for all four Title I-A formulas is equal to state APPE for public elementary and secondary education, subject to a minimum and a maximum percentage of the national average, further multiplied by 0.40. State APPE is subject to a minimum of 80% and a maximum of 120% of the national APPE for Basic Grants, Concentration Grants, and Targeted Grants. That is, if a state's APPE is less than 80% of the national APPE, the state's APPE is automatically raised to 80% of the national APPE. If a state's APPE is more than 120% of the national APPE, the state's APPE is automatically reduced to 120% of the national APPE. For EFIG, the minimum and maximum thresholds for state APPE relative to national APPE are 85% and 115%, respectively. After adjustments, should they be needed, a state's APPE is multiplied by 0.40, as specified in statute. |
| 10. |
For a more detailed description of how the state minimum grant provisions are applied, see CRS Report R44461, Allocation of Funds Under Title I-A of the Elementary and Secondary Education Act, by [author name scrubbed] and [author name scrubbed]. |
| 11. |
In other words, no attention is devoted to the possible effects of adjusting or removing these thresholds. Analyses presented here are focused on examining the formulas as they are currently designed, not examining the effects of altering factors or design elements. While congressional interest does surface regarding potential ways to distribute funds across all formula children without regard to concentrations of such children within districts, that would require a different approach to allocation than the current formulas take. |
| 12. |
For more information, see CRS Report R44898, History of the ESEA Title I-A Formulas, by [author name scrubbed] and [author name scrubbed]. |
| 13. |
Regression analysis is a method of explaining or predicting the variability of a "dependent" or "response" variable (e.g., LEA grant amounts) using information about one or more "independent" or "predictor" variables (e.g., formula child counts, APPE). It attempts to answer the question "what values in the response variable can we expect given certain values in the predictor variables(s)?" |
| 14. |
An R-squared value shows how much of the variability of a response variable is explained or accounted for by predictor variables included in a regression model. |
| 15. |
These estimates are based on the R-Squared values calculated by CRS by regressing Title I-A grant amounts on each formula factor individually. See Appendix D for more information. |
| 16. |
For more information on the equity factor, see CRS Report R44461, Allocation of Funds Under Title I-A of the Elementary and Secondary Education Act, by [author name scrubbed] and [author name scrubbed]. |
| 17. |
Hold harmless provisions stipulate that a state's or LEA's grant amount cannot decrease by a certain percentage as compared to the prior year. For example, a 95% prior-year hold harmless for LEAs would mean that no LEA could receive less than 95% of what it received in the prior year. |
| 18. |
For more information, see CRS Report R44898, History of the ESEA Title I-A Formulas, by [author name scrubbed] and [author name scrubbed]. |
| 19. |
One reason that LEAs in states receiving minimum grants would not see a decrease in their grant amounts is because these LEAs may be receiving hold harmless amounts. |
| 20. |
Some of the LEAs benefitting from the hold harmless provisions see an increase in their funding levels when these provisions are removed. This is because these LEAs had previously had their grant amounts reduced to provide other LEAs with their hold harmless amounts. In the absence of the hold harmless provisions, the former LEAs would no longer have their grant amounts reduced to provide other LEAs with their hold harmless amounts. |
| 21. |
However, as discussed below, if the hold harmless provisions were removed, these LEAs would receive even less per formula child. |
| 22. |
Estimated grants per formula child (1) under current law, (2) assuming no state minimum grant provisions are applied, (3) assuming no LEA hold harmless provisions are applied, and (4) assuming no state minimum grant or LEA hold harmless provisions are applied are provided in Table A-1. |
| 23. |
There is no change in Wyoming's grant per formula child if only the hold harmless provisions are removed as Wyoming would continue to receive a minimum grant amount and thus its Title I-A grant amount would not change. |
| 24. |
For a more detailed discussion of the debates surrounding the Title I-A formulas, see CRS Report R44898, History of the ESEA Title I-A Formulas, by [author name scrubbed] and [author name scrubbed]. |
| 25. |
In the 1970s, formula child counts were seen as dominated by AFDC child counts and thus more favorable to urban (and typically wealthier) states, which were able to handle larger AFDC caseloads. As a result, Congress limited the count of AFDC children to two-thirds. For more information, see CRS Report R44898, History of the ESEA Title I-A Formulas, by [author name scrubbed] and [author name scrubbed]. |
| 26. |
Senator Javits, Senate debate, Congressional Record, vol. 124, part 20 (August 23, 1978), p. 27317. |
| 27. |
As these scales have not been changed since they were first used to determine grant amounts, historical comparisons cannot be done with respect to the use of other weighting scales. |
| 28. |
The ranges in current law were based on the actual distribution of the Title I-A formula children in 2001 (at the time the No Child Left Behind Act (NCLB; P.L. 107-110) was being considered). Each range in current law contains one-fifth, or 20%, of the national total of formula children according to the latest data available in 2001. For more information, see CRS Report R44461, Allocation of Funds Under Title I-A of the Elementary and Secondary Education Act, by [author name scrubbed] and [author name scrubbed]. |
| 29. |
For a more detailed discussion of how formula child counts are weighted, see CRS Report R44461, Allocation of Funds Under Title I-A of the Elementary and Secondary Education Act, by [author name scrubbed] and [author name scrubbed]. |
| 30. |
Representative Carl D. Perkins, "Providing for the Consideration of H.R. 2362, Elementary and Secondary Education Act of 1965," House debate, Congressional Record, vol. 111, part 5 (March 24, 1965), p. 5737; Senator Morse, "Elementary and Secondary Education Act of 1965," Senate debate, Congressional Record, vol. 111, part 6 (April 7, 1965), p. 7297. |
| 31. |
Representative O'Hara, "Providing for the Consideration of H.R. 2362, Elementary and Secondary Education Act of 1965," House debate, Congressional Record, vol. 111, part 5 (March 25, 1965), p. 6000. |
| 32. |
For example, during the initial consideration of the Title I- A formulas it was repeatedly noted that the 10 wealthiest counties in the Unites States were allocated almost twice as much as the 10 poorest counties; U.S. Congress, House Committee on Education and Labor, Elementary and Secondary Education Act of 1965, minority views, 89th Cong., 1st sess., March 8, 1965, H. Rept. 89-143 (Washington, DC: GPO, 1965), p. 70. |
| 33. |
Ibid., pp. 70-71. |
| 34. |
For a more detailed discussion of the debate over the expenditure factor, see CRS Report R44898, History of the ESEA Title I-A Formulas, by [author name scrubbed] and [author name scrubbed]. |
| 35. |
The expenditure factor was equal to 50% of state APPE. The percentage was reduced to 40% of state APPE (subject to a maximum and minimum, discussed below) beginning in FY1975. |
| 36. |
The aforementioned expenditure factor applies to Basic Grants, Concentration Grants, and Targeted Grants. Under the EFIG formula, the minimum and maximum thresholds for state APPE relative to national APPE are 85% and 115%, respectively. After adjustments, should they be needed, the state APPE is multiplied by 0.4, as specified in statute. |
| 37. |
In making this determination, an extra weight (1.4 versus 1.0) is applied to estimated counts of formula children. The effect of including this additional weight is that grants would be maximized for a state where expenditures per formula child are 40% higher than expenditures per non-formula child. |
| 38. |
U.S. Congress, Senate Committee on Labor and Human Resources, Improving America's Schools Act of 1994, report to accompany S. 1513, 103rd Cong., 2nd sess., June 24, 1994, S. Rept. 103-292 (Washington, DC: GPO, 1994), p.12. |
| 39. |
Senator Kassebaum, "Improving America's Schools Act of 1994—Conference Report," Senate debate, Congressional Record, vol. 140, part 20 (October 5, 1994), p. 27845. |
| 40. |
Section 201 of P.L. 89-10. |
| 41. |
Special Grants were authorized under the 1969 and 1974 amendments. These grants were similar in purpose to Concentration Grants and are considered a direct predecessor to them for purposes of this report. For more information on Special Grants, see CRS Report R44898, History of the ESEA Title I-A Formulas, by [author name scrubbed] and [author name scrubbed]. |
| 42. |
Representative Weiss, "Education Amendments of 1978," House debate, Congressional Record, vol. 124, part 15 (July 12, 1978), p. 20535. |
| 43. |
Representative Roemer, "Improving America's Schools Act of 1994," House debate, Congressional Record, vol. 140, part 3 (February 24, 1994), p. 2941. |
| 44. |
U.S. Congress, Senate Committee on Labor and Human Resources, Improving America's Schools Act of 1994, report to accompany S.1513, 103rd Cong., 2nd sess., June 24, 1994. S. Rept. 103-292 (Washington: GPO, 1994), pp.11-12. |
| 45. |
Formula child rates are used as a proxy for poverty rates because Title I-A grants are calculated using formula child counts, which are primarily based on counts of children in poor families. This analysis focuses on the targeting of Title I-A funds to LEAs with high percentages of formula children. CRS also performed analysis looking at the targeting of Title I-A funds to LEAs with high numbers of formula children and found similar results. That analysis is included in Appendix B. |
| 46. |
This is similar to the process used to calculate the population ranges to weight formula child counts under the Targeted Grant and EFIG formulas discussed previously. Using this method, each LEA is rank-ordered based on its child poverty rate, and the LEAs' formula child counts are summed together until a range is comprised of 20% of all formula children. |
| 47. |
The Concentration Grant formula was sporadically funded between FY1971 and FY1988 but was not consistently funded until FY1989. Additionally, the Special Incentive Grant formula was funded from FY1971 to FY1975. |
| 48. |
See, for example, statements from Representatives Bingham, Chisholm, Addabbo, and Biaggi in House debate, Congressional Record, vol. 120, part 5 (March 12, 1974), pp. 6302-6319. |
| 49. |
Representative Blouin and Representative Jeffords, "Education Amendments of 1978," amendment offered by Representative Blouin and Representative Jeffords, Congressional Record, vol. 124, part 15 (July 12, 1978), pp. 20562-20563. |
| 50. |
For more information, see CRS Report R44898, History of the ESEA Title I-A Formulas, by [author name scrubbed] and [author name scrubbed]. |
| 51. |
Estimated state grant amounts under each of these scenarios are provided in Table A-1. |
| 52. |
In FY2016, 7 states received a minimum grant under Basic Grants, 5 states under Concentration Grants, 12 states under Targeted Grants, and 11 states under EFIG. Only five states (Alaska, North Dakota, South Dakota, Vermont, and Wyoming) received a minimum grant under all four formulas. For information on which states received minimum grant amounts under each of the formulas for FY2016, see CRS Report R44486, FY2016 State Grants Under Title I-A of the Elementary and Secondary Education Act (ESEA), by [author name scrubbed] and [author name scrubbed]. |
| 53. |
Counts of children ages 5 to 17 living in families below the federal poverty line are based on estimates for a recent income year for LEAs from the Census Bureau's Small Area Income and Poverty Estimates (SAIPE) program. |
| 54. |
Under current law, the expenditure factor for all four Title I-A formulas is equal to state APPE for public elementary and secondary education, subject to a minimum and a maximum percentage of the national average, further multiplied by 0.40. State APPE is subject to a minimum of 80% and a maximum of 120% of the national APPE for Basic Grants, Concentration Grants, and Targeted Grants. If a state's APPE is less than 80% of the national APPE, the state's APPE is automatically raised to 80% of the national APPE. If a state's APPE is more than 120% of the national APPE, the state's APPE is automatically reduced to 120% of the national APPE. For EFIG, the minimum and maximum thresholds for state APPE relative to national APPE are 85% and 115%, respectively. After adjustments, should they be needed, a state's APPE is multiplied by 0.40, as specified in statute. |
| 55. |
The Concentration Grant formula was sporadically funded between FY1971 and FY1988 but was not consistently funded until FY1989. Additionally, the Special Incentive Grant formula was funded from FY1971 to FY1975. |
| 56. |
It should be noted that formula children are not necessarily the same children served with Title I-A funds. Generally, a larger number of children are served by Title I-A at the school level than are counted as formula children for the purposes of state and LEA grant determinations. For more information about the determination of Title I-A grants at the school level, see CRS Report R44461, Allocation of Funds Under Title I-A of the Elementary and Secondary Education Act, by [author name scrubbed] and [author name scrubbed]. |
| 57. |
Note that formula children are used as a proxy for poverty because Title I-A grants are calculated using formula child counts, which are primarily based on counts of children in poor families. |
| 58. |
This analysis is based on the actual FY2016 grant amounts calculated by the U.S. Department of Education. That is, the share of funds allocated to each range under each formula in Table B-1 was not determined by allocating all Title I-A funds through that formula. |
| 59. |
This is similar to the process used to calculate the population ranges to weight formula child counts under the Targeted Grant and EFIG formulas discussed previously. |
| 60. |
NCLB required that all funds in excess of the FY2001 appropriations levels for the Basic Grant and Concentration Grant formulas be provided to Targeted Grant and EFIG formulas. The statutory language did not specify how the excess funds should be divided between the two formulas. Rather, these decisions have been made through the appropriations process. In addition, while the statutory language references the FY2001 funding levels for the Basic Grant and Concentration Grant formulas, appropriations for these formulas are currently below their FY2001 levels. For example, appropriations for the Basic Grant formula fell below the FY2001 funding level in FY2002. Appropriations for the Concentration Grant formula fell below the FY2001 funding level several years later. In practice, since FY2002 the Targeted Grant and EFIG formulas have received all funds in excess of the amount actually appropriated for the Basic and Concentration Grant formulas. For FY2002 and FY2003, two-thirds of these funds were provided to the Targeted Grants formula and one-third of the funds were provided to the EFIG formula. Beginning in FY2004, these funds were divided evenly between the Targeted Grant and EFIG formulas. Beginning in FY2017, the ESSA requires that all funds in excess of the FY2001 appropriations levels for Basic and Concentration Grants be divided evenly between the Targeted Grant and EFIG formulas. If appropriations for the Basic Grant and Concentration Grant formulas remain below their FY2001 levels, it is possible that the Targeted Grant and EFIG formulas will each continue to receive half of the Title I-A appropriations in excess of what is provided for the Basic Grant and Concentration Grant formulas. |