Welfare Reform: Work Status of Single Mothers, In Brief
Welfare reform; Single Mothers; Employment trends; Poverty
Welfare Reform: Work Status of Single Mothers, In Brief
Contents
- Introduction
- Trends in Work Among Single Mothers
- Work Among Single Mothers by Selected Characteristics
- Work and Poverty
- Conclusion
Figures
- Figure 1. Percentage of Single Mothers with Work During the Past Year, 1987-2016
- Figure 2. Percentage of Single Mothers with Any Work During the Year, and with Full-Year, Full-Time Work, 1987-2016
- Figure 3. Percentage of Single Mothers with Work During the Year, By Selected Characteristics, 1987-2016
- Figure 4. Poverty Rates for Single Mothers, Based on Earnings and Total Money Income, 1987-2016
- Figure 5. Percent of Single Mothers Working and Percent of Single Mothers in Poverty, 1987-2016
- Figure 6. Poverty Rate for Working Single Mothers Based on Earnings Alone, 1987 to 2016
Tables
Appendixes
Introduction
The 1996 welfare reform law (P.L. 104-193) was the culmination of decades of efforts to revamp how needy families with children were assisted. In particular, the welfare reform debates focused on needy single mothers and their children because it was this group that comprised most of the families receiving cash assistance (often called "welfare"). Cash assistance for needy families had its origins in "mothers' pensions" and the New Deal program of Aid to Dependent Children, which was created to help single mothers stay out of the workforce in order to care for their children. Decades of social change and policy debate led to the policy presumption that single mothers should work to support themselves and their children. Policies were put in place to support working parents (e.g., child care assistance); supplement low wages (e.g., the refundable tax credits of the Earned Income Tax Credit and Child Tax Credit); and, in 1996, repeal the cash assistance program (renamed Aid to Families with Dependent Children) and replace it with the Temporary Assistance for Needy Families (TANF) block grant.1
This report updates and extends the analysis of single mothers' work experience in the Congressional Research Service (CRS) Report R41917, Welfare, Work, and Poverty Status of Female-Headed Families with Children: 1987-2013, by [author name scrubbed]. It analyzes 30 years of U.S. Census Bureau data showing trends in the work experience of single mothers. It provides information for the 10 years leading up to and including the enactment of the 1996 welfare reform law, as well as the 20 years since then.
In summary, the report shows the following:
- Single mothers' rate of work generally increased before 2000, and their employment peaked in that year. Following 2000, the percentage of single mothers who worked during a year declined even before the onset of the 2007 to 2009 recession, which caused further declines. Employment among single mothers began to increase again in 2011.
- Many single mothers who worked over this period did so for less than a full year at a full-time schedule. At the peak of employment of single mothers (2000), with 82.7% working at some point in the year, about half worked full-year, full-time.
- The trend in the poverty rates for single mothers tracked their employment rates, falling during periods when employment increased and rising when employment decreased. However, poverty rates for single mothers remained above the average for the U.S. population. In their peak employment year (2000), the poverty rate for single mothers was 32%, well above the overall poverty rate of 11% in that year.
- In 1987, there were differences in the rate of work among single mothers by race (with lower employment rates for nonwhites) and age of youngest child (with lower employment rates for mothers with very young children). These differences narrowed by 2016. The characteristic for which employment rates still differed considerably in that year was educational attainment; single mothers who had a postsecondary credential had higher employment rates than those who did not.
Trends in work among single mothers are often discussed in the context of the 1996 welfare reform law. Therefore, the figures and discussion in this report often make reference to 1996. While these trends may help inform debates about work and assistance, it is important to note that the analysis makes no causal connections between enactment of the 1996 welfare reform law and the work trends. In addition to policies regarding assistance, the trends are affected by other policies (e.g., work supports such as child care and earnings supplements through refundable tax credits) as well as broader economic and social trends.
The following definitional caveats should be considered:
- As used in this report, the term "single mothers" refers to mothers who reported that they were (1) never married, (2) divorced, (3) separated, or (4) married but living separately from their husbands. This is the same definition used in CRS Report R41917.
- A substantial share of "single mothers" cohabitate with a partner. Thus, in terms of resources available to the mother that might affect her work behavior and financial well-being, she might not be "single" in the sense of having to support herself and her children on her own. The information on cohabiting couples is not consistent over the 30 years examined in this report (the information was substantially improved in surveys beginning in 2008), and thus the report does not examine cohabiting single mothers separately from those who live on their own.
- Rates of work are measured for the entire population of single mothers. This includes those who might be enrolled in school.
Trends in Work Among Single Mothers
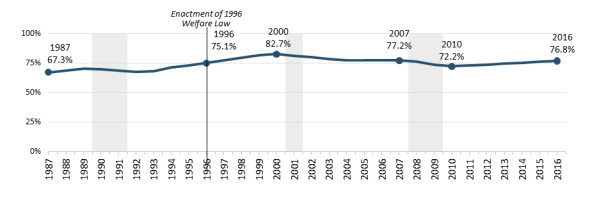
Analysis in this report is based on survey data collected from a cross-section of households from February to April in each year. (Detail on these data is discussed in the Appendix.) In addition to demographic and other information, respondents are asked about their employment experience and earnings over the prior year. This allows for estimates of the share of single mothers who worked at any time during the past year. Figure 1 shows the trends in this measure (i.e., the percentage of single mothers who worked at any time during the past year) from 1987 to 2016, illustrating the long-term trend over the full period and trends related to the economic cycle (recession years are shaded), with the dips associated with economic downturns.
The percentage of single mothers who worked at some time during the year generally increased from 1987 to 2000. Notably, the percentage of single mothers who were working was rising for several years before enactment of the 1996 welfare reform law, and it kept rising in the years after the law was passed. The percentage peaked in 2000, with 82.7% of single mothers working at some point during that year. The percentage generally declined in the 2000s, even before the onset of the 2007 to 2009 recession. It reached a low point in 2010 in the aftermath of that recession, but has steadily increased since then. Between 2010 and 2016, it increased 4.6 percentage points, from 72.2% to 76.8%. The rate of work among single mothers in 2016 was about the same as it was before the 2007-2009 recession, but it is still below the historical peak achieved in 2000.
|
Figure 1. Percentage of Single Mothers with Work During the Past Year, 1987-2016 |
 |
|
Source: Congressional Research Service (CRS) tabulations of the U.S. Census Bureau's Current Population Survey (CPS) Annual Social and Economic Supplements (ASEC), 1988 to 2017. Recession data are from the National Bureau of Economic Research, at http://www.nber.org/cycles.html. Note: Shaded areas denote years of economic recession. |
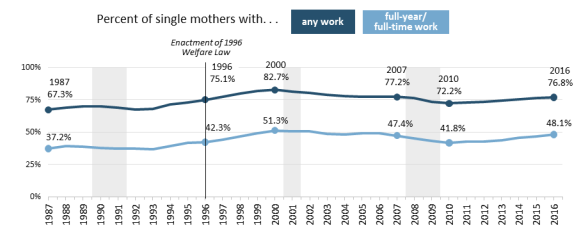
The work measure shown in Figure 1 represents the share of single mothers who worked at any time during the year. While a useful measure of recent participation, work at any time during the year does not differentiate between short-lived and strong attachment to work. Figure 2 shows the percentage of single mothers who reported working full-year, full-time,2 together with the percentage that reported any work during the year. As the figure shows, the majority of single mothers who work during a year do so for the full year on a full-time basis. However, it also shows that a substantial minority works less than that over the year. In the peak year of 2000, when 82.7% of single mothers reported working over the year, a little more than half of all single mothers worked full-time, all year.
Work Among Single Mothers by Selected Characteristics
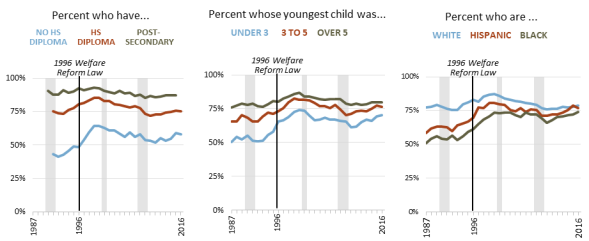
Figure 3 shows the percentage of single mothers who worked during a year by the following characteristics:
- highest educational credential attained,
- age of youngest child, and
- race/ethnicity.
The figure shows a common trend for each of the three characteristics. In the earlier years, there were greater differences in the work rates of the various groups within the categories, but these differences eventually narrowed. In general, those groups with relatively low rates of work at the beginning of the period experienced the largest increases in work.
Increased rates of work were particularly prominent for single mothers without a high school diploma and those with a high school diploma as the highest level of educational attainment; single mothers with a college degree worked at relatively high rates throughout the entire period. However, at the end of the period, there were still pronounced differences in work experience by educational attainment.
The age of a mother's youngest child appears to be related to single mothers' work rates, with work rates rising with the child's age. Over the 1987 to 2016 period, the greatest work rate increases were among those with preschool children (under age 5), particularly children under the age of 3. Those with school-aged children (over age 5) had a relatively high rate of work even at the beginning of the period.
In terms of race and ethnicity, the largest gains were among blacks and Hispanics, with white single mothers having relatively high rates of work throughout the period.
Work and Poverty
Figure 4 shows the trend in the poverty rate for single mothers for 1987 to 2016. Two measures are shown: the official poverty rate, which is based on total money income (i.e., earnings and cash income from other sources), and a poverty rate based on earnings alone (family earnings divided by the poverty threshold).3
Between 1987 and 2000, the official poverty rate for single mothers fell from an estimated 44.7% (1987) to 31.8% (2000). While this was a substantial decline, the poverty rate for single mothers remained above the poverty rate for the population as a whole (11.3% in 2000) as well as the poverty rate for most other demographic groups. In the 2000s, the poverty rate for single mothers generally increased, peaking in the aftermath of the 2007 to 2009 recession, before falling to a rate of 35.2% in 2016.
The earnings-only poverty measure shows how a single mother's earnings alone were related to poverty. At the peak of the single mothers work rate—2000, when more than 8 in 10 single mothers were working—the poverty rate for single mothers based on earnings alone was 40.8%; that is, earnings alone lifted 6 out of 10 single mothers out of poverty.
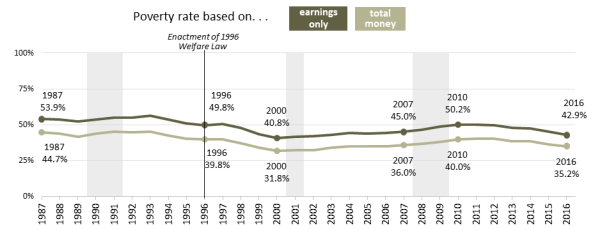
Figure 4 shows poverty rates for all single mothers (regardless of work status) and, taken together with Figure 1, shows that single mothers' work rates and poverty rates moved together over the period from 1987 to 2016, but in opposite directions. Figure 5 explicitly shows these trends. As single mothers' work rates increased over the period, their poverty rates (and their children's) declined. Progress on the single mothers' poverty rate eroded in the 2000s before recovering after 2010, again mirroring the work rate trend over this period. These observations suggest a relationship between work and poverty among single mothers.
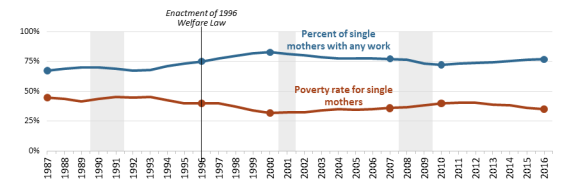
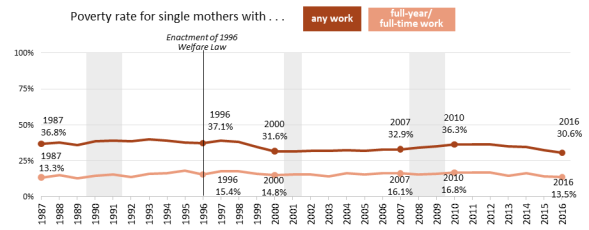
Figure 6 shows the poverty rates based on earnings alone for the subsets of single mothers who worked during the year and those who worked full-time all year. The figure shows that the earnings-only poverty rate for single mothers who worked full-time all year changed little over the 30-year period. There was more variability in the earnings-only poverty rate for those with any work. Much of this variability is associated with the economic cycle, as during periods of growth a higher number of single mothers worked more, and during recessions the likelihood of full-year, full-time work declined. The figure also shows that for some single mothers (13.5% in 2016), full-time all-year work was not sufficient to raise the single mothers (and their children) above the poverty threshold.
Conclusion
Work rates of single mothers increased over the 1987 to 2000 period. The beginning of that increase preceded the enactment of the 1996 welfare reform law and continued through the years immediately following its enactment. After 2000, work among single mothers stagnated and fell, even before the 2007 to 2009 recession. By 2016, the rate of work among single mothers had recovered to its prerecession level, but not to its historical peak in 2000.
It is beyond the scope of this report to say what "caused" the trends in work among single mothers over the 30 years it examines. While the discussion of work among single mothers is often made in the context of the 1996 welfare reform law, that law can only be part of the story. First, the increases in work among single mothers began before enactment of the 1996 law. Second, "welfare reform" was not limited to a single law, but was rather an ongoing set of changes in public policies affecting needy families with children. Legislation enacted in the 1980s and early 1990s expanded aid for low-income parents who were working (e.g., the Earned Income Tax Credit and child care). Welfare reform also continued after the enactment of the 1996 law (e.g., the 1997 enactment of State Children's Health Insurance Program, targeted to children in families with low income and earnings, and the 2009 expansions of the refundability of the child credit for parents with earnings).
There were other social and demographic changes that affected single mothers and could have influenced the trends in whether they worked or not. Compositional changes (i.e., changes in the characteristics of the single mothers group) are likely to be consequential as well. For example, over the time period examined in this report, the share of single mothers who were teen parents fell from 5% to 1.6%. Further, the share of single mothers with a postsecondary credential increased from 14.4% in 1992 to 31.5% at the end of the period examined in this report.
Appendix. Technical Notes
The estimates in this report were based on data from the Census Bureau's Annual Social and Economic Supplement (ASEC) to the Current Population Survey (CPS). The ASEC is a household survey of a sample of the noninstitutional population of the 50 states and District of Columbia. It is fielded from February through April of each year (the largest sample is drawn in March), and captures demographic information (e.g., marital status, household relationships, and educational attainment) as of the time of the survey, but looks retrospectively at both work experience and income earned in the prior year. For example, the 2017 ASEC captures an individual's marital status and household relationships in early 2017, but examines work experience and income in 2016.
The estimates are made by weighting the sample to represent the total population. The estimates are subject to sampling error. The differences discussed in this report were tested for statistical significance, using a method that takes into account the complex sample design of the survey.4
This report uses 30 years of data from the ASEC. Over that period of time, there were several changes in the survey that affected the way the estimates in this report were made that might have affected the comparisons between the years. The two major changes are how single mothers were identified and how the survey captured the race and ethnicity of the population.
Identification of Single Mothers
Beginning with the 2008 ASEC (which asked about work experience in 2007), the Census Bureau enhanced the questions asked about the household relationships. Before 2008, only one parent in the household was identified for each child. Beginning with the 2008 ASEC, each child continued to have a "parent identifier," but there was also new information available to identify both parents if present in the household and whether they were biological, adoptive, or step parents of the child.
This report's estimates of single mothers prior to 2008 relied on the child's parent identifier indicating that a single female was the mother of a child. This was the method used to identify single mothers in CRS Report R41917. That CRS report used the method consistent with the earlier years (using the "parent identifier," identifying one parent in the household) for 2008 and subsequent years. This report, in contrast, uses the new information available on child-parent relationships for the 2008 ASEC (work experience in 2007) and later years. The new method identified additional single mothers, mostly those who were reported in cohabiting relationships. While some additional single mothers were identified in this report (compared to CRS Report R41917), it did not have a large effect on the share of single mothers working or its trend.
Table A-1 shows the difference in the estimates using the two methods of identifying single mothers. It shows the estimates for both total number of single mothers and the percentage who ever worked during the year for both methods.
Table A-1. Differences Attributable to Changed Method for Identifying Single Mothers 2005-2016
Number of Single Mothers and Rate for Ever Worked During the Year
|
Total Number of Single Mothers |
Percentage of Single Mothers Who Ever Worked During the Year |
|||||
|
Income and Work Experience Measured for ... |
Original Method |
Method Using Additional Relationship Information (used in this report) |
Difference |
Original Method |
Method Using Additional Relationship Information (used in this report) |
Percentage Point Difference |
|
2005 (original method only) |
10,476 |
10,476 |
0 |
77.6 |
77.6 |
0.0 |
|
2006 (original method only) |
10,938 |
10,938 |
0 |
77.3 |
77.3 |
0.0 |
|
2007 |
10,748 |
11,406 |
658 |
77.9 |
77.2 |
-0.7 |
|
2008 |
10,797 |
11,465 |
668 |
76.9 |
76.5 |
-0.4 |
|
2009 |
10,990 |
11,772 |
782 |
74.0 |
73.5 |
-0.5 |
|
2010 |
11,185 |
11,968 |
783 |
72.8 |
72.2 |
-0.5 |
|
2011 |
11,467 |
12,256 |
788 |
73.7 |
73.0 |
-0.7 |
|
2012 |
11,125 |
11,981 |
857 |
74.1 |
73.6 |
-0.5 |
|
2013 |
10,971 |
11,815 |
844 |
75.0 |
74.5 |
-0.4 |
|
2014 |
11,176 |
11,975 |
799 |
75.8 |
75.3 |
-0.5 |
|
2015 |
10,870 |
11,676 |
806 |
77.3 |
76.6 |
-0.8 |
|
2016 |
10,501 |
11,285 |
784 |
77.2 |
76.8 |
-0.4 |
Source: Congressional Research Service (CRS) tabulations of the U.S. Census Bureau's Current Population Survey (CPS) Annual Social and Economic Supplements (ASEC), 2006 to 2017.
Note: Detail might not add to total because of rounding.
Racial Identification
Before the 2002 ASEC, individuals were asked to identify in only one racial category. Beginning in 2002, individuals were able to identify in multiple racial categories. In this report's estimates for 2002 and later years, an individual was identified as white or African American only if that was the only race the individual identified as. Hispanics of any race were classified as Hispanic. Non-Hispanics who were identified in more than one racial group were classified as being in an "other" racial/ethnic category (not shown in this report). However, the number of people identifying as multiracial is relatively small. In 2017, an estimated 301,000 single mothers reported as multiracial, 2.7% of all single mothers.
Author Contact Information
Acknowledgments
This report is heavily indebted to the work of former CRS Specialist Tom Gabe. It is merely an extension of the work that he did.
The method used in this report to test that the differences in the estimates over time were statistically significant, using variance estimates that account for the complex sample design of the Annual Social and Economic Supplement (ASEC), was assessed and implemented by a team consisting of Barnali Das, Joe Dalaker, Sarah Donovan, and Clarissa Gregory of CRS's Domestic Social Policy Division.
CRS Graphics Specialist Amber Wilhelm created the figures in this report.
Footnotes
| 1. |
For a brief history of welfare reform leading up to the enactment of the 1996 law, see CRS Report R44668, The Temporary Assistance for Needy Families (TANF) Block Grant: A Legislative History. |
| 2. |
As defined on the ASEC work experience survey, full-time work is usually 35 or more hours per week; full-year work is at least 50 of the 52 weeks during the year. |
| 3. |
While the official measure has well-known shortcoming in terms of capturing a person's or a family's economic well-being, it is available for historical comparisons back to 1987, while its alternative (the Supplemental Poverty Measure) is not. For a discussion of the Supplemental Poverty Measure (SPM), see CRS Report R45031, The Supplemental Poverty Measure: Its Core Concepts, Development, and Use. |
| 4. |
In short, the ASEC sample was divided into the pseudo-strata based on the geographic location of a household and these pseudo-strata were used to approximate the sampling design. The method is discussed in Michael Davern, Arthur Jones Jr., and James Lepkowski, et al., "Unstable Inferences? An Examination of Complex Survey Sample Design Adjustments Using the Current Population Survey for Health Services Research," Inquiry, vol. 43 (Fall 2006), pp. 283-297. |