Potential Effects of a U.S. NAFTA Withdrawal: Agricultural Markets
The North American Free Trade Agreement (NAFTA) entered into force on January 1, 1994, establishing a free trade area as part of a comprehensive economic and trade agreement among the United States, Canada, and Mexico. Currently, the United States is renegotiating the agreement. However, repeated threats by President Trump to abandon NAFTA and other actions by the Administration as part of ongoing efforts to “modernize” NAFTA have raised concerns that the United States could withdraw from NAFTA. Although some U.S. agricultural sectors support NAFTA renegotiation and efforts to address certain outstanding trade disputes—regarding milk and dairy products, potatoes, some fruits and vegetables, and wine—many continue to express strong support for NAFTA and oppose outright withdrawal. Possible disruptions in U.S. export markets and general uncertainty in U.S. trade policy also continue to be a concern for U.S. food and agricultural producers. Similar concerns have been raised by some in Congress who have oversight authority on industry and trade activities and who continue to monitor and conduct hearings on the ongoing NAFTA renegotiations.
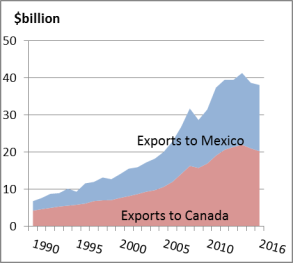
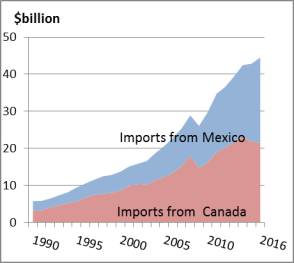
Trade under NAFTA provides an important market for U.S. agricultural producers and a broader choice of food products for U.S. food processors and consumers. Canada and Mexico are the two largest U.S. agricultural trading partners (combining imports and exports), accounting for 28% of the total value of U.S. agricultural exports and 39% of U.S. imports in 2016. Under NAFTA, U.S. agricultural trade with Canada and Mexico has increased significantly. Agricultural exports rose from $8.7 billion in 1992 to $38.1 billion in 2016, while imports rose from $6.5 billion to $44.5 billion over the same period. Adjusted for inflation, growth in the value of total U.S. agricultural exports and imports with its NAFTA partners has increased roughly threefold, growing at an average rate of 5%-6% annually.
To date, comprehensive quantitative analysis of a possible U.S. NAFTA withdrawal focused exclusively on agricultural markets is not yet available. This report looks at the potential economic effects to agricultural markets of a possible U.S. NAFTA withdrawal assuming the application of most-favored-nation (MFN) tariffs on traded agricultural products instead of the current zero tariff (i.e., duty-free trade) for selected agricultural products. MFN rates generally reflect the highest (most restrictive) rates that World Trade Organization (WTO) members can charge each other on imported goods and services.
In general, the application of MFN tariffs on U.S. agricultural imports would likely raise prices both to U.S. consumers and other end users, such as manufacturers of value-added food products. MFN tariffs on U.S. agricultural exports would, in turn, likely make U.S. products in those markets less price-competitive and more costly to foreign buyers, which could result in reduced quantities sold. Given that certain agricultural products dominate U.S. trade with Canada and Mexico—such as meat products, grains and feed, and processed foods—these products could become more costly and less competitive as MFN tariffs are imposed and other trade preferences are removed under a NAFTA withdrawal. This could result in reduced market share for U.S. products in these markets. This report looks at a subset of MFN tariffs for certain products that could impact U.S. agricultural markets in the event of a possible U.S. NAFTA withdrawal.
Other potential trade impacts under a U.S. withdrawal from NAFTA could include (but are not limited to) higher prices for imported products from Canada and Mexico, reductions in agricultural imports that compete with U.S. products, disruption of integrated supply chains, general market disruption and uncertainty, economic impacts to some agricultural-producing states (both positive and negative), and a decrease of future negotiating leverage of the United States (e.g., to review and resolve disputes regarding a range of non-tariff barriers to trade).
Potential Effects of a U.S. NAFTA Withdrawal: Agricultural Markets
Jump to Main Text of Report
Contents
- Status of Available Economic Studies
- Trends in Agricultural Trade Under NAFTA
- Assessing Potential Impacts of Higher MFN Tariffs
- Available Trade and Tariff Data
- Imposition of MFN Tariffs
- MFN Tariffs on Agricultural Imports to the United States
- MFN Tariffs on U.S. Agricultural Exports in Canada and Mexico
- Reduction in U.S. Agricultural Market Share
- U.S. Market Share of Canada's Agricultural Imports
- U.S. Market Share of Mexico's Agricultural Imports
- Agriculture Industry Opposition to Withdrawal
Figures
- Figure 1. U.S. Agricultural Exports
- Figure 2. U.S. Agricultural Imports
- Figure 3. MFN (AV) Tariffs Agricultural and Fisheries Products, 2017
- Figure 4. U.S. Exports to Canada, Mexico, and Non-NAFTA Countries, 2016
- Figure 5. U.S. Imports from Canada, Mexico, and Non-NAFTA Countries, 2016
- Figure 6. Market Share of Canada's Total Agricultural Imports, 2016
- Figure 7. Market Share of Mexico's Total Agricultural Imports, 2016
Summary
The North American Free Trade Agreement (NAFTA) entered into force on January 1, 1994, establishing a free trade area as part of a comprehensive economic and trade agreement among the United States, Canada, and Mexico. Currently, the United States is renegotiating the agreement. However, repeated threats by President Trump to abandon NAFTA and other actions by the Administration as part of ongoing efforts to "modernize" NAFTA have raised concerns that the United States could withdraw from NAFTA. Although some U.S. agricultural sectors support NAFTA renegotiation and efforts to address certain outstanding trade disputes—regarding milk and dairy products, potatoes, some fruits and vegetables, and wine—many continue to express strong support for NAFTA and oppose outright withdrawal. Possible disruptions in U.S. export markets and general uncertainty in U.S. trade policy also continue to be a concern for U.S. food and agricultural producers. Similar concerns have been raised by some in Congress who have oversight authority on industry and trade activities and who continue to monitor and conduct hearings on the ongoing NAFTA renegotiations.
Trade under NAFTA provides an important market for U.S. agricultural producers and a broader choice of food products for U.S. food processors and consumers. Canada and Mexico are the two largest U.S. agricultural trading partners (combining imports and exports), accounting for 28% of the total value of U.S. agricultural exports and 39% of U.S. imports in 2016. Under NAFTA, U.S. agricultural trade with Canada and Mexico has increased significantly. Agricultural exports rose from $8.7 billion in 1992 to $38.1 billion in 2016, while imports rose from $6.5 billion to $44.5 billion over the same period. Adjusted for inflation, growth in the value of total U.S. agricultural exports and imports with its NAFTA partners has increased roughly threefold, growing at an average rate of 5%-6% annually.
To date, comprehensive quantitative analysis of a possible U.S. NAFTA withdrawal focused exclusively on agricultural markets is not yet available. This report looks at the potential economic effects to agricultural markets of a possible U.S. NAFTA withdrawal assuming the application of most-favored-nation (MFN) tariffs on traded agricultural products instead of the current zero tariff (i.e., duty-free trade) for selected agricultural products. MFN rates generally reflect the highest (most restrictive) rates that World Trade Organization (WTO) members can charge each other on imported goods and services.
In general, the application of MFN tariffs on U.S. agricultural imports would likely raise prices both to U.S. consumers and other end users, such as manufacturers of value-added food products. MFN tariffs on U.S. agricultural exports would, in turn, likely make U.S. products in those markets less price-competitive and more costly to foreign buyers, which could result in reduced quantities sold. Given that certain agricultural products dominate U.S. trade with Canada and Mexico—such as meat products, grains and feed, and processed foods—these products could become more costly and less competitive as MFN tariffs are imposed and other trade preferences are removed under a NAFTA withdrawal. This could result in reduced market share for U.S. products in these markets. This report looks at a subset of MFN tariffs for certain products that could impact U.S. agricultural markets in the event of a possible U.S. NAFTA withdrawal.
Other potential trade impacts under a U.S. withdrawal from NAFTA could include (but are not limited to) higher prices for imported products from Canada and Mexico, reductions in agricultural imports that compete with U.S. products, disruption of integrated supply chains, general market disruption and uncertainty, economic impacts to some agricultural-producing states (both positive and negative), and a decrease of future negotiating leverage of the United States (e.g., to review and resolve disputes regarding a range of non-tariff barriers to trade).
The North American Free Trade Agreement (NAFTA) entered into force on January 1, 1994, establishing a free trade area as part of a comprehensive economic and trade agreement among the United States, Canada, and Mexico. Currently, the United States is renegotiating the agreement. However, repeated threats from President Trump to abandon NAFTA and other actions by the Administration as part of ongoing efforts to "modernize" NAFTA have raised concerns that the United States could withdraw from the agreement altogether. Although some U.S. agricultural industries support NAFTA renegotiation and efforts to address certain outstanding trade disputes—especially regarding milk, potatoes, some fruits and vegetables, cheese, and wine—many continue to express strong support for NAFTA and oppose outright withdrawal. Possible disruptions in U.S. export markets and general uncertainty in U.S. trade policy also continue to be a concern for U.S. food and agricultural producers. Similar concerns have been raised by some in Congress who have oversight authority on industry and trade activities and who continue to monitor the ongoing NAFTA renegotiations.1
This report examines some of the potential consequences to U.S. agricultural markets of a U.S. withdrawal from NAFTA, focusing on the possibility that higher tariffs could be imposed on U.S. imports and exports. In particular, under a NAFTA withdrawal, it is likely that most-favored-nation (MFN) tariffs would be imposed on agricultural products traded among the NAFTA countries instead of the current zero tariff (i.e., duty-free trade) for most agricultural products. In general, MFN tariffs on U.S. agricultural imports would likely raise prices both to U.S. consumers and other end users, such as manufacturers of value-added food products.
Applying general principles of supply and demand, it is possible to anticipate the effect that sustained higher prices due to higher MFN tariffs could have on the volume (quantity) of goods traded. Specifically, as prices increase, the quantity demanded for a product tends to decrease. Assuming MFN tariffs could apply in the event of a U.S. NAFTA withdrawal, imported products could become more expensive, which could lower the demand for some U.S. agricultural imports. Similarly, if higher MFN tariffs were applied to U.S. goods exported to Canada and Mexico, this could make some U.S. agricultural products more costly to buyers in those markets, which could lower U.S. exports—such as meat products, grains and feed, and processed foods.
Status of Available Economic Studies
As part of a formal free trade agreement (FTA) negotiation, the Office of the United States Trade Representative (USTR) will often request a "probable economic effects" study of a trade agreement, which is usually conducted by the United States International Trade Commission (USITC).2 The Administration has asked USITC to conduct only an investigation into the probable economic effect of eliminating tariffs on certain dutiable NAFTA imports currently under a tariff rate quota (TRQ).3 This analysis was expected to have been completed in August 2017 but is confidential and not publicly available.4 USTR has confirmed that, to date, a comprehensive review of a possible U.S. withdrawal from NAFTA has not yet been conducted.5
Comprehensive analysis of a possible U.S. NAFTA withdrawal focused exclusively on agricultural markets is also not available. Researchers at the U.S. Department of Agriculture (USDA) have not yet conducted such an analysis.6 University researchers often also contribute to studies of the effects of a range of market and trade policy actions. CRS communications with researchers that typically conduct such studies indicate that an assessment of a possible U.S. NAFTA withdrawal on agricultural markets has not been initiated at this time.7 An extensive amount of data would be needed to conduct such an analysis, including quantity produced and traded for a wide range of products, domestic and international prices, production costs and inputs, measures of price response by product and market, and other modeling data.
The text box below provides a qualitative summary of some of the potential ways that U.S. agricultural markets could be affected if the United States were to withdraw from NAFTA.
A recent economy-wide study by a private research firm, ImpactECON, concluded that a "NAFTA reversal" would likely raise U.S. tariffs on Canada and Mexico imported products to current MFN rates, which could cause all NAFTA parties to experience declines in real gross domestic product (GDP), trade, investment, and employment.8 The study examined trade and economic changes assuming both reciprocation and no reciprocation in terms of Canada's and Mexico's applied tariffs.9 According to the study, if Canada and Mexico were to also impose higher MFN tariffs, this could result in additional overall trade declines among the NAFTA countries, resulting in the loss of 256,000 low-wage workers in the short term (three to five years) as well as additional relocation of workers throughout the United States. The ImpactECON study concluded that a NAFTA reversal could especially impact the meat, food, textiles, auto, and services sectors. Impacts are likely to be greatest for those industries where production is highly integrated.10
The ImpactECON study and its conclusions regarding the potential impacts to the food and agricultural sectors have been highly commended and cited by some agricultural economists.11 For example, Dermot Hayes of Iowa State University notes that imposing MFN duties will have a price effect on traded goods that will lead to eventual market adjustment, forcing the United States to seek alternative export markets or be forced to downsize the domestic industry. For example, he estimates that MFN duties of 20% on U.S. pork exports to Mexico could cause a 5% contraction of the U.S. pork sector and stimulate additional production in Mexico and/or require Mexican buyers to find additional suppliers outside the United States. Contraction in the U.S. pork industry would result in a loss of U.S. jobs and have a disproportionate effect on specific counties that are dependent on farming, input markets, and value-added production in the sector.
|
Selected Potential Outcomes Under a NAFTA Withdrawal
Source: CRS. |
Trends in Agricultural Trade Under NAFTA
Trade under NAFTA underpins an important market for U.S. food and agricultural producers. Canada and Mexico are the United States' two largest trading partners, accounting for 28% of the total value of U.S. agricultural exports and 39% of its imports in 2016.
Over the past 25 years under NAFTA, the value of U.S. agricultural trade with Canada and Mexico has increased sharply. Exports rose from $8.7 billion in 1992 to $38.1 billion in 2016 (Figure 1), while imports rose from $6.5 billion to $44.5 billion over the same period (Figure 2). Adjusted for inflation, the value of agricultural exports and imports between the United States and its NAFTA partners has increased roughly threefold since 1990, growing at an average rate of about 5%-6% annually.12 This growth resulted in a $6.4 billion trade deficit for U.S. agricultural products in 2016, reversing the trend in previous years when there was a trade surplus.13
In 2016, U.S. agricultural exports to Canada were valued at $20.2 billion. The leading exports were grains and feed, animal products, fruits and vegetables and related products, nuts and other horticultural products, sweeteners, oilseeds, beverages (excluding fruit juice), and essential oils.
U.S. agricultural exports to Mexico were valued at $17.8 billion in 2016. The leading exports were animal products, grains and feed, oilseeds, sweeteners, fruits and vegetables and related products, nuts and other horticultural products, cotton, seeds, and nursery crops. Mexico is also the largest or second-largest market for U.S. beef, pork, poultry, dairy, wheat, and corn exports.14
For more information about U.S. agricultural trade under NAFTA, see CRS Report R44875, The North American Free Trade Agreement (NAFTA) and U.S. Agriculture, and CRS In Focus IF10682, NAFTA Renegotiation: Issues for U.S. Agriculture.
|
|
|
Assessing Potential Impacts of Higher MFN Tariffs
Under NAFTA, tariffs and quantitative restrictions were eliminated on most agricultural products, with the exception of some that may be subject to TRQs and high out-of-quota tariff rates. Under NAFTA, Canada excludes dairy, poultry, and eggs for tariff elimination. The United States excludes dairy, sugar, cotton, tobacco, peanuts, and peanut butter. Because Canada was able to exclude certain products from tariff elimination in NAFTA, Canada is able to limit imports through restrictive TRQs. For example, according to USTR, imports of U.S. products above quota levels may be subject to out-of-quota tariffs as high as 245% for cheese and 298% for butter under NAFTA.15 Aside from these exempted products, most agricultural products are traded duty-free (i.e., zero tariff) and receive other types of trade preferences intended to facilitate trade.
Under an FTA, preferential tariffs are charged to member countries and are lower than a country's MFN tariff rates. MFN rates generally reflect the highest (most restrictive) rates that World Trade Organization (WTO) members can charge each other on imported goods and services. The text box below describes the different types of tariffs.
|
Tariff Definitions Tariffs refer to customs duties charged by countries on merchandise imports. Tariffs give price advantages to similar locally produced goods and raise revenues for the government. Tariffs are levied either as:
MFN tariffs refer to normal non-discriminatory tariffs charged on imports. They exclude preferential tariffs (see below) charged under an FTA or other types of schemes or tariffs charged inside quotas. In practice, MFN rates are the highest (most restrictive) rates that WTO members can charge each other on imported goods and services. MFN rates may reflect a country's bound tariff rate. The bound rate refers to commitments made by individual WTO member governments to keep tariffs below a "bound" level, which is generally the maximum MFN tariff level for a given commodity line. Once a rate of duty is bound, it may not be raised without compensating the affected parties. Tariffs actually charged (i.e., "applied" tariffs) can be lower than the bound rates. Preferential tariffs refer to tariffs charged under an FTA, such as a free trade area or customs union. Preferential tariff rates are generally lower than a country's MFN rates. Rates are generally reciprocal: All parties agree to give each other lower tariffs. Source: World Integrated Trade Solution (WITS), "Types of Tariffs; WTO's glossary; and WTO's "Trade and Tariffs," https://www.wto.org/english/thewto_e/20y_e/wto_20_brochure_e.pdf. |
Available Trade and Tariff Data
Trade data presented here are by selected agricultural commodity groupings, as defined by USDA.16 In some cases, trade data are grouped according to tariff chapters under the Harmonized Commodity Description and Coding System (HS).17 The HS refers to a hierarchical structure for describing all goods in trade for duty, quota, and statistical purposes. The primary two-digit HS product categories are further subdivided into four-digit HS product categories.18 The first 24 chapters of most tariff schedules worldwide cover most agricultural and fisheries products. Product groupings by HS chapter exclude some agricultural commodities including cotton, essential oils, starches, hides, and skins.19
MFN tariffs presented here for all NAFTA countries were compiled by CRS from WTO's database and summarize available country tariff information at the HS-2 and HS-4 levels.20 WTO's tariff database includes MFN tariffs for products at the HS-2, HS-4, and HS-6 levels for all traded goods for most countries. This database documents both ad valorem (AV) tariffs—or the rate charged as a percentage of the price—and non-AV tariffs, such as specific tariffs. WTO's database does not extend beyond the HS-6 level.21 Average MFN tariffs reported by the WTO include tariffs expressed as AV. Tariffs expressed in terms of AV facilitate a comparison across different countries and are also useful for interpreting potential economic effects. For example, in general, a 10% tariff on a traded product roughly translates into a 10% price increase for that product, often paid for by the buyer of that product.
However, average MFN tariff rates reported by the WTO do not include non-AV tariffs, such as specific tariffs or tariffs charged as a fixed amount per unit of quantity (e.g., $7 per 100 kg). It is important to note that the WTO tariff database does not translate non-AV tariffs to an ad valorem equivalent (AVE) basis.22 Accordingly, non-AV tariffs are not included as part of the WTO database's calculation of average AV tariff rates.23 This may exclude tariffs for certain agricultural products under a TRQ24 or where seasonal tariffs might apply (e.g., higher import tariffs for certain fruits and vegetables imported during U.S. peak season).25 Tariffs for agricultural products under a TRQ or where seasonal tariffs apply are often expressed as specific tariffs and/or at the HS-6 level or higher (HS-8 or HS-10 level) and are excluded from most reported average tariff rates. For reasons described in the text box below, WTO-reported average AV tariffs may therefore provide an incomplete picture of MFN duties for certain types of agricultural products.
|
Selected Examples of Non-AV Rates for Agricultural Products Tariffs for agricultural products under a TRQ. At the HS-4 level, the WTO-reported "Average of AV Duties" of U.S. MFN applied tariffs for HS 1702 (Other sugars ... ) is 6% (Appendix B). However, this reported average AV tariff does not account for the fact that there are 11 non-AV duties for U.S. imports within this product category. These additional non-AV duties are not reflected in the reported average since it does not include AVE for some products. This fails to capture the fact that at other HS levels, the applied tariff rate can be much higher for individual products. For example, although the reported U.S. average AV tariff is listed as about 5%-6%, the out-of-quota rate under the TRQ (expressed as a non-AV duty) can be as much as 33.9¢/kg of total sugars + 5.1% (HS 1702.40.28). These specific tariffs, when calculated on an AVE basis, greatly exceed 6% and are estimated at about 80%, depending on the methods used to calculate AVE. If this higher upper-bound limit of the non-AV rate were to be included in the average rate, the average reported tariff would be greater. At the HS-6 level, the WTO-reported average AV rate for HS 1702.40 (Glucose and glucose syrup) is 5.6%. This average also does not include non-AV tariffs for import under a TRQ. Tariffs for agricultural products with higher seasonal tariffs. At the HS-4 level, the WTO-reported average AV duty of U.S. MFN applied tariffs for HS 0810 (Other fresh fruit) is 0.8% (Appendix B). This WTO-reported average AV tariff does not account for the fact that there are three non-AV duties for U.S. imports of this product category. Excluding the non-AV duties in the average tariff calculation fails to account for the fact that at other HS levels higher seasonal duties might apply for some products. For example, at the HS-8 level, U.S. import duties for strawberries (0810.10.20) range from 0.2¢/pound to 1.1¢/pound, depending on the time of year they are imported. These specific tariff rates, when calculated on an AVE basis, can range from an estimated 0.1% to 0.7%, depending on how AVE is calculated. These additional non-AV duties are not reflected in the average AV tariff, since it does not include AVE for some products under a non-AV tariff. If the higher AVE upper bound limit were included in the average rate, the average would be greater. At the HS-6 level (HS 0810.10, strawberries) the WTO-reported average AV tariff is zero, since all the duties in this category are non-AV (i.e., specific tariffs) and not included in the average, since these tariffs were not calculated on an AVE basis. Source: CRS. |
Despite these data limitations, tariff data provided in this report cover the WTO-reported average AV duties for each of the NAFTA partner countries at the HS-4 level only. As this provides for a subset of all MFN tariffs for agricultural products—excluding non-AV rates for some products—it provides an incomplete picture of actual tariff rates for some agricultural imports. Since average AV tariffs for agricultural products may be lower than actual applied rates, tariff rates discussed in this report likely understate actual applied rates for some agricultural imports. Accordingly, MFN rates described in this report are intended to provide an initial glimpse of the types of potential impacts in the event of a possible U.S. NAFTA withdrawal.
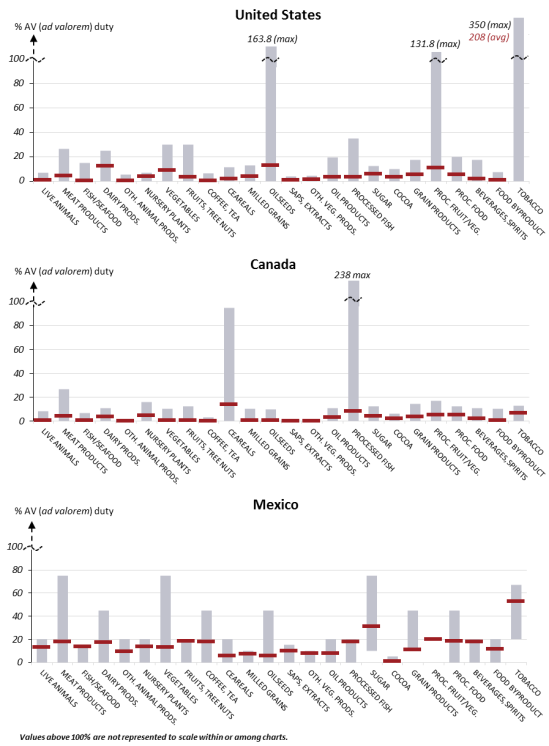
Figure 3 summarizes the agricultural and fisheries tariffs by country for each of the 24 HS chapters at the HS-2 level.26 Figure 3 shows the minimum and maximum AV MFN tariffs (gray bar) and the average AV MFN tariff (red marker) for selected products (expressed at the HS-2 level) for the United States, Canada, and Mexico. Appendix A provides more detailed tariff information at the HS-2 level for each of the three NAFTA countries. Appendix B summarizes nearly 200 categories of agricultural and fisheries tariffs at the HS 4- level for each of the three countries.
|
Figure 3. MFN (AV) Tariffs Agricultural and Fisheries Products, 2017 |
 |
|
Source: CRS from WTO's tariff database (http://tariffdata.wto.org/ReportersAndProducts.aspx). Based on Harmonized Commodity Description and Coding Systems (HS), Harmonized System 2017 (HS-2). Notes: Gray bar = min/max duty; red marker = average AV duty. Reflects a range of duties across the HS chapter, covering product categories at the HS-2 level (see Appendix A). Does not include non-AV duties. |
Additional analysis is needed to fully capture the full extent of the potential market impacts of possibly higher MFN tariffs rates, especially for products under a TRQ or seasonal tariff. Ideally, such an analysis would be conducted in conjunction with economic modeling to simulate potential changes of higher tariffs on the quantity of products traded among the NAFTA countries under different scenarios. Such an analysis would also need to fully account for all other non-AV tariff rates that have not been converted to AVE. Calculating AVE rates for each of the roughly 2,700 individual tariff lines at the HS-6 level for each of the NAFTA partner countries is beyond the scope of this analysis due to time and resource constraints. Complete tariff information is further not readily available to calculate AVE tariffs for each of the individual tariff lines for products at the HS-8 and HS-10 levels for each country.
Imposition of MFN Tariffs
Following is a discussion of possible tariff changes to both U.S. agricultural imports and exports in the event of a possible U.S. NAFTA withdrawal. With few exceptions, under NAFTA, agricultural products are imported duty-free (zero tariff), and U.S. agricultural products also generally face zero tariffs when exported to Canada and Mexico. In lieu of preferential trade policies under NAFTA, tariffs charged on U.S. imports and exports could revert to generally higher MFN tariffs.
Other types of trade effects are not examined, such as the effects of trade on the possible removal of other types of NAFTA-related trade preferences (e.g., policies regarding SPS measures, customs charges, permits, quotas, trade regulations, import licenses, and border restrictions).
MFN Tariffs on Agricultural Imports to the United States
Figure 3 shows MFN tariffs on U.S. agricultural imports. As shown, while the minimum MFN tariff on U.S. imports can be zero for many agricultural products, the maximum AV tariff varies widely and can be prohibitively high for some products, such as tobacco, oilseeds, and some processed fruit and vegetable products.
As noted previously, in general, higher MFN tariffs on U.S. agricultural imports would likely raise prices both to U.S. consumers and other end users, such as manufacturers of value-added food products. Accordingly, if higher MFN tariffs apply, some U.S. imports could become more costly to U.S. end users. For example, the maximum MFN tariff is 29.8% for certain tropical fruit imports, which could raise the cost of some products to U.S. consumers (Appendix B, see HS 0804). Applying MFN tariff rates could also raise the cost to food processors who import cereal flours for use in further value-added food production. The maximum MFN tariff is 12.8% on cereal flour imports to the United States (Appendix B, see HS 1102).
Alternatively, some U.S. imports that currently compete with U.S.-produced products might experience a reduction in trade as imported products drop in response to higher U.S. tariffs. This could create a competitive advantage for U.S. producers as potential domestic suppliers. For example, tariffs for U.S. melon and watermelon imports carry a relatively high maximum MFN tariff of 29.8% (Appendix B, see HS 0807), suggesting that imports could slow given higher prices due to possible prohibitive tariff rates, thus giving U.S. producers a competitive advantage. However, not all imported products would face higher tariffs if MFN tariffs were imposed. Some produce imported from Mexico that has been of concern to U.S. producers27—such as tomatoes (HS 0702) and berries (HS 0810)—carries a zero to low MFN tariff (Appendix B). In this case, a possible NAFTA withdrawal might not slow imports from Canada and Mexico on the basis of price changes based on changes in import tariffs.
MFN Tariffs on U.S. Agricultural Exports in Canada and Mexico
Figure 3 shows MFN tariffs on Canadian and Mexican agricultural imports that could be charged on U.S. products if these countries were to reciprocate and charge MFN tariffs in the event of a possible NAFTA withdrawal. Similar to in the United States, while the minimum MFN tariff on imports to these countries can be zero or low for many agricultural products, the maximum AV tariff varies widely and can be prohibitively high for some products. For example, in Canada, the maximum AV tariff is 27% for some meat products and 95% for some imported grains. In Mexico, the maximum AV tariff is 75% for some meat products and 20% for some imported grains. Again, the maximum AV tariff varies widely depending on the product (Figure 3).
As noted previously, in general, the imposition of higher MFN tariffs on U.S. agricultural exports would likely make U.S. products in those markets less price-competitive and more costly to foreign buyers, which could result in reduced quantities sold. Accordingly, if higher MFN tariffs apply, some U.S. products could become more costly to Canadian and Mexican end users. For example, Mexico's maximum MFN tariffs on its corn (maize) imports can be as high as 20% (Appendix B, see HS 1005). This suggests that certain U.S. corn exports to Mexico could become up to 20% more expensive for buyers in that market. This could give other global corn suppliers an opportunity to gain additional import share in Mexico. Similarly, the maximum MFN tariff for pork meat imports to Mexico could raise tariffs on some pork products from current duty-free levels under NAFTA to a maximum MFN tariff of 20% (Appendix B, see HS 0203). This could give an advantage to other global suppliers. MFN tariffs on U.S. corn and pork meat imports would remain duty-free (i.e., zero tariff).
Reduction in U.S. Agricultural Market Share
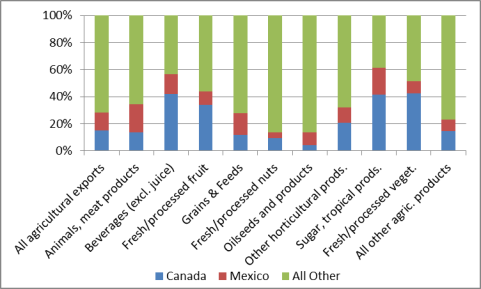
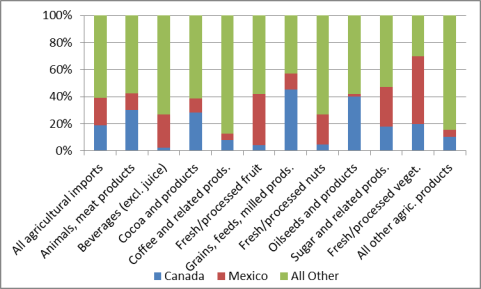
As higher MFN tariffs in Canada and Mexico could make U.S. agricultural products relatively more costly compared to other competing global suppliers, this could impact U.S. market share for some agricultural products in these two markets. Figure 4 and Figure 5 illustrate the importance of Canada and Mexico to U.S. agricultural trade for selected agricultural commodity groupings, as defined by USDA. Figure 6 and Figure 7 illustrate the importance of products from the United States to Canada's and Mexico's agricultural markets.
U.S. Market Share of Canada's Agricultural Imports
Figure 4 shows selected U.S. agricultural exports to Canada and Mexico compared to exports to all other non-NAFTA countries in 2016. While Canada and Mexico accounted for 28% of the value of total U.S. agricultural exports, NAFTA countries accounted for a larger share of some U.S. exports—for example, 62% of U.S. sugar and tropical products28 and 51% of fresh and processed vegetables. Figure 5 shows selected U.S. agricultural imports from Canada and Mexico compared to imports from all other non-NAFTA countries in 2016. As shown, while Canada and Mexico accounted for 39% of total U.S. agricultural imports, NAFTA country suppliers account for a larger share of total imports for some commodities—for example, 58% of U.S. grains and feeds and 70% of fresh and processed vegetables.
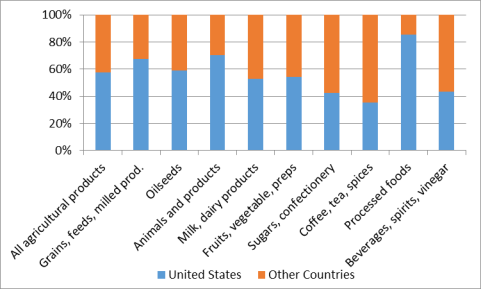
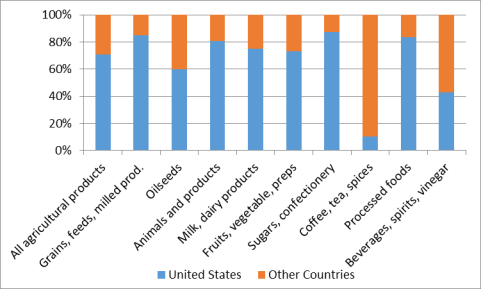
U.S. Market Share of Mexico's Agricultural Imports
Figure 6 shows the U.S. market share of Canada's agricultural imports as a share of the value of total imports from all countries. In 2016, U.S. agricultural products accounted for 59% of the value of all Canadian agricultural imports. Some U.S. products, such as grains/feed and meat products, account for a larger share of total imports (more than 70%, on average). Figure 7 shows the U.S. market share of Mexico's agricultural imports in 2016 as a share of total imports from all countries. In 2016, U.S. agricultural products account for 72% of the value of all of Mexico's agricultural imports. Some U.S. product categories, however, account for an even greater share of total imports, such as grains and feed, meat products, sugar and related products, and processed foods, which accounted for more than 80% of the total value of Mexico's imports in 2016.
These market share data highlight those U.S. agricultural products that may be considered more heavily reliant on NAFTA trade, suggesting the importance of the agreement to U.S. sales of grains and feed, oilseeds, meat and dairy products, processed foods, fresh and processed fruits and vegetables, tree nuts, and sugar products. These market share data—together with MFN tariff information—further suggest that these products may become more costly and less competitive in these markets as higher tariffs, mostly duty-free access, and other types of trade preferences are removed under a possible U.S. NAFTA withdrawal.
|
Figure 4. U.S. Exports to Canada, Mexico, and Non-NAFTA Countries, 2016 |
 |
|
Source: CRS from USDA Foreign Agricultural Trade of the United States data (https://apps.fas.usda.gov/gats/ExpressQuery1.aspx), according to USDA product category definitions (https://apps.fas.usda.gov/gats/ProductGroup.aspx?GROUP=FATUS). "All other" products include wine, fruit juice, tobacco, essential oils, cotton, seeds, and nursery products. Notes: Data are calendar year. |
|
Figure 5. U.S. Imports from Canada, Mexico, and Non-NAFTA Countries, 2016 |
 |
|
Source: CRS from USDA Foreign Agricultural Trade of the United States data (https://apps.fas.usda.gov/gats/ExpressQuery1.aspx), according to USDA product category definitions (https://apps.fas.usda.gov/gats/ProductGroup.aspx?GROUP=FATUS). "All other" products include wine, fruit juice, tobacco, essential oils, cotton, seeds, teas, herbs, spices, nursery products, and other miscellaneous products. Notes: Data are calendar year. |
|
Figure 6. Market Share of Canada's Total Agricultural Imports, 2016 |
 |
|
Source: Compiled by CRS using Global Trade Atlas, http://www.gtis.com/gta/. Data are by Harmonized System (HS) code, covering agricultural and fisheries products in HS chapters 01-24. Excludes some agricultural commodities listed in other HS chapters, such as cotton, essential oils, starches, hides, and skins. Notes: Data are calendar year. |
|
Figure 7. Market Share of Mexico's Total Agricultural Imports, 2016 |
 |
|
Source: Compiled by CRS using Global Trade Atlas, http://www.gtis.com/gta/. Data are by Harmonized System (HS) code, covering agricultural and fisheries products in HS chapters 01-24. Excludes some agricultural commodities listed in other HS chapters, such as cotton, essential oils, starches, hides, and skins. Notes: Data are calendar year. |
Agriculture Industry Opposition to Withdrawal
When President Trump announced in April 2017 that he was considering withdrawing the United States from NAFTA, many U.S. agricultural groups expressed strong opposition to withdrawal. Many in Congress also voiced opposition to outright withdrawal from NAFTA.29 The National Pork Producers Council stated that NAFTA withdrawal could be "cataclysmic"30 and "financially devastating" to U.S. pork producers.31 The National Corn Growers Association said that "withdrawing from NAFTA would be disastrous for American agriculture" and would disrupt trade with the sector's top trading partners.32 The American Soybean Association said withdrawing from NAFTA is a "terrible idea" and would hamper ongoing recovery in the sector.33 The U.S. Grains Council highlighted that withdrawal would have an "immediate effect on sales to Mexico."34 The National Association of Wheat Growers (NAWG) noted that Mexico is the largest U.S. wheat buyer and claimed that NAFTA withdrawal would be a "terrible blow to the U.S. wheat industry and its Mexican customers."35 Cargill, Inc., a major privately held U.S. grain distributor and global agricultural supplier, claims that sales to Canada and Mexico account for an estimated 10% of the company's annual revenues.36 Most fruit and vegetable growers did not support NAFTA withdrawal, citing the benefit of exports to Mexico.37
The Administration did not withdraw from NAFTA at that time, deciding instead to formally renegotiate and "modernize" NAFTA.38 Although many in Congress and in the U.S. agricultural sectors support NAFTA renegotiation and efforts to address certain outstanding trade disputes—such as disputes involving milk, potatoes, some fruits and vegetables, cheese, and wine—most U.S. agricultural groups are unified in their opposition to outright NAFTA withdrawal. An October 2017 letter from nearly 90 farm and agriculture groups states that "NAFTA withdrawal would cause immediate, substantial harm to American food and agriculture industries and to the U.S. economy as a whole."39 Agriculture groups also remain concerned about growing uncertainty in U.S. trade policy and its potential to disrupt U.S. export markets.40 Some also worry that the Administration is actively seeking to exit NAFTA.41
Among the concerns of U.S. agricultural groups related to a withdrawal is fear that the nation's NAFTA trading partners could seek alternative markets for U.S. corn, soybean, dairy, pork, beef, and rice.42 For example, media reports indicate that Mexico is looking to find alternative suppliers for some imported products, such as rice (which could be supplied by Vietnam and Thailand), corn and soybeans (Argentina and Brazil),43 wheat (Argentina and the Baltic States),44 and dairy products (New Zealand and Europe).45 The U.S. pork industry continues to claim that a NAFTA withdrawal would be catastrophic to the sector.46 Meanwhile, reports also indicate that Mexico is not worried about finding alternative consumer markets for some of its exported products, such as avocados, which are now mostly sold to the United States.47 Other reports suggest that Mexico's efforts to diversify its agricultural suppliers and markets may be in retaliation for certain U.S. proposals tabled during the NAFTA renegotiation.48 Others suggest that the general tone of the ongoing renegotiation has had a negative impact on the relations among the NAFTA partners.49
An economy-wide survey of investors by the industry-supported Trade Leadership Coalition reports that 72% of agricultural investors surveyed believe that the near-term (one to two years) business impacts of ending NAFTA would be negative (56% of businesses surveyed) or very negative (16%).50 Also, 78% of agricultural investors surveyed believe that the risks of NAFTA withdrawal have not been fully priced into stock valuations.51 Members of the International Chamber of Commerce have also warned that U.S. withdrawal from NAFTA or other critical changes to the agreement would "greatly restrict, rather than enhance, cross-border commerce."52
The Trump Administration has generally downplayed these types of concerns.53 However, USDA is reportedly developing a contingency plan to protect against potential agricultural losses if the United States withdraws from NAFTA.54 Again, in August 2017, President Trump and other Administration officials suggested the United States would likely withdraw from the agreement.55
Most states continue to express their support for NAFTA.56 The National Association of State Departments of Agriculture and the American Farm Bureau Federation, among other industry coalition groups, also continue to emphasize the importance of NAFTA to the U.S. agricultural sectors and the need to maintain a preferential trade relationship with Canada and Mexico.57
Many in Congress representing states with agricultural interests continue to express opposition to NAFTA withdrawal.58 In November 2017, the leadership of the House Agriculture Committee, Chairman K. Michael Conaway and Ranking Member Collin C. Peterson, joined several U.S. agriculture groups in opposing withdrawal and supporting a quick end to the ongoing NAFTA renegotiations.59 In October, 2017 Chairman Pat Roberts of the Senate Agriculture Committee expressed support for NAFTA and emphasized the need for industry leaders to present their support to the Administration.60 Senator Debbie Stabenow, Ranking Member of the Senate Agriculture Committee, has also expressed support for NAFTA.61 Reportedly, some agricultural groups believe that Congress has the ability to intervene, if President Trump withdraws the United States from NAFTA.62
Congress maintains oversight authority on industry and trade activities and has continued to monitor and conduct hearings on the ongoing NAFTA renegotiations. For additional information on the role of Congress in the ongoing negotiation, see CRS Report R44981, NAFTA Renegotiation and Modernization. For additional information on the legal aspects of congressional action in this area, see CRS Legal Sidebar WSLG1724, Renegotiation of the North American Free Trade Agreement (NAFTA): What Actions Do Not Require Congressional Approval?
Appendix A. Most-Favored-Nation (MFN) Tariff, HS-2, Agricultural and Fisheries Products (United States, Canada, Mexico)
|
HS code description |
HS-2 code |
# Tariff lines |
Avg. AV duty |
Min AV duty |
Max AV duty |
# Non-AV duty |
# Tariff lines |
Avg AV duty |
Min AV duty |
Max AV duty |
# Non-AV duty |
# Tariff lines |
Avg AV duty |
Min AV duty |
Max AV duty |
# Non-AV duty |
|
United States |
Canada |
Mexico |
||||||||||||||
|
Live animals |
01 |
37 |
0.8 |
0 |
6.8 |
11 |
42 |
0.5 |
0 |
8 |
4 |
63 |
13.1 |
0 |
20 |
0 |
|
Meat and edible meat offal |
02 |
97 |
4.5 |
0 |
26.4 |
49 |
95 |
4.0 |
0 |
26.5 |
22 |
90 |
18.0 |
0 |
75 |
0 |
|
Fish, crustaceans, mollusks, aquatic invertebrates |
03 |
272 |
0.5 |
0 |
15 |
7 |
247 |
0.5 |
0 |
6.5 |
0 |
199 |
13.5 |
0 |
15 |
1 |
|
Dairy produce, birds' eggs, natural honey, edible products of animal origin NESOI |
04 |
178 |
12.3 |
0 |
25 |
113 |
51 |
3.7 |
0 |
11 |
45 |
57 |
17.4 |
0 |
45 |
6 |
|
Products of animal origin NESOI |
05 |
21 |
0.4 |
0 |
5.1 |
1 |
16 |
0.0 |
0 |
0 |
0 |
30 |
9.3 |
0 |
20 |
0 |
|
Live trees, nursery plants, bulbs, roots, cut flowers |
06 |
31 |
3.6 |
0 |
7 |
8 |
27 |
4.8 |
0 |
16 |
0 |
72 |
13.4 |
0 |
20 |
0 |
|
Edible vegetables and certain roots and tubers |
07 |
184 |
8.7 |
0 |
29.8 |
94 |
136 |
0.3 |
0 |
10.5 |
39 |
101 |
13.4 |
0 |
75 |
0 |
|
Edible fruit and nuts, peel of citrus fruit or melons |
08 |
131 |
3.4 |
0 |
29.8 |
71 |
98 |
0.5 |
0 |
12.5 |
10 |
82 |
18.5 |
0 |
20 |
3 |
|
Coffee, tea, mate, and spices |
09 |
57 |
0.3 |
0 |
6.4 |
9 |
42 |
0.0 |
0 |
3 |
0 |
49 |
18.1 |
0 |
45 |
0 |
|
Cereals |
10 |
30 |
1.5 |
0 |
11.2 |
18 |
28 |
14.1 |
0 |
94.5 |
0 |
35 |
6.0 |
0 |
20 |
0 |
|
Products of the milling industry, malt, starches, etc. |
11 |
38 |
3.8 |
0 |
12.8 |
19 |
42 |
0.5 |
0 |
10.5 |
17 |
37 |
7.2 |
0 |
10 |
0 |
|
Oil seeds/oleaginous fruits; miscellaneous grains, seeds, etc. |
12 |
64 |
12.9 |
0 |
163.8 |
22 |
54 |
0.4 |
0 |
10 |
0 |
97 |
5.8 |
0 |
45 |
3 |
|
Lac, gums, resins, vegetable saps and extracts |
13 |
14 |
0.9 |
0 |
3.8 |
1 |
11 |
0.0 |
0 |
0 |
0 |
37 |
10.1 |
0 |
15 |
3 |
|
Vegetable plaiting materials, vegetable products NESOI |
14 |
11 |
1.1 |
0 |
4.4 |
2 |
5 |
0.0 |
0 |
0 |
0 |
9 |
8.0 |
0 |
10 |
0 |
|
Animal or vegetable fats and oils and products, prepared edible fats, animal or vegetable waxes |
15 |
69 |
3.5 |
0 |
19.1 |
33 |
61 |
3.0 |
0 |
11 |
2 |
72 |
8.0 |
0 |
20 |
0 |
|
Preparations of meat, fish, or crustaceans |
16 |
117 |
3.2 |
0 |
35 |
9 |
83 |
8.4 |
0 |
238 |
8 |
58 |
18.1 |
0 |
20 |
0 |
|
Sugars and sugar confectionery |
17 |
52 |
5.8 |
0 |
12.2 |
31 |
43 |
4.0 |
0 |
12.5 |
21 |
29 |
31.3 |
10 |
75 |
17 |
|
Cocoa and cocoa preparations |
18 |
56 |
3.2 |
0 |
10 |
34 |
15 |
2.2 |
0 |
6 |
2 |
14 |
0.8 |
0 |
5 |
8 |
|
Preparations of cereals, flour, starch/milk; pastry |
19 |
65 |
5.3 |
0 |
17.5 |
21 |
110 |
3.8 |
0 |
14.5 |
38 |
28 |
11.3 |
10 |
45 |
8 |
|
Preparations of vegetables, fruit, nuts, plant parts |
20 |
178 |
10.8 |
0 |
131.8 |
72 |
92 |
5.3 |
0 |
17 |
0 |
84 |
20.0 |
20 |
20 |
5 |
|
Miscellaneous edible preparations |
21 |
69 |
5.4 |
0 |
20 |
35 |
39 |
5.0 |
0 |
12.5 |
5 |
38 |
18.4 |
0 |
45 |
5 |
|
Beverages, spirits, and vinegar |
22 |
75 |
1.8 |
0 |
17.5 |
37 |
109 |
2.1 |
0 |
11 |
39 |
52 |
18.0 |
0 |
20 |
4 |
|
Food residues/waste, prepared animal fodder |
23 |
33 |
0.6 |
0 |
7.5 |
12 |
39 |
0.4 |
0 |
10.5 |
3 |
39 |
11.6 |
0 |
20 |
0 |
|
Tobacco and manufactured tobacco substitutes |
24 |
46 |
205.0 |
0 |
350 |
20 |
17 |
7.0 |
0 |
13 |
0 |
15 |
52.6 |
20 |
67 |
0 |
Source: CRS from WTO, "Tariff Download Facility" database (http://tariffdata.wto.org/ReportersAndProducts.aspx). Based on Harmonized Commodity Description and Coding Systems (HS), Harmonized System 2017. Product grouping excludes some agricultural commodities including cotton, essential oils, starches, and hides and skins.
Notes: AV duty = ad valorem duty. Avg. AV duty is the average across all tariffs in the chapter. Min and Max AV duty is the minimum and maximum AV duty across the chapter, respectively. #Non-AV duty reflects number of tariffs that are not expressed as ad valorem (e.g., specific tariffs). NESOI = not elsewhere specified or included.
Appendix B. Most-Favored-Nation (MFN) Tariff, HS-4, Agricultural and Fisheries Products (United States, Canada, Mexico)
|
HS code description |
HS-4 code |
# Tariff lines |
Avg AV duty |
Min AV duty |
Max AV duty |
# Non-AV duty |
# Tariff lines |
Avg AV duty |
Min AV duty |
Max AV duty |
# Non-AV duty |
# Tariff lines |
Avg AV duty |
Min AV duty |
Max AV duty |
# Non-AV duty |
|
United States |
Canada |
Mexico |
||||||||||||||
|
Live horses, asses, mules, and hinnies |
0101 |
5 |
2.3 |
0 |
6.8 |
0 |
4 |
0.0 |
0 |
0 |
0 |
7 |
16.3 |
10 |
20 |
0 |
|
Live bovine animals |
0102 |
6 |
0.0 |
0 |
0 |
3 |
5 |
0.0 |
0 |
0 |
0 |
7 |
7.0 |
0 |
15 |
0 |
|
Live swine |
0103 |
3 |
0.0 |
0 |
0 |
0 |
3 |
0.0 |
0 |
0 |
0 |
8 |
11.2 |
0 |
20 |
0 |
|
Live sheep and goats |
0104 |
2 |
0.0 |
0 |
0 |
1 |
2 |
0.0 |
0 |
0 |
0 |
6 |
8.3 |
0 |
20 |
0 |
|
Live poultry, fowls of species Gallus domesticus, ducks, geese, turkeys, and guinea fowls |
0105 |
7 |
0.0 |
0 |
0 |
7 |
15 |
2.7 |
0 |
8 |
4 |
10 |
9.8 |
0 |
20 |
0 |
|
Other live animals |
0106 |
14 |
0.7 |
0 |
4.8 |
0 |
13 |
0.0 |
0 |
0 |
0 |
25 |
17.5 |
0 |
20 |
0 |
|
Meat of bovine animals, fresh or chilled |
0201 |
10 |
17.8 |
4 |
26.4 |
3 |
3 |
26.5 |
26.5 |
26.5 |
0 |
3 |
20.0 |
20 |
20 |
0 |
|
Meat of bovine animals, frozen |
0202 |
10 |
17.8 |
4 |
26.4 |
3 |
3 |
26.5 |
26.5 |
26.5 |
0 |
3 |
25.0 |
25 |
25 |
0 |
|
Meat of swine: fresh, chilled, or frozen |
0203 |
10 |
0.0 |
0 |
0 |
4 |
6 |
0.0 |
0 |
0 |
0 |
6 |
20.0 |
20 |
20 |
0 |
|
Meat of sheep or goats: fresh, chilled, or frozen |
0204 |
13 |
0.0 |
0 |
0 |
12 |
12 |
0.5 |
0 |
2.5 |
0 |
9 |
10.0 |
10 |
10 |
0 |
|
Meat of horses, mules: fresh, chilled, or frozen |
0205 |
1 |
0.0 |
0 |
0 |
0 |
1 |
0.0 |
0 |
0 |
0 |
1 |
10.0 |
10 |
10 |
0 |
|
Edible offal of bovine animals, swine, sheep, goats, horses, asses, mules: fresh, chilled, or frozen |
0206 |
9 |
0.0 |
0 |
0 |
0 |
9 |
0.0 |
0 |
0 |
0 |
11 |
14.4 |
0 |
20 |
0 |
|
Meat and edible offal of the poultry of heading 0105: fresh, chilled, or frozen |
0207 |
24 |
10.0 |
10 |
10 |
23 |
37 |
4.9 |
0 |
9 |
16 |
35 |
28.5 |
0 |
75 |
0 |
|
Other meat and edible offal: fresh, chilled, frozen |
0208 |
9 |
5.7 |
0 |
6.4 |
1 |
7 |
0.0 |
0 |
0 |
0 |
8 |
10.0 |
10 |
10 |
0 |
|
Pig and poultry fat ... extracted, fresh, chilled, frozen, salted, in brine, dried, or smoked |
0209 |
2 |
3.2 |
3.2 |
3.2 |
0 |
4 |
5.5 |
0 |
11 |
2 |
3 |
11.3 |
0 |
15 |
0 |
|
Meat and edible offal, salted, in brine, dried or smoked; edible flours and meals of meat or offal |
0210 |
9 |
1.8 |
0 |
2.3 |
3 |
13 |
0.2 |
0 |
2.5 |
4 |
11 |
10.2 |
10 |
15 |
0 |
|
Live fish |
0301 |
8 |
0.0 |
0 |
0 |
0 |
8 |
0.0 |
0 |
0 |
0 |
9 |
10.0 |
0 |
15 |
1 |
|
Fish, fresh or chilled, excluding fish fillets and other fish meat of heading 0304 |
0302 |
59 |
0.6 |
0 |
15 |
1 |
45 |
0.1 |
0 |
3 |
0 |
43 |
12.4 |
0 |
15 |
0 |
|
Fish, frozen, excluding fish fillets and other fish meat of heading 0304 |
0303 |
45 |
0.2 |
0 |
15 |
6 |
44 |
0.1 |
0 |
3 |
0 |
42 |
12.2 |
0 |
15 |
0 |
|
Fish fillets and other fish meat (whether or not minced), fresh, chilled, or frozen |
0304 |
64 |
0.6 |
0 |
6 |
0 |
48 |
0.0 |
0 |
0 |
0 |
41 |
15.0 |
15 |
15 |
0 |
|
Fish, dried, salted or in brine; smoked fish |
0305 |
37 |
0.9 |
0 |
7.5 |
0 |
23 |
0.1 |
0 |
3 |
0 |
23 |
15.0 |
15 |
15 |
0 |
|
Crustaceans (live, fresh, chilled, frozen, dried, salted ... ) |
0306 |
23 |
0.6 |
0 |
7.5 |
0 |
23 |
3.1 |
0 |
5 |
0 |
16 |
13.9 |
0 |
15 |
0 |
|
Mollusks (live, fresh, chilled, frozen, dried, salted ... ) |
0307 |
28 |
0.2 |
0 |
5 |
0 |
42 |
1.1 |
0 |
6.5 |
0 |
19 |
15.0 |
15 |
15 |
0 |
|
Aquatic invertebrates (live, fresh, chilled, frozen, dried, salted ... ) |
0308 |
8 |
0.0 |
0 |
0 |
0 |
14 |
1.5 |
0 |
4 |
0 |
6 |
15.0 |
15 |
15 |
0 |
|
Milk and cream, not concentrated nor containing added sugar or other sweetening matter |
0401 |
8 |
0.0 |
0 |
0 |
8 |
4 |
0.0 |
0 |
0 |
4 |
8 |
10.0 |
10 |
10 |
0 |
|
Milk and cream, concentrated or containing added sugar or other sweetening matter |
0402 |
20 |
17.5 |
17.5 |
17.5 |
18 |
7 |
0.0 |
0 |
0 |
7 |
9 |
35.0 |
10 |
45 |
4 |
|
Buttermilk, curdled milk and cream, yogurt, and fermented/acidified milk and cream... |
0403 |
17 |
18.5 |
17 |
20 |
13 |
3 |
0.0 |
0 |
0 |
3 |
2 |
20.0 |
20 |
20 |
0 |
|
Whey |
0404 |
10 |
11.1 |
8.5 |
14.5 |
6 |
4 |
11.0 |
11 |
11 |
3 |
3 |
15.0 |
10 |
20 |
1 |
|
Butter, fats, and oils derived from milk; dairy spreads |
0405 |
10 |
9.1 |
6.4 |
10 |
7 |
3 |
0.0 |
0 |
0 |
3 |
5 |
15.0 |
0 |
20 |
1 |
|
Cheese and curd |
0406 |
102 |
11.7 |
0 |
25 |
51 |
17 |
0.0 |
0 |
0 |
17 |
12 |
32.3 |
0 |
45 |
0 |
|
Birds' eggs, in shell: fresh, preserved, or cooked |
0407 |
5 |
0.0 |
0 |
0 |
5 |
7 |
0.0 |
0 |
0 |
4 |
8 |
10.5 |
0 |
45 |
0 |
|
Birds' eggs, not in shell... |
0408 |
4 |
0.0 |
0 |
0 |
4 |
4 |
0.0 |
0 |
0 |
4 |
7 |
1.7 |
0 |
20 |
0 |
|
Natural honey |
0409 |
1 |
0.0 |
0 |
0 |
1 |
1 |
0.0 |
0 |
0 |
0 |
1 |
20.0 |
20 |
20 |
0 |
|
Edible products of animal origin NESOI |
0410 |
1 |
1.1 |
1.1 |
1.1 |
0 |
1 |
11.0 |
11 |
11 |
0 |
2 |
20.0 |
20 |
20 |
0 |
|
Human hair, unworked, whether or not washed or scoured; waste of human hair |
0501 |
1 |
1.4 |
1.4 |
1.4 |
0 |
1 |
0.0 |
0 |
0 |
0 |
1 |
20.0 |
20 |
20 |
0 |
|
Pigs', hogs', or boars' bristles and hair; badger hair and other brush making hair... |
0502 |
2 |
0.0 |
0 |
0 |
1 |
2 |
0.0 |
0 |
0 |
0 |
2 |
5.0 |
0 |
10 |
0 |
|
Guts, bladders, and stomachs of animals... |
0504 |
1 |
0.0 |
0 |
0 |
0 |
1 |
0.0 |
0 |
0 |
0 |
1 |
10.0 |
10 |
10 |
0 |
|
Skins and other parts of birds... |
0505 |
3 |
0.6 |
0 |
2.3 |
0 |
2 |
0.0 |
0 |
0 |
0 |
2 |
10.0 |
10 |
10 |
0 |
|
Bones and horn-cores... |
0506 |
2 |
0.0 |
0 |
0 |
0 |
2 |
0.0 |
0 |
0 |
0 |
2 |
10.0 |
10 |
10 |
0 |
|
Ivory, tortoise-shell, whalebone... |
0507 |
2 |
0.0 |
0 |
0 |
0 |
2 |
0.0 |
0 |
0 |
0 |
3 |
10.0 |
10 |
10 |
0 |
|
Coral and similar materials... |
0508 |
1 |
0.0 |
0 |
0 |
0 |
1 |
0.0 |
0 |
0 |
0 |
2 |
10.0 |
10 |
10 |
0 |
|
Ambergris, castoreum, civet, and musk... |
0510 |
2 |
2.6 |
0 |
5.1 |
0 |
1 |
0.0 |
0 |
0 |
0 |
4 |
10.0 |
10 |
10 |
0 |
|
Animal products NESOI |
0511 |
7 |
0.3 |
0 |
3 |
0 |
4 |
0.0 |
0 |
0 |
0 |
13 |
6.7 |
0 |
20 |
0 |
|
Bulbs, tubers, tuberous roots, corms, crowns... |
0601 |
9 |
2.5 |
1.4 |
3.5 |
7 |
6 |
3.0 |
0 |
6 |
0 |
19 |
5.0 |
0 |
10 |
0 |
|
Other live plants, cuttings... mushroom spawn |
0602 |
10 |
1.8 |
0 |
4.8 |
1 |
7 |
1.2 |
0 |
6 |
0 |
28 |
6.7 |
0 |
10 |
0 |
|
Cut flowers ... suitable for bouquets... |
0603 |
8 |
5.9 |
3.2 |
6.8 |
0 |
10 |
8.2 |
0 |
16 |
0 |
16 |
20.0 |
20 |
20 |
0 |
|
Foliage, branches, and other parts of plants... |
0604 |
4 |
1.2 |
0 |
7 |
0 |
4 |
3.5 |
0 |
8 |
0 |
9 |
15.5 |
0 |
20 |
0 |
|
Potatoes, fresh or chilled |
0701 |
3 |
0.0 |
0 |
0 |
3 |
2 |
0.0 |
0 |
0 |
2 |
2 |
37.5 |
0 |
75 |
0 |
|
Tomatoes, fresh or chilled |
0702 |
3 |
0.0 |
0 |
0 |
3 |
5 |
0.0 |
0 |
0 |
2 |
3 |
10.0 |
10 |
10 |
0 |
|
Onions, shallots, garlic, leeks, and other alliaceous vegetables, fresh or chilled |
0703 |
5 |
20.0 |
20 |
20 |
4 |
10 |
0.0 |
0 |
0 |
4 |
5 |
10.0 |
10 |
10 |
0 |
|
Cabbages, cauliflowers, kohlrabi, kale, and similar edible brassicas, fresh or chilled |
0704 |
6 |
13.8 |
2.5 |
20 |
1 |
14 |
0.0 |
0 |
0 |
7 |
6 |
10.0 |
10 |
10 |
0 |
|
Lettuce (Lactuca sativa) and chicory (Cichorium spp.), fresh or chilled |
0705 |
6 |
0.0 |
0 |
0 |
6 |
8 |
0.0 |
0 |
0 |
4 |
4 |
10.0 |
10 |
10 |
0 |
|
Carrots, turnips, salad beetroot, salsify, celeriac, radishes, and similar edible roots, fresh or chilled |
0706 |
7 |
6.2 |
0 |
14.9 |
2 |
15 |
0.0 |
0 |
0 |
7 |
2 |
10.0 |
10 |
10 |
0 |
|
Cucumbers and gherkins, fresh or chilled |
0707 |
4 |
0.0 |
0 |
0 |
4 |
3 |
0.0 |
0 |
0 |
1 |
1 |
10.0 |
10 |
10 |
0 |
|
Leguminous vegetables, shelled or unshelled, fresh or chilled |
0708 |
10 |
0.0 |
0 |
0 |
8 |
9 |
0.0 |
0 |
0 |
3 |
3 |
10.0 |
10 |
10 |
0 |
|
Other vegetables, fresh or chilled |
0709 |
24 |
12.8 |
0 |
21.3 |
10 |
26 |
0.0 |
0 |
0 |
9 |
16 |
10.0 |
10 |
10 |
0 |
|
Vegetables (uncooked or cooked by steaming or boiling in water), frozen |
0710 |
29 |
9.9 |
0 |
14.9 |
14 |
8 |
0.0 |
0 |
0 |
0 |
13 |
15.1 |
15 |
20 |
0 |
|
Vegetables provisionally preserved... |
0711 |
11 |
6.9 |
0 |
8 |
5 |
6 |
1.1 |
0 |
10.5 |
0 |
8 |
14.8 |
10 |
15 |
0 |
|
Dried vegetables, whole, cut, sliced, broken, or in powder but not further prepared |
0712 |
20 |
10.0 |
0 |
29.8 |
7 |
9 |
1.8 |
0 |
6 |
0 |
9 |
19.8 |
15 |
20 |
0 |
|
Dried leguminous vegetables, shelled, whether or not skinned or split |
0713 |
31 |
0.0 |
0 |
0 |
27 |
15 |
0.5 |
0 |
5.5 |
0 |
16 |
11.6 |
0 |
45 |
0 |
|
Manioc, arrowroot, salep, Jerusalem artichokes, sweet potatoes, and similar roots and tubers... |
0714 |
25 |
7.4 |
0 |
20 |
0 |
6 |
0.0 |
0 |
0 |
0 |
13 |
14.7 |
10 |
20 |
0 |
|
Coconuts, Brazil nuts, and cashew nuts, fresh or dried, whether or not shelled or peeled |
0801 |
7 |
0.0 |
0 |
0 |
0 |
7 |
0.0 |
0 |
0 |
0 |
7 |
20.0 |
20 |
20 |
0 |
|
Other nuts, fresh/dried, shelled/peeled |
0802 |
22 |
0.0 |
0 |
0 |
20 |
15 |
0.0 |
0 |
0 |
0 |
16 |
17.0 |
0 |
20 |
0 |
|
Bananas, including plantains, fresh or dried |
0803 |
3 |
0.4 |
0 |
1.4 |
0 |
2 |
0.0 |
0 |
0 |
0 |
2 |
20.0 |
20 |
20 |
0 |
|
Dates, figs, pineapples, avocados, guavas, mangoes, and mangosteens, fresh or dried |
0804 |
14 |
29.8 |
29.8 |
29.8 |
13 |
5 |
0.0 |
0 |
0 |
0 |
9 |
20.0 |
20 |
20 |
0 |
|
Citrus fruit, fresh or dried |
0805 |
11 |
0.8 |
0.8 |
0.8 |
9 |
7 |
0.0 |
0 |
0 |
0 |
7 |
20.0 |
20 |
20 |
0 |
|
Grapes, fresh or dried |
0806 |
6 |
0.0 |
0 |
0 |
5 |
5 |
1.0 |
0 |
6 |
1 |
2 |
17.5 |
15 |
20 |
0 |
|
Melons, watermelons, papaws (papayas), fresh |
0807 |
9 |
10.8 |
1.6 |
29.8 |
0 |
3 |
0.0 |
0 |
0 |
0 |
4 |
20.0 |
20 |
20 |
0 |
|
Apples, pears, and quinces, fresh |
0808 |
5 |
0.0 |
0 |
0 |
2 |
6 |
1.4 |
0 |
8.5 |
1 |
3 |
20.0 |
20 |
20 |
0 |
|
Apricots, cherries, peaches (including nectarines), plums, and sloes, fresh |
0809 |
7 |
0.0 |
0 |
0 |
3 |
21 |
1.9 |
0 |
8.5 |
6 |
6 |
20.0 |
20 |
20 |
0 |
|
Other fruit, fresh |
0810 |
11 |
0.8 |
0 |
2.2 |
3 |
13 |
0.0 |
0 |
0 |
1 |
8 |
17.5 |
0 |
20 |
0 |
|
Fruit and nuts, uncooked or cooked by steaming or boiling in water, frozen... |
0811 |
14 |
8.2 |
0 |
14.5 |
1 |
6 |
5.8 |
0 |
12.5 |
1 |
3 |
0.0 |
0 |
0 |
3 |
|
Fruit and nuts, provisionally preserved... |
0812 |
7 |
11.2 |
11.2 |
11.2 |
6 |
2 |
0.0 |
0 |
0 |
0 |
4 |
10.0 |
0 |
20 |
0 |
|
Fruit, dried, NESOI |
0813 |
12 |
10.6 |
1.8 |
14 |
7 |
5 |
0.0 |
0 |
0 |
0 |
10 |
20.0 |
20 |
20 |
0 |
|
Peel of citrus fruit or melons... |
0814 |
3 |
0.0 |
0 |
0 |
2 |
1 |
0.0 |
0 |
0 |
0 |
1 |
15.0 |
15 |
15 |
0 |
|
Coffee... |
0901 |
6 |
0.0 |
0 |
0 |
1 |
5 |
0.0 |
0 |
0 |
0 |
7 |
35.0 |
20 |
45 |
0 |
|
Tea, whether or not flavored |
0902 |
6 |
1.6 |
0 |
6.4 |
0 |
6 |
0.0 |
0 |
0 |
0 |
4 |
20.0 |
20 |
20 |
0 |
|
Maté |
0903 |
1 |
0.0 |
0 |
0 |
0 |
1 |
0.0 |
0 |
0 |
0 |
1 |
20.0 |
20 |
20 |
0 |
|
Pepper of the genus Piper, dried or crushed or ground fruits of the genus Capsicum or ... Pimenta |
0904 |
11 |
0.0 |
0 |
0 |
6 |
5 |
0.4 |
0 |
3 |
0 |
6 |
20.0 |
20 |
20 |
0 |
|
Vanilla |
0905 |
2 |
0.0 |
0 |
0 |
0 |
2 |
0.0 |
0 |
0 |
0 |
2 |
20.0 |
20 |
20 |
0 |
|
Cinnamon and cinnamon-tree flowers |
0906 |
3 |
0.0 |
0 |
0 |
0 |
3 |
0.0 |
0 |
0 |
0 |
3 |
3.3 |
0 |
10 |
0 |
|
Cloves (whole fruit, cloves, and stems) |
0907 |
2 |
0.0 |
0 |
0 |
0 |
2 |
0.0 |
0 |
0 |
0 |
2 |
10.0 |
10 |
10 |
0 |
|
Nutmeg, mace, and cardamoms |
0908 |
7 |
0.0 |
0 |
0 |
1 |
6 |
0.0 |
0 |
0 |
0 |
6 |
20.0 |
20 |
20 |
0 |
|
Seeds of anise, badian, fennel, coriander, cumin, or caraway; juniper berries |
0909 |
6 |
0.0 |
0 |
0 |
0 |
6 |
0.0 |
0 |
0 |
0 |
10 |
11.7 |
10 |
20 |
0 |
|
Ginger, saffron, turmeric (curcuma), thyme, bay leaves, curry, and other spices |
0910 |
13 |
0.7 |
0 |
4.8 |
1 |
6 |
0.0 |
0 |
0 |
0 |
8 |
15.0 |
10 |
20 |
0 |
|
Wheat and meslin |
1001 |
4 |
2.8 |
2.8 |
2.8 |
3 |
4 |
62.8 |
49 |
76.5 |
0 |
6 |
11.3 |
0 |
15 |
0 |
|
Rye |
1002 |
2 |
0.0 |
0 |
0 |
0 |
2 |
0.0 |
0 |
0 |
0 |
2 |
0.0 |
0 |
0 |
0 |
|
Barley |
1003 |
3 |
0.0 |
0 |
0 |
3 |
4 |
57.8 |
21 |
94.5 |
0 |
3 |
0.0 |
0 |
0 |
0 |
|
Oats |
1004 |
2 |
0.0 |
0 |
0 |
0 |
2 |
0.0 |
0 |
0 |
0 |
2 |
0.0 |
0 |
0 |
0 |
|
Maize (corn) |
1005 |
3 |
0.0 |
0 |
0 |
2 |
2 |
0.0 |
0 |
0 |
0 |
6 |
2.0 |
0 |
20 |
0 |
|
Rice |
1006 |
6 |
11.2 |
11.2 |
11.2 |
5 |
4 |
0.0 |
0 |
0 |
0 |
5 |
17.3 |
9 |
20 |
0 |
|
Grain sorghum |
1007 |
2 |
0.0 |
0 |
0 |
2 |
2 |
0.0 |
0 |
0 |
0 |
3 |
3.8 |
0 |
15 |
0 |
|
Buckwheat, millet and canary seeds; other cereals |
1008 |
8 |
0.9 |
0 |
1.1 |
3 |
8 |
0.0 |
0 |
0 |
0 |
8 |
3.8 |
0 |
15 |
0 |
|
Wheat or meslin flour |
1101 |
1 |
0.0 |
0 |
0 |
1 |
1 |
0.0 |
0 |
0 |
1 |
1 |
10.0 |
10 |
10 |
0 |
|
Cereal flours other than of wheat or meslin |
1102 |
6 |
7.3 |
0 |
12.8 |
3 |
5 |
0.0 |
0 |
0 |
1 |
4 |
10.0 |
10 |
10 |
0 |
|
Cereal groats, meal, and pellets |
1103 |
6 |
4.5 |
0 |
9 |
4 |
7 |
0.0 |
0 |
0 |
4 |
7 |
5.0 |
5 |
5 |
0 |
|
Cereal grains otherwise worked... |
1104 |
8 |
2.3 |
0.5 |
4.5 |
4 |
11 |
0.0 |
0 |
0 |
5 |
8 |
4.2 |
0 |
5 |
0 |
|
Flour, meal, powder, flakes, potato granules/pellets |
1105 |
2 |
0.0 |
0 |
0 |
2 |
2 |
0.0 |
0 |
0 |
0 |
2 |
10.0 |
10 |
10 |
0 |
|
Flour, meal, and powder of the dried leguminous vegetables... |
1106 |
5 |
6.2 |
0 |
9.6 |
0 |
4 |
0.0 |
0 |
0 |
0 |
5 |
10.0 |
10 |
10 |
0 |
|
Malt, whether or not roasted |
1107 |
2 |
0.0 |
0 |
0 |
2 |
4 |
0.0 |
0 |
0 |
3 |
2 |
0.0 |
0 |
0 |
0 |
|
Starches, inulin |
1108 |
6 |
0.9 |
0 |
2.6 |
3 |
7 |
2.1 |
0 |
10.5 |
2 |
7 |
10.0 |
10 |
10 |
0 |
|
Wheat gluten, whether or not dried |
1109 |
2 |
4.3 |
1.8 |
6.8 |
0 |
1 |
0.0 |
0 |
0 |
1 |
1 |
10.0 |
10 |
10 |
0 |
|
Soya beans, whether or not broken |
1201 |
2 |
0.0 |
0 |
0 |
0 |
2 |
0.0 |
0 |
0 |
0 |
3 |
3.8 |
0 |
15 |
0 |
|
Ground-nuts, not roasted or otherwise cooked, whether or not shelled or broken |
1202 |
3 |
142.5 |
131.8 |
163.8 |
0 |
3 |
0.0 |
0 |
0 |
0 |
3 |
0.0 |
0 |
0 |
0 |
|
Copra |
1203 |
1 |
0.0 |
0 |
0 |
0 |
1 |
0.0 |
0 |
0 |
0 |
1 |
45.0 |
45 |
45 |
0 |
|
Linseed, whether or not broken |
1204 |
1 |
0.0 |
0 |
0 |
1 |
1 |
0.0 |
0 |
0 |
0 |
1 |
0.0 |
0 |
0 |
0 |
|
Rape or colza seeds, whether or not broken |
1205 |
2 |
0.0 |
0 |
0 |
2 |
2 |
0.0 |
0 |
0 |
0 |
2 |
0.0 |
0 |
0 |
0 |
|
Sunflower seeds, whether or not broken |
1206 |
1 |
0.0 |
0 |
0 |
0 |
1 |
0.0 |
0 |
0 |
0 |
2 |
0.0 |
0 |
0 |
0 |
|
Other oil seeds and oleaginous fruits, whether or not broken |
1207 |
10 |
0.0 |
0 |
0 |
4 |
10 |
0.0 |
0 |
0 |
0 |
14 |
1.3 |
0 |
10 |
0 |
|
Flours and meals of oil seeds or oleaginous fruits, other than those of mustard |
1208 |
2 |
1.7 |
1.4 |
1.9 |
0 |
2 |
0.0 |
0 |
0 |
0 |
5 |
15.0 |
15 |
15 |
1 |
|
Seeds, fruit and spores, of a kind used for sowing |
1209 |
18 |
0.0 |
0 |
0 |
9 |
13 |
0.8 |
0 |
5.5 |
0 |
36 |
1.1 |
0 |
9 |
1 |
|
Hop cones, fresh or dried, whether or not ground, powdered, or in the form of pellets... |
1210 |
2 |
0.0 |
0 |
0 |
2 |
2 |
0.0 |
0 |
0 |
0 |
2 |
0.0 |
0 |
0 |
0 |
|
Plants and parts of plants |
1211 |
10 |
1.1 |
0 |
6 |
1 |
7 |
0.0 |
0 |
0 |
0 |
11 |
8.8 |
5 |
10 |
1 |
|
Locust beans, seaweeds, and other algae, sugar beet and sugar cane: fresh, chilled, frozen, dried |
1212 |
9 |
0.0 |
0 |
0 |
3 |
7 |
0.0 |
0 |
0 |
0 |
13 |
14.4 |
0 |
36 |
0 |
|
Cereal straw and husks, unprepared, whether or not chopped, ground, pressed, or pellets |
1213 |
1 |
0.0 |
0 |
0 |
0 |
1 |
0.0 |
0 |
0 |
0 |
1 |
10.0 |
10 |
10 |
0 |
|
Swedes, mangolds, fodder roots, hay, alfalfa, clover, sainfoin, forage kale, lupines, vetches |
1214 |
2 |
0.7 |
0 |
1.4 |
0 |
2 |
5.0 |
0 |
10 |
0 |
3 |
13.8 |
10 |
15 |
0 |
|
Lac; natural gums, resins, gum-resins, and oleoresins |
1301 |
3 |
0.3 |
0 |
1.3 |
0 |
2 |
0.0 |
0 |
0 |
0 |
4 |
10.0 |
10 |
10 |
0 |
|
Vegetable saps and extracts; pectic substances, pectinates, and pectates |
1302 |
11 |
1.0 |
0 |
3.8 |
1 |
9 |
0.0 |
0 |
0 |
0 |
33 |
10.1 |
0 |
15 |
3 |
|
Vegetable materials used primarily for plaiting... |
1401 |
5 |
1.6 |
0 |
4.4 |
0 |
3 |
0.0 |
0 |
0 |
0 |
3 |
6.7 |
0 |
10 |
0 |
|
Vegetable products NESOI |
1404 |
6 |
0.4 |
0 |
2.3 |
2 |
2 |
0.0 |
0 |
0 |
0 |
6 |
10.0 |
10 |
10 |
0 |
|
Pig fat (including lard) and poultry fat NESOI |
1501 |
3 |
0.0 |
0 |
0 |
3 |
3 |
0.0 |
0 |
0 |
0 |
3 |
15.0 |
15 |
15 |
0 |
|
Fats of bovine animals, sheep, or goats NESOI |
1502 |
2 |
0.0 |
0 |
0 |
2 |
2 |
0.0 |
0 |
0 |
0 |
2 |
10.0 |
10 |
10 |
0 |
|
Lard stearin, lard oil, oleostearin, oleo-oil, and tallow oil, not emulsified, mixed or prepared |
1503 |
1 |
0.0 |
0 |
0 |
1 |
1 |
0.0 |
0 |
0 |
0 |
2 |
10.0 |
10 |
10 |
0 |
|
Fats, oils and their fractions, of fish or marine mammals... |
1504 |
6 |
0.6 |
0 |
2.5 |
3 |
5 |
0.6 |
0 |
5 |
0 |
5 |
8.3 |
0 |
10 |
0 |
|
Wool grease and fatty substances... |
1505 |
2 |
2.4 |
2.4 |
2.4 |
1 |
1 |
0.0 |
0 |
0 |
0 |
4 |
10.0 |
10 |
10 |
0 |
|
Other animal fats and oils and their fractions... |
1506 |
1 |
2.3 |
2.3 |
2.3 |
0 |
1 |
0.0 |
0 |
0 |
0 |
3 |
13.3 |
10 |
20 |
0 |
|
Soya-bean oil and its fractions... |
1507 |
3 |
14.3 |
0 |
19.1 |
0 |
2 |
2.3 |
0 |
4.5 |
0 |
2 |
5.0 |
5 |
5 |
0 |
|
Ground-nut oil and its fractions... |
1508 |
2 |
0.0 |
0 |
0 |
2 |
2 |
7.0 |
4.5 |
9.5 |
0 |
2 |
15.0 |
10 |
20 |
0 |
|
Olive oil and its fractions... |
1509 |
4 |
0.0 |
0 |
0 |
4 |
2 |
0.0 |
0 |
0 |
0 |
5 |
0.0 |
0 |
0 |
0 |
|
Other oils and their fractions... |
1510 |
3 |
0.0 |
0 |
0 |
2 |
1 |
0.0 |
0 |
0 |
0 |
1 |
10.0 |
10 |
10 |
0 |
|
Palm oil and its fractions... |
1511 |
2 |
0.0 |
0 |
0 |
0 |
2 |
3.0 |
0 |
6 |
0 |
2 |
4.0 |
3 |
5 |
0 |
|
Sunflower-seed, safflower or cotton-seed oil... |
1512 |
4 |
0.0 |
0 |
0 |
4 |
7 |
5.9 |
0 |
11 |
0 |
4 |
2.5 |
0 |
5 |
0 |
|
Coconut (copra), palm kernel, or babassu oil... |
1513 |
4 |
0.0 |
0 |
0 |
0 |
6 |
5.8 |
0 |
11 |
0 |
4 |
1.5 |
0 |
3 |
0 |
|
Rape, colza, mustard oil and fractions thereof... |
1514 |
7 |
4.8 |
0 |
6.4 |
1 |
4 |
8.5 |
6 |
11 |
0 |
4 |
0.0 |
0 |
0 |
0 |
|
Other fixed vegetable fats and oils, jojoba oil... |
1515 |
9 |
2.2 |
0 |
3.4 |
3 |
9 |
4.4 |
0 |
11 |
0 |
12 |
11.4 |
0 |
20 |
0 |
|
Animal or vegetable fats/oils and their fractions... |
1516 |
3 |
7.7 |
7.7 |
7.7 |
2 |
2 |
0.0 |
0 |
0 |
0 |
2 |
10.0 |
5 |
15 |
0 |
|
Margarine, edible mixtures or preparations of animal or vegetable fats or oils... |
1517 |
6 |
13.0 |
8 |
18 |
4 |
6 |
5.5 |
0 |
11 |
2 |
4 |
20.0 |
20 |
20 |
0 |
|
Animal or vegetable fats/oils and their fractions... |
1518 |
2 |
8.0 |
8 |
8 |
1 |
1 |
0.0 |
0 |
0 |
0 |
3 |
8.3 |
0 |
15 |
0 |
|
Glycerol, crude; glycerol waters and glycerol lyes |
1520 |
1 |
0.0 |
0 |
0 |
0 |
1 |
0.0 |
0 |
0 |
0 |
1 |
10.0 |
10 |
10 |
0 |
|
Vegetable waxes (other than triglycerides), beeswax, other insect waxes and spermaceti... |
1521 |
3 |
1.2 |
0 |
4.8 |
0 |
2 |
0.0 |
0 |
0 |
0 |
6 |
8.8 |
0 |
15 |
0 |
|
Degras, residues resulting from the treatment of fatty substances or animal or vegetable waxes |
1522 |
1 |
3.8 |
3.8 |
3.8 |
0 |
1 |
0.0 |
0 |
0 |
0 |
1 |
10.0 |
10 |
10 |
0 |
|
Sausages and similar products of meat, meat offal, or blood; preparations based on these products |
1601 |
3 |
3.3 |
3.2 |
3.4 |
1 |
6 |
69.6 |
0 |
238 |
0 |
2 |
15.0 |
15 |
15 |
0 |
|
Other prepared/preserved meat, meat offal/blood |
1602 |
25 |
4.9 |
0 |
6.4 |
7 |
35 |
16.4 |
0 |
238 |
8 |
14 |
20.0 |
20 |
20 |
0 |
|
Extracts and juices of meat, fish, crustaceans, mollusks, or other aquatic invertebrates |
1603 |
2 |
4.3 |
0 |
8.5 |
0 |
2 |
1.5 |
0 |
3 |
0 |
2 |
10.0 |
0 |
20 |
0 |
|
Prepared or preserved fish, caviar and caviar substitutes prepared from fish eggs |
1604 |
48 |
5.2 |
0 |
35 |
1 |
19 |
5.2 |
0 |
11 |
0 |
21 |
14.2 |
0 |
20 |
0 |
|
Crustaceans, mollusks, and other aquatic invertebrates, prepared or preserved |
1605 |
39 |
1.1 |
0 |
10 |
0 |
21 |
3.1 |
0 |
6.5 |
0 |
19 |
20.0 |
20 |
20 |
0 |
|
Cane or beet sugar and chemically pure sucrose |
1701 |
16 |
5.7 |
5.1 |
6 |
13 |
9 |
0.0 |
0 |
0 |
6 |
11 |
0.0 |
0 |
0 |
11 |
|
Other sugars, including chemically pure lactose, maltose, glucose, and fructose... |
1702 |
23 |
6.0 |
0 |
9.6 |
11 |
26 |
4.0 |
0 |
11 |
15 |
13 |
31.3 |
10 |
75 |
1 |
|
Molasses from the extraction or refining of sugar |
1703 |
4 |
0.0 |
0 |
0 |
4 |
4 |
6.3 |
0 |
12.5 |
0 |
3 |
0.0 |
0 |
0 |
3 |
|
Sugar confectionery (including white chocolate) not containing cocoa |
1704 |
9 |
5.3 |
0 |
12.2 |
3 |
4 |
8.0 |
0 |
10 |
0 |
2 |
0.0 |
0 |
0 |
2 |
|
Cocoa beans, whole or broken, raw or roasted |
1801 |
1 |
0.0 |
0 |
0 |
0 |
1 |
0.0 |
0 |
0 |
0 |
1 |
0.0 |
0 |
0 |
0 |
|
Cocoa shells, husks, skins, and other cocoa waste |
1802 |
1 |
0.0 |
0 |
0 |
0 |
1 |
0.0 |
0 |
0 |
0 |
1 |
0.0 |
0 |
0 |
0 |
|
Cocoa paste, whether or not defatted |
1803 |
2 |
0.0 |
0 |
0 |
1 |
2 |
0.0 |
0 |
0 |
0 |
2 |
0.0 |
0 |
0 |
0 |
|
Cocoa butter, fat, and oil |
1804 |
1 |
0.0 |
0 |
0 |
0 |
1 |
0.0 |
0 |
0 |
0 |
1 |
0.0 |
0 |
0 |
0 |
|
Cocoa powder, not containing added sugar or other sweetening matter |
1805 |
1 |
0.0 |
0 |
0 |
1 |
1 |
0.0 |
0 |
0 |
0 |
1 |
5.0 |
5 |
5 |
0 |
|
Chocolate/food preparations containing cocoa |
1806 |
50 |
5.7 |
0 |
10 |
32 |
9 |
4.8 |
0 |
6 |
2 |
8 |
0.0 |
0 |
0 |
8 |
|
Malt extract; food preparations of flour, groats, meal, starch, malt extract, not containing cocoa |
1901 |
44 |
11.0 |
0 |
17.5 |
20 |
19 |
4.4 |
0 |
9.5 |
9 |
11 |
12.9 |
10 |
45 |
4 |
|
Pasta, whether or not cooked or stuffed... |
1902 |
7 |
5.1 |
0 |
6.4 |
0 |
20 |
4.9 |
0 |
11 |
4 |
5 |
12.0 |
10 |
20 |
0 |
|
Tapioca and substitutes therefor prepared from starch, in the form of flakes, grains, pearls... |
1903 |
2 |
0.0 |
0 |
0 |
1 |
1 |
0.0 |
0 |
0 |
0 |
1 |
10.0 |
10 |
10 |
0 |
|
Prepared foods obtained by the swelling or roasting of cereals or cereal products... |
1904 |
5 |
9.8 |
1.1 |
14.9 |
0 |
25 |
4.7 |
4 |
6 |
12 |
4 |
10.0 |
10 |
10 |
2 |
|
Bread, pastry, cakes, biscuits and other bakers' wares, whether or not containing cocoa... |
1905 |
7 |
0.4 |
0 |
4.5 |
0 |
45 |
2.7 |
0 |
14.5 |
13 |
7 |
10.0 |
10 |
10 |
2 |
|
Vegetables, fruit, nuts, and edible parts of plants, prepared/preserved by vinegar or acetic acid |
2001 |
14 |
9.0 |
3.6 |
14 |
3 |
3 |
6.0 |
0 |
8 |
0 |
5 |
20.0 |
20 |
20 |
0 |
|
Tomatoes prepared or preserved otherwise than by vinegar or acetic acid |
2002 |
3 |
12.1 |
11.6 |
12.5 |
0 |
2 |
11.5 |
11.5 |
11.5 |
0 |
2 |
20.0 |
20 |
20 |
0 |
|
Mushrooms and truffles, prepared or preserved otherwise than by vinegar or acetic acid |
2003 |
3 |
0.0 |
0 |
0 |
2 |
3 |
12.8 |
0 |
17 |
0 |
2 |
20.0 |
20 |
20 |
0 |
|
Other vegetables prepared or preserved... |
2004 |
5 |
7.2 |
3.2 |
11.2 |
1 |
7 |
8.8 |
0 |
17 |
0 |
4 |
20.0 |
20 |
20 |
0 |
|
Other vegetables prepared or preserved... |
2005 |
31 |
7.4 |
0 |
14.9 |
16 |
15 |
7.0 |
0 |
14.5 |
0 |
12 |
20.0 |
20 |
20 |
0 |
|
Vegetables, fruit, nuts, fruit-peel, and other parts of plants, preserved by sugar... |
2006 |
7 |
8.9 |
2.1 |
16 |
2 |
3 |
5.2 |
0 |
9.5 |
0 |
4 |
20.0 |
20 |
20 |
1 |
|
Jams, fruit jellies, marmalades, fruit or nut purée, and fruit or nut pastes... |
2007 |
20 |
7.9 |
0 |
14 |
0 |
5 |
7.3 |
0 |
12.5 |
0 |
7 |
20.0 |
20 |
20 |
4 |
|
Fruit, nuts, and other edible parts of plants, otherwise prepared or preserved... |
2008 |
65 |
18.7 |
0 |
131.8 |
21 |
26 |
4.7 |
0 |
12.5 |
0 |
24 |
20.0 |
20 |
20 |
0 |
|
Fruit juices (including grape must) and vegetable juices, unfermented... |
2009 |
30 |
0.0 |
0 |
0 |
27 |
28 |
2.4 |
0 |
12.5 |
0 |
24 |
20.0 |
20 |
20 |
0 |
|
Extracts, essences, and concentrates of coffee, tea, or maté and preparations... |
2101 |
14 |
5.1 |
0 |
10 |
7 |
5 |
0.0 |
0 |
0 |
0 |
6 |
27.5 |
0 |
45 |
0 |
|
Yeasts (active or inactive)... |
2102 |
5 |
3.2 |
0 |
6.4 |
0 |
3 |
0.0 |
0 |
0 |
0 |
6 |
13.6 |
10 |
15 |
0 |
|
Sauces and preparations... |
2103 |
11 |
4.1 |
0 |
11.6 |
2 |
8 |
9.4 |
3 |
12.5 |
0 |
6 |
20.0 |
20 |
20 |
0 |
|
Soups and broths and preparations... |
2104 |
3 |
3.8 |
2.5 |
6.4 |
0 |
2 |
8.5 |
6 |
11 |
0 |
2 |
10.0 |
10 |
10 |
0 |
|
Ice cream and other edible ice |
2105 |
5 |
19.0 |
17 |
20 |
2 |
2 |
9.5 |
9.5 |
9.5 |
1 |
1 |
0.0 |
0 |
0 |
1 |
|
Food preparations NESOI |
2106 |
31 |
6.3 |
0 |
10 |
24 |
19 |
7.6 |
0 |
11 |
4 |
17 |
12.2 |
0 |
20 |
4 |
|
Waters, incl. natural or artificial mineral waters... |
2201 |
2 |
0.0 |
0 |
0 |
1 |
2 |
3.3 |
0 |
6.5 |
0 |
5 |
16.7 |
10 |
20 |
0 |
|
Waters, including mineral and aerated waters... |
2202 |
10 |
17.3 |
17 |
17.5 |
8 |
9 |
7.3 |
0 |
11 |
2 |
7 |
18.0 |
10 |
20 |
2 |
|
Beer made from malt |
2203 |
1 |
0.0 |
0 |
0 |
0 |
1 |
0.0 |
0 |
0 |
0 |
1 |
20.0 |
20 |
20 |
0 |
|
Wine of fresh grapes, including fortified wines... |
2204 |
13 |
0.0 |
0 |
0 |
13 |
43 |
0.0 |
0 |
0 |
2 |
8 |
20.0 |
20 |
20 |
0 |
|
Vermouth and other wine of fresh grapes... |
2205 |
5 |
0.0 |
0 |
0 |
5 |
6 |
0.0 |
0 |
0 |
0 |
4 |
20.0 |
20 |
20 |
0 |
|
Other fermented beverages... |
2206 |
5 |
0.0 |
0 |
0 |
5 |
25 |
3.0 |
3 |
3 |
23 |
2 |
20.0 |
20 |
20 |
0 |
|
Undenatured ethyl alcohol of an alcoholic strength by volume of 80% volume or higher... |
2207 |
3 |
2.2 |
1.9 |
2.5 |
1 |
6 |
0.0 |
0 |
0 |
2 |
2 |
0.0 |
0 |
0 |
2 |
|
Undenatured ethyl alcohol of an alcoholic strength by volume of less than 80% volume... |
2208 |
35 |
0.0 |
0 |
0 |
3 |
16 |
0.0 |
0 |
0 |
10 |
22 |
15.8 |
0 |
20 |
0 |
|
Vinegar and substitutes for vinegar... |
2209 |
1 |
0.0 |
0 |
0 |
1 |
1 |
9.5 |
9.5 |
9.5 |
0 |
1 |
20.0 |
20 |
20 |
0 |
|
Flours, meals, and pellets of meat or offal, of fish, crustaceans, mollusks, or aquatic invertebrates... |
2301 |
2 |
0.0 |
0 |
0 |
0 |
6 |
0.4 |
0 |
3 |
0 |
3 |
15.0 |
15 |
15 |
0 |
|
Bran, sharps, and other residues... |
2302 |
4 |
0.4 |
0 |
1.4 |
0 |
5 |
0.0 |
0 |
0 |
2 |
5 |
10.0 |
10 |
10 |
0 |
|
Residues of starch manufacture and residues... |
2303 |
3 |
0.5 |
0 |
1.4 |
0 |
4 |
0.4 |
0 |
2.5 |
0 |
4 |
10.0 |
0 |
15 |
0 |
|
Oil-cake and other solid residues ... from the extraction of soyabean oil |
2304 |
1 |
0.0 |
0 |
0 |
1 |
1 |
0.0 |
0 |
0 |
0 |
1 |
0.0 |
0 |
0 |
0 |
|
Oil-cake and other solid residues ... from the extraction of ground-nut oil |
2305 |
1 |
0.0 |
0 |
0 |
1 |
1 |
0.0 |
0 |
0 |
0 |
1 |
15.0 |
15 |
15 |
0 |
|
Oil-cake and other solid residues NESOI |
2306 |
8 |
0.0 |
0 |
0 |
8 |
8 |
0.0 |
0 |
0 |
0 |
9 |
15.0 |
15 |
15 |
0 |
|
Wine lees, argol |
2307 |
1 |
0.0 |
0 |
0 |
0 |
1 |
0.0 |
0 |
0 |
0 |
1 |
10.0 |
10 |
10 |
0 |
|
Vegetable materials and vegetable waste... |
2308 |
4 |
1.2 |
0 |
1.9 |
0 |
1 |
0.0 |
0 |
0 |
0 |
2 |
10.0 |
10 |
10 |
0 |
|
Preparations of a kind used in animal feeding |
2309 |
9 |
1.6 |
0 |
7.5 |
2 |
12 |
3.3 |
0 |
10.5 |
1 |
13 |
5.8 |
0 |
20 |
0 |
|
Unmanufactured tobacco, tobacco refuse |
2401 |
31 |
60.0 |
0 |
350 |
8 |
6 |
5.7 |
0 |
8 |
0 |
6 |
45.0 |
45 |
45 |
0 |
|
Cigars, cheroots, cigarillos, and cigarettes... |
2402 |
7 |
0.0 |
0 |
0 |
7 |
3 |
9.0 |
6.5 |
12.5 |
0 |
3 |
59.7 |
45 |
67 |
0 |
|
Other manufactured tobacco and manufactured tobacco substitutes... |
2403 |
8 |
350.0 |
350 |
350 |
5 |
8 |
6.3 |
4 |
13 |
0 |
6 |
52.9 |
20 |
67 |
0 |
Source: CRS from WTO, "Tariff Download Facility" database (http://tariffdata.wto.org/ReportersAndProducts.aspx). Based on Harmonized Commodity Description and Coding Systems (HS), Harmonized System 2017. Some HS-code descriptions have been shortened or collapsed (as indicated by " ... "). This product grouping excludes some agricultural commodities including cotton, essential oils, starches, and hides and skins within other HS chapters.
Notes: AV duty = ad valorem duty. Avg. AV duty is the average across all tariffs in the chapter. Min and Max AV duty is the minimum and maximum AV duty across the chapter, respectively. #Non AV-duty reflects number of tariffs that are not expressed as ad valorem (e.g., specific tariffs). NESOI = not elsewhere specified or included.
Author Contact Information
Footnotes
| 1. |
For information on the ongoing NAFTA renegotiations, see CRS Report R44981, NAFTA Renegotiation and Modernization. For more information regarding the renegotiation and the U.S. agricultural sector, see CRS Report R44875, The North American Free Trade Agreement (NAFTA) and U.S. Agriculture, and CRS In Focus IF10682, NAFTA Renegotiation: Issues for U.S. Agriculture. |
| 2. |
USITC may be tasked with conducting analyses on a range of trade-related subjects by the President, USTR, the Senate Committee on Finance, or the House Committee on Ways and Means or upon its own motion. |
| 3. |
TRQs allow imports of fixed quantities of a product either duty-free or at a lower tariff. Once the quota is filled, a higher tariff is applied on additional imports. |
| 4. |
USITC, "Probable Economic Effect of Providing Duty-Free Treatment for Currently Dutiable Imports from Canada and Mexico Will Be Focus of New USITC Investigation," press release, May 26, 2017. |
| 5. |
J. Leonard, "Lighthizer: No Analysis Done on How U.S. Would be Impacted by NAFTA Withdrawal," World Trade Online, October 18, 2017. |
| 6. |
CRS communication with researchers at USDA's Economic Research Service, October 23, 2017. |
| 7. |
For example, CRS communication with researchers at the Food and Agricultural Policy Research Institute (FAPRI) at the University of Missouri-Columbia, November 9, 2017. |
| 8. |
T. Walmsley and P. Minor, "Reversing NAFTA: A Supply Chain Perspective," ImpactECON, Working Paper 007-Rev-2, August 2017. Assuming higher MFN tariff rates in conjunction with economic modeling simulations is a common practice when assessing trade policy changes. See, for example, DTB Associates and AgRisk Management, "Implications for the U.S. and Mexico of Mexico Withdrawing Certain Agricultural Products form NAFTA," 2006. |
| 9. |
Reciprocation refers to whether or not Canada and Mexico raise their tariffs to MFN rates on U.S. products in response to higher U.S. tariffs (i.e., raise their tariffs to MFN rates on U.S. products). The study notes that the impacts to Canada and Mexico would likely be lessened if they do not reciprocate. The researchers note, however, that "no reciprocation" might not be an option given WTO rules. |
| 10. |
Several studies highlight the importance of cross-border supply chains and integration and the potential for market disruption depending on the outcome NAFTA renegotiation. See, for example, C. S. Hendrix, "Agriculture in the NAFTA Renegotiation," A Path Forward for NAFTA, Peterson Institute for International Economics, July 2017. |
| 11. |
See, for example, comments by Dermot Hayes, Iowa State University, at a U.S. Chamber of Commerce event, "The Future of NAFTA: The Stakes for American Agriculture and Business," October 31, 2017. |
| 12. |
Based on compound annual rate of growth, or the year-over-year growth rate, and adjusted for inflation using a GDP deflator (2010=100). |
| 13. |
Trade balances tend to be variable year-to-year depending on market and production conditions, commodity prices, currency exchange rates, and consumer demand, among many other factors. |
| 14. |
See, for example, Hayes, "The Future of NAFTA." |
| 15. |
USTR, 2017 National Trade Estimate Report on Foreign Trade Barriers, p. 66. Canada's tariff schedule is available at Canada Border Services Agency, http://www.cbsa-asfc.gc.ca/trade-commerce/tariff-tarif/2017/menu-eng.html. |
| 16. |
For more information on USDA's Foreign Agricultural Trade of the United States data categories, see https://apps.fas.usda.gov/gats/ExpressQuery1.aspx. |
| 17. |
For more information on the HS system, see United Nations Trade Statistics, https://unstats.un.org/unsd/tradekb/Knowledgebase/Harmonized-Commodity-Description-and-Coding-Systems-HS. |
| 18. |
HS subdivisions correspond with tariff information at the HS-2, HS-4, and HS-6 levels. Additional HS subdivision at the six-, eight-, and 10-digit levels are not presented here. |
| 19. |
These products are covered in other HS chapters: cotton (chapter 42), essential oils (chapters 33 and 38), starches (chapter 35), and hides and skins (chapter 41). |
| 20. |
WTO's database is at http://tariffdata.wto.org/ReportersAndProducts.aspx. |
| 21. |
Tariff rates at the HS-2, HS-4, and HS-6 level for the NAFTA countries are available at http://tariffdata.wto.org/ReportersAndProducts.aspx. Tariffs at the higher HS levels are available in each countries individual tariff schedule. |
| 22. |
As noted previously, calculating AVE tariffs from specific tariffs is complex, requiring value and quantity trade data for each product averaged over multiple years. Calculated AVE rates may vary depending on the data and methodology used. |
| 23. |
For example, the WTO tariff database provides information on average AV tariffs (https://tao.wto.org/) that does not include non-AV rates. The WTO and related organizations also report average tariffs in the annual World Tariff Profiles (http://unctad.org/en/PublicationsLibrary/wto2016_en.pdf). |
| 24. |
Canada's TRQs cover a range of dairy, poultry, egg, and grain products. Mexico's TRQs cover mostly beef and rice to non-NAFTA countries. TRQs in the United States cover sugar and sweeteners, cocoa-containing products, tea and coffee extracts, and certain dairy byproducts. |
| 25. |
In the United States, higher MFN seasonal tariffs apply to certain berries, melons, citrus, pears, stonefruit, tomatoes, cucumbers, asparagus, eggplant, cole crops, legumes, and tropical products. |
| 26. |
Additional agricultural products found in other HS chapters not covered in this report include cotton (chapter 42), essential oils (chapters 33 and 38), starches (chapter 35), and hides and skins (chapter 41), among other products. |
| 27. |
See, for example, statements by industry representatives at the USTR public hearing, "Renegotiation of NAFTA," June 27-29, 2017. |
| 28. |
USDA's defined category for "Sugar and Tropical Products" includes sugar and related products (e.g., sugarcane, sugar beet, and related sweeteners (such as molasses, honey, high-fructose corn syrup, and confectionery) as well as certain tropical products (such as coffee, tea, spices, cocoa, and other products). USDA's product category definitions are at https://apps.fas.usda.gov/gats/ProductGroup.aspx?GROUP=FATUS. |
| 29. |
See, for example, letter to USTR Robert Lighthizer from several U.S. Senators, May 15, 2017. |
| 30. |
National Pork Producers Council, "Modernizing NAFTA and Safeguarding U.S. Interests: A Summary of Issues and Risks," May 2017. |
| 31. |
The Hagstrom Report, "Trump Agrees Not to Terminate NAFTA at This Time," April 27, 2017. The article provides a useful summary of farm group positions in the grains, wheat, pork, corn, and soybean industries. |
| 32. |
National Corn Growers Association, "NCGA Urges White House: Don't Withdraw from NAFTA," April 26, 2017. |
| 33. |
The Hagstrom Report, "Trump Agrees Not to Terminate NAFTA at This Time," April 27, 2017. |
| 34. |
U.S. Grains Council, "Statement on Potential NAFTA Withdrawal," press release, April 26, 2017. |
| 35. |
National Association of Wheat Growers, "Wheat Grower Organizations Alarmed about Possible NAFTA Withdrawal," press release, April 26, 2017. |
| 36. |
IEG Policy Weekly Briefing, "Cargill Official Outlines NAFTA Impacts," September 22, 2017. |
| 37. |
C. Fan, "Central Valley Farmers Relieved President Trump Is Not Ending NAFTA," ABC30 Fresno, April 28, 2017. |
| 38. |
82 Federal Register 23699, May 23, 2017. |
| 39. |
Letter from U.S. agriculture groups to U.S. Department of Commerce Secretary Wilbur Ross, October 25, 2017. |
| 40. |
Comments by pork and wheat growers and other agriculture support industries at a U.S. Chamber of Commerce event, "The Future of NAFTA: The Stakes for American Agriculture and Business," October 31, 2017; and statements from industry representatives at a House Agriculture Committee hearing, "Renegotiating NAFTA: Opportunities for Agriculture," July 26, 2017, and at a USTR public hearings, "Renegotiation of NAFTA," June 27-29, 2017. |
| 41. |
See, for example, C. Boudreau and C. Haughney, "Soy Group Sees Trump Pushing NAFTA Withdrawal, PoliticoPro, October 31, 2017. |
| 42. |
Agri-Pulse, "U.S. Farm Groups Seek Trade Stability amid Turbulence over NAFTA," May 3, 2017; and USA Rice, "Week of Meetings Reinforces Relationship Between U.S. and Mexican Rice Industries," press release, April 28, 2017. |
| 43. |
A. Bjerga, B. Migliozzi, and C. Hoffman, "How U.S. Farms Win and Lose When Competitors Rise," Bloomberg News, March 13, 2017. |
| 44. |
Comments by wheat producer Gordon Stoner at "The Future of NAFTA." See also Agri-Pulse Daybreak, "Mexico Opens the Door to Argentine Wheat," October 30, 2017. |
| 45. |
D. Shanker, "America's $1.2 Billion Mexico Milk Market Trade Is Now at Risk," Bloomberg News, April 26, 2017. |
| 46. |
Comments by pork producer Randy Spronk,at "The Future of NAFTA." |
| 47. |
A. Barrera, "In Avocado Country, Mexicans Not Afraid of Trump Tariff Threats," Reuters, February 2, 2017. |
| 48. |
B. Fortnam , "Mexico to Aim Retaliation at U.S. Grains, Meats If Seasonal Proposal Makes It into NAFTA," World Trade Online, October 14, 2017. |
| 49. |
I. Mezo, "Negative Tone on NAFTA Already Taking a Toll on Agriculture, Speakers Say," IEG Policy Weekly Briefing, October 31, 2017 (referring to industry statements at a U.S. Chamber of Commerce event). |
| 50. |
Trade Leadership Coalition, "Investors Say NAFTA Withdrawal Would Hurt Stock Market and the U.S. Economy," November 1, 2017. |
| 51. |
Ibid. The survey expressed whether the risk of NAFTA withdrawal is "priced into valuations" as "Not at all (0-20%)" and "Partially (20%-40%)." |
| 52. |
P. Beatty, M. Fernanda Garza, and P. Robinson, "A Trade Deal in Distress: It's Time to Save NAFTA," The Hill, October 23, 2017. |
| 53. |
D. Bennett, "Perdue Plays Up U.S./Mexico Agricultural Ties, Downplays NAFTA Turbulence," Delta Farm Press, July 30, 2017. |
| 54. |
The Hagstrom Report, "Perdue: USDA Developing NAFTA Contingency Plan," November 9, 2017. |
| 55. |
B. Tomson, "Trump's New NAFTA Threats Have Ag Sector Worried," Agri-Pulse, August 23, 2017; and IEG Policy Weekly Briefing, "Commerce's Ross: NAFTA Withdrawal If 2.0 Talks Fail 'Right Thing' to Do," September 8, 2017. |
| 56. |
See, for example, U.S. Grains Council/National Corn Growers Association, "How Much Do Exports Matter? Evaluating the Economic Contributions of U.S. Grain Exports on State and Congressional District Economies," Informa Economic IEG, September 2017; The Hagstrom Report, "Nebraska Hosts Mexican Trade Delegation as NAFTA Heats Up," May 16, 2017; and A. Sinparapu, "U.S. Governors Tout NAFTA Despite Trump Administration Withdrawal Threats," World Trade Online, October 3, 2017. |
| 57. |
See, for example, letters to USTR Robert Lighthizer (and his Canadian and Mexican counterparts) from American Farm Bureau Federation (and its NAFTA counterparts), August 16, 2017; and letter to President Trump from National Association of State Department of Agriculture, October 20, 2017. See also letter to President Trump from 16 major agricultural trade associations, January 6, 2017, and letter to President Trump from the U.S. Food and Agriculture Dialogue for Trade, January 23, 2017. |
| 58. |
See, for example, comments from Senators Pat Roberts and Ted Cruz at "The Future of NAFTA;" letter from Senators Debbie Stabenow and Gary C. Peters to USTR Robert Lighthizer, July 14, 2017; and letter from several U.S. Senators representing states with significant agricultural exports to USTR Robert Lighthizer, June 28, 2017. |
| 59. |
The Hagstrom Report, "Conaway, Peterson, Ag Leaders Call for NAFTA Conclusion, No Withdrawal," November 7, 2017. |
| 60. |
The Hagstrom Report, "NAFTA Panel: Heartland Not Aware of the NAFTA Withdrawal Threat," November 1, 2017. |
| 61. |
Office of Senator Debbie Stabenow, "Stabenow Statement on Trump Administration's NAFTA Renegotiation Notice," press release, May 18, 2017. |
| 62. |
B. Fortnum, "Agriculture Groups Counting on Congress to Step in If Trump Withdraws from NAFTA," World Trade Online, November 8, 2017. |