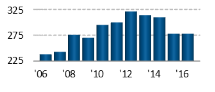
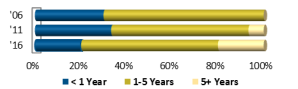
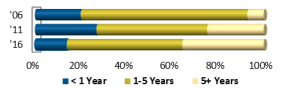
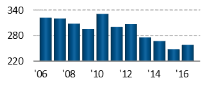
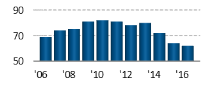
Staff Tenure in Selected Positions in Senators’ Offices, 2006-2016
The length of time a congressional staff member spends employed in a particular position in Congress—or congressional staff tenure—is a source of recurring interest to Members, staff, and the public. A congressional office, for example, may seek this information to assess its human resources capabilities, or for guidance in how frequently staffing changes might be expected for various positions. Congressional staff may seek this type of information to evaluate and approach their own individual career trajectories. This report presents a number of statistical measures regarding the length of time Senate office staff stay in particular job positions. It is designed to facilitate the consideration of tenure from a number of perspectives.
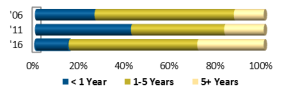
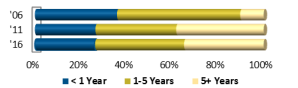
This report provides tenure data for a selection of 18 staff position titles that are typically used in Senators’ offices, and information on how to use those data for different purposes. The positions include Administrative Director, Casework Supervisor, Caseworker, Chief Counsel, Chief of Staff, Communications Director, Counsel, Executive Assistant, Field Representative, Legislative Assistant, Legislative Correspondent, Legislative Director, Office Manager, Press Secretary, Regional Representative, Scheduler, Staff Assistant, and State Director. Senators’ staff tenure data were calculated as of March 31, for each year between 2006 and 2016, for all staff in each position. An overview table provides staff tenure for selected positions for 2016, including summary statistics and information on whether the time staff stayed in a position increased, was unchanged, or decreased between 2006 and 2016. Other tables provide detailed tenure data and visualizations for each position title.
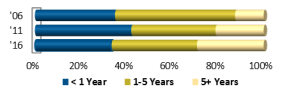
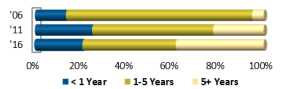
Between 2006 and 2016, staff tenure appears to have increased by six months or more for staff in 10 position titles in Senators’ offices, based on the trend of the median number of years in the position. For eight positions, the median tenure trend was unchanged. These findings may be consistent with overall workforce trends in the United States.
Pay may be one of many factors that affect an individual’s decision to remain in or leave a particular job. Senate office staff holding positions that are generally lower-paid typically remained in those roles for shorter periods of time than those in generally higher-paying positions. Lower-paying positions may also be considered entry-level roles; if so, tenure for Senators’ office employees in these roles appears to follow national trends for other entry-level jobs, which individuals hold for a relatively short period of time. Those in more senior positions, where a particular level of congressional or other professional experience is often required, typically remained in those roles comparatively longer, similar to those in more senior positions in the general workforce.
Generalizations about staff tenure are limited in some ways, because each Senator’s office serves as its own hiring authority. Variations from office to office, which might include differences in job duties, work schedules, office emphases, and other factors, may limit the extent to which data provided here might match tenure in another office. Direct comparisons of congressional employment to the general labor market may have similar limitations. An employing Senator’s retirement or electoral loss, for example, may cause staff tenure periods to end abruptly and unexpectedly.
This report is one of a number of CRS products on congressional staff. Others include CRS Report R43946, Senate Staff Levels in Member, Committee, Leadership, and Other Offices, 1977-2016, and CRS Report R44324, Staff Pay Levels for Selected Positions in Senators’ Offices, FY2001-FY2014.
Staff Tenure in Selected Positions in Senators' Offices, 2006-2016
Jump to Main Text of Report
Contents
Tables
- Table 1. Tenure in Selected Positions in Senators' Offices, and Distribution of Staff by Tenure, 2006-2016
- Table 2. Administrative Director
- Table 3. Casework Supervisor
- Table 4. Caseworker
- Table 5. Chief Counsel
- Table 6. Chief of Staff
- Table 7. Communications Director
- Table 8. Counsel
- Table 9. Executive Assistant
- Table 10. Field Representative
- Table 11. Legislative Assistant
- Table 12. Legislative Correspondent
- Table 13. Legislative Director
- Table 14. Office Manager
- Table 15. Press Secretary
- Table 16. Regional Representative
- Table 17. Scheduler
- Table 18. Staff Assistant
- Table 19. State Director
- Table A-1. Position Title Categories and Related Positions
Appendixes
Summary
The length of time a congressional staff member spends employed in a particular position in Congress—or congressional staff tenure—is a source of recurring interest to Members, staff, and the public. A congressional office, for example, may seek this information to assess its human resources capabilities, or for guidance in how frequently staffing changes might be expected for various positions. Congressional staff may seek this type of information to evaluate and approach their own individual career trajectories. This report presents a number of statistical measures regarding the length of time Senate office staff stay in particular job positions. It is designed to facilitate the consideration of tenure from a number of perspectives.
This report provides tenure data for a selection of 18 staff position titles that are typically used in Senators' offices, and information on how to use those data for different purposes. The positions include Administrative Director, Casework Supervisor, Caseworker, Chief Counsel, Chief of Staff, Communications Director, Counsel, Executive Assistant, Field Representative, Legislative Assistant, Legislative Correspondent, Legislative Director, Office Manager, Press Secretary, Regional Representative, Scheduler, Staff Assistant, and State Director. Senators' staff tenure data were calculated as of March 31, for each year between 2006 and 2016, for all staff in each position. An overview table provides staff tenure for selected positions for 2016, including summary statistics and information on whether the time staff stayed in a position increased, was unchanged, or decreased between 2006 and 2016. Other tables provide detailed tenure data and visualizations for each position title.
Between 2006 and 2016, staff tenure appears to have increased by six months or more for staff in 10 position titles in Senators' offices, based on the trend of the median number of years in the position. For eight positions, the median tenure trend was unchanged. These findings may be consistent with overall workforce trends in the United States.
Pay may be one of many factors that affect an individual's decision to remain in or leave a particular job. Senate office staff holding positions that are generally lower-paid typically remained in those roles for shorter periods of time than those in generally higher-paying positions. Lower-paying positions may also be considered entry-level roles; if so, tenure for Senators' office employees in these roles appears to follow national trends for other entry-level jobs, which individuals hold for a relatively short period of time. Those in more senior positions, where a particular level of congressional or other professional experience is often required, typically remained in those roles comparatively longer, similar to those in more senior positions in the general workforce.
Generalizations about staff tenure are limited in some ways, because each Senator's office serves as its own hiring authority. Variations from office to office, which might include differences in job duties, work schedules, office emphases, and other factors, may limit the extent to which data provided here might match tenure in another office. Direct comparisons of congressional employment to the general labor market may have similar limitations. An employing Senator's retirement or electoral loss, for example, may cause staff tenure periods to end abruptly and unexpectedly.
This report is one of a number of CRS products on congressional staff. Others include CRS Report R43946, Senate Staff Levels in Member, Committee, Leadership, and Other Offices, 1977-2016, and CRS Report R44324, Staff Pay Levels for Selected Positions in Senators' Offices, FY2001-FY2014.
Introduction
The length of time a congressional staff member spends employed in Congress, or job tenure, is a source of recurring interest among Members of Congress,1 congressional staff, those who study staffing in the House and Senate,2 and the public. There may be interest in congressional tenure information from multiple perspectives, including assessment of how a congressional office might oversee human resources issues, how staff might approach a congressional career, and guidance for how frequently staffing changes may occur in various positions. Others might be interested in how staff are deployed, and could see staff tenure as an indication of the effectiveness or well-being of Congress as an institution.3
This report provides tenure data for 18 staff position titles that are typically used in Senators' offices,4 and information for using those data for different purposes. The positions include the following:
- Administrative Director
- Casework Supervisor
- Caseworker
- Chief Counsel
- Chief of Staff
- Communications Director
- Counsel
- Executive Assistant
- Field Representative
- Legislative Assistant
- Legislative Correspondent
- Legislative Director
- Office Manager
- Press Secretary
- Regional Representative
- Scheduler
- Staff Assistant
- State Director
Data Source and Concerns
Publicly available information sources do not provide aggregated congressional staff tenure data in a readily retrievable or analyzable form. The most recent publicly available Senate staff compensation report, which provided some insight into the duration which congressional staff worked in a number of positions, was issued in 2006,5 and relied on anonymous, self-reported survey data. Data in this report are instead based on official Senate pay reports, from which tenure information arguably may be most reliably derived, and which afford the opportunity to use complete, consistently collected data. Tenure information provided in this report is based on the Senate's Report of the Secretary of the Senate,6 published semiannually, as collated by LegiStorm, a private entity that provides some congressional data by subscription.7
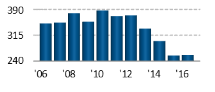
Senators' staff tenure data were calculated for each year between 2006 and 2016. Annual data allow for observations about the nature of staff tenure in Senators' offices over time. For each year, all staff with at least one week's service8 on March 31 were included. All employment pay dates from October 2, 2000, to March 24 of each reported year are included in the data.
Utilizing official salary expenditure data from the Senate may provide more complete, robust findings than other methods of determining staff tenure, such as surveys; the data presented here, however, are subject to some challenges that could affect the interpretation of the information presented. Tenure information provided in this report may understate the actual time staff spend in particular positons, due in part to several features of the data.
Overall, the time frame studied may lead to some underrepresentation in tenure duration. Figure 1 provides potential examples of congressional staff, identified as Jobholders A-D, in a given position.9 Since tenure data are not captured before October 2, 2000, some individuals, represented as Jobholder A, may have an unknown length of service prior to that date that is not captured. This feature of the data only affects a small number of employees within this dataset, since many tenure periods completely begin and end within the observed period of time, as represented by Jobholders B and C. The data last capture those who were employed in Senators' personal offices as of March 31, 2016, represented as Jobholder D, and some of those individuals likely continued to work in the same roles after that date.
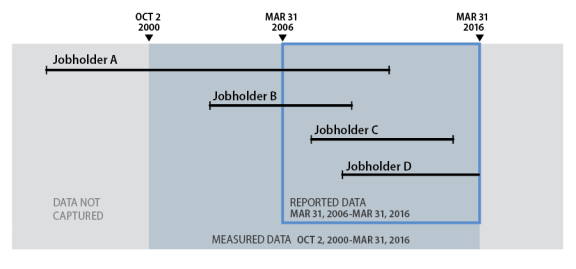 |
|
Source: CRS, adaptation of Figure 1 from June G. Morita, Thomas W. Lee, and Richard T. Mowday, "The Regression-Analog to Survival Analysis: A Selected Application to Turnover Research," Academy of Management Journal, vol. 36, no. 6 (December 1993), pp. 1430-1464. |
Data provided in this report represent an individual's consecutive time spent working in a particular position in a Senator's personal office. They do not necessarily capture the overall time worked in a Senate office or across a congressional career. If a person's job title changes, for example, from staff assistant to caseworker, the time that individual spent as a staff assistant is recorded separately from the time that individual spent as a caseworker. If a person stops working for the Senate for some time, that individual's tenure in his or her preceding position ends, although he or she may return to work in Congress at some point. No aggregate measure of individual congressional career length is provided in this report.
Other data concerns arise from the variation across offices, lack of other demographic information about staff, and lack of information about where congressional staff work.
Potential differences might exist in the job duties of positions with the same or similar title, and there is wide variation among the job titles used for various positions in congressional offices. The Appendix provides the number of related titles included for each job title for which tenure data are provided. Aggregation of tenure by job title rests on the assumption that staff with the same or similar title carry out the same or similar tasks. Given the wide discretion congressional employing authorities have in setting the terms and conditions of employment, there may be differences in the duties of similarly titled staff that could have effects on the interpretation of their time in a particular position. Acknowledging the imprecision inherent in congressional job titles, an older edition of the Senate Handbook states, "Throughout the Senate, individuals with the same job title perform vastly different duties."10
As presented here, tenure data provide no insight into the education, age, work experience, pay, full- or part-time status of staff, or other potential data that might inform explanations of why a congressional staff member might stay in a particular position.
Staff could be based in Washington, DC, state offices, or both. It is unknown whether, or to what extent, the location of congressional employment might affect the duration of that employment.
Presentation of Tenure Data
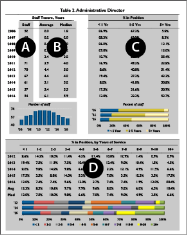
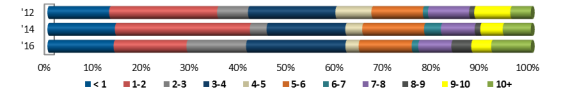
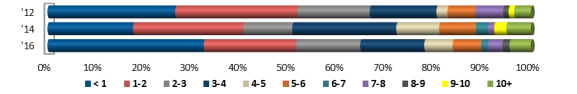
Tables in this section provide tenure data for selected positions in Senators' personal offices and detailed data and visualizations for each position. Table 1 provides a summary of staff tenure for selected positions since 2006. The data include job titles, average and median years of service, and grouped years of service for each positon. The "Trend" column provides information on whether the time staff stayed in a position increased, was unchanged, or decreased between 2006 and 2016.11 Table 2-Table 19 provide information on individual job titles over the same period.
In all of the data tables, the average and the median length of tenure columns provide two different measures of central tendency,12 and each may be useful for some purposes and less suitable for others. The average represents the sum of the observed years of tenure, divided by the number of staff in that position. It is a common measure that can be understood as a representation of how long an individual remains, on average, in a job position. The average can be affected disproportionately by unusually low or high observations. A few individuals who remain for many years in a position, for example, may draw the average tenure length up for that position. A number of staff who stay in a position for only a brief period may depress the average length of tenure. Another common measure of central tendency, the median, represents the middle value when all the observations are arranged by order of magnitude. The median can be understood as a representation of a center point at which half of the observations fall below, and half above. Extremely high or low observations may have less of an impact on the median.
|
Using Position Data Tables
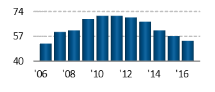
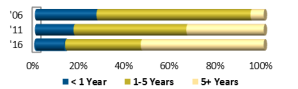
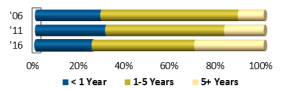
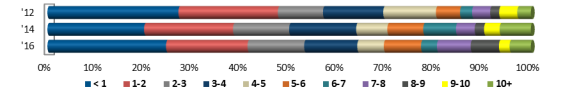
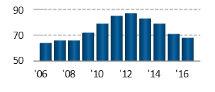
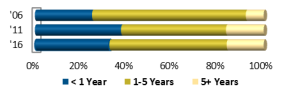
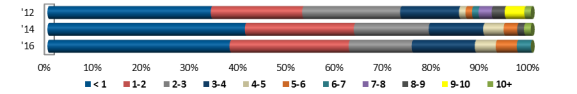
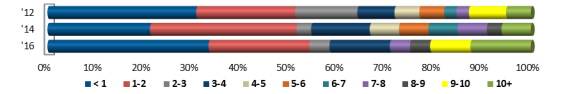
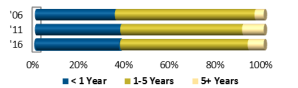
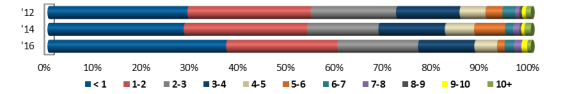
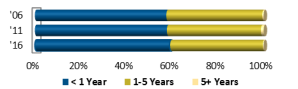
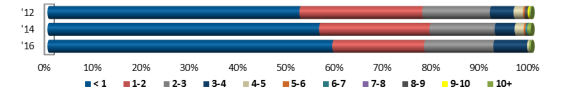
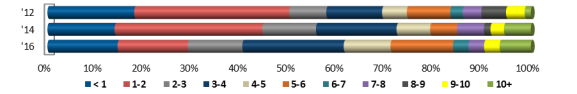
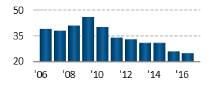
Position data are found in Table 2-Table 19, and each of these tables provides information on a separate job title. Section A provides the number of individuals with a particular job title and provides a chart that illustrates this information. The number of staff over time might offer insight into the operations and activities in Senators' offices, or the Senate more generally. Section B provides the annual average and median tenures for that position. Average and median are reported for each position because one measure may be more appropriate than the other, depending upon which data are being examined and for what purpose. Section C provides the percentages of staff who had been working in that job for up to one year, one to five years, and five or more years. Below the tables in Section C, visualization provides percentages for three selected years: 2006, 2011, and 2016. Section D provides more detailed information for staff in each position over the past five years. For the years 2012-2016, the percentage of staff in each job is displayed in annual increments for 1-10 years of service, in addition to categories for less than a year of service and more than 10 years. The average and median for each annual increment over this five-year period is also provided. The figure at the bottom of Section D visually displays this information for 2012, 2014, and 2016. Because the available data begin in October 2000, at least 10 years of staff tenure data are available by 2012, which enables more detailed information to be provided about those who have worked between 5 and 10 years. Individual elements of data in this report may provide more useful insights when compared to other data provided. Combined, certain statistics may be used to infer changes in tenure over time or address other questions of interest. The overall average and median for a position found in Table 1, for example, might be compared to the equivalent measures in a particular year from Section B of that job position table, and could illustrate how typical or atypical average or median tenure in that year is. The aggregate average or median distributions provided in the "% by Position" columns of Table 1 could similarly be used in comparison to Section C of a job position table to evaluate the percentage distributions for a given year. The tenure percentage distributions may be helpful for determining continuity or turnover patterns for job positions. A broad, overall measure of turnover is provided in Table 1, but more information can be found in the job position tables, in Sections C and D. A position with a large proportion of staff remaining for five or more years, relative to the proportion of staff remaining for under one year, for example, could indicate a position that jobholders typically remain in for longer periods of time. Comparing these distributions over time could indicate that a job is becoming more stable, or, conversely, that greater turnover is occurring. When performing any assessment with these percentages, it is important to consider the number of staff in a particular role; a percentage change may seem dramatic when the overall number of staff is small, but reflect changes of only one or a few individuals. It may be helpful to convert percentages to number of staff, by multiplying the percentage by the staff count in Section A for the corresponding year. Although this report does not measure staff tenure in terms of "cohorts" who all begin during a certain year, this type of information may be inferred from the detailed annual breakdowns provided in Section D. A read of Section D diagonally—down one row to the next calendar year and right one column to the next year of service—may help address questions related to tenure for staff hired in, or working during, a particular year. |
Assessing Tenure Data
Generalizations about staff tenure are limited in at least three potentially significant ways, including:
- the relatively brief period of time for which reliable, largely inclusive data are available in a readily analyzable form;
- how the unique nature of congressional work settings might affect staff tenure; and
- the lack of demographic information about staff for which tenure data are available.
Considering tenure in isolation from demographic characteristics of the congressional workforce might limit the extent to which tenure information can be assessed. Additional data on congressional staff regarding age, education, and other elements would be needed for this type of analysis, and are not readily available at the position level. Finally, since each Senator's office serves as its own hiring authority, variations from office to office, which for each position may include differences in job duties, work schedules, office emphases, and other factors, may limit the extent to which aggregated data provided here might match tenure in a particular office. Despite these caveats, a few broad observations can be made about staff in Senators' offices.
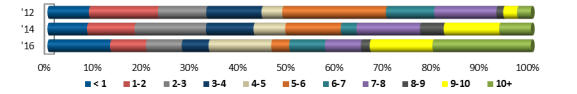
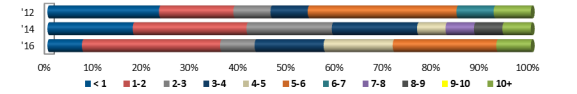
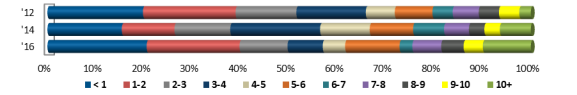
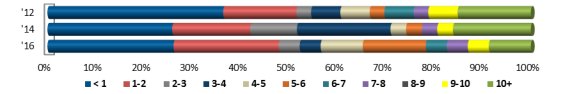
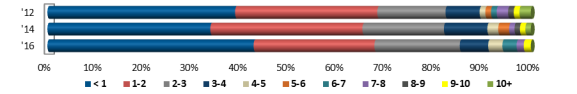
Between 2006 and 2016, staff tenure, based on the trend of the median number of years in the position, appears to have increased by six months or more for staff in 10 position titles13 in Senate offices. The median tenure was unchanged14 for eight positions.15 This may be consistent with overall workforce trends in the United States.16 Although pay is not the only factor that might affect an individual's decision to remain in or leave a particular job, staff in positions that generally pay less typically remained in those roles for shorter periods of time than those in higher-paying positions.17 Some of these lower-paying positions may also be considered entry-level positions in some Senators' offices; if so, Senate office employees in those roles appear to follow national trends for others in entry-level types of jobs, remaining in the role for a relatively short period of time.18 Similarly, those in more senior positions, which often require a particular level of congressional or other professional experience, typically remained in those roles comparatively longer, similar to those in more senior positions in the general workforce.
Table 1. Tenure in Selected Positions in Senators' Offices, and Distribution of Staff by Tenure, 2006-2016
|
Position |
Tenure, Years |
% in Position |
|||||
|
Average |
Median |
< 1 Year |
1-5 Years |
5+ Years |
Trend |
||
|
Administrative Director |
3.8 |
4.0 |
Average |
18.8% |
49.4% |
31.8% |
Increased |
|
Median |
17.5% |
49.3% |
33.8% |
||||
|
Casework Supervisor |
3.2 |
2.5 |
Average |
19.6% |
60.2% |
20.1% |
Increased |
|
Median |
20.0% |
60.0% |
16.7% |
||||
|
Caseworker |
3.0 |
2.1 |
Average |
28.2% |
51.4% |
20.3% |
Increased |
|
Median |
27.1% |
52.0% |
18.6% |
||||
|
Chief Counsel |
1.9 |
1.5 |
Average |
37.3% |
57.0% |
5.7% |
Unchanged |
|
Median |
37.5% |
60.0% |
6.7% |
||||
|
Chief of Staff |
3.4 |
2.5 |
Average |
21.2% |
53.2% |
25.5% |
Increased |
|
Median |
20.0% |
51.2% |
28.9% |
||||
|
Communications Director |
2.7 |
1.8 |
Average |
30.1% |
54.3% |
15.6% |
Increased |
|
Median |
29.2% |
54.5% |
16.5% |
||||
|
Counsel |
2.0 |
1.5 |
Average |
37.7% |
53.5% |
8.9% |
Unchanged |
|
Median |
38.6% |
53.1% |
7.7% |
||||
|
Executive Assistant |
2.9 |
2.0 |
Average |
34.6% |
44.6% |
20.9% |
Unchanged |
|
Median |
33.3% |
46.2% |
21.1% |
||||
|
Field Representative |
3.2 |
2.4 |
Average |
22.7% |
54.9% |
22.4% |
Increased |
|
Median |
22.6% |
53.1% |
22.1% |
||||
|
Legislative Assistant |
2.1 |
1.5 |
Average |
34.6% |
57.3% |
8.1% |
Unchanged |
|
Median |
35.0% |
57.4% |
8.5% |
||||
|
Legislative Correspondent |
1.3 |
1.0 |
Average |
57.8% |
41.0% |
1.2% |
Unchanged |
|
Median |
57.7% |
41.1% |
1.2% |
||||
|
Legislative Director |
2.9 |
2.1 |
Average |
26.0% |
55.6% |
18.3% |
Increased |
|
Median |
21.9% |
56.5% |
18.8% |
||||
|
Office Manager |
3.5 |
2.0 |
Average |
30.8% |
43.3% |
25.9% |
Increased |
|
Median |
35.9% |
41.3% |
25.8% |
||||
|
Press Secretary |
1.9 |
1.2 |
Average |
41.3% |
50.1% |
8.6% |
Unchanged |
|
Median |
39.7% |
50.6% |
7.8% |
||||
|
Regional Representative |
2.8 |
2.0 |
Average |
29.2% |
53.7% |
17.2% |
Increased |
|
Median |
27.9% |
51.5% |
20.0% |
||||
|
Scheduler |
2.9 |
2.2 |
Average |
28.9% |
51.1% |
20.0% |
Increased |
|
Median |
30.3% |
51.1% |
16.9% |
||||
|
Staff Assistant |
1.7 |
0.9 |
Average |
54.9% |
37.0% |
8.1% |
Unchanged |
|
Median |
54.9% |
37.8% |
8.1% |
||||
|
State Director |
3.4 |
2.6 |
Average |
21.5% |
52.1% |
26.4% |
Unchanged |
|
Median |
22.6% |
48.7% |
28.6% |
||||
Source: CRS calculations, as of March 31, 2016, for all staff in the positions who were paid on or after October 2, 2000, based on pay information provided in Report of the Secretary of the Senate, as collated by LegiStorm, available from October 1, 2000.
Notes: As used in this report, "trend" is an indication of the general course of median staff tenure in each position over time, based on a linear regression model. The resulting trend line (which is available to congressional staff upon request), could increase, decrease, or remain unchanged. Each position's trend line varies between 2006 and 2016, but the variability demonstrates negligible change for most positions. To distinguish positions with readily measurable changes in their tenure, a benchmark of change in trend is set to an increase or decrease of six months' tenure over the 11 years observed. "Unchanged" in this context is defined as an increase or decrease in the median trend of tenure of fewer than six months between 2006 and 2016.
|
Staff Tenure, Years |
% in Position |
||||||||||||||||
|
Staff |
Average |
Median |
< 1 Yr |
1-5 Yrs |
5+ Yrs |
||||||||||||
|
2006 |
52 |
2.0 |
1.8 |
26.9% |
67.3% |
5.8% |
|||||||||||
|
2007 |
60 |
2.2 |
2.0 |
28.3% |
63.3% |
8.3% |
|||||||||||
|
2008 |
61 |
2.4 |
2.0 |
26.2% |
60.7% |
13.1% |
|||||||||||
|
2009 |
69 |
2.7 |
2.2 |
29.0% |
58.0% |
13.0% |
|||||||||||
|
2010 |
71 |
3.4 |
3.2 |
12.7% |
62.0% |
25.4% |
|||||||||||
|
2011 |
71 |
3.9 |
4.0 |
16.9% |
49.3% |
33.8% |
|||||||||||
|
2012 |
70 |
4.4 |
5.0 |
8.6% |
40.0% |
51.4% |
|||||||||||
|
2013 |
67 |
4.4 |
4.2 |
19.4% |
37.3% |
43.3% |
|||||||||||
|
2014 |
61 |
5.1 |
5.2 |
8.2% |
41.0% |
50.8% |
|||||||||||
|
2015 |
57 |
5.4 |
5.5 |
17.5% |
31.6% |
50.9% |
|||||||||||
|
2016 |
54 |
6.1 |
5.9 |
13.0% |
33.3% |
53.7% |
|||||||||||
|
Number of staff
|
Percent of staff
|
||||||||||||||||
|
% in Position, by Years of Service |
|||||||||||||||||
|
< 1 |
1-2 |
2-3 |
3-4 |
4-5 |
5-6 |
6-7 |
7-8 |
8-9 |
9-10 |
10+ |
|||||||
|
2012 |
8.6% |
14.3% |
10.0% |
11.4% |
4.3% |
21.4% |
10.0% |
12.9% |
1.4% |
2.9% |
2.9% |
||||||
|
2013 |
19.4% |
7.5% |
11.9% |
7.5% |
10.4% |
4.5% |
13.4% |
9.0% |
10.4% |
1.5% |
4.5% |
||||||
|
2014 |
8.2% |
9.8% |
14.8% |
9.8% |
6.6% |
11.5% |
3.3% |
13.1% |
4.9% |
11.5% |
6.6% |
||||||
|
2015 |
17.5% |
3.5% |
8.8% |
14.0% |
5.3% |
7.0% |
7.0% |
3.5% |
12.3% |
3.5% |
17.5% |
||||||
|
2016 |
13.0% |
7.4% |
7.4% |
5.6% |
13.0% |
3.7% |
7.4% |
7.4% |
1.9% |
13.0% |
20.4% |
||||||
|
Avg |
13.3% |
8.5% |
10.6% |
9.7% |
7.9% |
9.6% |
8.2% |
9.2% |
6.2% |
6.5% |
10.4% |
||||||
|
Med |
13.0% |
7.5% |
10.0% |
9.8% |
6.6% |
7.0% |
7.4% |
9.0% |
4.9% |
3.5% |
6.6% |
||||||
|
|
|||||||||||||||||
Source: CRS calculations, March 31 of each year, for all staff in the position paid on or after October 2, 2000, based on pay information provided in Report of the Secretary of the Senate, as collated by LegiStorm, available from October 1, 2000. Detailed information about using table data is available in "Presentation of Tenure Data."
|
Staff Tenure, Years |
% in Position |
||||||||||||||||
|
Staff |
Average |
Median |
< 1 Yr |
1-5 Yrs |
5+ Yrs |
||||||||||||
|
2006 |
8 |
2.4 |
2.3 |
37.5% |
50.0% |
12.5% |
|||||||||||
|
2007 |
10 |
2.0 |
1.5 |
40.0% |
40.0% |
20.0% |
|||||||||||
|
2008 |
10 |
2.4 |
2.0 |
10.0% |
80.0% |
10.0% |
|||||||||||
|
2009 |
8 |
3.2 |
2.5 |
0.0% |
87.5% |
12.5% |
|||||||||||
|
2010 |
10 |
3.5 |
3.4 |
20.0% |
70.0% |
10.0% |
|||||||||||
|
2011 |
12 |
3.5 |
4.1 |
25.0% |
58.3% |
16.7% |
|||||||||||
|
2012 |
13 |
3.6 |
3.0 |
23.1% |
30.8% |
46.2% |
|||||||||||
|
2013 |
10 |
4.6 |
3.5 |
0.0% |
60.0% |
40.0% |
|||||||||||
|
2014 |
17 |
3.2 |
2.0 |
17.6% |
64.7% |
17.6% |
|||||||||||
|
2015 |
14 |
2.7 |
2.2 |
35.7% |
57.1% |
7.1% |
|||||||||||
|
2016 |
14 |
3.6 |
3.2 |
7.1% |
64.3% |
28.6% |
|||||||||||
|
Number of staff
|
Percent of staff
|
||||||||||||||||
|
% in Position, by Years of Service |
|||||||||||||||||
|
< 1 |
1-2 |
2-3 |
3-4 |
4-5 |
5-6 |
6-7 |
7-8 |
8-9 |
9-10 |
10+ |
|||||||
|
2012 |
23.1% |
15.4% |
7.7% |
7.7% |
0.0% |
30.8% |
7.7% |
0.0% |
0.0% |
0.0% |
7.7% |
||||||
|
2013 |
0.0% |
10.0% |
30.0% |
10.0% |
10.0% |
0.0% |
20.0% |
10.0% |
0.0% |
0.0% |
10.0% |
||||||
|
2014 |
17.6% |
23.5% |
17.6% |
17.6% |
5.9% |
0.0% |
0.0% |
5.9% |
5.9% |
0.0% |
5.9% |
||||||
|
2015 |
35.7% |
7.1% |
14.3% |
14.3% |
21.4% |
0.0% |
0.0% |
0.0% |
0.0% |
7.1% |
0.0% |
||||||
|
2016 |
7.1% |
28.6% |
7.1% |
14.3% |
14.3% |
21.4% |
0.0% |
0.0% |
0.0% |
0.0% |
7.1% |
||||||
|
Avg |
16.7% |
16.9% |
15.4% |
12.8% |
10.3% |
10.4% |
5.5% |
3.2% |
1.2% |
1.4% |
6.1% |
||||||
|
Med |
17.6% |
15.4% |
14.3% |
14.3% |
10.0% |
0.0% |
0.0% |
0.0% |
0.0% |
0.0% |
7.1% |
||||||
|
|
|||||||||||||||||
Source: CRS calculations, March 31 of each year, for all staff in the position paid on or after October 2, 2000, based on pay information provided in Report of the Secretary of the Senate, as collated by LegiStorm, available from October 1, 2000. Detailed information about using table data is available in "Presentation of Tenure Data."
|
Staff Tenure, Years |
% in Position |
||||||||||||||||
|
Staff |
Average |
Median |
< 1 Yr |
1-5 Yrs |
5+ Yrs |
||||||||||||
|
2006 |
238 |
2.3 |
1.9 |
28.6% |
60.1% |
11.3% |
|||||||||||
|
2007 |
243 |
2.2 |
1.8 |
36.2% |
53.5% |
10.3% |
|||||||||||
|
2008 |
276 |
2.3 |
1.5 |
36.2% |
46.7% |
17.0% |
|||||||||||
|
2009 |
270 |
2.5 |
1.8 |
28.1% |
55.9% |
15.9% |
|||||||||||
|
2010 |
295 |
2.8 |
2.1 |
26.8% |
54.6% |
18.6% |
|||||||||||
|
2011 |
300 |
2.8 |
2.2 |
30.7% |
52.0% |
17.3% |
|||||||||||
|
2012 |
321 |
3.1 |
2.0 |
27.1% |
53.3% |
19.6% |
|||||||||||
|
2013 |
314 |
3.3 |
2.2 |
26.1% |
48.7% |
25.2% |
|||||||||||
|
2014 |
310 |
3.7 |
2.9 |
20.0% |
50.3% |
29.7% |
|||||||||||
|
2015 |
278 |
3.8 |
2.5 |
26.3% |
45.3% |
28.4% |
|||||||||||
|
2016 |
278 |
3.9 |
2.7 |
24.5% |
45.1% |
30.4% |
|||||||||||
|
Number of staff
|
Percent of staff
|
||||||||||||||||
|
% in Position, by Years of Service |
|||||||||||||||||
|
< 1 |
1-2 |
2-3 |
3-4 |
4-5 |
5-6 |
6-7 |
7-8 |
8-9 |
9-10 |
10+ |
|||||||
|
2012 |
27.1% |
20.6% |
9.3% |
12.5% |
10.9% |
5.0% |
2.5% |
3.7% |
1.9% |
3.7% |
2.8% |
||||||
|
2013 |
26.1% |
14.0% |
17.5% |
7.6% |
9.6% |
8.0% |
4.1% |
2.5% |
3.5% |
1.0% |
6.1% |
||||||
|
2014 |
20.0% |
18.4% |
11.6% |
13.9% |
6.5% |
7.4% |
6.8% |
3.9% |
1.9% |
3.2% |
6.5% |
||||||
|
2015 |
26.3% |
12.2% |
13.3% |
8.3% |
11.5% |
4.3% |
7.2% |
6.1% |
2.5% |
1.1% |
7.2% |
||||||
|
2016 |
24.5% |
16.8% |
11.7% |
11.0% |
5.5% |
7.7% |
3.3% |
7.0% |
5.9% |
2.2% |
4.4% |
||||||
|
Avg |
24.8% |
16.4% |
12.7% |
10.6% |
8.8% |
6.5% |
4.8% |
4.6% |
3.1% |
2.2% |
5.4% |
||||||
|
Med |
26.1% |
16.8% |
11.7% |
11.0% |
9.6% |
7.4% |
4.1% |
3.9% |
2.5% |
2.2% |
6.1% |
||||||
|
|
|||||||||||||||||
Source: CRS calculations, March 31 of each year, for all staff in the position paid on or after October 2, 2000, based on pay information provided in Report of the Secretary of the Senate, as collated by LegiStorm, available from October 1, 2000. Detailed information about using table data is available in "Presentation of Tenure Data."
|
Staff Tenure, Years |
% in Position |
||||||||||||||||
|
Staff |
Average |
Median |
< 1 Yr |
1-5 Yrs |
5+ Yrs |
||||||||||||
|
2006 |
10 |
1.9 |
1.5 |
30.0% |
70.0% |
0.0% |
|||||||||||
|
2007 |
8 |
1.8 |
1.7 |
37.5% |
62.5% |
0.0% |
|||||||||||
|
2008 |
13 |
1.5 |
1.0 |
61.5% |
30.8% |
7.7% |
|||||||||||
|
2009 |
11 |
1.5 |
1.0 |
45.5% |
45.5% |
9.1% |
|||||||||||
|
2010 |
15 |
1.7 |
1.0 |
53.3% |
40.0% |
6.7% |
|||||||||||
|
2011 |
15 |
2.0 |
1.7 |
33.3% |
60.0% |
6.7% |
|||||||||||
|
2012 |
15 |
2.5 |
2.5 |
20.0% |
73.3% |
6.7% |
|||||||||||
|
2013 |
16 |
2.0 |
1.6 |
50.0% |
43.8% |
6.3% |
|||||||||||
|
2014 |
11 |
2.3 |
2.0 |
9.1% |
90.9% |
0.0% |
|||||||||||
|
2015 |
10 |
1.6 |
0.9 |
50.0% |
50.0% |
0.0% |
|||||||||||
|
2016 |
5 |
2.0 |
1.4 |
20.0% |
60.0% |
20.0% |
|||||||||||
|
Number of staff
|
Percent of staff
|
||||||||||||||||
|
% in Position, by Years of Service |
|||||||||||||||||
|
< 1 |
1-2 |
2-3 |
3-4 |
4-5 |
5-6 |
6-7 |
7-8 |
8-9 |
9-10 |
10+ |
|||||||
|
2012 |
20.0% |
26.7% |
40.0% |
0.0% |
6.7% |
0.0% |
0.0% |
0.0% |
0.0% |
6.7% |
0.0% |
||||||
|
2013 |
50.0% |
0.0% |
18.8% |
25.0% |
0.0% |
6.3% |
0.0% |
0.0% |
0.0% |
0.0% |
0.0% |
||||||
|
2014 |
9.1% |
36.4% |
18.2% |
18.2% |
18.2% |
0.0% |
0.0% |
0.0% |
0.0% |
0.0% |
0.0% |
||||||
|
2015 |
50.0% |
10.0% |
20.0% |
0.0% |
20.0% |
0.0% |
0.0% |
0.0% |
0.0% |
0.0% |
0.0% |
||||||
|
2016 |
20.0% |
60.0% |
0.0% |
0.0% |
0.0% |
20.0% |
0.0% |
0.0% |
0.0% |
0.0% |
0.0% |
||||||
|
Avg |
29.8% |
26.6% |
19.4% |
8.6% |
9.0% |
5.3% |
0.0% |
0.0% |
0.0% |
1.3% |
0.0% |
||||||
|
Med |
20.0% |
26.7% |
18.8% |
0.0% |
6.7% |
0.0% |
0.0% |
0.0% |
0.0% |
0.0% |
0.0% |
||||||
|
|
|||||||||||||||||
Source: CRS calculations, March 31 of each year, for all staff in the position paid on or after October 2, 2000, based on pay information provided in Report of the Secretary of the Senate, as collated by LegiStorm, available from October 1, 2000. Detailed information about using table data is available in "Presentation of Tenure Data."
|
Staff Tenure, Years |
% in Position |
||||||||||||||||
|
Staff |
Average |
Median |
< 1 Yr |
1-5 Yrs |
5+ Yrs |
||||||||||||
|
2006 |
70 |
2.3 |
2.4 |
20.0% |
72.9% |
7.1% |
|||||||||||
|
2007 |
74 |
2.4 |
2.2 |
29.7% |
60.8% |
9.5% |
|||||||||||
|
2008 |
84 |
2.8 |
2.4 |
23.8% |
51.2% |
25.0% |
|||||||||||
|
2009 |
89 |
2.8 |
2.2 |
32.6% |
44.9% |
22.5% |
|||||||||||
|
2010 |
90 |
3.4 |
3.0 |
11.1% |
60.0% |
28.9% |
|||||||||||
|
2011 |
93 |
3.3 |
2.5 |
26.9% |
48.4% |
24.7% |
|||||||||||
|
2012 |
94 |
3.9 |
3.2 |
12.8% |
54.3% |
33.0% |
|||||||||||
|
2013 |
95 |
3.6 |
2.4 |
29.5% |
41.1% |
29.5% |
|||||||||||
|
2014 |
86 |
3.8 |
3.2 |
14.0% |
51.2% |
34.9% |
|||||||||||
|
2015 |
76 |
4.1 |
2.5 |
19.7% |
50.0% |
30.3% |
|||||||||||
|
2016 |
73 |
4.3 |
3.2 |
13.7% |
50.7% |
35.6% |
|||||||||||
|
Number of staff
|
Percent of staff
|
||||||||||||||||
|
% in Position, by Years of Service |
|||||||||||||||||
|
< 1 |
1-2 |
2-3 |
3-4 |
4-5 |
5-6 |
6-7 |
7-8 |
8-9 |
9-10 |
10+ |
|||||||
|
2012 |
12.8% |
22.3% |
6.4% |
18.1% |
7.4% |
10.6% |
1.1% |
8.5% |
1.1% |
7.4% |
4.3% |
||||||
|
2013 |
29.5% |
6.3% |
17.9% |
4.2% |
12.6% |
4.2% |
9.5% |
1.1% |
5.3% |
0.0% |
9.5% |
||||||
|
2014 |
14.0% |
27.9% |
3.5% |
16.3% |
3.5% |
12.8% |
3.5% |
7.0% |
1.2% |
4.7% |
5.8% |
||||||
|
2015 |
19.7% |
7.9% |
26.3% |
2.6% |
13.2% |
1.3% |
7.9% |
3.9% |
6.6% |
0.0% |
10.5% |
||||||
|
2016 |
13.7% |
15.1% |
12.3% |
20.5% |
2.7% |
11.0% |
1.4% |
6.8% |
4.1% |
4.1% |
8.2% |
||||||
|
Avg |
17.9% |
15.9% |
13.3% |
12.4% |
7.9% |
8.0% |
4.7% |
5.5% |
3.6% |
3.2% |
7.7% |
||||||
|
Med |
14.0% |
15.1% |
12.3% |
16.3% |
7.4% |
10.6% |
3.5% |
6.8% |
4.1% |
4.1% |
8.2% |
||||||
|
|
|||||||||||||||||
Source: CRS calculations, March 31 of each year, for all staff in the position paid on or after October 2, 2000, based on pay information provided in Report of the Secretary of the Senate, as collated by LegiStorm, available from October 1, 2000. Detailed information about using table data is available in "Presentation of Tenure Data."
|
Staff Tenure, Years |
% in Position |
||||||||||||||||
|
Staff |
Average |
Median |
< 1 Yr |
1-5 Yrs |
5+ Yrs |
||||||||||||
|
2006 |
64 |
2.1 |
1.5 |
25.0% |
67.2% |
7.8% |
|||||||||||
|
2007 |
66 |
2.0 |
1.5 |
43.9% |
48.5% |
7.6% |
|||||||||||
|
2008 |
66 |
2.5 |
1.5 |
27.3% |
54.5% |
18.2% |
|||||||||||
|
2009 |
72 |
2.5 |
2.0 |
29.2% |
56.9% |
13.9% |
|||||||||||
|
2010 |
79 |
2.7 |
1.5 |
30.4% |
48.1% |
21.5% |
|||||||||||
|
2011 |
85 |
2.5 |
1.9 |
37.6% |
45.9% |
16.5% |
|||||||||||
|
2012 |
87 |
2.7 |
1.8 |
26.4% |
56.3% |
17.2% |
|||||||||||
|
2013 |
83 |
2.9 |
2.2 |
28.9% |
55.4% |
15.7% |
|||||||||||
|
2014 |
79 |
3.2 |
3.0 |
17.7% |
63.3% |
19.0% |
|||||||||||
|
2015 |
71 |
3.2 |
2.2 |
32.4% |
49.3% |
18.3% |
|||||||||||
|
2016 |
68 |
2.8 |
1.8 |
32.4% |
51.5% |
16.2% |
|||||||||||
|
Number of staff
|
Percent of staff
|
||||||||||||||||
|
% in Position, by Years of Service |
|||||||||||||||||
|
< 1 |
1-2 |
2-3 |
3-4 |
4-5 |
5-6 |
6-7 |
7-8 |
8-9 |
9-10 |
10+ |
|||||||
|
2012 |
26.4% |
25.3% |
14.9% |
13.8% |
2.3% |
5.7% |
0.0% |
5.7% |
1.1% |
1.1% |
3.4% |
||||||
|
2013 |
28.9% |
12.0% |
22.9% |
10.8% |
9.6% |
2.4% |
3.6% |
0.0% |
3.6% |
1.2% |
4.8% |
||||||
|
2014 |
17.7% |
22.8% |
10.1% |
21.5% |
8.9% |
7.6% |
2.5% |
1.3% |
0.0% |
2.5% |
5.1% |
||||||
|
2015 |
32.4% |
9.9% |
16.9% |
9.9% |
12.7% |
2.8% |
4.2% |
2.8% |
1.4% |
0.0% |
7.0% |
||||||
|
2016 |
32.4% |
19.1% |
13.2% |
13.2% |
5.9% |
5.9% |
1.5% |
2.9% |
1.5% |
0.0% |
4.4% |
||||||
|
Avg |
27.6% |
17.8% |
15.6% |
13.8% |
7.9% |
4.9% |
2.4% |
2.6% |
1.5% |
1.0% |
5.0% |
||||||
|
Med |
28.9% |
19.1% |
14.9% |
13.2% |
8.9% |
5.7% |
2.5% |
2.8% |
1.4% |
1.1% |
4.8% |
||||||
|
|
|||||||||||||||||
Source: CRS calculations, March 31 of each year, for all staff in the position paid on or after October 2, 2000, based on pay information provided in Report of the Secretary of the Senate, as collated by LegiStorm, available from October 1, 2000. Detailed information about using table data is available in "Presentation of Tenure Data."
|
Staff Tenure, Years |
% in Position |
|||||||||||||||
|
Staff |
Average |
Median |
< 1 Yr |
1-5 Yrs |
5+ Yrs |
|||||||||||
|
2006 |
91 |
1.7 |
1.2 |
40.7% |
51.6% |
7.7% |
||||||||||
|
2007 |
96 |
1.7 |
1.4 |
42.7% |
53.1% |
4.2% |
||||||||||
|
2008 |
91 |
2.1 |
1.5 |
29.7% |
61.5% |
8.8% |
||||||||||
|
2009 |
71 |
2.4 |
2.0 |
28.2% |
59.2% |
12.7% |
||||||||||
|
2010 |
85 |
2.2 |
1.2 |
43.5% |
42.4% |
14.1% |
||||||||||
|
2011 |
71 |
2.4 |
1.7 |
32.4% |
52.1% |
15.5% |
||||||||||
|
2012 |
74 |
2.5 |
1.6 |
33.8% |
52.7% |
13.5% |
||||||||||
|
2013 |
57 |
2.0 |
1.6 |
38.6% |
56.1% |
5.3% |
||||||||||
|
2014 |
71 |
1.9 |
1.1 |
40.8% |
53.5% |
5.6% |
||||||||||
|
2015 |
71 |
1.6 |
1.4 |
46.5% |
50.7% |
2.8% |
||||||||||
|
2016 |
69 |
1.9 |
1.5 |
37.7% |
55.1% |
7.2% |
||||||||||
|
Number of staff
|
Percent of staff
|
|||||||||||||||
|
% in Position, by Years of Service |
||||||||||||||||
|
< 1 |
1-2 |
2-3 |
3-4 |
4-5 |
5-6 |
6-7 |
7-8 |
8-9 |
9-10 |
10+ |
||||||
|
2012 |
33.8% |
18.9% |
20.3% |
12.2% |
1.4% |
1.4% |
1.4% |
2.7% |
2.7% |
4.1% |
1.4% |
|||||
|
2013 |
38.6% |
21.1% |
17.5% |
12.3% |
5.3% |
0.0% |
0.0% |
1.8% |
0.0% |
1.8% |
1.8% |
|||||
|
2014 |
40.8% |
22.5% |
15.5% |
11.3% |
4.2% |
2.8% |
0.0% |
0.0% |
1.4% |
0.0% |
1.4% |
|||||
|
2015 |
46.5% |
18.3% |
19.7% |
7.0% |
5.6% |
2.8% |
0.0% |
0.0% |
0.0% |
0.0% |
0.0% |
|||||
|
2016 |
37.7% |
24.6% |
13.0% |
13.0% |
4.3% |
4.3% |
2.9% |
0.0% |
0.0% |
0.0% |
0.0% |
|||||
|
Avg |
39.5% |
21.1% |
17.2% |
11.2% |
4.2% |
2.3% |
0.8% |
0.9% |
0.8% |
1.2% |
0.9% |
|||||
|
Med |
38.6% |
21.1% |
17.5% |
12.2% |
4.3% |
2.8% |
0.0% |
0.0% |
0.0% |
0.0% |
1.4% |
|||||
|
|
||||||||||||||||
Source: CRS calculations, March 31 of each year, for all staff in the position paid on or after October 2, 2000, based on pay information provided in Report of the Secretary of the Senate, as collated by LegiStorm, available from October 1, 2000. Detailed information about using table data is available in "Presentation of Tenure Data."
|
Staff Tenure, Years |
% in Position |
|||||||||||||||
|
Staff |
Average |
Median |
< 1 Yr |
1-5 Yrs |
5+ Yrs |
|||||||||||
|
2006 |
40 |
2.2 |
1.5 |
35.0% |
52.5% |
12.5% |
||||||||||
|
2007 |
40 |
2.5 |
2.2 |
27.5% |
60.0% |
12.5% |
||||||||||
|
2008 |
34 |
2.8 |
2.8 |
32.4% |
47.1% |
20.6% |
||||||||||
|
2009 |
36 |
2.1 |
1.3 |
50.0% |
36.1% |
13.9% |
||||||||||
|
2010 |
37 |
2.6 |
1.4 |
32.4% |
48.6% |
18.9% |
||||||||||
|
2011 |
38 |
2.8 |
1.9 |
42.1% |
36.8% |
21.1% |
||||||||||
|
2012 |
39 |
3.1 |
1.9 |
30.8% |
46.2% |
23.1% |
||||||||||
|
2013 |
42 |
3.0 |
2.0 |
38.1% |
40.5% |
21.4% |
||||||||||
|
2014 |
33 |
3.4 |
2.0 |
21.2% |
51.5% |
27.3% |
||||||||||
|
2015 |
24 |
3.8 |
2.2 |
37.5% |
33.3% |
29.2% |
||||||||||
|
2016 |
24 |
4.1 |
2.0 |
33.3% |
37.5% |
29.2% |
||||||||||
|
Number of staff
|
Percent of staff
|
|||||||||||||||
|
% in Position, by Years of Service |
||||||||||||||||
|
< 1 |
1-2 |
2-3 |
3-4 |
4-5 |
5-6 |
6-7 |
7-8 |
8-9 |
9-10 |
10+ |
||||||
|
2012 |
30.8% |
20.5% |
12.8% |
7.7% |
5.1% |
5.1% |
2.6% |
2.6% |
0.0% |
7.7% |
5.1% |
|||||
|
2013 |
38.1% |
7.1% |
19.0% |
9.5% |
4.8% |
4.8% |
4.8% |
2.4% |
0.0% |
0.0% |
9.5% |
|||||
|
2014 |
21.2% |
30.3% |
3.0% |
12.1% |
6.1% |
6.1% |
6.1% |
6.1% |
3.0% |
0.0% |
6.1% |
|||||
|
2015 |
37.5% |
4.2% |
25.0% |
0.0% |
4.2% |
0.0% |
4.2% |
4.2% |
8.3% |
4.2% |
8.3% |
|||||
|
2016 |
33.3% |
20.8% |
4.2% |
12.5% |
0.0% |
0.0% |
0.0% |
4.2% |
4.2% |
8.3% |
12.5% |
|||||
|
Avg |
32.2% |
16.6% |
12.8% |
8.4% |
4.0% |
3.2% |
3.5% |
3.9% |
3.1% |
4.0% |
8.3% |
|||||
|
Med |
33.3% |
20.5% |
12.8% |
9.5% |
4.8% |
4.8% |
4.2% |
4.2% |
3.0% |
4.2% |
8.3% |
|||||
|
|
||||||||||||||||
Source: CRS calculations, March 31 of each year, for all staff in the position paid on or after October 2, 2000, based on pay information provided in Report of the Secretary of the Senate, as collated by LegiStorm, available from October 1, 2000. Detailed information about using table data is available in "Presentation of Tenure Data."
|
Staff Tenure, Years |
% in Position |
||||||||||||||||
|
Staff |
Average |
Median |
< 1 Yr |
1-5 Yrs |
5+ Yrs |
||||||||||||
|
2006 |
118 |
2.2 |
2.1 |
13.6% |
81.4% |
5.1% |
|||||||||||
|
2007 |
122 |
2.2 |
2.2 |
34.4% |
59.0% |
6.6% |
|||||||||||
|
2008 |
128 |
2.6 |
2.0 |
26.6% |
59.4% |
14.1% |
|||||||||||
|
2009 |
143 |
2.5 |
2.1 |
30.1% |
53.1% |
16.8% |
|||||||||||
|
2010 |
161 |
2.8 |
2.4 |
25.5% |
53.4% |
21.1% |
|||||||||||
|
2011 |
172 |
3.0 |
2.2 |
25.0% |
52.9% |
22.1% |
|||||||||||
|
2012 |
167 |
3.5 |
2.8 |
19.8% |
52.1% |
28.1% |
|||||||||||
|
2013 |
164 |
3.6 |
2.9 |
16.5% |
56.1% |
27.4% |
|||||||||||
|
2014 |
156 |
4.1 |
3.2 |
15.4% |
51.3% |
33.3% |
|||||||||||
|
2015 |
146 |
4.1 |
3.8 |
22.6% |
43.8% |
33.6% |
|||||||||||
|
2016 |
151 |
4.2 |
3.0 |
20.5% |
41.1% |
38.4% |
|||||||||||
|
Number of staff
|
Percent of staff
|
||||||||||||||||
|
% in Position, by Years of Service |
|||||||||||||||||
|
< 1 |
1-2 |
2-3 |
3-4 |
4-5 |
5-6 |
6-7 |
7-8 |
8-9 |
9-10 |
10+ |
|||||||
|
2012 |
19.8% |
19.2% |
12.6% |
14.4% |
6.0% |
7.8% |
4.2% |
5.4% |
4.2% |
4.2% |
2.4% |
||||||
|
2013 |
16.5% |
12.8% |
20.7% |
11.6% |
11.0% |
6.1% |
6.1% |
4.3% |
3.7% |
3.7% |
3.7% |
||||||
|
2014 |
15.4% |
10.9% |
11.5% |
18.6% |
10.3% |
9.0% |
6.4% |
5.1% |
3.2% |
3.2% |
6.4% |
||||||
|
2015 |
22.6% |
11.6% |
8.9% |
8.2% |
15.1% |
5.5% |
6.2% |
6.2% |
4.8% |
2.1% |
8.9% |
||||||
|
2016 |
20.5% |
19.2% |
9.9% |
7.3% |
4.6% |
11.3% |
2.6% |
6.0% |
4.6% |
4.0% |
9.9% |
||||||
|
Avg |
18.9% |
14.7% |
12.7% |
12.0% |
9.4% |
7.9% |
5.1% |
5.4% |
4.1% |
3.4% |
6.3% |
||||||
|
Med |
19.8% |
12.8% |
11.5% |
11.6% |
10.3% |
7.8% |
6.1% |
5.4% |
4.2% |
3.7% |
6.4% |
||||||
|
|
|||||||||||||||||
Source: CRS calculations, March 31 of each year, for all staff in the position paid on or after October 2, 2000, based on pay information provided in Report of the Secretary of the Senate, as collated by LegiStorm, available from October 1, 2000. Detailed information about using table data is available in "Presentation of Tenure Data."
|
Staff Tenure, Years |
% in Position |
|||||||||||||||
|
Staff |
Average |
Median |
< 1 Yr |
1-5 Yrs |
5+ Yrs |
|||||||||||
|
2006 |
349 |
1.9 |
1.5 |
35.0% |
61.0% |
4.0% |
||||||||||
|
2007 |
352 |
1.8 |
1.5 |
44.9% |
48.6% |
6.5% |
||||||||||
|
2008 |
379 |
1.9 |
1.5 |
35.1% |
58.8% |
6.1% |
||||||||||
|
2009 |
354 |
2.1 |
1.9 |
30.2% |
63.0% |
6.8% |
||||||||||
|
2010 |
387 |
2.2 |
1.5 |
34.1% |
57.4% |
8.5% |
||||||||||
|
2011 |
370 |
2.1 |
1.6 |
37.3% |
53.2% |
9.5% |
||||||||||
|
2012 |
373 |
2.3 |
1.5 |
29.0% |
61.7% |
9.4% |
||||||||||
|
2013 |
334 |
2.3 |
2.0 |
33.8% |
56.6% |
9.6% |
||||||||||
|
2014 |
298 |
2.4 |
1.5 |
28.2% |
60.1% |
11.7% |
||||||||||
|
2015 |
256 |
2.2 |
1.7 |
36.3% |
53.5% |
10.2% |
||||||||||
|
2016 |
258 |
2.1 |
1.5 |
37.0% |
56.0% |
7.0% |
||||||||||
|
Number of staff
|
Percent of staff
|
|||||||||||||||
|
% in Position, by Years of Service |
||||||||||||||||
|
< 1 |
1-2 |
2-3 |
3-4 |
4-5 |
5-6 |
6-7 |
7-8 |
8-9 |
9-10 |
10+ |
||||||
|
2012 |
29.0% |
25.5% |
17.7% |
13.1% |
5.4% |
3.5% |
2.7% |
0.8% |
0.5% |
0.8% |
1.1% |
|||||
|
2013 |
33.8% |
15.3% |
20.7% |
12.0% |
8.7% |
3.6% |
2.1% |
1.5% |
0.6% |
0.3% |
1.5% |
|||||
|
2014 |
28.2% |
25.5% |
14.8% |
13.8% |
6.0% |
6.4% |
1.7% |
1.3% |
0.3% |
0.7% |
1.3% |
|||||
|
2015 |
36.3% |
19.1% |
19.9% |
8.6% |
5.9% |
2.7% |
3.9% |
1.2% |
1.2% |
0.4% |
0.8% |
|||||
|
2016 |
37.0% |
23.0% |
16.7% |
11.7% |
4.7% |
1.6% |
1.9% |
1.6% |
0.0% |
1.2% |
0.8% |
|||||
|
Avg |
32.9% |
21.7% |
18.0% |
11.8% |
6.1% |
3.5% |
2.5% |
1.3% |
0.5% |
0.7% |
1.1% |
|||||
|
Med |
33.8% |
23.0% |
17.7% |
12.0% |
5.9% |
3.5% |
2.1% |
1.3% |
0.5% |
0.7% |
1.1% |
|||||
|
|
||||||||||||||||
Source: CRS calculations, March 31 of each year, for all staff in the position paid on or after October 2, 2000, based on pay information provided in Report of the Secretary of the Senate, as collated by LegiStorm, available from October 1, 2000. Detailed information about using table data is available in "Presentation of Tenure Data."
|
Staff Tenure, Years |
% in Position |
|||||||||||||||
|
Staff |
Average |
Median |
< 1 Yr |
1-5 Yrs |
5+ Yrs |
|||||||||||
|
2006 |
322 |
1.2 |
1.0 |
57.5% |
41.9% |
0.6% |
||||||||||
|
2007 |
320 |
1.0 |
0.8 |
66.6% |
32.5% |
0.9% |
||||||||||
|
2008 |
308 |
1.1 |
1.0 |
61.4% |
37.7% |
1.0% |
||||||||||
|
2009 |
295 |
1.2 |
1.0 |
58.6% |
39.7% |
1.7% |
||||||||||
|
2010 |
331 |
1.3 |
1.0 |
57.7% |
41.1% |
1.2% |
||||||||||
|
2011 |
300 |
1.3 |
1.0 |
57.7% |
40.3% |
2.0% |
||||||||||
|
2012 |
307 |
1.4 |
1.0 |
52.1% |
46.3% |
1.6% |
||||||||||
|
2013 |
276 |
1.3 |
1.0 |
54.3% |
43.8% |
1.8% |
||||||||||
|
2014 |
267 |
1.3 |
1.0 |
56.2% |
42.3% |
1.5% |
||||||||||
|
2015 |
248 |
1.3 |
1.0 |
55.2% |
44.4% |
0.4% |
||||||||||
|
2016 |
258 |
1.3 |
1.0 |
58.9% |
40.7% |
0.4% |
||||||||||
|
Number of staff
|
Percent of staff
|
|||||||||||||||
|
% in Position, by Years of Service |
||||||||||||||||
|
< 1 |
1-2 |
2-3 |
3-4 |
4-5 |
5-6 |
6-7 |
7-8 |
8-9 |
9-10 |
10+ |
||||||
|
2012 |
52.1% |
25.4% |
14.0% |
4.9% |
2.0% |
0.3% |
0.0% |
0.0% |
0.7% |
0.3% |
0.3% |
|||||
|
2013 |
54.3% |
23.6% |
14.1% |
4.7% |
1.4% |
0.7% |
0.4% |
0.0% |
0.0% |
0.4% |
0.4% |
|||||
|
2014 |
56.2% |
22.8% |
13.5% |
4.1% |
1.9% |
0.4% |
0.4% |
0.0% |
0.0% |
0.0% |
0.7% |
|||||
|
2015 |
55.2% |
24.6% |
14.9% |
4.0% |
0.8% |
0.0% |
0.0% |
0.0% |
0.0% |
0.0% |
0.4% |
|||||
|
2016 |
58.9% |
19.0% |
14.3% |
7.0% |
0.4% |
0.0% |
0.0% |
0.0% |
0.0% |
0.0% |
0.4% |
|||||
|
Avg |
55.4% |
23.1% |
14.2% |
4.9% |
1.3% |
0.3% |
0.1% |
0.0% |
0.1% |
0.1% |
0.4% |
|||||
|
Med |
55.2% |
23.6% |
14.1% |
4.7% |
1.4% |
0.3% |
0.0% |
0.0% |
0.0% |
0.0% |
0.4% |
|||||
|
|
||||||||||||||||
Source: CRS calculations, March 31 of each year, for all staff in the position paid on or after October 2, 2000, based on pay information provided in Report of the Secretary of the Senate, as collated by LegiStorm, available from October 1, 2000. Detailed information about using table data is available in "Presentation of Tenure Data."
|
Staff Tenure, Years |
% in Position |
||||||||||||||||
|
Staff |
Average |
Median |
< 1 Yr |
1-5 Yrs |
5+ Yrs |
||||||||||||
|
2006 |
69 |
2.2 |
1.5 |
26.1% |
60.9% |
13.0% |
|||||||||||
|
2007 |
74 |
1.8 |
1.4 |
44.6% |
50.0% |
5.4% |
|||||||||||
|
2008 |
75 |
2.4 |
1.5 |
20.0% |
68.0% |
12.0% |
|||||||||||
|
2009 |
81 |
2.5 |
2.1 |
33.3% |
49.4% |
17.3% |
|||||||||||
|
2010 |
82 |
3.0 |
2.4 |
15.9% |
62.2% |
22.0% |
|||||||||||
|
2011 |
81 |
2.6 |
1.8 |
42.0% |
40.7% |
17.3% |
|||||||||||
|
2012 |
78 |
3.2 |
1.9 |
17.9% |
56.4% |
25.6% |
|||||||||||
|
2013 |
80 |
2.9 |
2.2 |
36.3% |
45.0% |
18.8% |
|||||||||||
|
2014 |
72 |
3.4 |
2.5 |
13.9% |
65.3% |
20.8% |
|||||||||||
|
2015 |
64 |
3.6 |
2.5 |
21.9% |
57.8% |
20.3% |
|||||||||||
|
2016 |
62 |
3.9 |
3.5 |
14.5% |
56.5% |
29.0% |
|||||||||||
|
Number of staff
|
Percent of staff
|
||||||||||||||||
|
% in Position, by Years of Service |
|||||||||||||||||
|
< 1 |
1-2 |
2-3 |
3-4 |
4-5 |
5-6 |
6-7 |
7-8 |
8-9 |
9-10 |
10+ |
|||||||
|
2012 |
17.9% |
32.1% |
7.7% |
11.5% |
5.1% |
9.0% |
2.6% |
3.8% |
5.1% |
3.8% |
1.3% |
||||||
|
2013 |
36.3% |
7.5% |
22.5% |
6.3% |
8.8% |
1.3% |
6.3% |
1.3% |
3.8% |
3.8% |
2.5% |
||||||
|
2014 |
13.9% |
30.6% |
11.1% |
16.7% |
6.9% |
5.6% |
0.0% |
5.6% |
1.4% |
2.8% |
5.6% |
||||||
|
2015 |
21.9% |
6.3% |
28.1% |
9.4% |
14.1% |
4.7% |
4.7% |
0.0% |
3.1% |
1.6% |
6.3% |
||||||
|
2016 |
14.5% |
14.5% |
11.3% |
21.0% |
9.7% |
12.9% |
3.2% |
3.2% |
0.0% |
3.2% |
6.5% |
||||||
|
Avg |
20.9% |
18.2% |
16.1% |
13.0% |
8.9% |
6.7% |
3.3% |
2.8% |
2.7% |
3.0% |
4.4% |
||||||
|
Med |
17.9% |
14.5% |
11.3% |
11.5% |
8.8% |
5.6% |
3.2% |
3.2% |
3.1% |
3.2% |
5.6% |
||||||
|
|
|||||||||||||||||
Source: CRS calculations, March 31 of each year, for all staff in the position paid on or after October 2, 2000, based on pay information provided in Report of the Secretary of the Senate, as collated by LegiStorm, available from October 1, 2000. Detailed information about using table data is available in "Presentation of Tenure Data."
|
Staff Tenure, Years |
% in Position |
||||||||||||||||
|
Staff |
Average |
Median |
< 1 Yr |
1-5 Yrs |
5+ Yrs |
||||||||||||
|
2006 |
39 |
2.3 |
1.5 |
35.9% |
53.8% |
10.3% |
|||||||||||
|
2007 |
38 |
2.4 |
2.0 |
39.5% |
44.7% |
15.8% |
|||||||||||
|
2008 |
41 |
2.5 |
1.2 |
36.6% |
39.0% |
24.4% |
|||||||||||
|
2009 |
46 |
2.6 |
1.8 |
37.0% |
41.3% |
21.7% |
|||||||||||
|
2010 |
40 |
3.6 |
2.6 |
17.5% |
55.0% |
27.5% |
|||||||||||
|
2011 |
34 |
4.3 |
3.4 |
26.5% |
35.3% |
38.2% |
|||||||||||
|
2012 |
33 |
4.0 |
1.9 |
36.4% |
30.3% |
33.3% |
|||||||||||
|
2013 |
31 |
3.5 |
2.0 |
38.7% |
35.5% |
25.8% |
|||||||||||
|
2014 |
31 |
4.1 |
2.6 |
25.8% |
48.4% |
25.8% |
|||||||||||
|
2015 |
26 |
4.3 |
3.3 |
19.2% |
53.8% |
26.9% |
|||||||||||
|
2016 |
25 |
4.8 |
3.0 |
26.1% |
39.1% |
34.8% |
|||||||||||
|
Number of staff
|
Percent of staff
|
||||||||||||||||
|
% in Position, by Years of Service |
|||||||||||||||||
|
< 1 |
1-2 |
2-3 |
3-4 |
4-5 |
5-6 |
6-7 |
7-8 |
8-9 |
9-10 |
10+ |
|||||||
|
2012 |
36.4% |
15.2% |
3.0% |
6.1% |
6.1% |
3.0% |
6.1% |
3.0% |
0.0% |
6.1% |
15.2% |
||||||
|
2013 |
38.7% |
9.7% |
19.4% |
3.2% |
3.2% |
0.0% |
3.2% |
3.2% |
3.2% |
0.0% |
16.1% |
||||||
|
2014 |
25.8% |
16.1% |
9.7% |
19.4% |
3.2% |
3.2% |
0.0% |
3.2% |
0.0% |
3.2% |
16.1% |
||||||
|
2015 |
19.2% |
15.4% |
11.5% |
11.5% |
15.4% |
3.8% |
3.8% |
0.0% |
3.8% |
0.0% |
15.4% |
||||||
|
2016 |
26.1% |
21.7% |
4.3% |
4.3% |
8.7% |
13.0% |
4.3% |
4.3% |
0.0% |
4.3% |
8.7% |
||||||
|
Avg |
29.2% |
15.6% |
9.6% |
8.9% |
7.3% |
4.6% |
3.5% |
2.8% |
1.4% |
2.7% |
14.3% |
||||||
|
Med |
26.1% |
15.4% |
9.7% |
6.1% |
6.1% |
3.2% |
3.8% |
3.2% |
0.0% |
3.2% |
15.4% |
||||||
|
|
|||||||||||||||||
Source: CRS calculations, March 31 of each year, for all staff in the position paid on or after October 2, 2000, based on pay information provided in Report of the Secretary of the Senate, as collated by LegiStorm, available from October 1, 2000. Detailed information about using table data is available in "Presentation of Tenure Data."
|
Staff Tenure, Years |
% in Position |
|||||||||||||||
|
Staff |
Average |
Median |
< 1 Yr |
1-5 Yrs |
5+ Yrs |
|||||||||||
|
2006 |
81 |
1.8 |
1.2 |
39.5% |
56.8% |
3.7% |
||||||||||
|
2007 |
79 |
1.8 |
1.5 |
44.3% |
49.4% |
6.3% |
||||||||||
|
2008 |
87 |
2.0 |
1.2 |
40.2% |
50.6% |
9.2% |
||||||||||
|
2009 |
93 |
2.2 |
1.7 |
37.6% |
50.5% |
11.8% |
||||||||||
|
2010 |
85 |
2.4 |
1.5 |
32.9% |
50.6% |
16.5% |
||||||||||
|
2011 |
82 |
1.8 |
1.0 |
56.1% |
32.9% |
11.0% |
||||||||||
|
2012 |
85 |
2.0 |
1.2 |
38.8% |
51.8% |
9.4% |
||||||||||
|
2013 |
90 |
1.8 |
1.1 |
48.9% |
43.3% |
7.8% |
||||||||||
|
2014 |
89 |
1.9 |
1.2 |
33.7% |
59.6% |
6.7% |
||||||||||
|
2015 |
68 |
1.7 |
1.3 |
39.7% |
54.4% |
5.9% |
||||||||||
|
2016 |
68 |
1.8 |
1.2 |
42.6% |
51.5% |
5.9% |
||||||||||
|
Number of staff
|
Percent of staff
|
|||||||||||||||
|
% in Position, by Years of Service |
||||||||||||||||
|
< 1 |
1-2 |
2-3 |
3-4 |
4-5 |
5-6 |
6-7 |
7-8 |
8-9 |
9-10 |
10+ |
||||||
|
2012 |
38.8% |
29.4% |
14.1% |
7.1% |
1.2% |
1.2% |
1.2% |
2.4% |
1.2% |
1.2% |
2.4% |
|||||
|
2013 |
48.9% |
18.9% |
18.9% |
3.3% |
2.2% |
1.1% |
1.1% |
1.1% |
2.2% |
0.0% |
2.2% |
|||||
|
2014 |
33.7% |
31.5% |
16.9% |
9.0% |
2.2% |
2.2% |
0.0% |
1.1% |
1.1% |
1.1% |
1.1% |
|||||
|
2015 |
39.7% |
27.9% |
14.7% |
8.8% |
2.9% |
2.9% |
1.5% |
0.0% |
1.5% |
0.0% |
0.0% |
|||||
|
2016 |
42.6% |
25.0% |
17.6% |
5.9% |
2.9% |
0.0% |
2.9% |
1.5% |
0.0% |
1.5% |
0.0% |
|||||
|
Avg |
40.8% |
26.5% |
16.4% |
6.8% |
2.3% |
1.5% |
1.3% |
1.2% |
1.2% |
0.8% |
1.1% |
|||||
|
Med |
39.7% |
27.9% |
16.9% |
7.1% |
2.2% |
1.2% |
1.2% |
1.1% |
1.2% |
1.1% |
1.1% |
|||||
|
|
||||||||||||||||
Source: CRS calculations, March 31 of each year, for all staff in the position paid on or after October 2, 2000, based on pay information provided in Report of the Secretary of the Senate, as collated by LegiStorm, available from October 1, 2000. Detailed information about using table data is available in "Presentation of Tenure Data."
|
Staff Tenure, Years |
% in Position |
|||||||||||||||||
|
Staff |
Average |
Median |
< 1 Yr |
1-5 Yrs |
5+ Yrs |
|||||||||||||
|
2006 |
47 |
2.1 |
1.2 |
25.5% |
72.3% |
2.1% |
||||||||||||
|
2007 |
40 |
2.2 |
2.0 |
32.5% |
62.5% |
5.0% |
||||||||||||
|
2008 |
41 |
2.6 |
2.0 |
31.7% |
51.2% |
17.1% |
||||||||||||
|
2009 |
45 |
2.8 |
2.4 |
26.7% |
51.1% |
22.2% |
||||||||||||
|
2010 |
59 |
2.6 |
1.2 |
49.2% |
28.8% |
22.0% |
||||||||||||
|
2011 |
55 |
3.0 |
2.0 |
20.0% |
60.0% |
20.0% |
||||||||||||
|
2012 |
64 |
3.1 |
1.9 |
39.1% |
37.5% |
23.4% |
||||||||||||
|
2013 |
66 |
2.8 |
1.8 |
36.4% |
45.5% |
18.2% |
||||||||||||
|
2014 |
68 |
3.0 |
1.3 |
27.9% |
51.5% |
20.6% |
||||||||||||
|
2015 |
50 |
3.5 |
2.2 |
10.0% |
72.0% |
18.0% |
||||||||||||
|
2016 |
50 |
3.7 |
3.2 |
22.0% |
58.0% |
20.0% |
||||||||||||
|
Number of staff
|
Percent of staff
|
|||||||||||||||||
|
% in Position, by Years of Service |
||||||||||||||||||
|
< 1 |
1-2 |
2-3 |
3-4 |
4-5 |
5-6 |
6-7 |
7-8 |
8-9 |
9-10 |
10+ |
||||||||
|
2012 |
39.1% |
10.9% |
12.5% |
10.9% |
3.1% |
6.3% |
1.6% |
3.1% |
4.7% |
6.3% |
1.6% |
|||||||
|
2013 |
36.4% |
24.2% |
7.6% |
7.6% |
6.1% |
0.0% |
4.5% |
1.5% |
3.0% |
3.0% |
6.1% |
|||||||
|
2014 |
27.9% |
27.9% |
13.2% |
4.4% |
5.9% |
5.9% |
0.0% |
4.4% |
1.5% |
1.5% |
7.4% |
|||||||
|
2015 |
10.0% |
18.0% |
32.0% |
18.0% |
4.0% |
6.0% |
2.0% |
0.0% |
2.0% |
0.0% |
8.0% |
|||||||
|
2016 |
22.0% |
8.0% |
12.0% |
24.0% |
14.0% |
4.0% |
6.0% |
2.0% |
0.0% |
2.0% |
6.0% |
|||||||
|
Avg |
27.1% |
17.8% |
15.5% |
13.0% |
6.6% |
4.4% |
2.8% |
2.2% |
2.2% |
2.6% |
5.8% |
|||||||
|
Med |
27.9% |
18.0% |
12.5% |
10.9% |
5.9% |
5.9% |
2.0% |
2.0% |
2.0% |
2.0% |
6.1% |
|||||||
|
|
||||||||||||||||||
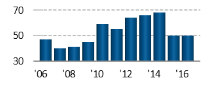
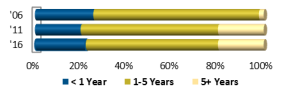
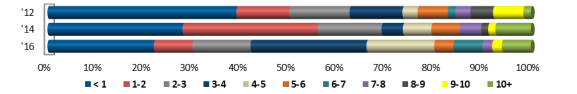
Source: CRS calculations, March 31 of each year, for all staff in the position paid on or after October 2, 2000, based on pay information provided in Report of the Secretary of the Senate, as collated by LegiStorm, available from October 1, 2000. Detailed information about using table data is available in "Presentation of Tenure Data."
|
Staff Tenure, Years |
% in Position |
|||||||||||||||
|
Staff |
Average |
Median |
< 1 Yr |
1-5 Yrs |
5+ Yrs |
|||||||||||
|
2006 |
66 |
1.9 |
1.4 |
30.3% |
60.6% |
9.1% |
||||||||||
|
2007 |
85 |
1.8 |
1.2 |
48.2% |
44.7% |
7.1% |
||||||||||
|
2008 |
86 |
2.1 |
1.5 |
31.4% |
58.1% |
10.5% |
||||||||||
|
2009 |
91 |
2.0 |
1.9 |
37.4% |
54.9% |
7.7% |
||||||||||
|
2010 |
88 |
2.6 |
2.0 |
18.2% |
67.0% |
14.8% |
||||||||||
|
2011 |
89 |
2.7 |
2.2 |
36.0% |
47.2% |
16.9% |
||||||||||
|
2012 |
90 |
3.2 |
2.6 |
21.1% |
52.2% |
26.7% |
||||||||||
|
2013 |
97 |
3.1 |
2.2 |
34.0% |
41.2% |
24.7% |
||||||||||
|
2014 |
92 |
3.7 |
2.5 |
18.5% |
51.1% |
30.4% |
||||||||||
|
2015 |
76 |
4.2 |
3.0 |
15.8% |
50.0% |
34.2% |
||||||||||
|
2016 |
74 |
4.4 |
3.4 |
27.0% |
35.1% |
37.8% |
||||||||||
|
Number of staff
|
Percent of staff
|
|||||||||||||||
|
% in Position, by Years of Service |
||||||||||||||||
|
< 1 |
1-2 |
2-3 |
3-4 |
4-5 |
5-6 |
6-7 |
7-8 |
8-9 |
9-10 |
10+ |
||||||
|
2012 |
21.1% |
22.2% |
10.0% |
13.3% |
6.7% |
12.2% |
3.3% |
5.6% |
1.1% |
4.4% |
0.0% |
|||||
|
2013 |
34.0% |
8.2% |
15.5% |
8.2% |
9.3% |
6.2% |
8.2% |
2.1% |
3.1% |
1.0% |
4.1% |
|||||
|
2014 |
18.5% |
22.8% |
9.8% |
10.9% |
7.6% |
6.5% |
4.3% |
8.7% |
2.2% |
3.3% |
5.4% |
|||||
|
2015 |
15.8% |
10.5% |
22.4% |
7.9% |
9.2% |
6.6% |
5.3% |
5.3% |
7.9% |
1.3% |
7.9% |
|||||
|
2016 |
27.0% |
8.1% |
6.8% |
13.5% |
6.8% |
6.8% |
5.4% |
5.4% |
4.1% |
8.1% |
8.1% |
|||||
|
Avg |
23.3% |
14.4% |
12.9% |
10.8% |
7.9% |
7.7% |
5.3% |
5.4% |
3.7% |
3.6% |
5.1% |
|||||
|
Med |
21.1% |
10.5% |
10.0% |
10.9% |
7.6% |
6.6% |
5.3% |
5.4% |
3.1% |
3.3% |
5.4% |
|||||
|
|
||||||||||||||||
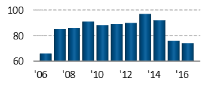
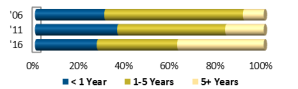
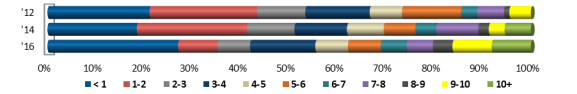
Source: CRS calculations, March 31 of each year, for all staff in the position paid on or after October 2, 2000, based on pay information provided in Report of the Secretary of the Senate, as collated by LegiStorm, available from October 1, 2000. Detailed information about using table data is available in "Presentation of Tenure Data."
|
Staff Tenure, Years |
% in Position |
|||||||||||||||
|
Staff |
Average |
Median |
< 1 Yr |
1-5 Yrs |
5+ Yrs |
|||||||||||
|
2006 |
576 |
1.5 |
0.9 |
53.0% |
43.6% |
3.5% |
||||||||||
|
2007 |
515 |
1.5 |
0.8 |
58.8% |
33.6% |
7.6% |
||||||||||
|
2008 |
540 |
1.6 |
0.9 |
57.6% |
34.6% |
7.8% |
||||||||||
|
2009 |
539 |
1.7 |
1.0 |
52.1% |
38.6% |
9.3% |
||||||||||
|
2010 |
557 |
1.8 |
0.9 |
55.8% |
33.9% |
10.2% |
||||||||||
|
2011 |
525 |
1.8 |
1.0 |
51.2% |
39.4% |
9.3% |
||||||||||
|
2012 |
479 |
2.0 |
1.1 |
47.6% |
43.0% |
9.4% |
||||||||||
|
2013 |
428 |
1.8 |
0.9 |
57.5% |
33.4% |
9.1% |
||||||||||
|
2014 |
446 |
1.8 |
1.0 |
53.6% |
38.3% |
8.1% |
||||||||||
|
2015 |
368 |
1.8 |
0.9 |
54.9% |
37.8% |
7.3% |
||||||||||
|
2016 |
369 |
1.6 |
0.8 |
62.1% |
30.6% |
7.3% |
||||||||||
|
Number of staff
|
Percent of staff
|
|||||||||||||||
|
% in Position, by Years of Service |
||||||||||||||||
|
< 1 |
1-2 |
2-3 |
3-4 |
4-5 |
5-6 |
6-7 |
7-8 |
8-9 |
9-10 |
10+ |
||||||
|
2012 |
47.6% |
22.3% |
10.6% |
5.0% |
5.0% |
1.9% |
0.4% |
1.7% |
1.5% |
1.3% |
2.7% |
|||||
|
2013 |
57.5% |
17.1% |
7.9% |
5.6% |
2.8% |
2.6% |
0.7% |
0.2% |
1.6% |
1.4% |
2.6% |
|||||
|
2014 |
53.6% |
25.8% |
5.6% |
4.0% |
2.9% |
1.3% |
1.8% |
0.7% |
0.0% |
0.9% |
3.4% |
|||||
|
2015 |
54.9% |
19.3% |
13.9% |
1.4% |
3.3% |
1.6% |
0.8% |
1.1% |
0.3% |
0.0% |
3.5% |
|||||
|
2016 |
62.1% |
18.7% |
6.0% |
5.1% |
0.8% |
2.4% |
0.8% |
0.8% |
0.5% |
0.0% |
2.7% |
|||||
|
Avg |
55.1% |
20.6% |
8.8% |
4.2% |
3.0% |
2.0% |
0.9% |
0.9% |
0.8% |
0.7% |
3.0% |
|||||
|
Med |
54.9% |
19.3% |
7.9% |
5.0% |
2.9% |
1.9% |
0.8% |
0.8% |
0.5% |
0.9% |
2.7% |
|||||
|
|
||||||||||||||||
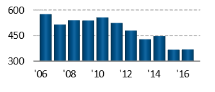
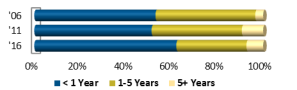
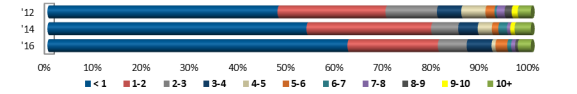
Source: CRS calculations, March 31 of each year, for all staff in the position paid on or after October 2, 2000, based on pay information provided in Report of the Secretary of the Senate, as collated by LegiStorm, available from October 1, 2000. Detailed information about using table data is available in "Presentation of Tenure Data."
|
Staff Tenure, Years |
% in Position |
||||||||||||||||
|
Staff |
Average |
Median |
< 1 Yr |
1-5 Yrs |
5+ Yrs |
||||||||||||
|
2006 |
61 |
2.7 |
2.6 |
14.8% |
70.5% |
14.8% |
|||||||||||
|
2007 |
58 |
2.9 |
2.5 |
25.9% |
55.2% |
19.0% |
|||||||||||
|
2008 |
62 |
3.2 |
3.0 |
22.6% |
46.8% |
30.6% |
|||||||||||
|
2009 |
67 |
3.2 |
2.2 |
25.4% |
44.8% |
29.9% |
|||||||||||
|
2010 |
70 |
3.5 |
2.7 |
22.9% |
47.1% |
30.0% |
|||||||||||
|
2011 |
78 |
3.1 |
2.2 |
33.3% |
46.2% |
20.5% |
|||||||||||
|
2012 |
77 |
3.8 |
3.0 |
13.0% |
58.4% |
28.6% |
|||||||||||
|
2013 |
76 |
3.4 |
2.5 |
25.0% |
48.7% |
26.3% |
|||||||||||
|
2014 |
70 |
3.8 |
3.0 |
17.1% |
52.9% |
30.0% |
|||||||||||
|
2015 |
65 |
4.0 |
2.5 |
13.8% |
58.5% |
27.7% |
|||||||||||
|
2016 |
64 |
4.3 |
3.2 |
22.2% |
44.4% |
33.3% |
|||||||||||
|
Number of staff
|
Percent of staff
|
||||||||||||||||
|
% in Position, by Years of Service |
|||||||||||||||||
|
< 1 |
1-2 |
2-3 |
3-4 |
4-5 |
5-6 |
6-7 |
7-8 |
8-9 |
9-10 |
10+ |
|||||||
|
2012 |
13.0% |
24.7% |
11.7% |
11.7% |
10.4% |
9.1% |
0.0% |
5.2% |
2.6% |
5.2% |
6.5% |
||||||
|
2013 |
25.0% |
9.2% |
19.7% |
9.2% |
10.5% |
10.5% |
3.9% |
0.0% |
3.9% |
1.3% |
6.6% |
||||||
|
2014 |
17.1% |
21.4% |
11.4% |
12.9% |
7.1% |
7.1% |
8.6% |
2.9% |
0.0% |
4.3% |
7.1% |
||||||
|
2015 |
13.8% |
12.3% |
24.6% |
9.2% |
12.3% |
4.6% |
3.1% |
7.7% |
3.1% |
0.0% |
9.2% |
||||||
|
2016 |
22.2% |
9.5% |
6.3% |
20.6% |
7.9% |
11.1% |
3.2% |
1.6% |
7.9% |
1.6% |
7.9% |
||||||
|
Avg |
18.2% |
15.4% |
14.8% |
12.7% |
9.7% |
8.5% |
3.8% |
3.5% |
3.5% |
2.5% |
7.5% |
||||||
|
Med |
17.1% |
12.3% |
11.7% |
11.7% |
10.4% |
9.1% |
3.2% |
2.9% |
3.1% |
1.6% |
7.1% |
||||||
|
|
|||||||||||||||||
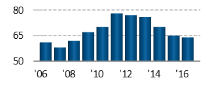
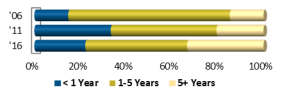
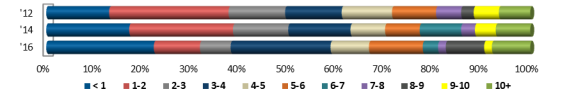
Source: CRS calculations, March 31 of each year, for all staff in the position paid on or after October 2, 2000, based on pay information provided in Report of the Secretary of the Senate, as collated by LegiStorm, available from October 1, 2000. Detailed information about using table data is available in "Presentation of Tenure Data."
Appendix. Job Title Categories
There is wide variation among the job titles used for various positions in congressional offices. Between October 2000 and March 2016, House and Senate pay data provided 13,271 unique titles under which staff received pay. Of those, 1,884 were extracted and categorized into one of 33 job titles used in CRS Reports about Member or committee offices. Office type was sometimes related to the job titles used. Some titles were specific to Member (e.g., District Director, State Director, and Field Representative) or committee (positions that are identified by majority, minority, or party standing, and Chief Clerk) offices, while others were identified in each setting (Counsel, Scheduler, Staff Assistant, and Legislative Assistant).
Other job titles variations reflect factors specific to particular offices, since each office functions as its own hiring authority. Some of the titles may distinguish between roles and duties carried out in the office (e.g., chief of staff, legislative assistant, etc.). Some offices may use job titles to indicate degrees of seniority. Others might represent arguably inconsequential variations in title between two staff members who might be carrying out essentially similar activities. Examples include:
- Seemingly related job titles, such as Administrative Director and Administrative Manager, or Caseworker and Constituent Advocate
- Job titles modified by location, such as Washington, DC, State, or District Chief of Staff
- Job titles modified by policy or subject area, such as Domestic Policy Counsel, Energy Counsel, or Counsel for Constituent Services
- Committee job titles modified by party or committee subdivision. This could include a party-related distinction, such as a Majority, Minority, Democratic, or Republican Professional Staff Member. It could also denote Full Committee Staff Member, Subcommittee Staff Member, or work on behalf of an individual committee leader, like the chair or ranking member.
The titles used in this report were used by most Senators' offices, but a number of apparently related variations are included to ensure inclusion of additional offices and staff. Table A-1 provides the number of related titles included for each position used in this report or related CRS Reports on staff tenure. A list of all titles included by category is available to congressional offices upon request.
|
Category Title |
Related Titles |
Category Title |
Related Positions |
|
Administrative Director |
34 |
Minority Professional Staff Member |
22 |
|
Casework Supervisor |
31 |
Minority Staff Director |
3 |
|
Caseworker |
94 |
Minority Subcommittee Staff Director |
32 |
|
Chief Clerk |
7 |
Office Coordinator |
34 |
|
Chief Counsel |
68 |
Office Manager |
62 |
|
Chief of Staff |
23 |
Press Secretary |
80 |
|
Communications Director |
18 |
Professional Staff Member |
142 |
|
Counsel |
180 |
Regional Representative |
37 |
|
Deputy Staff Director |
41 |
Scheduler |
70 |
|
District Director |
52 |
Senior Counsel |
81 |
|
Executive Assistant |
36 |
Senior Professional Staff Member |
26 |
|
Field Representative |
24 |
Staff Assistant |
165 |
|
Legislative Assistant |
78 |
Staff Director |
39 |
|
Legislative Correspondent |
23 |
State Director |
31 |
|
Legislative Director |
11 |
Subcommittee Staff Director |
214 |
|
Minority Chief Counsel |
12 |
Systems Administrator |
47 |
|
Minority Counsel |
22 |
Source: CRS, based on House and Senate pay data.
Author Contact Information
Acknowledgments
Jennifer Manning, Senior Research Librarian in the Knowledge Services Group, provided research support for this report. Claudia Guidi, Support Specialist, and Alex Marine, Publications Editor, provided formatting and editorial support.
Footnotes
| 1. |
U.S. Congress, House Committee on House Administration, Committee Funding for the 114th Congress (Day1), 114th Cong., 1st sess., February 4, 2015 (Washington: GPO, 2015), pp.19-20, 28-29, 38, 47, 70, 72, 80, 87, 103, and 110-112, at https://www.gpo.gov/fdsys/pkg/CHRG-114hhrg93363/pdf/CHRG-114hhrg93363.pdf; U.S. Congress, House Committee on House Administration, Committee Funding for the 112th Congress (Day1), 112th Cong., 1st sess., March 2, 2011 (Washington: GPO, 2011), pp. 19-20, 32, 49, 57, 63, 95, and 108, at https://www.gpo.gov/fdsys/pkg/CHRG-112hhrg66807/pdf/CHRG-112hhrg66807.pdf; Andrew Taylor, "Lawmakers Vote To Increase Budgets For House Offices," Associated Press Newswire, June 10, 2016; Luke Rosiak, "Freshmen Reformers Avoid Hill Experience In Staffing; But Knowledge Shown To Help," The Washington Times, February 15, 2013, p. A-1; and Julie R. Hirschfeld, "Legislative Branch Cutbacks Add To House-Senate Salary Disparity," Congressional Quarterly Daily Monitor, May 8, 2000. |
| 2. |
Jennifer M. Jensen, "Explaining Congressional Staff Members' Decisions to Leave the Hill," Congress and the Presidency, vol. 38, no. 1 (2011), pp. 39-59; and Barbara S. Romzek and Jennifer A. Utter, "Career Dynamics of Congressional Legislative Staff: Preliminary Profile and Research Questions," Journal of Public Administration Research and Theory, vol. 6, no. 6 (1996), pp. 415-424. |
| 3. |
Anthony J. Madonna and Ian Ostrander, "Getting the Congress You Pay For: Legislative Staffing and Organizational Capacity," Paper prepared for presentation at the Annual Meeting of the American Political Science Association, Washington, DC, August 28-September 1, 2014; Robert C. Byrd, The Senate, 1789-1989: Addresses on the History of the United States Senate, vol. I (Washington: GPO, 1988); Harrison W. Fox, Jr. and Susan Webb Hammond, Congressional Staffs: the Invisible Force in American Lawmaking (New York: The Free Press, 1977); Kenneth Kofmehl, Professional Staffs of Congress, 3rd ed. (West Lafayette, IN: Purdue University Press, 1977). |
| 4. |
Additional information on the job titles used in this report is available in an Appendix, below. For a discussion of staff roles in Members' offices, see CRS Report RL34545, Congressional Staff: Duties and Functions of Selected Positions, by R. Eric Petersen. |
| 5. |
U.S. Senate, Secretary of the Senate, 2006 U.S. Senate Employment, Compensation, Hiring and Benefits Study (Washington: 2006). |
| 6. |
The Report of the Secretary of the Senate since April 2011 is available at https://www.senate.gov/legislative/common/generic/report_secsen.htm. |
| 7. |
http://www.legistorm.com/. LegiStorm provides data from October 1, 2000, see "Congressional Salaries FAQ," https://www.legistorm.com/salaries/faq.html#How_far_back_does_your_salary_information_go_. Congressional staff pay data are taken by LegiStorm from the Report of the Secretary of the Senate and the Statement of Disbursements (SOD), published quarterly by the House Chief Administrative Officer. LegiStorm provided staff and pay records to the Congressional Research Service covering the period October 1, 2000-March 31, 2016, for the Senate and House in a series of relational data files that combined information about staff from both chambers. LegiStorm data contained information on 170,108 individuals, including current and former congressional staff, Members of Congress, other government officials, and others; of those, 43,014 were employed by a Senator between 2000 and 2016. The LegiStorm-aggregated House and Senate pay data contained more than 1.23 million records, including 154,196 records of staff working for Senators that were used to derive tenure information provided in this report. |
| 8. |
Staff were included if they were on payroll on March 31 of each year and had at least one week of service in the position. Staff with six or fewer days (0.0167 years) of service in the position on March 31 of each year were excluded. |
| 9. |
Figure 1 provides a simplified view of congressional staff tenure; other possibilities for jobholder tenure periods exist but are not represented in this illustration. Some staff starting employment at the same time as Jobholder A, for example, might have terminated their service prior to March 31, 2006, or might have continued in the position after March 31, 2016. Similarly, some staff starting at the same time as Jobholder B might not have ended their service before March 31, 2016, and might have continued in the position after that date. |
| 10. |
U.S. Senate, Committee on Rules and Administration, Senate Handbook (Washington: 1996), pp. I-13. |
| 11. |
As used in this report, "trend" is an indication of the general course of median staff tenure in each position over time, based on a linear regression model. The resulting trend line (which is available to congressional staff upon request), could increase, decrease, or remain unchanged. Each position's trend line varies between 2006 and 2016, but the variability demonstrates negligible change for most positions. To distinguish positions with readily measurable changes in their tenure, a benchmark of change in trend is set to an increase or decrease of six months' tenure over the 11 years observed. "Unchanged" in this context is defined as an increase or decrease in the median trend of tenure of fewer than six months between 2006 and 2016. |
| 12. |
A measure of central tendency is a single value that represents the middle of a data distribution, or list of numbers. It is often used to summarize that set of data. There are a variety of ways to measure central tendency, including, but not limited to, the average and median. |
| 13. |
Administrative Director, Casework Supervisor, Caseworker, Chief of Staff, Communications Director, Field Representative, Legislative Director, Office Manager, Regional Representative, and Scheduler. |
| 14. |
"Unchanged" in this context is defined as an increase or decrease in the median trend of tenure of fewer than six months between 2006 and 2016. |
| 15. |
Chief Counsel, Counsel, Executive Assistant, Legislative Assistant, Legislative Correspondent, Press Secretary, Staff Assistant, and State Director. |
| 16. |
Data collected by the Bureau of Labor Statistics (BLS) suggest that the tenure trend in the U.S. labor force for workers aged 25 and over is largely unchanged between 2006 and 2016. See U.S. Department of Labor, Bureau of Labor Statistics, Table 1. Median years of tenure with current employer for employed wage and salary workers by age and sex, selected years, 2006-16, Washington, DC, September 22, 2016, http://www.bls.gov/news.release/tenure.t01.htm. See also, ibid., Employee Tenure Summary, http://www.bls.gov/news.release/tenure.nr0.htm. Staff working in congressional offices likely appear to be fairly representative of the general workforce in the United States. Nevertheless, direct comparisons of congressional employment to the general labor market may have limitations. Unlike congressional tenure data provided in this report by title, for example, BLS data are based on the entire U.S. workforce, and determine tenure statistics based on the time an employee spends with an employer rather than time in one specified job title. Comparisons between the two sets of employment tenure information should be drawn with care. |
| 17. |
For more information on congressional salaries, see CRS Report R44324, Staff Pay Levels for Selected Positions in Senators' Offices, FY2001-FY2014, coordinated by R. Eric Petersen. Pay data are not available for the Chief Counsel, Office Manager, or Regional Representative titles. |
| 18. |
Those staff positions that typically earn a lower salary than others, including Executive Assistant, Legislative Assistant, Legislative Correspondent, and Staff Assistant, may be seen in some Senators' offices as entry level, but both pay data (see ibid.) and tenure data presented in this report suggest that this might not be a consistent practice in every office. |