Poverty in the United States in 2015: In Brief
In 2015, approximately 43.1 million people, or 13.5% of the population, had incomes that fell below the official definition of poverty in the United States. These statistics represented a noticeable drop from the previous year, both in the number of poor, which had been 46.7 million in 2014, and the poverty rate (the percentage that were in poverty), which fell from 14.8%.
The drop in the U.S. poverty rate was broad-based, with poverty lessening among many demographic groups.
Families with a female householder and no spouse present (female-householder families) historically have had higher poverty rates than married-couple families and families with a male householder and no spouse present (male-householder families). This remained true in 2015, though all three family types experienced poverty rate declines.
Poverty rates also fell for all three broad age categories: children under 18, working-age adults 18 to 64, and persons 65 years and older.
Declines in poverty among the working-aged were driven by gains in the number working full-time year-round. In 2015, the working-age population grew by 1.0 million, but the number of full-time year-round workers (both poor and nonpoor) had a net gain of 2.3 million.
While having a job reduced the likelihood of being in poverty, it did not guarantee that a person or his or her family would avoid poverty.
Poverty rates fell among non-Hispanic whites, blacks, Hispanics, the American Indian and Alaska Native population, and Native Hawaiians and Other Pacific Islanders. No discernable change in poverty rates was detected for Asians.
Twenty-three states experienced poverty rate declines from 2014 to 2015.
Criticisms of the official poverty measure have inspired poverty measurement research and eventually led to the development of the Supplemental Poverty Measure (SPM). The SPM uses different definitions of needs and resources than the official measure. The measure of need used in the SPM includes food, clothing, shelter, utilities, and a bit extra for miscellaneous expenses, adjusted for geographic variations in costs. Unlike the official measure, the SPM uses after-tax income and includes in-kind benefits which generally help families with children; subtracts out work-related expenses which are often incurred by the working-age population; and subtracts medical out-of-pocket expenses, which are incurred frequently by people age 65 and older, from income. Under the SPM, the profile of the poverty population is slightly different than under the official measure. After rounding, the SPM was about 0.7 percentage points higher in 2015 than the official poverty rate.
Contents
- Introduction
- How the Official Poverty Measure is Computed
- Historical Perspective
- Poverty for Demographic Groups
- Family Structure
- Age
- Work Status
- Race and Hispanic Origin
- Poverty Rates by State
- Supplemental Poverty Measure (SPM)
- How the Official Poverty Measure was Developed
- Motivation for a Supplemental Measure
- Findings for 2015
Figures
- Figure 1. Number of People Below Poverty, and Poverty Rate, 1959 to 2015
- Figure 2. Poverty Rates by Age: 1959 to 2015
- Figure 3. Percentage of People in Poverty in the Past 12 Months, by State and for the District of Columbia and Puerto Rico: 2015
- Figure 4. Poverty Rates Under Official Measure and Supplemental Poverty Measure, for the U.S. Total Population, by Age, and by Region: 2015
Introduction
In 2015, approximately 43.1 million people, or 13.5% of the population, had incomes that fell below the official definition of poverty in the United States. These statistics represented a noticeable drop from the previous year, both in the number of poor, which had been 46.7 million in 2014, and the poverty rate (the percentage that were in poverty), which had been 14.8%.
In this report, the numbers and percentages of those in poverty are based on the Census Bureau's estimates. While the official measure is regarded as a statistical yardstick rather than as a complete description of what people and families need to live,1 it does offer a measure of economic hardship faced by the low-income population. The Census Bureau releases these poverty estimates every September for the prior calendar year. Hence, most of the comparisons discussed below are year-to-year comparisons. However, in addition to the most recent year's data, a historical perspective is provided. This report will also present information on poverty for demographic groups (by family structure, age, race and Hispanic origin, and work status) and for states.
Over the past several decades, criticisms of the official measure have led to the development of an alternative research measure called the Supplemental Poverty Measure, or SPM, which the Census Bureau has also computed and released. Statistics comparing the official measure with the SPM are provided at the conclusion of this report.
How the Official Poverty Measure is Computed2
In the poverty measures presented here, a person's poverty status is determined by comparing his or her resources against a measure of need. For the official measure, "resources" is defined as money income before taxes, and the measure of "need" is a dollar amount called a poverty threshold. There are 48 poverty thresholds that vary by family size and composition.
When comparing income with the threshold, the income used is total family income, and the threshold used is one appropriate for the size and composition of the family. That is, if a person lives with other people to whom they are related by birth, marriage, or adoption, the money income from all family members is added together, and the total family income is used to determine their poverty status. If a person does not live with any family members, his or her own income is used. Only money income before taxes is used—the official poverty measure does not treat in-kind benefits such as the Supplemental Nutritional Assistance Program (SNAP, formerly known as food stamps), housing subsidies, or employer-provided benefits as income.
The poverty threshold dollar amounts vary by the size of the family (from one person not living in a family, to nine or more family members) and the ages of the family members (how many of the members are children under 18, and whether or not the family head is 65 years of age or older). Collectively, these poverty thresholds are often referred to as the "poverty line." As a rough guide, the "poverty line" can be thought of as $24,257 for a family of four, $18,871 for a family of three, $15,391 for a family of two, or $12,082 for an individual not living in a family, though the official measure is actually much more detailed.3
The threshold dollar amounts are updated annually for inflation using the Consumer Price Index, but the same thresholds are applied throughout the country—no adjustment is made for geographic variations in living expenses.4
Historical Perspective
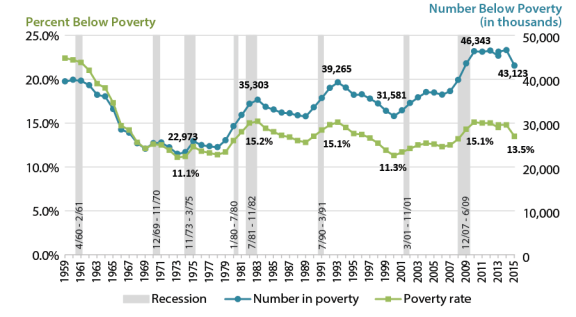
Figure 1 shows the number and percent of the population below the poverty line to provide a historical perspective. The number in poverty and the poverty rates are shown from the earliest year available (1959), through the most recent year available (2015). Because the total U.S. population has grown over time, poverty rates are useful for historical comparisons because population size is used in their computation.
Poverty rates fell from 1961 through the rest of the 1960s, and since then have generally risen and fallen according to the economic cycle, though during the most recent two expansions poverty rates did not fall measurably until four to five years into the expansion.5 Historically notable lows occurred in 1973 (11.1%) and 2000 (11.3%).6 Poverty rate peaks occurred in 1983 (15.2%), 1993 (15.1%), and 2010 (15.1%).7
Poverty rates tend to rise during and after recessions, as opposed to leading economic indicators such as new housing construction, whose changes often precede changes in the performance of the overall economy. The poverty rate's lag is explainable in part by the way it is measured: it uses income from the entire calendar year.
|
Figure 1. Number of People Below Poverty, and Poverty Rate, 1959 to 2015 Poverty rates in percentages, number of persons in thousands (40,000 represents 40 million). |
 |
|
Source: Congressional Research Service, based on poverty data from U.S. Census Bureau, Current Population Survey, 1960-2016 Annual Social and Economic Supplements. Obtained from Historical Poverty Table 2, http://www2.census.gov/programs-surveys/cps/tables/time-series/historical-poverty-people/hstpov2.xls, downloaded September 13, 2016. Recession dates obtained from National Bureau of Economic Research, http://www.nber.org/cycles/cyclesmain.html. Notes: Two estimates are shown for 2013 because the Census Bureau implemented a change to the CPS ASEC income questions. This change was partially implemented with the 2013 data, and fully implemented for the 2014 data. For 2013, some households received the old questionnaire and others the new, so that it would be possible to see the effect of changing the questionnaire, as well as to be able to make consistent comparisons both before and after 2013. |
Poverty for Demographic Groups
The drop in the U.S. poverty rate (from 14.8% in 2014 to 13.5% in 2015) was broad-based, with poverty lessening among many demographic groups. Details for some of these groups are described below.
Family Structure
Families with a female householder and no spouse present (female-householder families) historically have had higher poverty rates than married-couple families and families with a male householder and no spouse present (male-householder families). This remained true in 2015, though all three family types experienced poverty rate declines. Married-couple families had a poverty rate of 5.4% (down from 6.2% the previous year), followed by male-householder families at 14.9% (not different statistically from 2014) and female-householder families at 28.2% (down from 30.6%). The poverty rate also fell for individuals not living in families: 21.5% in 2015, down from 23.1%.
Age
When examining poverty by age, three main groups are noteworthy for distinct reasons: under 18, age 18 to 64, and 65 years and older. People under age 18 are typically dependent on other family members for income, particularly young children below their state's legal working age. People age 18 to 64 are generally thought of as the working-age population and typically have wages and salaries as their greatest source of income. People 65 years and older, referred to as the aged population, are often eligible for retirement, and those who do retire typically experience a change in their primary source of income.
Among children, the poverty rate fell to 19.7% in 2015, representing 14.5 million children, down from 21.1% and 15.5 million the previous year. Among the aged population, 8.8% and 4.2 million were poor, down from 10.0% and 4.5 million. Among the working-age population, the poverty rate fell to 12.4%, representing 24.4 million people in 2015, down from 13.5% and 26.5 million the year before. The gains among the working-aged were largely driven by an increase in the number of full-time year-round workers, as discussed in the "Work Status" section below.
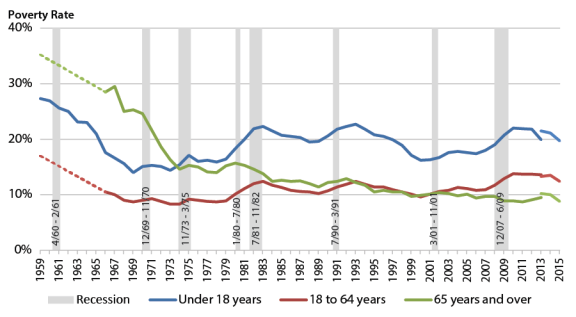
From a historical standpoint, the poverty rate for those 65 and over used to be the highest of the three groups. In 1966, people 65 and over had a poverty rate of 28.5%, compared with 17.6% for those under 18 and 10.5% for working-age adults. By 1974, the rate for people 65 and over had fallen to 14.6%, compared with 15.4% for people under 18 and 8.3% for working-age adults. Since then, people under 18 have had the highest poverty rate of the three age groups, as shown in Figure 2.
|
Figure 2. Poverty Rates by Age: 1959 to 2015 Poverty rates in percentages |
 |
|
Source: Congressional Research Service, using data from U.S. Census Bureau, Current Population Survey, 1960-2016 Annual Social and Economic Supplements, Historical Poverty Table 3, http://www2.census.gov/programs-surveys/cps/tables/time-series/historical-poverty-people/hstpov3.xls, downloaded September 14, 2016. Recession dates obtained from National Bureau of Economic Research, http://www.nber.org/cycles/cyclesmain.html. Notes: Data are not available from 1960 to 1965 for persons age 65 and older, and for persons age 18 to 64. Two estimates are shown for 2013 because the Census Bureau implemented a change to the CPS ASEC income questions. This change was partially implemented with the 2013 data, and fully implemented for the 2014 data. For 2013, some households received the old questionnaire and others the new, so that it would be possible to see the effect of changing the questionnaire, as well as to be able to make consistent comparisons both before and after 2013. |
Work Status
Declines in poverty among the working-aged were driven by gains in the number working full-time year-round. In 2015, the working-age population grew by 1.0 million, but the number of full-time year-round workers (both poor and nonpoor) had a net gain of 2.3 million.
While having a job reduced the likelihood of being in poverty, it did not guarantee that a person or his or her family would avoid poverty. Among the 18-to-64 population living in poverty, 38.7% had jobs in 2015. However, workers were less likely to be in poverty in 2015 than they were the year before: 6.3% of workers were poor in 2015, down from 6.9%. Among full-time year-round workers, 2.4% were poor in 2015, down from 3.0%, and among part-time or part-year workers, 15.5% were poor, not discernably changed from the previous year.
Because poverty is a family-based measure, the change in one member's work status can affect the poverty status of his or her entire family. This is one reason why the poverty rate of non-workers age 18 to 64 also fell in 2015 to 31.8%, down from 33.7%. Among the 18-to-64-year-olds who did not have jobs in 2015, 58.6% lived in families in which someone else did have a job. This share is up from 56.8% in 2014. Among poor 18-to-64-year-olds without jobs, 21.6% lived in families where someone else worked (though this share is not discernably different from 2014).
Race and Hispanic Origin8
Poverty rates vary by race and Hispanic origin. In surveys, Hispanic origin is asked separately from race; accordingly, people identifying as Hispanic may be of any race. Poverty rates fell for non-Hispanic whites (from 10.1% in 2014 to 9.1% in 2015), blacks9 (from 26.2% in 2014 to 24.1% in 2015), and Hispanics (from 23.6% to 21.4% over the same period). The poverty rate for Asians (11.4%) did not change discernably from 2014. 10
Poverty Rates by State11
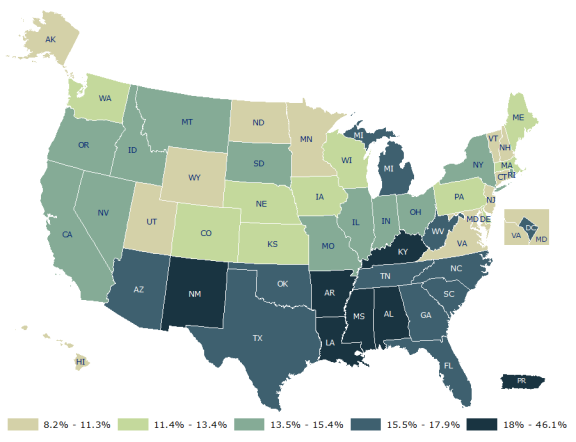
The map in Figure 3 shows a band of states with relatively high poverty rates across parts of the Appalachians and the deep South, as well as in New Mexico and Arizona, with the poverty rate in Mississippi (22.0%) as the highest in the nation. When comparing poverty rates geographically, it is important to remember that the official poverty thresholds are not adjusted for geographic variations in the cost of living—the same thresholds are used nationwide. An area with a lower cost of living accompanied by lower wages will appear to have a higher poverty rate than an area with a higher cost of living and higher wages, even if individuals' purchasing power were exactly the same in both areas. That said, the poverty rate in New Hampshire (8.2%) was lowest, followed by Maryland (9.7%).
Twenty-three states experienced poverty rate declines from 2014 to 2015: seven in the Midwest (Illinois, Indiana, Michigan, Minnesota, Missouri, Ohio, and Wisconsin); four in the Northeast (New Hampshire, New York, Pennsylvania, and Vermont); eight in the South (Alabama, Florida, Georgia, North Carolina, South Carolina, Tennessee, Texas, and Virginia); and four in the West (Arizona, California, Oregon, and Washington). That these declines are prevalent in all four regions of the country, including the most populous states from each region, underscores that the decline in U.S. poverty was broad-based and not a strictly regional phenomenon.
|
Figure 3. Percentage of People in Poverty in the Past 12 Months, by State and for the District of Columbia and Puerto Rico: 2015 |
 |
|
Source: Congressional Research Service, based on poverty data from U.S. Census Bureau, American Community Survey, 2015 1-year estimates. Table S1701, http://factfinder.census.gov/bkmk/table/1.0/en/ACS/15_1YR/S1701/0100000US.04000. |
Supplemental Poverty Measure (SPM)
Criticisms of the official measure have inspired poverty measurement research and eventually led to the development of the SPM. Described below are the considerations that went into each measure, followed by a comparison of poverty rates under each measure.
How the Official Poverty Measure was Developed
The poverty thresholds were originally developed in the early 1960s by Mollie Orshansky of the Social Security Administration. Rather than attempt to compute a family budget by using prices for all essential items low-income families need to live, this early research focused on food costs.12 Unlike other goods and services such as housing or transportation, which did not have a generally agreed-upon level of adequacy nor a dollar amount needed to secure that level, minimum standards for nutrition were known and widely accepted. According to a 1955 USDA food consumption survey, the average amount of their income families spent on food was roughly one- third. Therefore, using the cost of a minimum food budget and multiplying that figure by three yielded a figure for total family income. That computation was possible because USDA already had published recommended food budgets as a way to address the nutritional needs of families experiencing economic stress. Some additional adjustments were made to derive poverty thresholds for two-person families and individuals not living in families to reflect the relatively higher fixed costs of smaller households.
Motivation for a Supplemental Measure
While the official poverty measure has been used for over 50 years as the source of official statistics on poverty in the United States, it has received criticism over the years for several reasons. First, it fails to take into account benefits from most of the largest programs that aid the low-income population. It uses money income before taxes—meaning that it does not necessarily measure the income available for individuals to spend, which for most people is after-tax income. Any effects of tax credits designed to assist persons with low income are not captured by the official measure. The focus on money income also does not take account of in-kind benefit programs designed to help the poor, such as SNAP (formerly known as food stamps) or housing assistance.
Aside from its inability to capture the effects of taxes and noncash benefits, the official measure has also been criticized for the way it characterizes families' and individuals' needs in the poverty thresholds. And, as mentioned earlier, the official thresholds do not take account of geographic variations in the cost of living.
In 1995, a panel from the National Academy of Sciences (NAS) issued a report, Measuring Poverty: A New Approach, which recommended improvements to the poverty measure.13 Among the suggested improvements were to have the poverty thresholds reflect the costs of food, clothing, shelter, utilities, and a little bit extra to allow for miscellaneous needs; to include geographic adjustments as part of the measure's computation; to include the out-of-pocket costs of medical expenses in the measure's computation; and also to subtract work-related expenses from income. An overarching goal of the recommendations was to make the poverty measure more closely aligned with the real-life needs and available resources of the low-income population, and the changes that have taken place over time in their circumstances, owing to changes in the nation's economy, society, and public policies.
After over a decade and a half of research to implement and refine the methodology suggested by the NAS panel, conducted both from within the Census Bureau as well as from other federal agencies and the academic community, the first report using the Supplemental Poverty Measure (SPM) was issued by the Census Bureau in November 2011.14
Findings for 2015
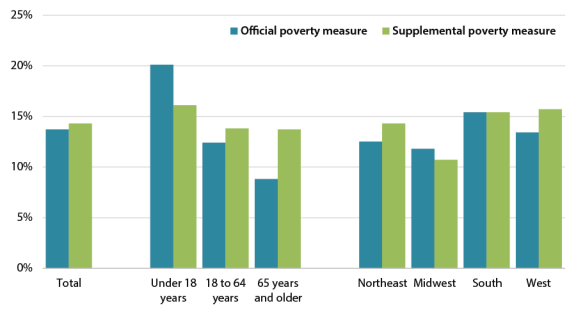
Under the SPM, the profile of the poverty population is slightly different than under the official measure. After rounding, the SPM was about 0.7 percentage points higher in 2015 than the official poverty rate (14.3% compared with 13.7%, a figure that includes foster children under age 15 that are not normally included in the official measure. See Figure 4). More people age 18 to 64 are in poverty under the SPM (13.8% compared with 12.4% under the 2015 official measure), as are people age 65 and over (13.7%, compared with 8.8% under the official measure). The poverty rate for people under age 18 was lower under the SPM (16.1% in 2015) than under the official measure (20.1%, with foster children included). Again, the SPM uses a different definition of resources than the official measure: the SPM includes in-kind benefits which generally help families with children; subtracts out work-related expenses which are often incurred by the working-age population; and subtracts medical out-of-pocket expenses, which are incurred frequently by people age 65 and older, from income.
|
Figure 4. Poverty Rates Under Official Measure and Supplemental Poverty Measure, for the U.S. Total Population, by Age, and by Region: 2015 Poverty rates in percentages |
 |
|
Source: Congressional Research Service, based on data from Trudi Renwick and Liana Fox, The Supplemental Poverty Measure: 2015, U.S. Census Bureau, Current Population Reports, P60-258, September 2016, http://www.census.gov/content/dam/Census/library/publications/2016/demo/p60-258.pdf. Notes: Figures include unrelated individuals under age 15, such as foster children, not usually included in official poverty estimates. |
Because the SPM thresholds are geographically adjusted, poverty rates in 2015 were lower under the SPM than under the official measure for the Midwest (10.7% compared with 11.8%), while they were higher than the official measure for the Northeast (14.3% compared with 12.5%) and the West (15.7% compared with 13.4%). Both measures yielded the same poverty rate for the South (15.4%).15
Author Contact Information
Footnotes
| 1. |
Bernadette D. Proctor, Jessica L. Semega, and Melissa A. Kollar, Income and Poverty in the United States: 2015, U.S. Census Bureau, Current Population Reports, P60-256, September 2016, Appendix B. The characterization of the poverty measure as a statistical yardstick goes back decades; for example, "U.S. Changes Yardstick on Who Is Poor," Chicago Tribune, May 3, 1965, section 1B p. 4. |
| 2. |
The poverty measure was established as official in the Office of Management and Budget's Statistical Policy Directive 14, reproduced on the Census Bureau's website at http://www.census.gov/hhes/povmeas/methodology/ombdir14.html. It states that the official measure is to be used for statistical purposes, but should not be construed as required for administrative purposes. An example of an administrative use is as an eligibility criterion for assistance programs. A different measure, called the poverty guidelines, is published by the Department of Health and Human Services (HHS). Though the poverty guidelines use the official thresholds as part of their computation, the HHS poverty guidelines are a distinct measure and are often used in federal assistance programs. The HHS poverty guidelines are often referred to as the "federal poverty level" or FPL. |
| 3. |
To provide a general sense of the "poverty line," the Census Bureau computes weighted averages of the thresholds within each size of family. For example, a family of three may consist of any of the following combinations: three adults; two adults and one child; or one adult and two children; each of which has its own distinct threshold. The average of all three thresholds was given above, with an adjustment to reflect that some types of three-person families are more common than others. The averages are a convenience for the reader, but are not actually used to compute poverty status for statistical reports. In actual computations, 48 thresholds are used in the official measure. |
| 4. |
Unlike the poverty thresholds that are used to compute official poverty statistics, the HHS poverty guidelines used for administrative purposes do include separate amounts for Alaska and Hawaii. |
| 5. |
Not every apparent difference in point estimates is a real difference. The official poverty measure uses information from the Current Population Survey Annual Social and Economic Supplement (CPS ASEC), which surveys about 95,000 addresses nationwide. All poverty data discussed here are therefore estimates, which have margins of error. Selecting a different sample would likely yield slightly different estimates of the poverty population or the poverty rate. Thus, even if the true poverty rate were exactly the same in two different years, it is possible to get survey estimates that appear different. In order to report that a change has occurred in the poverty rate, that is, that the difference between the estimates probably is not merely caused by sampling variability, the difference has to be large enough that fewer than 10% of all possible survey samples would produce a difference that large. Such a difference is said to be statistically significant. Point estimates whose differences are not statistically significant are described in this report as "no discernable change," "no measurable change," or "not distinguishable from ... " etc. |
| 6. |
The poverty rates in 1973 and 2000, the lowest point estimates on record, are not distinguishable from each other in a statistical sense. Their difference is not statistically significant and the estimates are considered to be "tied" for lowest poverty rate. |
| 7. |
These poverty rates may not necessarily be distinguishable from the poverty rates in their adjacent years. See footnote 5 for an explanation of statistical significance. |
| 8. |
Since 2002, federal surveys ask respondents to identify with one or more races; previously they could choose only one. The groups in this section represent those who identified with one race alone. Another approach is to include those who selected each race group either alone or in combination with one or more other races; those data are also available on the Census Bureau's website at http://www.census.gov/library/publications/2016/demo/p60-256.html where they are published in historical tables in the report Income and Poverty in the United States: 2015 and in accompanying Excel data tables. |
| 9. |
Includes blacks of Hispanic origin. |
| 10. |
Includes Asians of Hispanic origin. Poverty rates for the American Indian and Alaska Native population, the Native Hawaiian and Other Pacific Islander population, and the population reporting two or more races, had wide margins of error. Their margins of error were all greater than 1.8 percentage points above and below their respective estimates (in one instance ± 4 percentage points). Therefore, the CPS ASEC's sample size was not large enough to provide precise estimates for these three smallest race categories. |
| 11. |
These state estimates are based on the American Community Survey (ACS) instead of the CPS ASEC, because the Census Bureau recommends that survey when comparing states and smaller geographic areas. Since the CPS ASEC surveys 98,000 addresses nationwide, it is sometimes difficult to obtain reliable estimates for small populations or small geographic areas—the sample may not have selected enough people from that group or area to provide a meaningful estimate. The ACS samples about 3.5 million addresses per year, much larger than the 98,000 sampled in the CPS ASEC, and therefore affords greater statistical precision. Unlike the CPS ASEC, however, which uses trained interviewers and detailed income questions, the ACS is designed to be filled out by the respondent on his or her own. Furthermore, the ACS is conducted continuously, and asks the respondents about their income in the previous 12 months, not necessarily the previous calendar year asked about in the CPS ASEC. For those reasons, poverty estimates from the ACS are often different from CPS ASEC estimates: the ACS reported a poverty rate of 14.7% for the United States in 2015, compared with 13.5% in the CPS ASEC. Poverty estimates from neither the ACS nor the CPS ASEC include Puerto Rico in the U.S. total. Puerto Rico's poverty rate was 46.1% in 2015. |
| 12. |
While Orshansky's research did not attempt to compute a complete basket of goods and services, the focus on food costs was already more detailed than the dollar amount used in the 1964 Economic Report of the President, issued by the Council of Economic Advisers (chapter 2, "The Problem of Poverty in America"). In that chapter, a flat figure of $3000 was used for all families and $1500 for unrelated individuals. See also Economic Report of the President (1964) https://fraser.stlouisfed.org/title/?id=45#!8135. For a thorough history of the official poverty measure, see Gordon Fisher, "The Development of the Orshansky Thresholds and Their Subsequent History as the Official U.S. Poverty Measure," 1992, rev. 1997, reproduced on the Census Bureau's website at http://www.census.gov/hhes/povmeas/publications/orshansky.html. |
| 13. |
Constance F. Citro and Robert T. Michael, eds., Measuring Poverty: A New Approach. Panel on Poverty and Family Assistance: Concepts, Information Needs, and Measurement Methods. Committee on National Statistics, National Research Council. National Academies Press, Washington DC, 1995. Available at http://www.nap.edu/read/4759/chapter/1. |
| 14. |
It should be noted that the effort to consolidate the previous research and create the SPM was done under the auspices of an Interagency Technical Working Group led by the Office of Management and Budget, and received public commentary via a Federal Register notice (Federal Register, vol. 75 no. 101, Wednesday, May 26, 2010, pp. 29513-29514). The notice, as well as comments and responses thereto, have been reproduced on the Census Bureau's website at http://www.census.gov/hhes/www/poverty/methods/spm_fedregister.html. |
| 15. |
The Census regions are as follows: |