Bank Exposure to COVID-19 Risks: Mortgages and Consumer Loans
The COVID-19 (coronavirus) pandemic has caused financial hardship across the country. If COVID-19 causes borrowers to miss payments, it could have negative consequences for banks. This Insight examines the exposure banks have to household repayments, such as mortgages, credit cards, auto loans, and other consumer debt.
The main business of a bank is to make loans and buy securities using funding it raises by taking deposits. A bank earns money largely through borrowers making payment on those loans and securities issuers making payment on securities, along with charging fees for certain services. In addition to accepting deposits, a bank also raises funding by issuing debt (such as bonds) and capital (such as stock). Unlike deposits and debt that place specific payment obligations on a bank, payments on capital can generally be reduced, delayed, or cancelled and the value of capital can be written down. Thus, if incoming payments unexpectedly stop, capital allows a bank to withstand losses to a point. However, if a bank exhausts its capital reserves, it could face financial distress and potentially fail.
Mortgages and Consumer Loans
A significant portion of a typical bank's assets consists of loans to households, which households use to purchase houses, cars, and other consumer goods. Some loans are secured by a home, such as mortgages and home equity lines of credit (hereinafter home loans). Other types are used to make consumer purchases and can be secured, such as auto loans, or unsecured, such as credit cards (hereinafter consumer loans). Home loans and consumer loans can be pooled into groups (securitized) and sold to investors or other banks. Many banks own a significant amount of mortgage-backed securities (MBS) that are backed by the federal government through government-sponsored enterprises, such as Fannie Mae or Freddie Mac. Arguably, banks are also exposed to losses on these securities. However, due to the government backing, these securities are not be covered in this Insight. For more information on government-backed mortgages, see CRS Insight IN11316, COVID-19: Support for Mortgage Lenders and Servicers, by Andrew P. Scott and Darryl E. Getter.
Noncurrent Rates
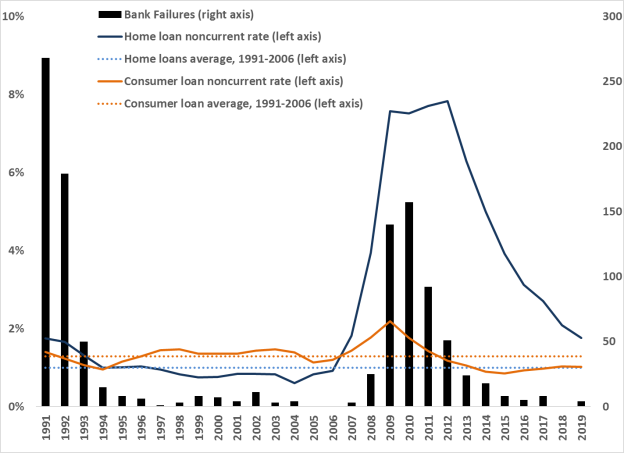
When households stop making payments on their loans, it can cause banks to become distressed and potentially fail. For example, during and after the 2007-2009 financial crisis, the noncurrent rates (the percentage of loans for which payment is at least 30 days past due) on household loans greatly increased, see Figure 1:
- Home loan noncurrent rates increased from 0.9% in 2006 to 7.8% in 2012. The noncurrent rate at the end of 2019 was 1.8%.
- Consumer loan noncurrent rates increased from 1.0% in 2006 to 2.2% in 2009. The noncurrent rate at the end of 2019 was 1.0%.
Subsequent to the dramatic rise in noncurrent rates, bank failures rose from zero in 2006 to a peak of 157 in 2010. Between 2008 and 2014, there were 507 bank failures.
|
Figure 1. Household Debt Noncurrent Rates and Bank Failures, 1991-2019 |
 |
|
Source: FDIC Quarterly Banking Profile: Fourth Quarter 2019 and FDIC Bank Failures In Brief. Note: All rate and failure numbers are year-end. |
Banks failed for numerous reasons and defaults on household debt were not solely responsible for the post-crisis failures. For example, the high number of failures in the early 1990s were largely the result of the savings and loan crisis, which occurred for a number of reasons, including high and volatile interest rates and adverse regional economic conditions in the 1980s. Nevertheless, the correlation is illustrative of the stress placed on banks by missed household payments.
Exposure Statistics
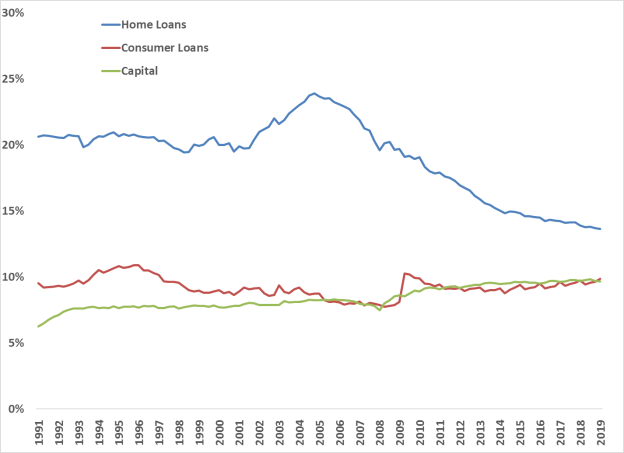
The U.S. banks hold about $18.6 trillion in assets, with more than $2.5 trillion in home loans and more than $1.8 trillion in consumer loans, equaling 13.6% and 9.9% of total assets, respectively (see Figure 2). Meanwhile, banks held more than $1.7 trillion in Tier 1 capital, an important regulatory capital measure, giving a Tier 1-to-total asset ratio of 9.3%. This level of capitalization indicates that banks are well above regulatory minimum requirements. (This ratio is not precisely the same as the Tier 1 leverage ratio, one of the official regulatory ratios banks must report to regulators, because banks are allowed to make certain accounting adjustments. In general, the difference between the two numbers are relatively small).
Compared to recent history, these represent a relatively low exposure to home loans and a typical exposure to consumer loans, but a relatively high capitalization level. These conditions suggest the banking industry is comparatively well positioned to withstand losses on household debt.
|
Figure 2. Home Loans, Consumer Loans, and Tier 1 Capital as % of Total Assets |
 |
|
Source: FDIC Quarterly Banking Profile: Fourth Quarter 2019. |
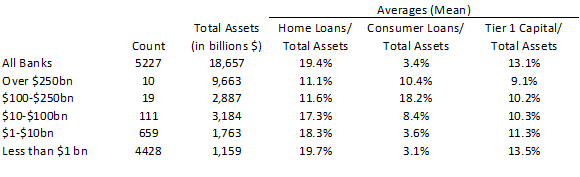
Although it is informative to examine the industry as a whole, the numbers are skewed to a small number of extremely large banks. Figure 3 groups banks based on asset size. In general, smaller banks are more exposed to home loans than large banks, but less exposed to consumer loans, and smaller banks are better capitalized. As of December 31, 2019, the combined home and consumer exposure result in an exposure to household debt that is generally similar across size groups, roughly 20% to 25%.
 |
|
Source: CRS calculations based on Federal Financial Institution Examination Council bank call report data for December 31, 2019. |
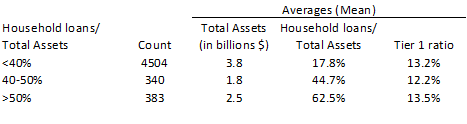
Banks differ across business models as well. Whereas some choose not to concentrate in any one asset type, other banks choose to specialize to serve a particular market or credit need. For example, whereas a typical bank might have 20% to 25% of assets as household debt, another may have twice that exposure or more. As Figure 4 shows, 340 banks have concentrations of between 40% and 50% and 383 banks have over 50%. These banks are on average smaller banks. The 40% to 50% group holds less capital than average, although they still have a high ratio compared to large banks displayed in Figure 3. The over 50% group holds a high level of capital, but some have exposures well above the 50% threshold, as evidenced by the average concentration of 62.5%. If the household debt noncurrent rate rises sharply, these could be the first banks to become distressed.
|
Figure 4. Assets, Household Exposures, and Capital, Grouped by Concentration |
 |
|
Source: CRS calculations based on Federal Financial Institution Examination Council bank call report data for December 31, 2019. |